
Detection of Tagosodes orizicolus in Aerial Images of Rice Crops Using Machine Learning


Abstract
1. Introduction
2. Materials and Methods
2.1. Study Area
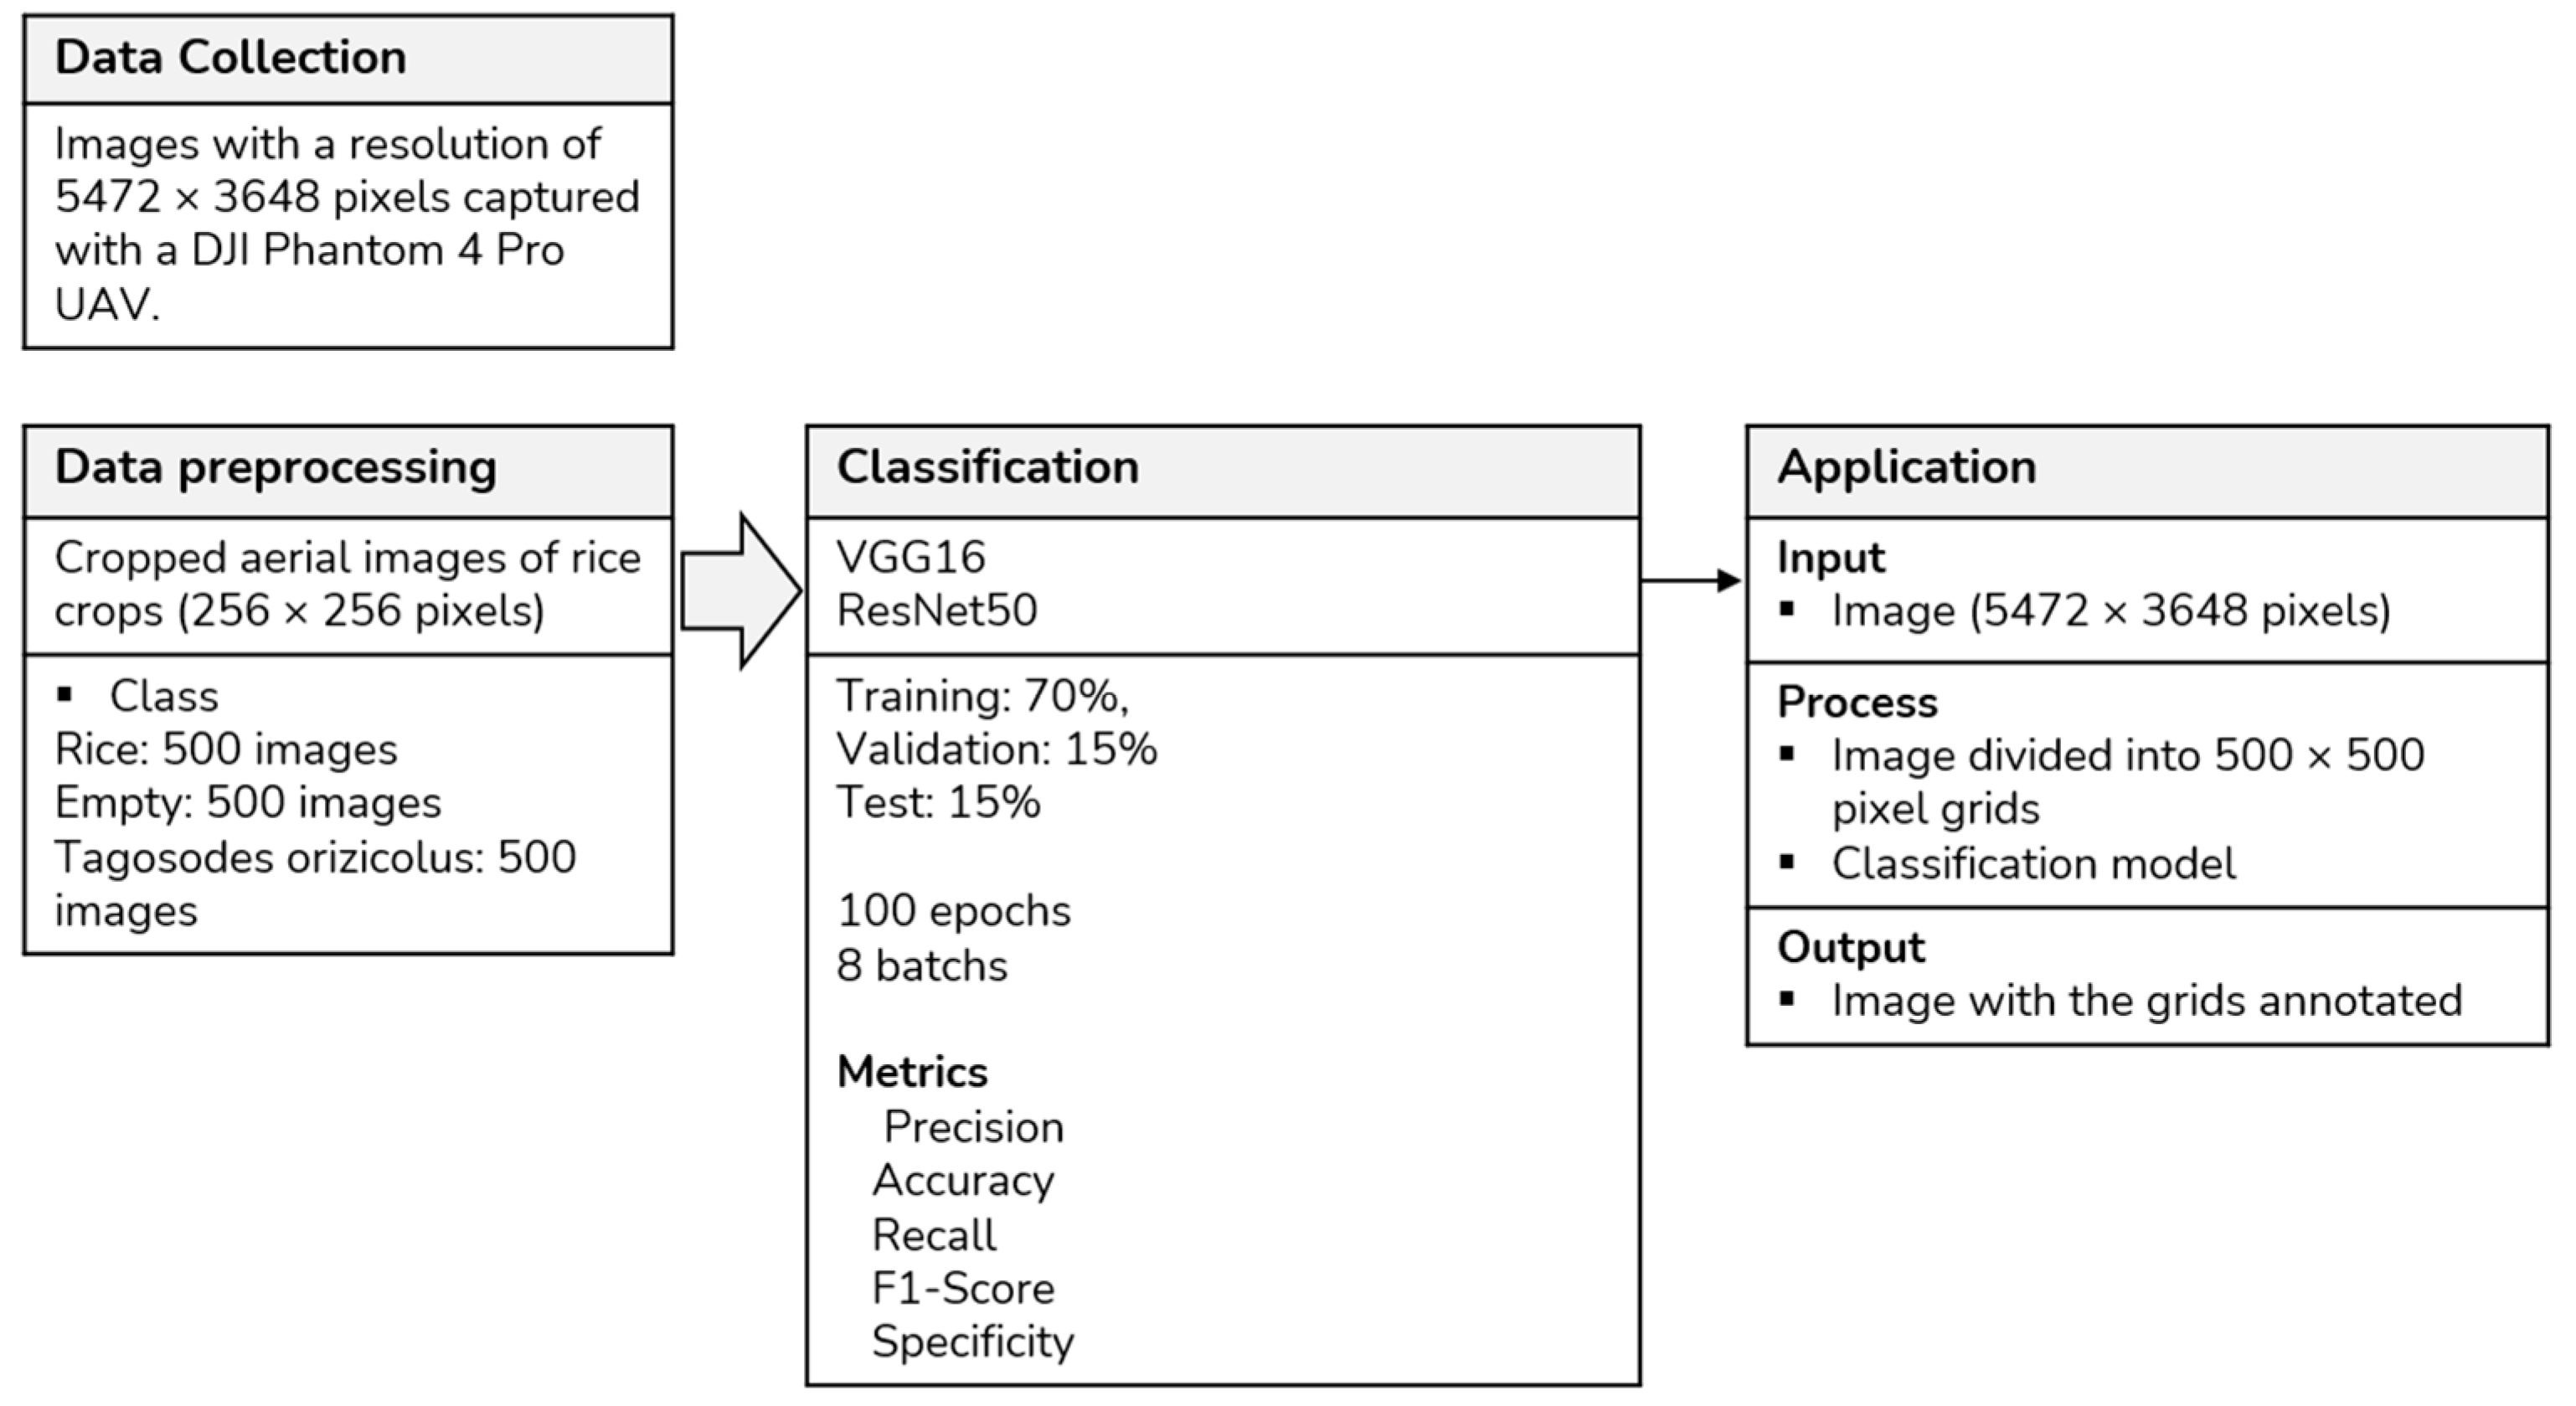
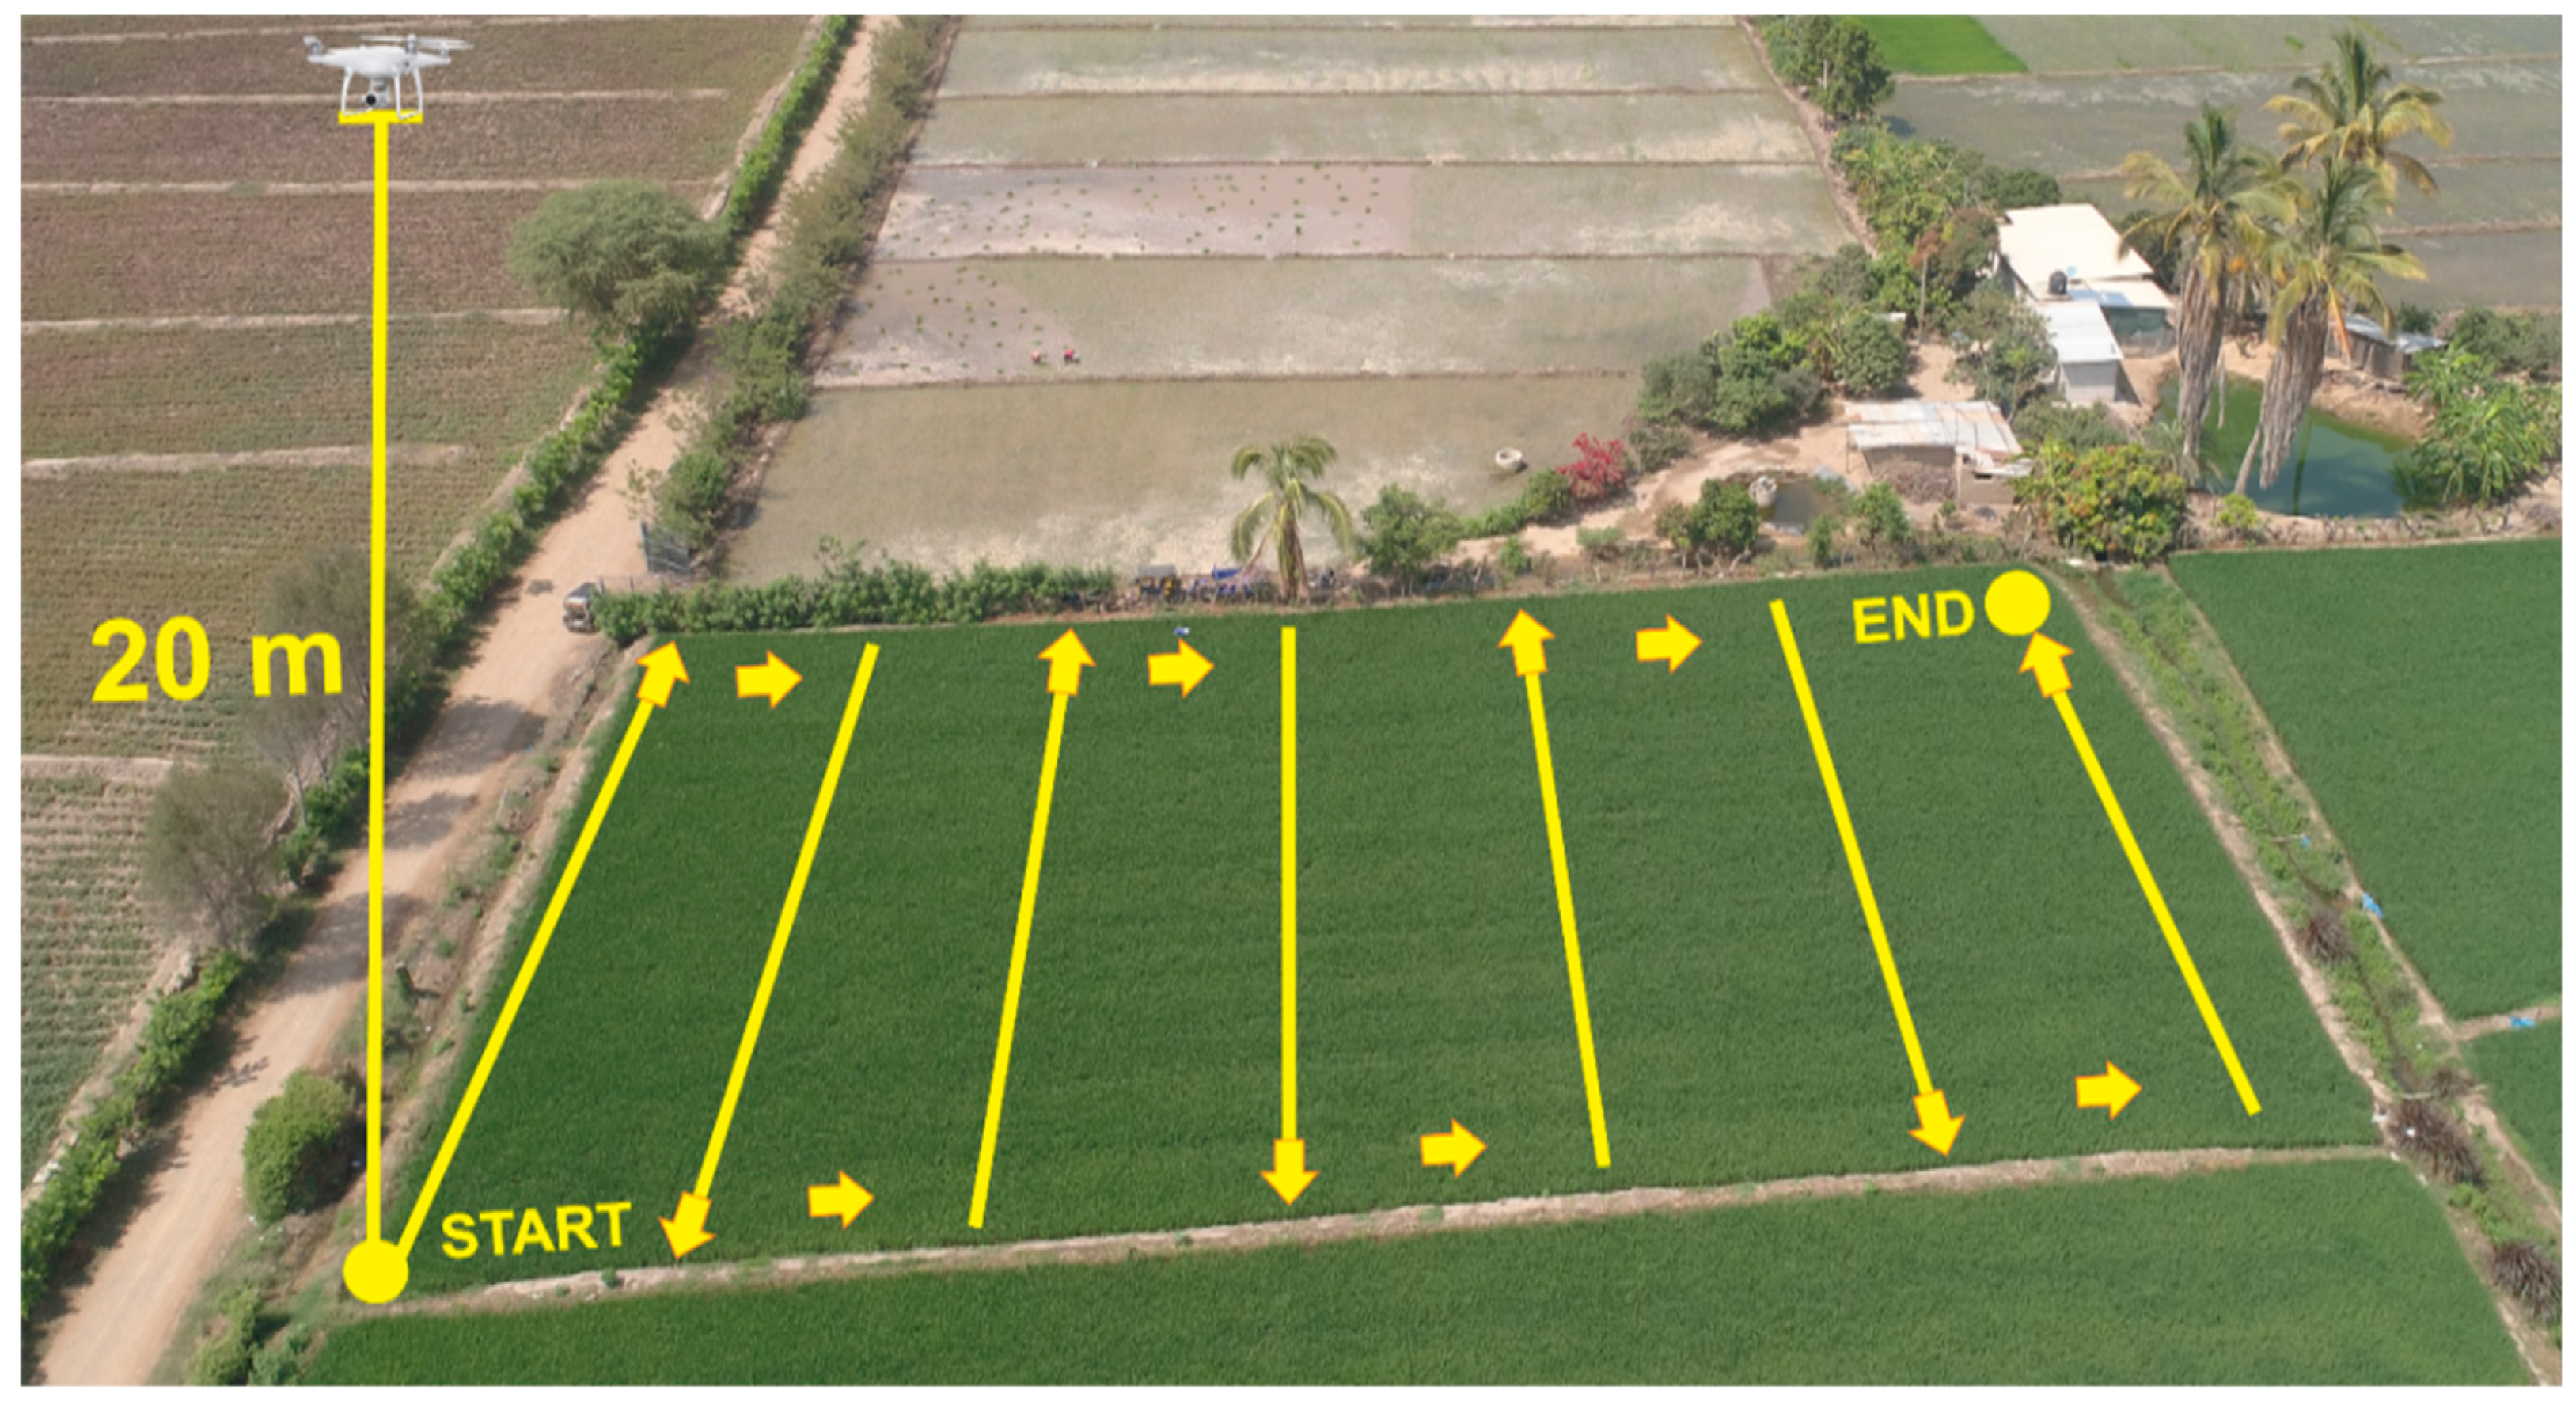
2.2. Data Collection
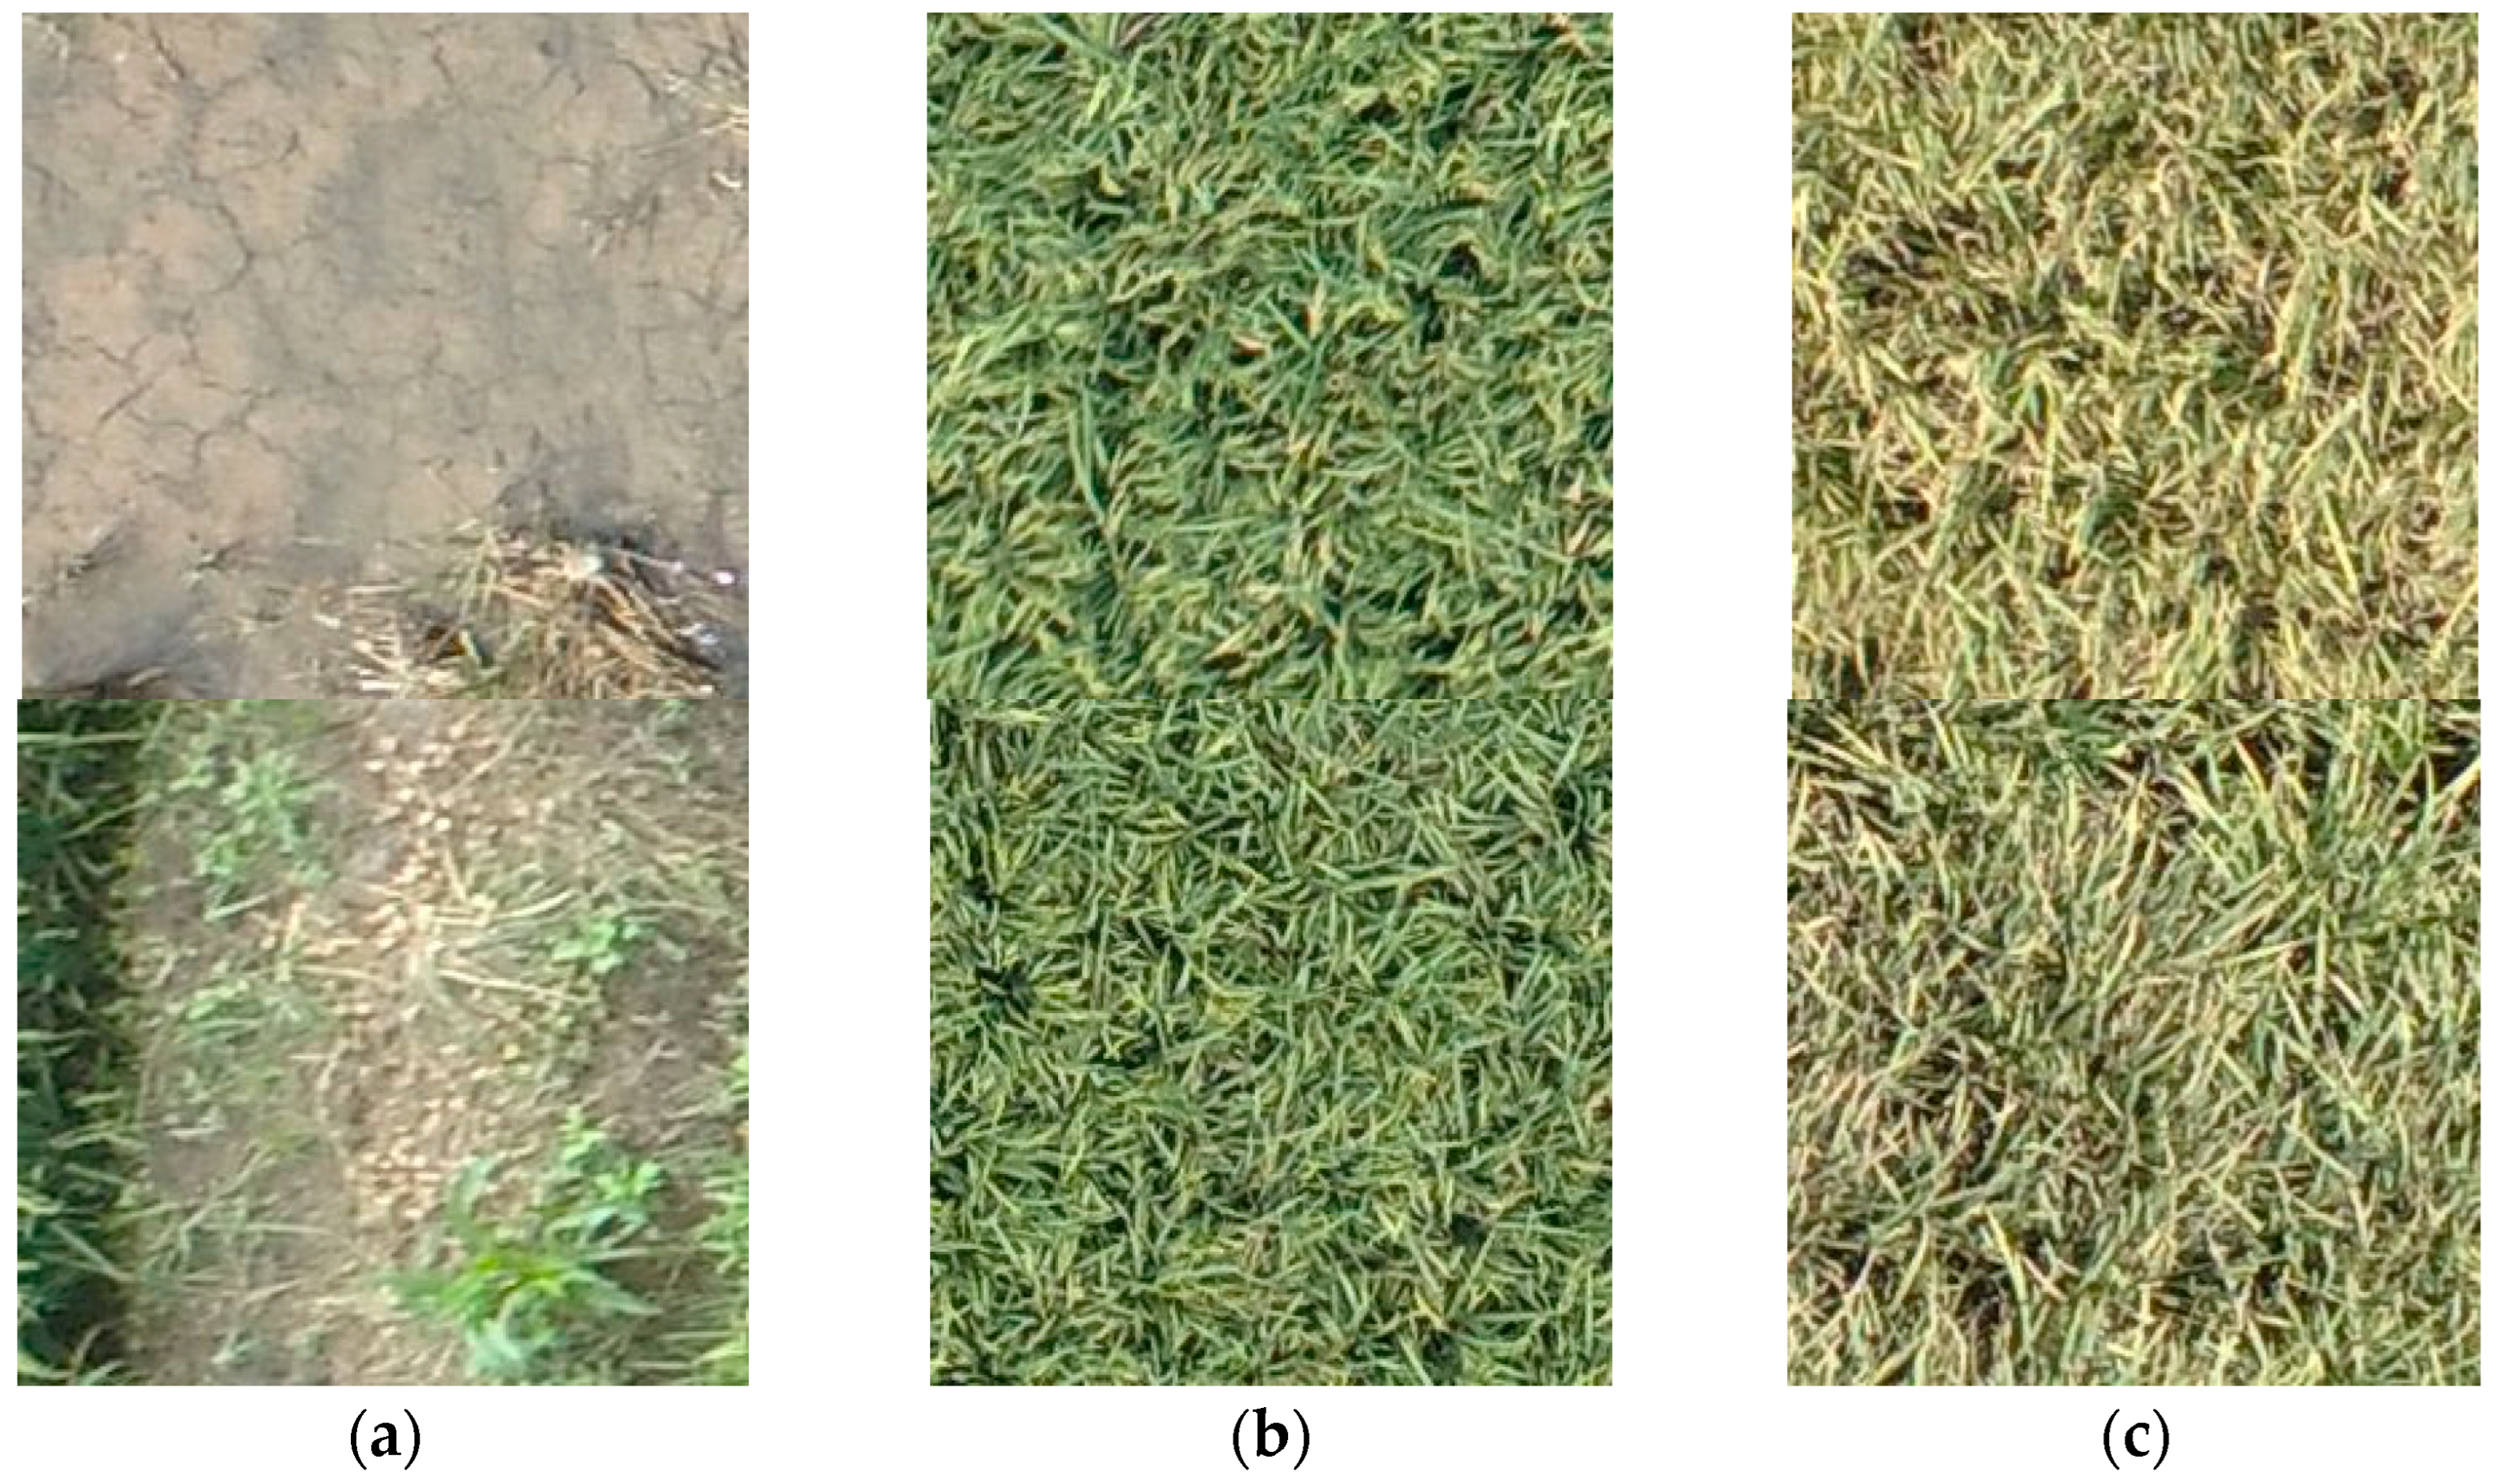
2.3. Data Preprocessing
2.4. Classification
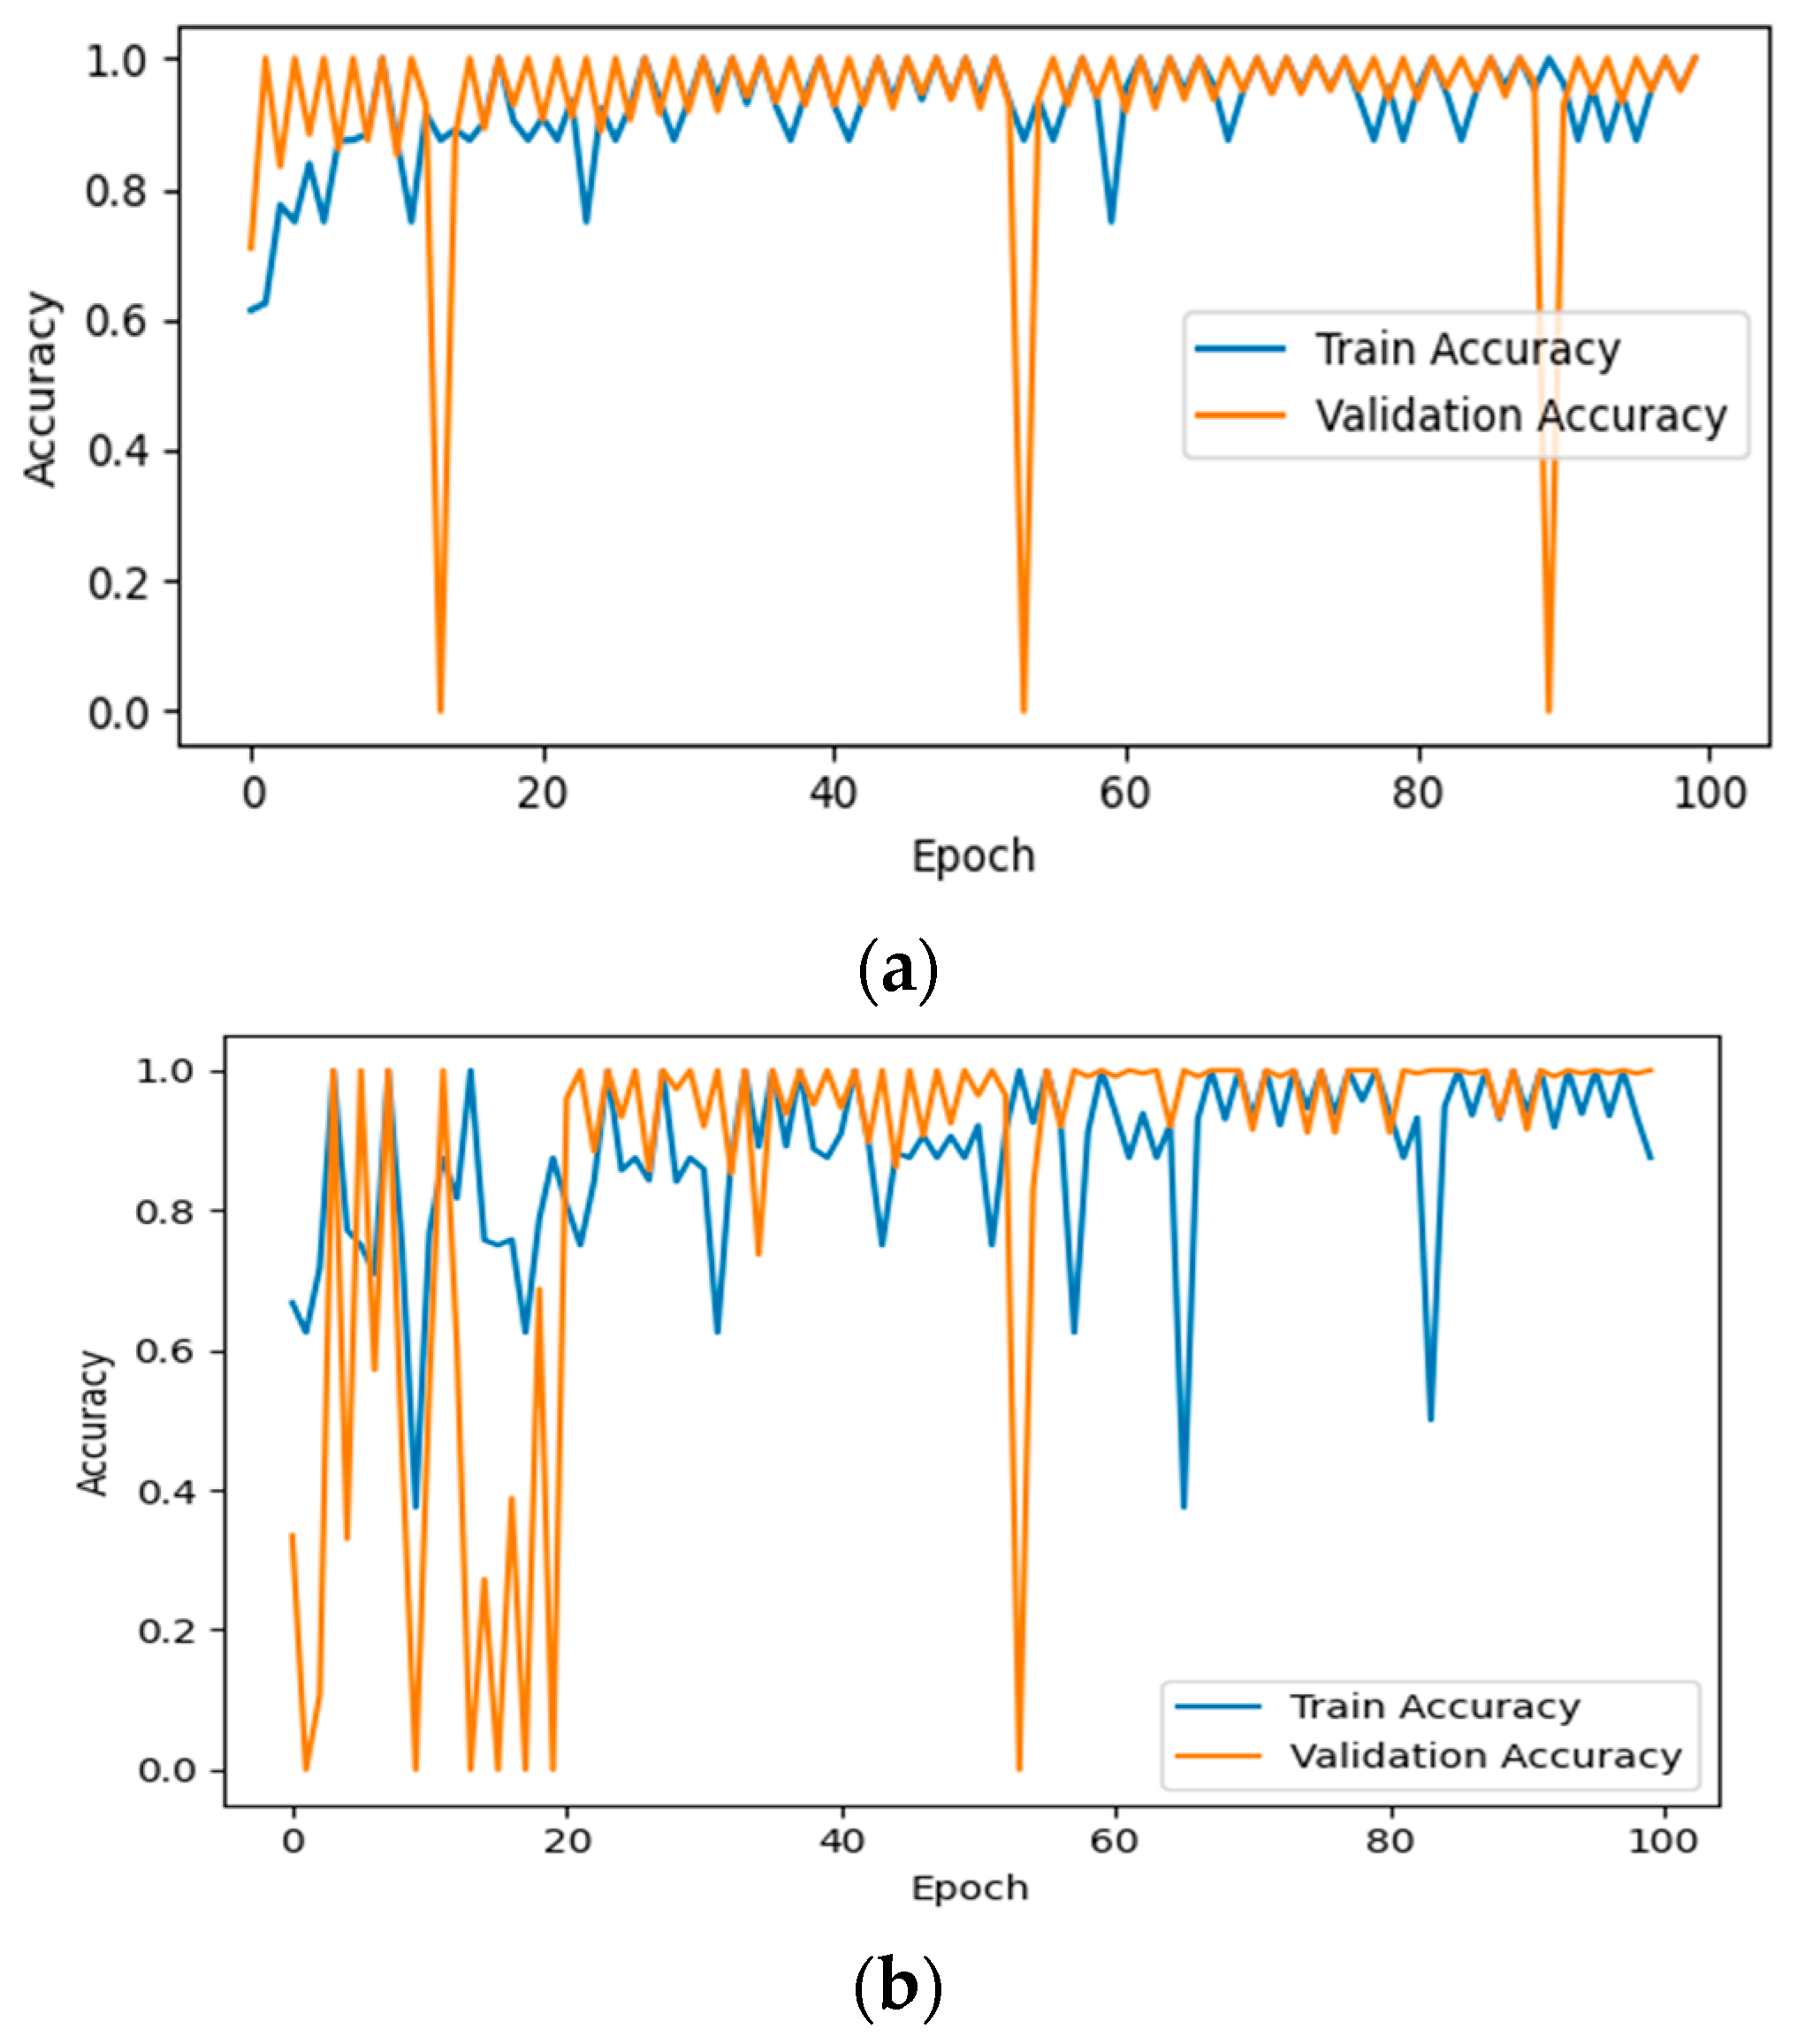
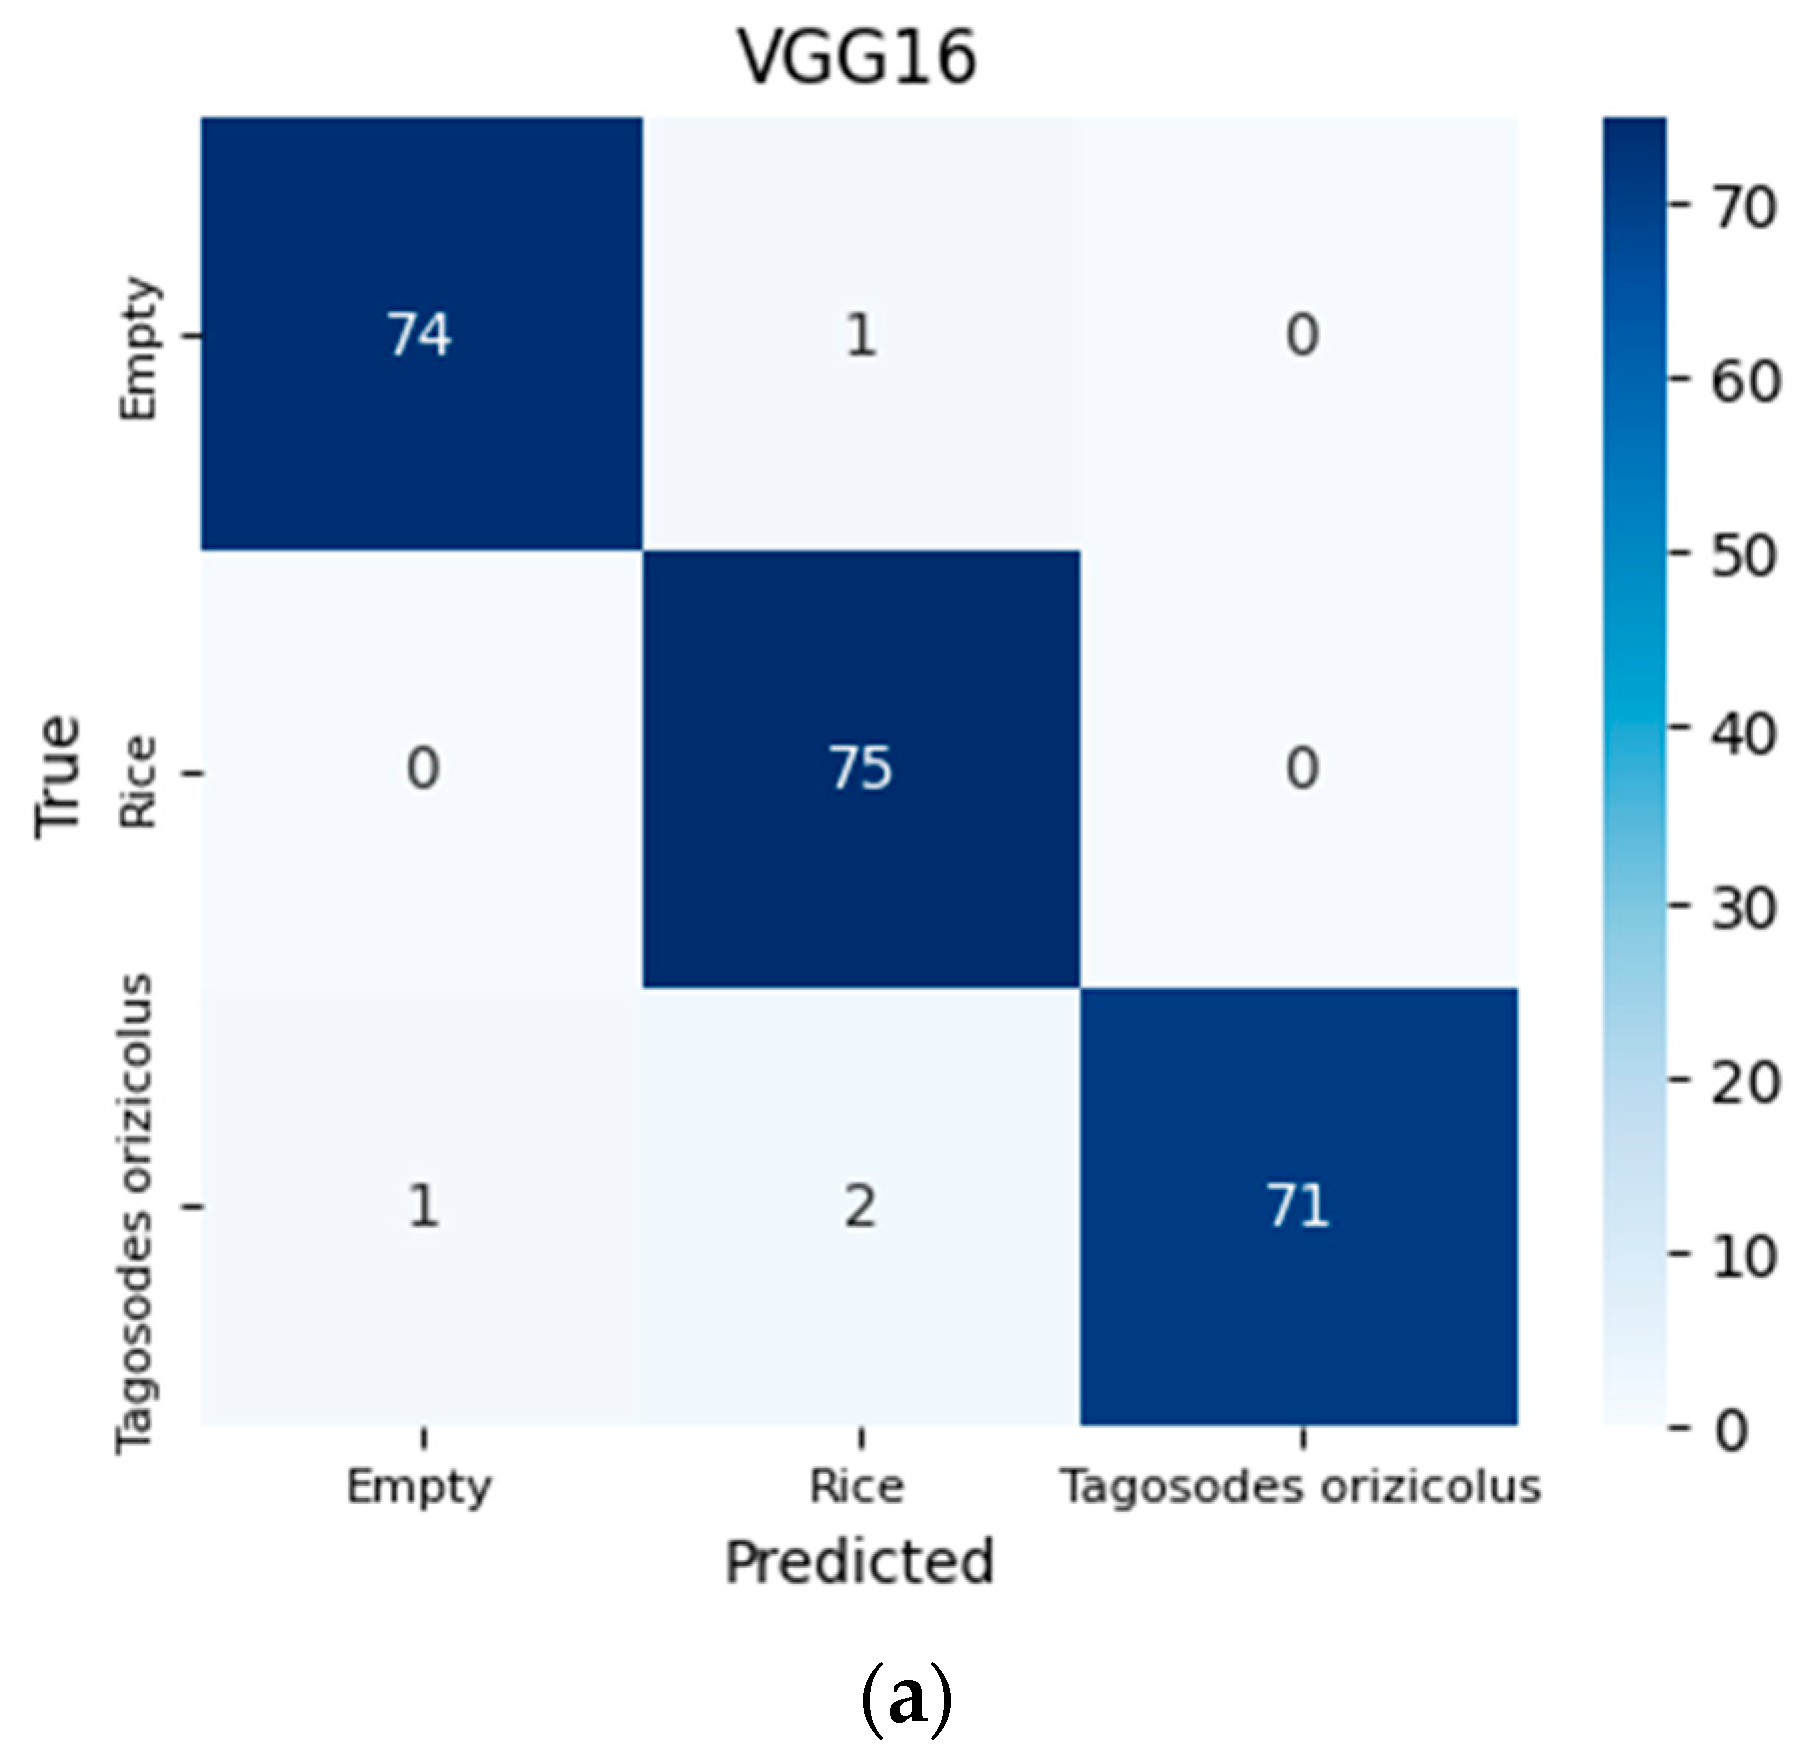
2.4.1. VGG16
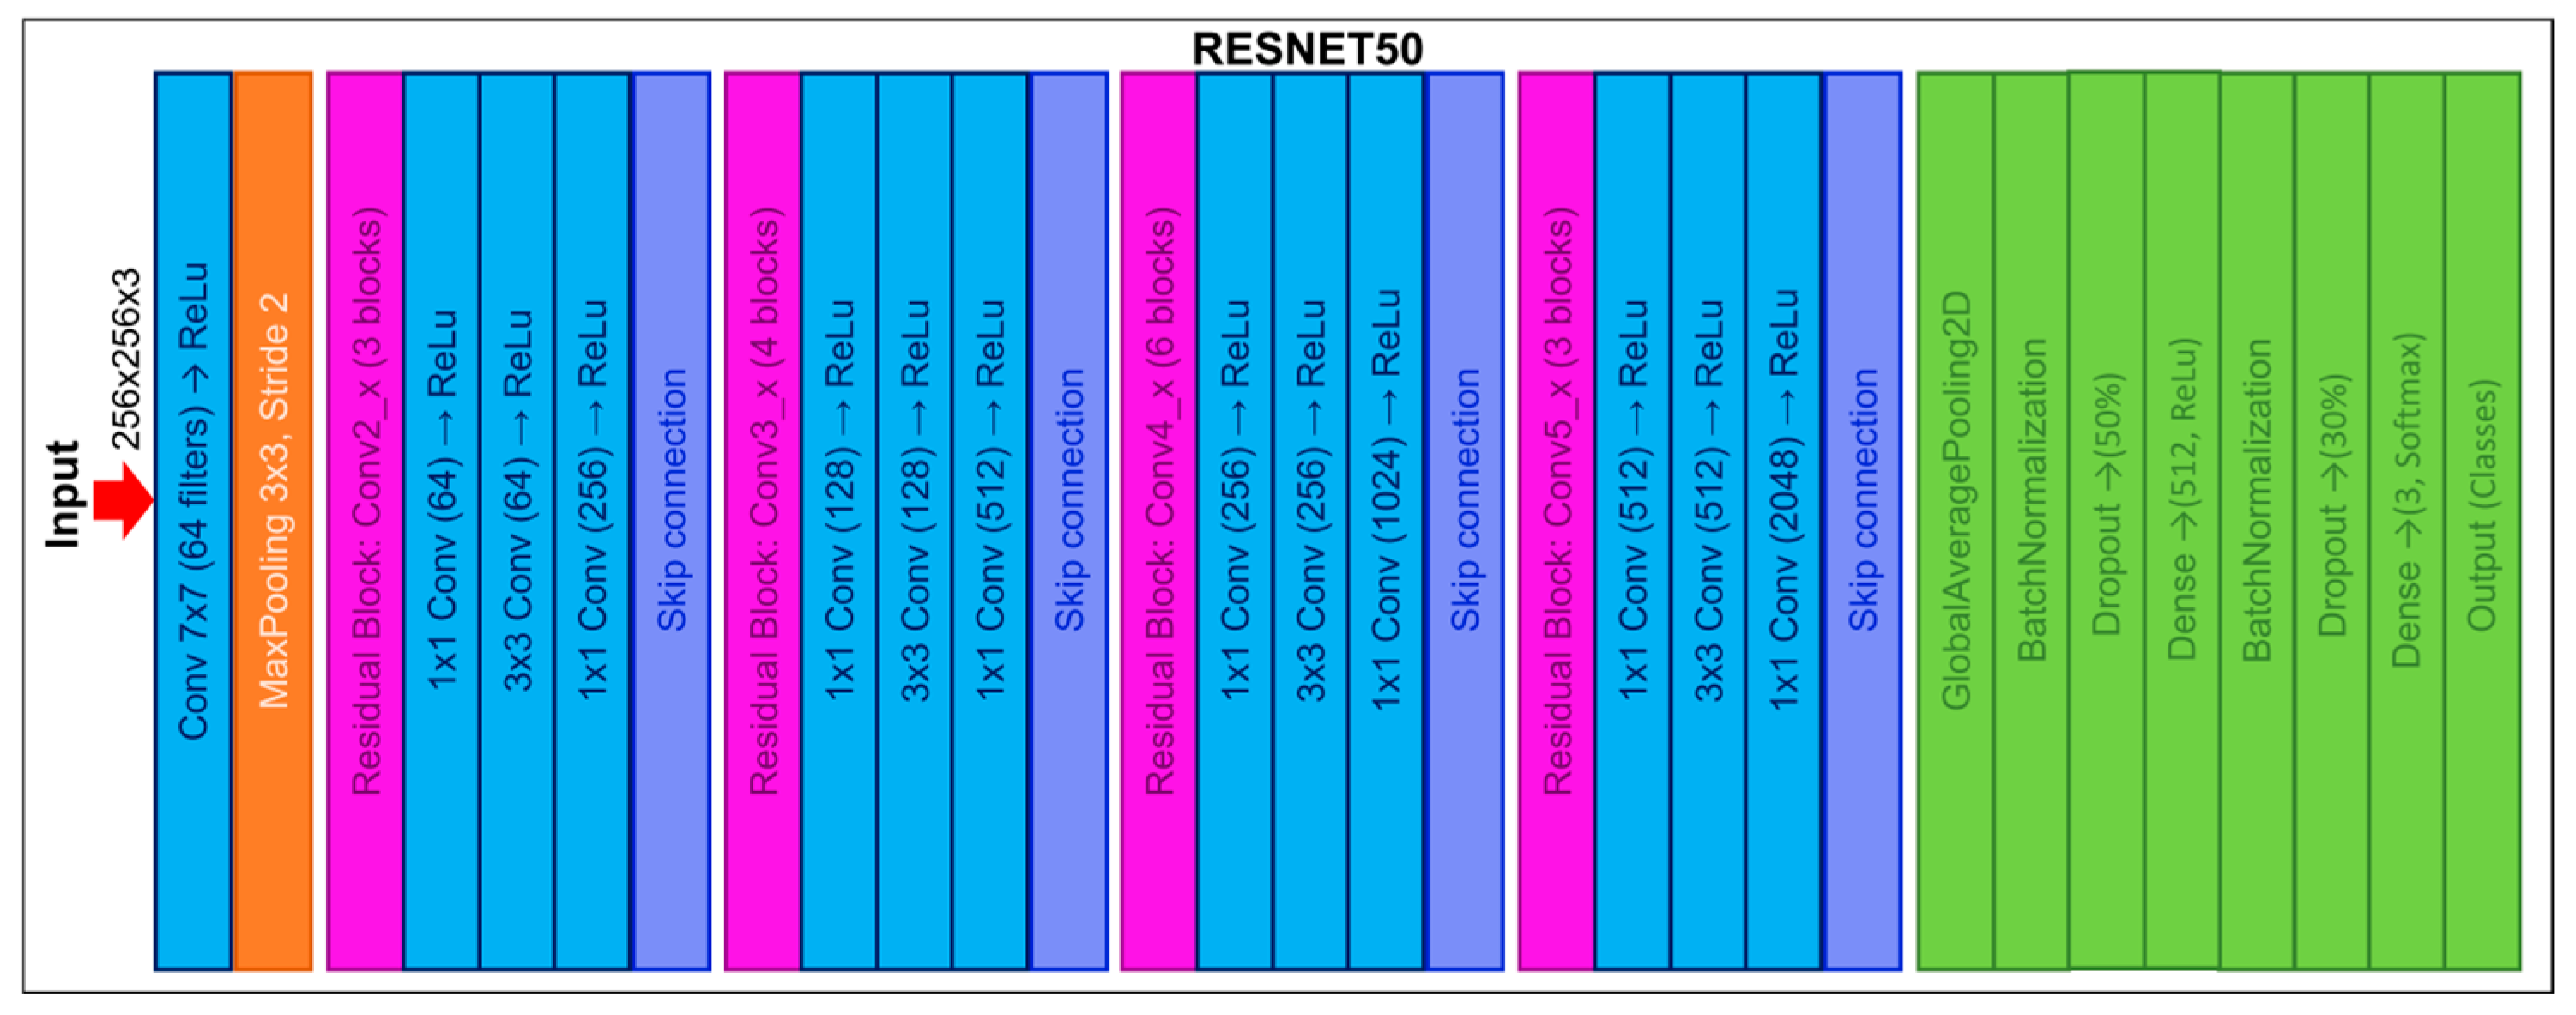
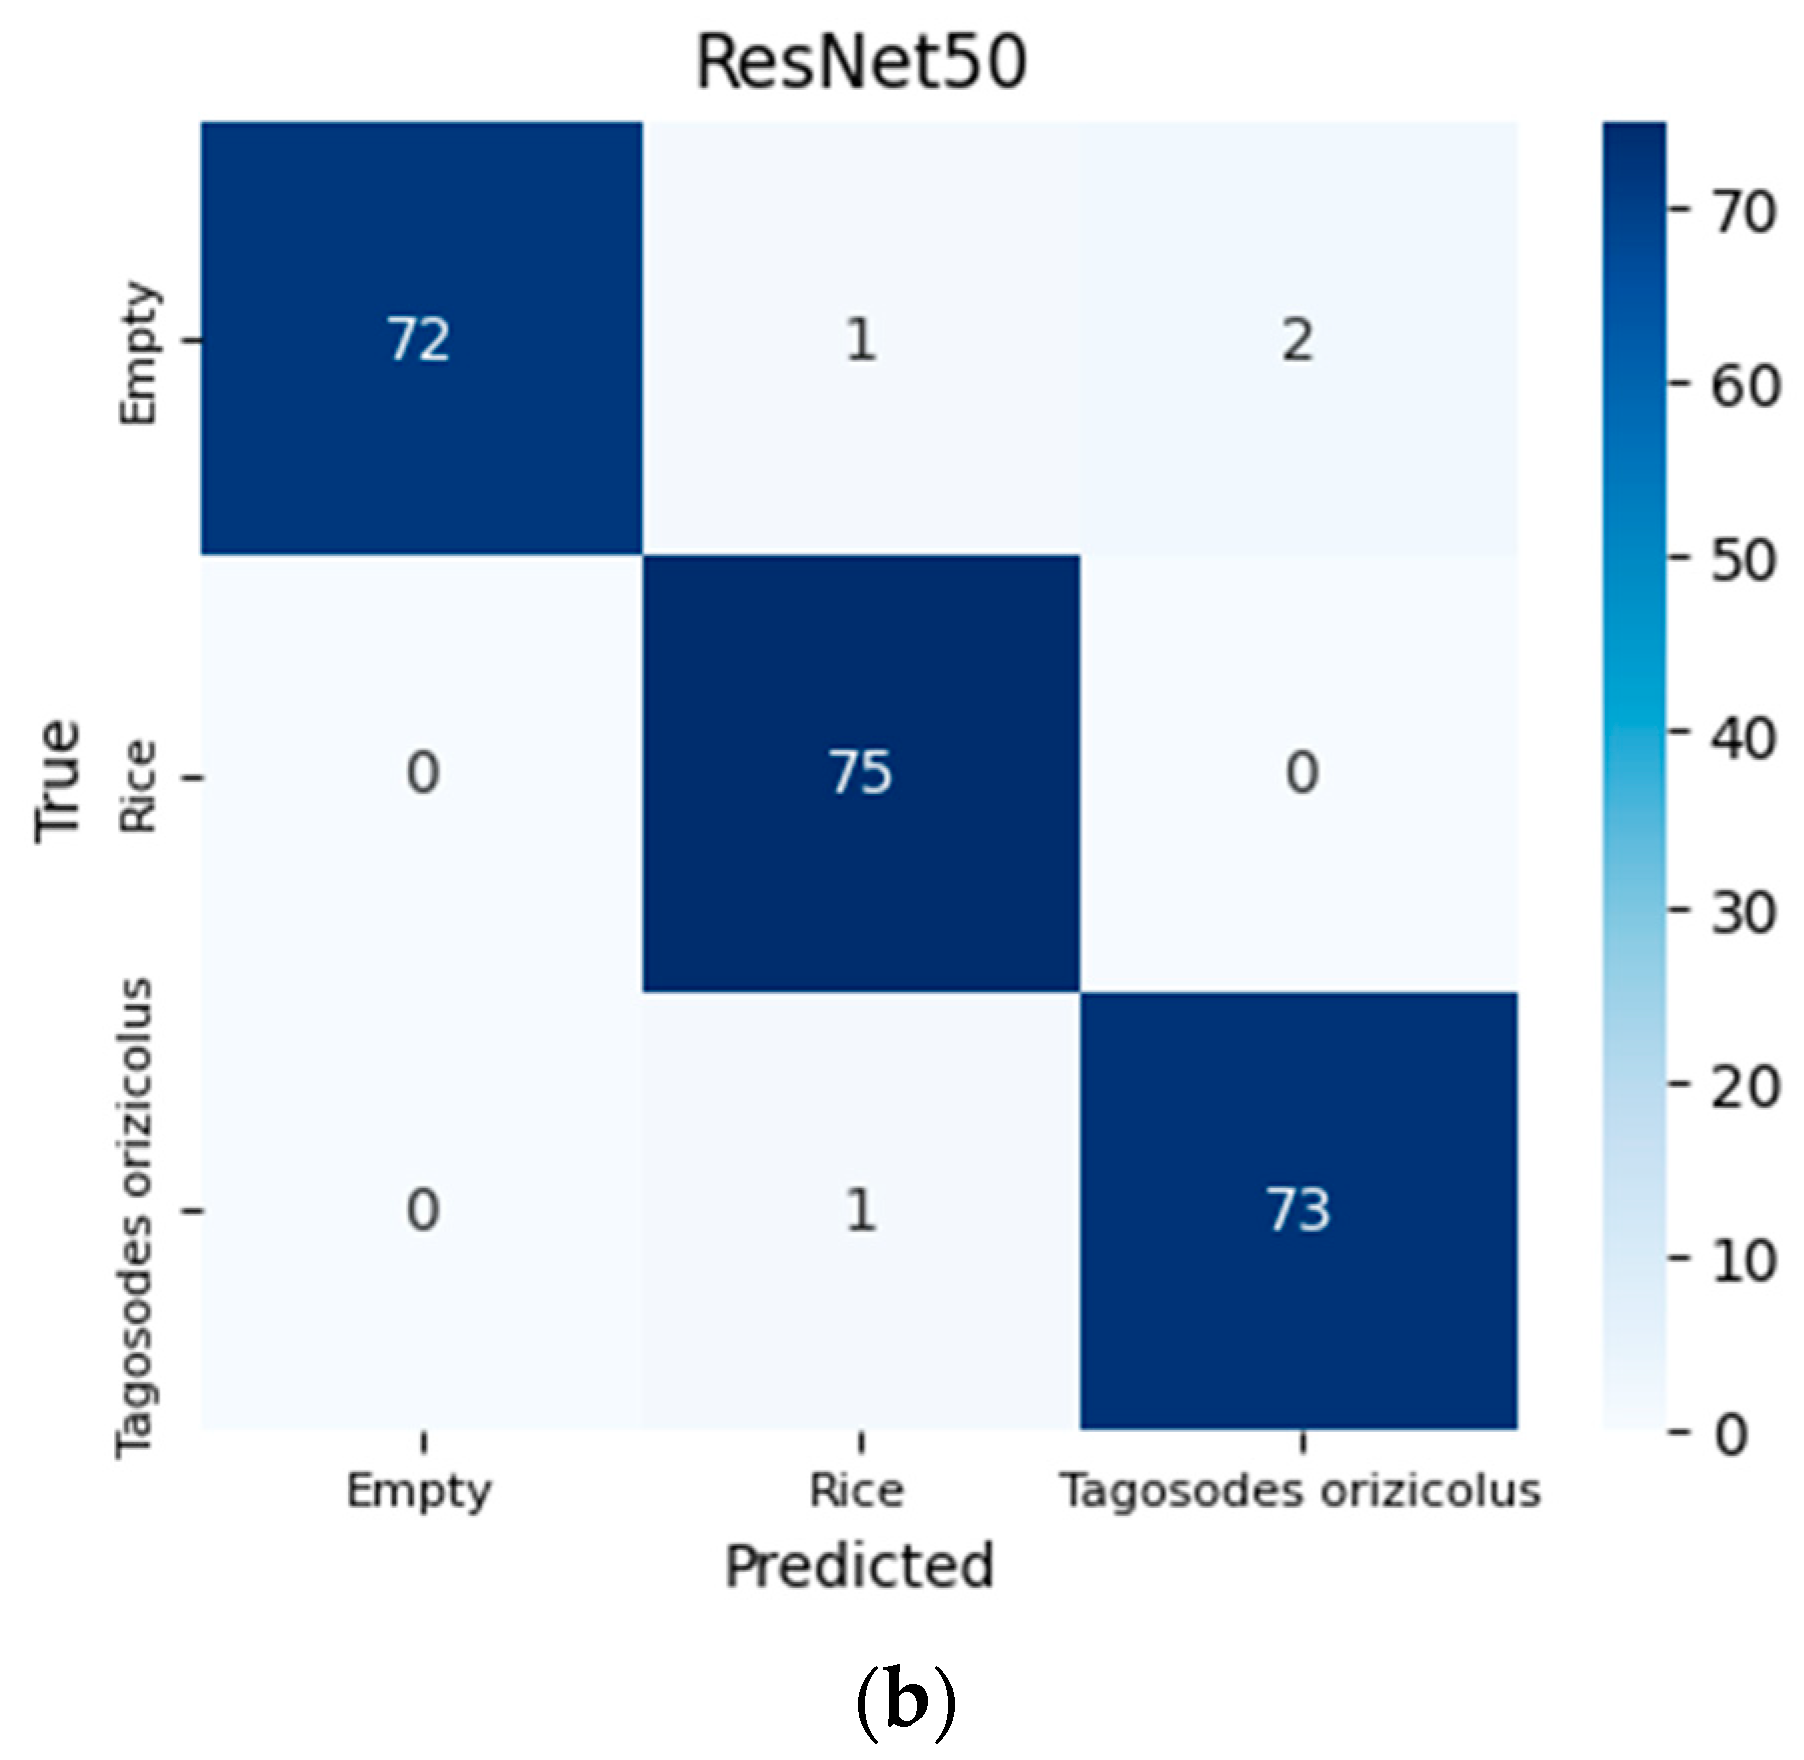
2.4.2. ResNet50
2.5. Performance Evaluation
3. Results
3.1. Performance
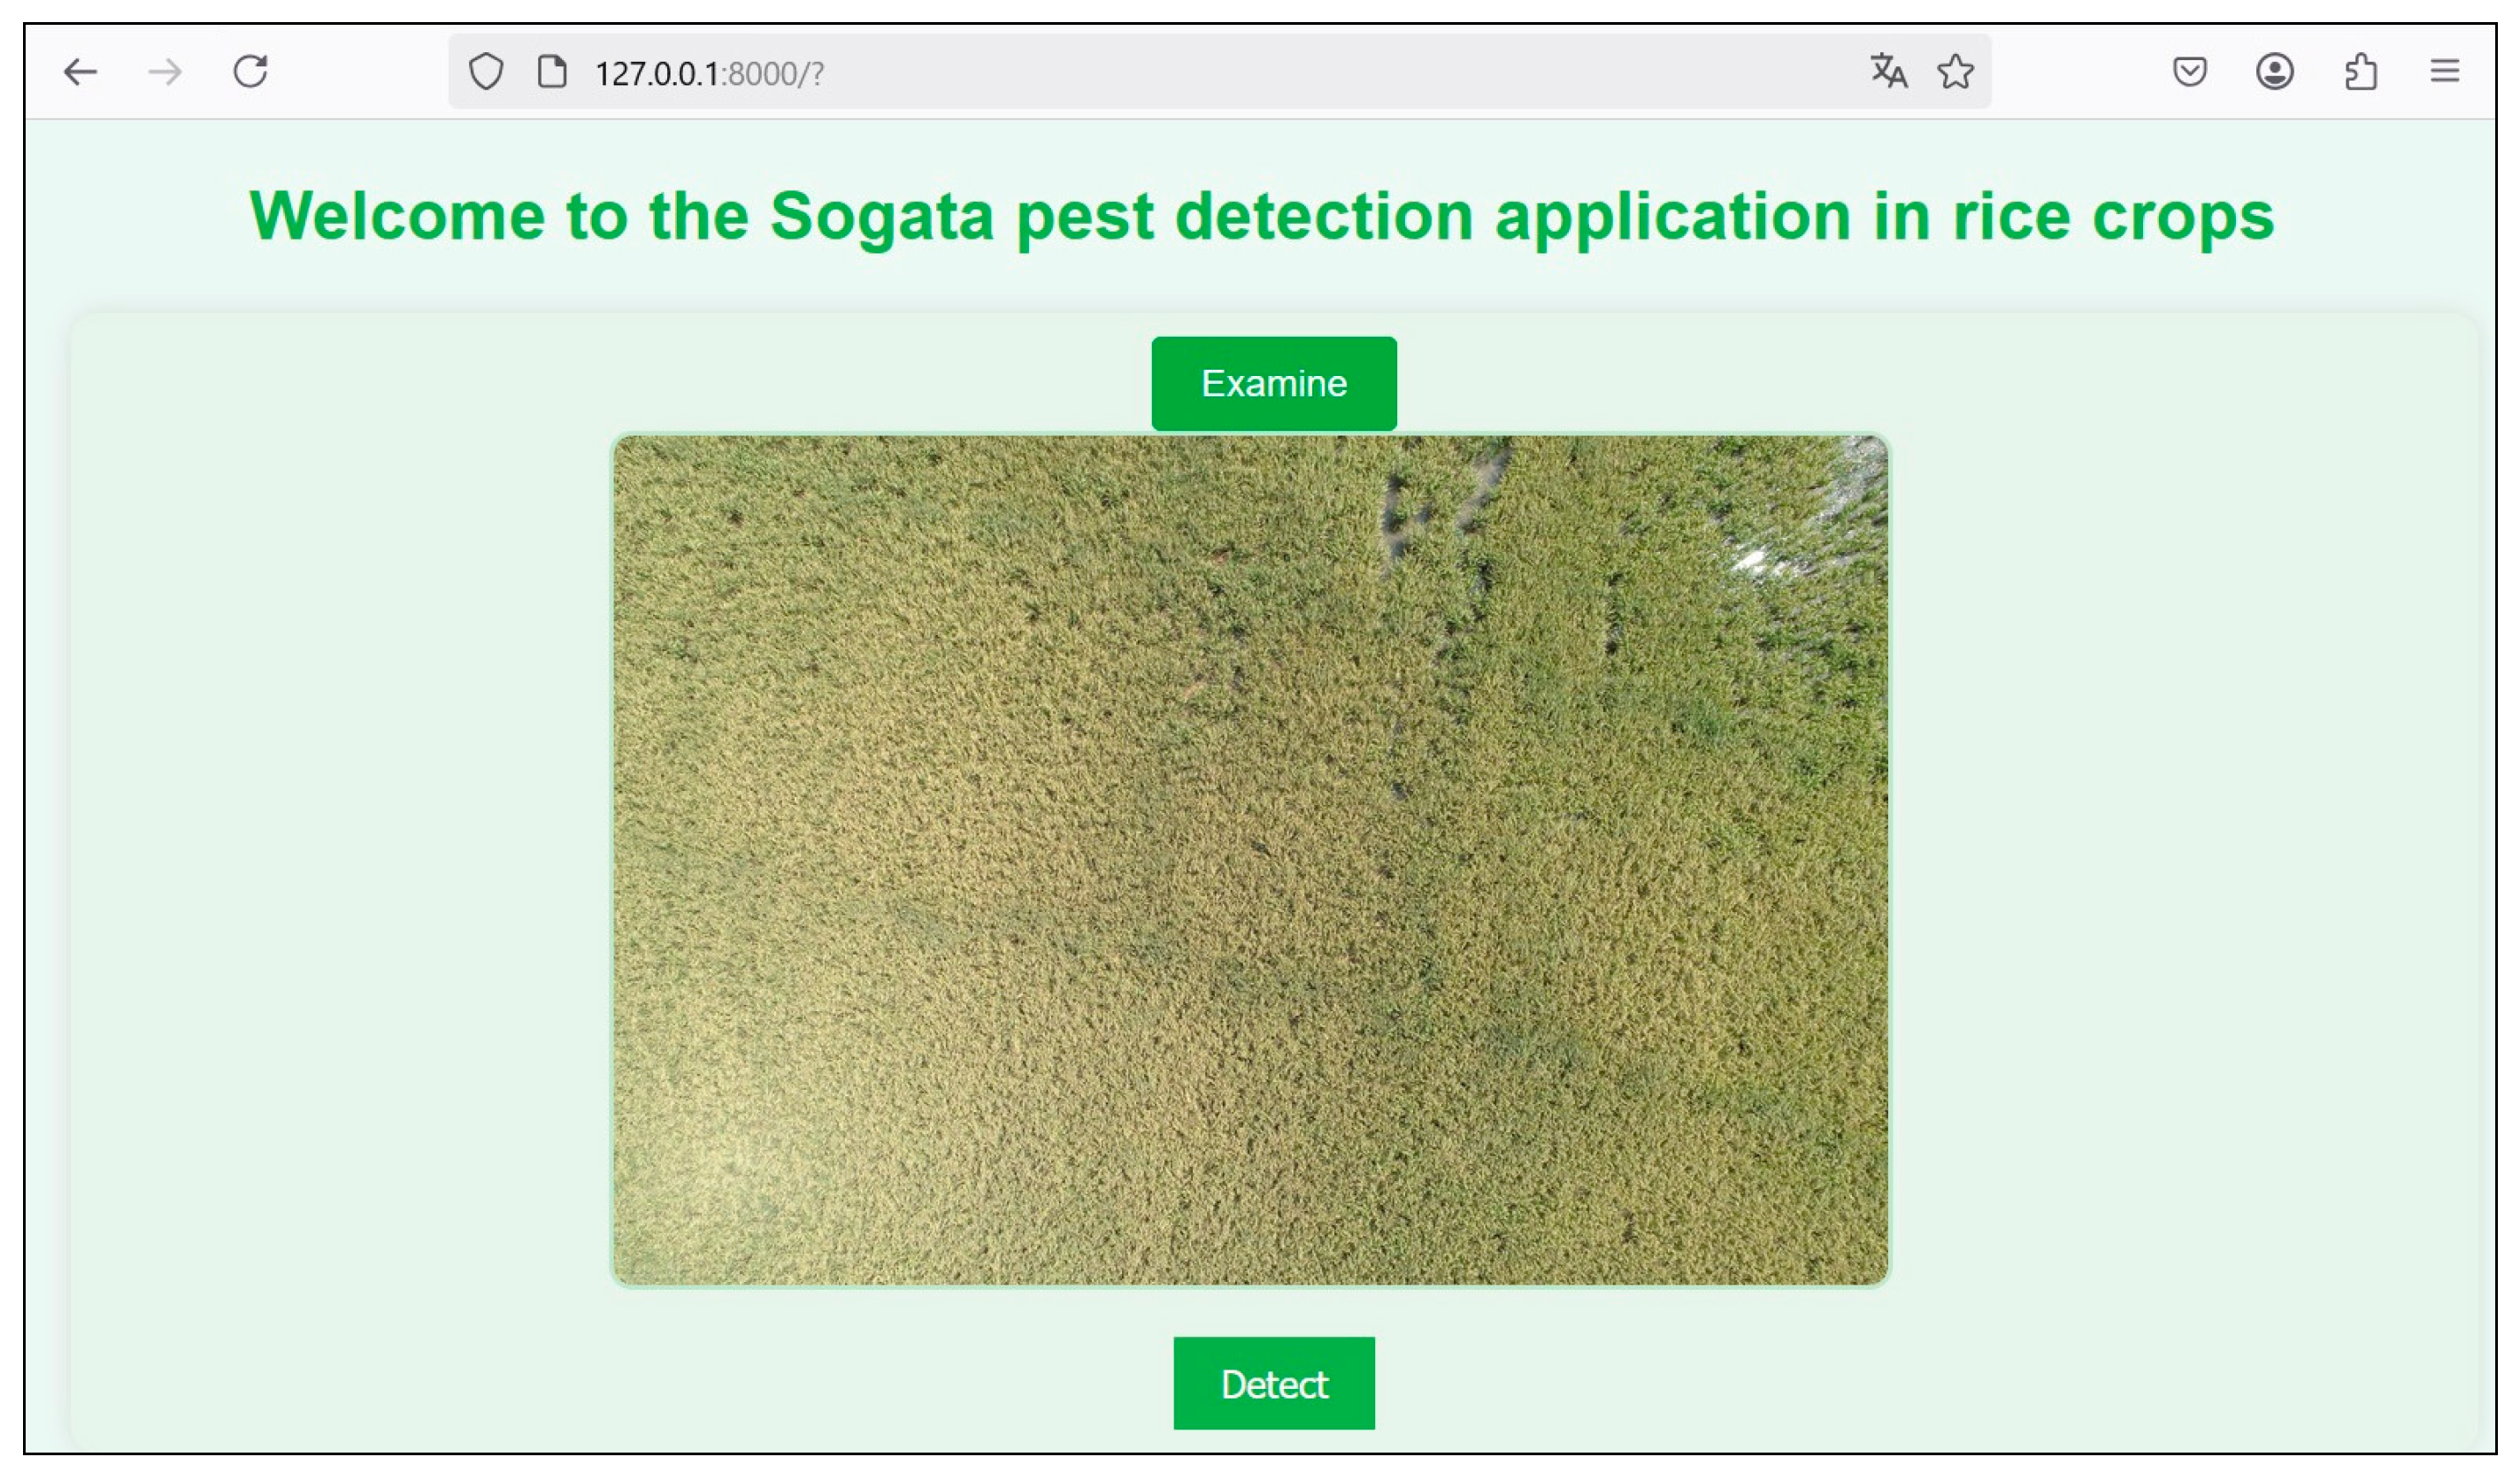
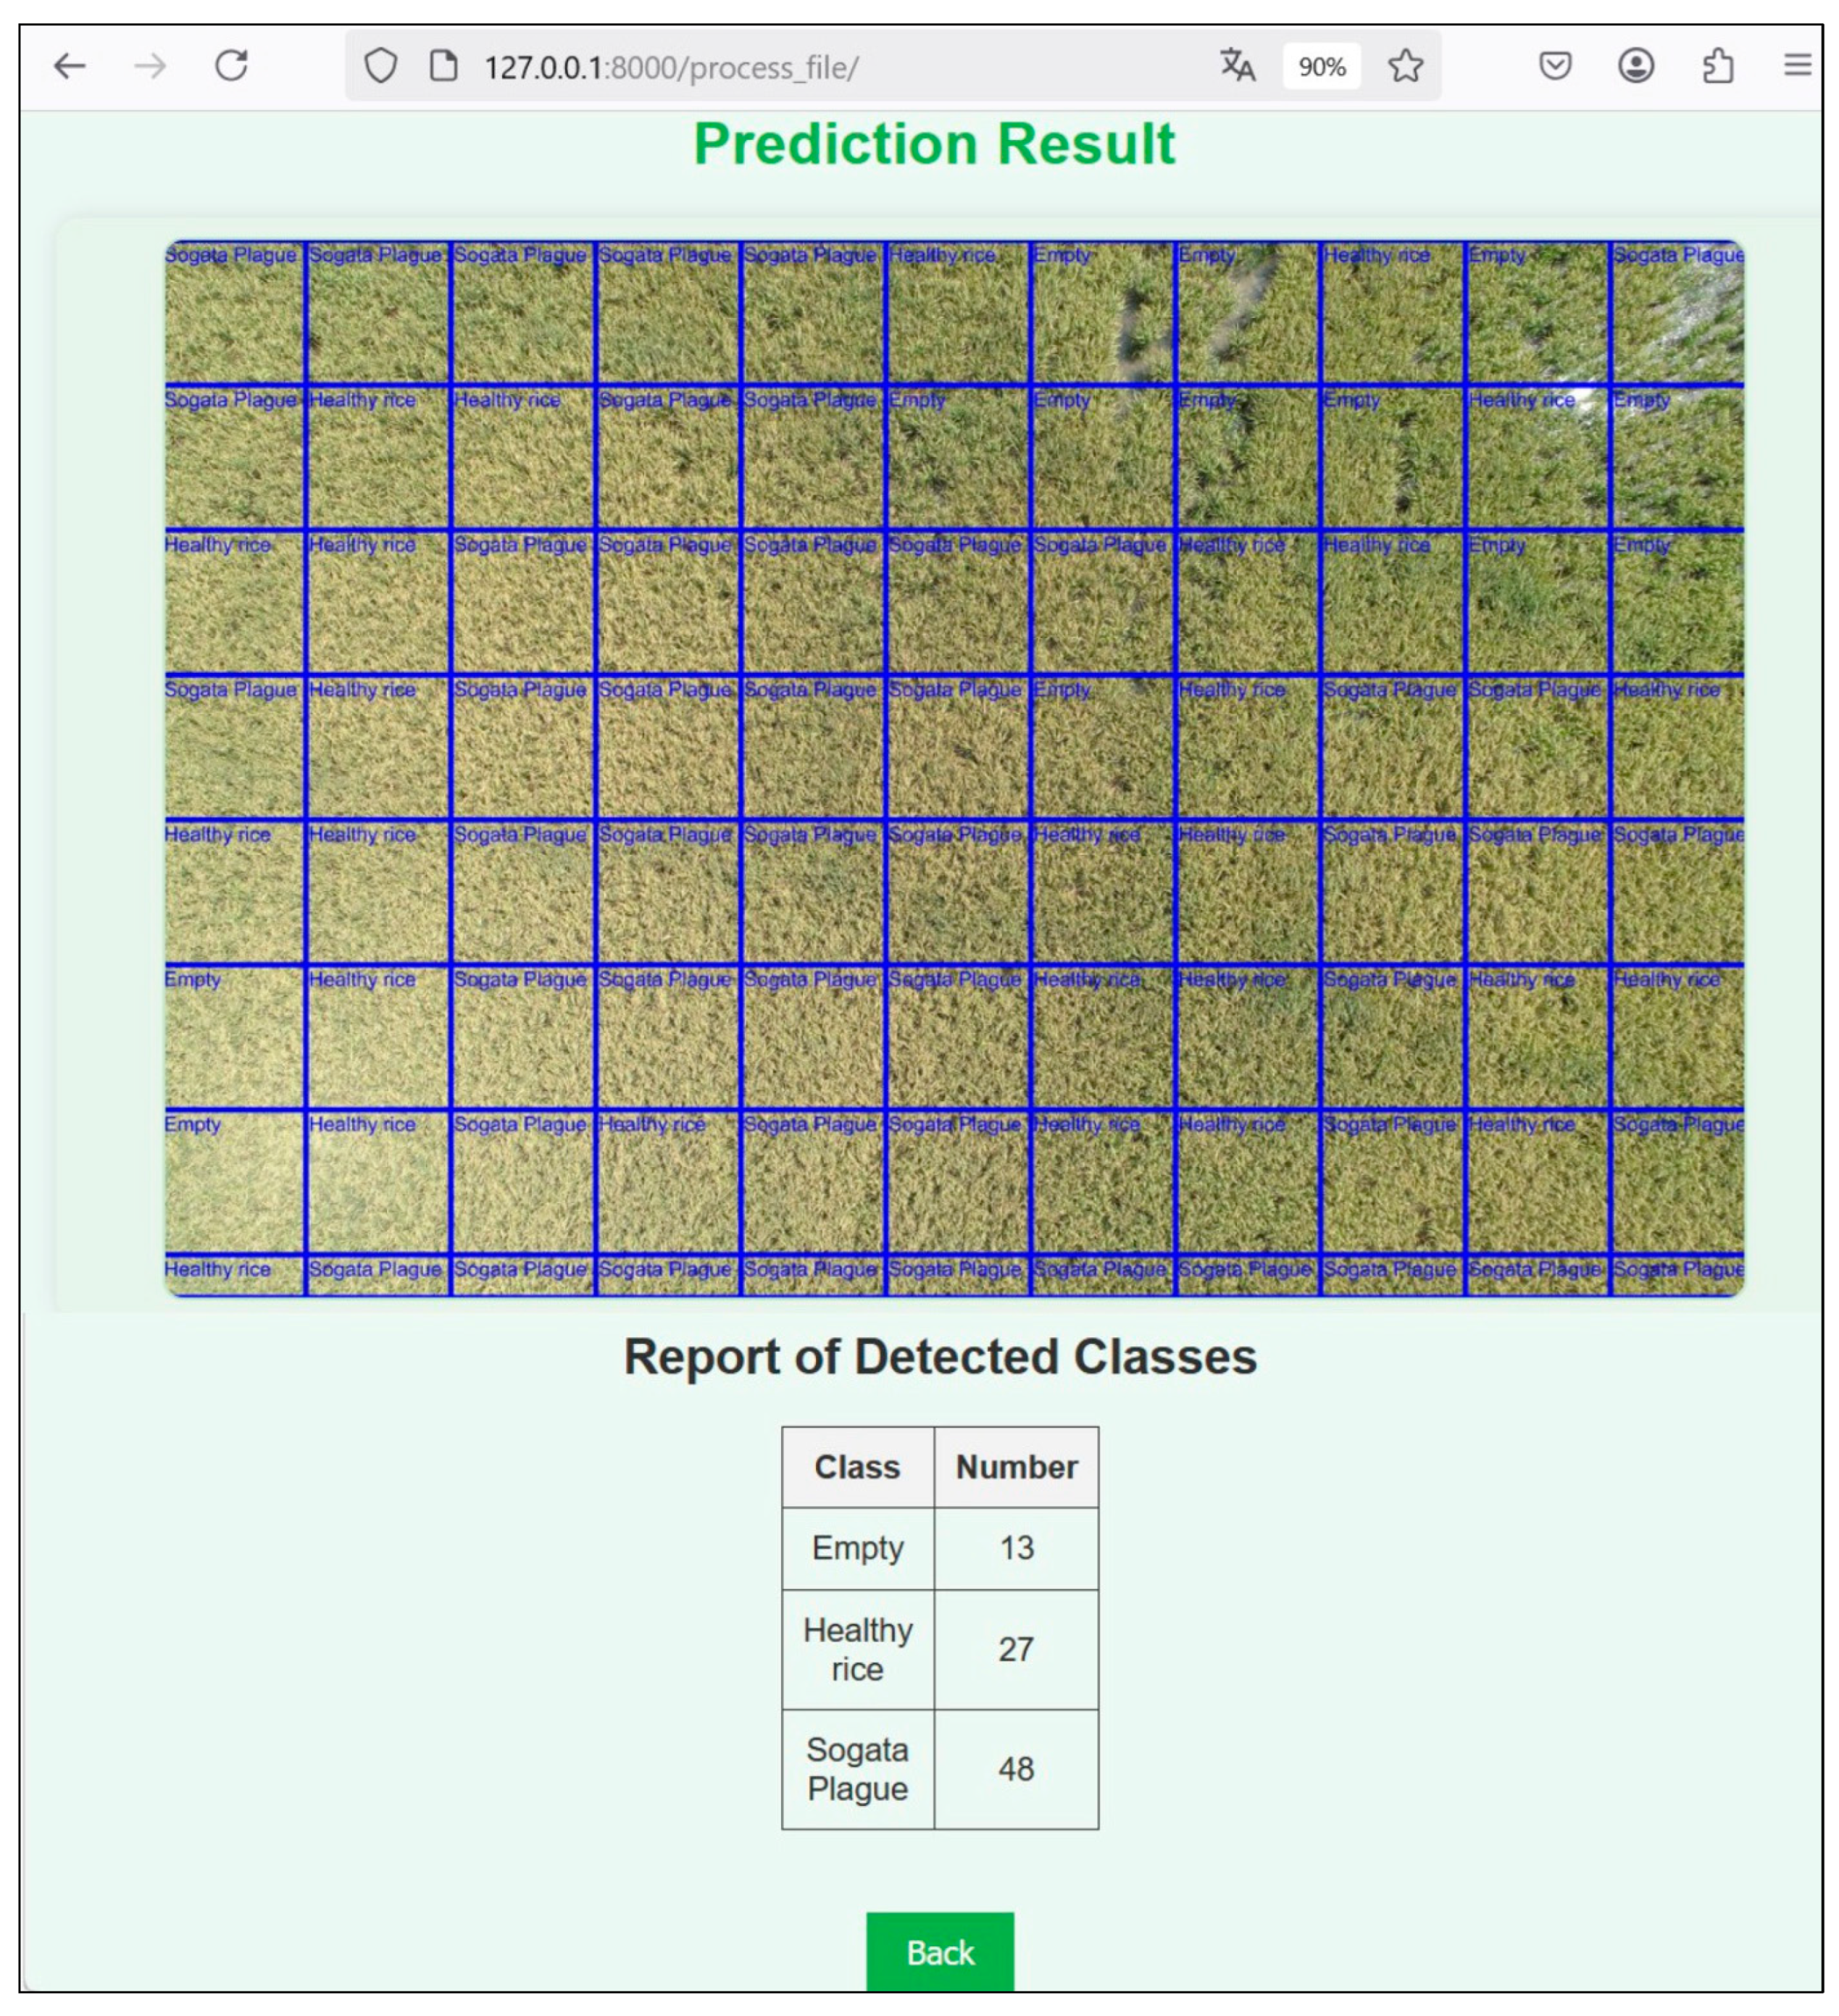
3.2. Application
4. Discussion
5. Conclusions
Author Contributions
Funding
Data Availability Statement
Conflicts of Interest
References
- Rahman, C.R.; Arko, P.S.; Ali, M.E.; Khan, M.A.I.; Apon, S.H.; Nowrin, F.; Wasif, A. Identification and recognition of rice diseases and pests using convolutional neural networks. Biosyst. Eng. 2020, 194, 112–120. [Google Scholar] [CrossRef]
- Asibi, A.E.; Chai, Q.; Coulter, J.A. Rice Blast: A Disease with Implications for Global Food Security. Agronomy 2019, 9, 451. [Google Scholar] [CrossRef]
- García, A.L.V. Bíocontrol de sogata (Tagasodes orizicolus Muir) mediante el uso de hongos entomopatógenos en arroz bajo condiciones de laboratorio. Biotecnol. Y Sustentabilidad 2021, 6, 85–101. [Google Scholar] [CrossRef]
- Echeverri, J.; Perez, C.R.; Cuevas, A.; Avila, L.A.; Higuera, O.L.; Beltran, J.H.; Amezquita, N.F.; Leiva, D.C. Viral Diseases of Rice Crops in Colombia—Latin America. In Viral Diseases of Field and Horticultural Crops; Elsevier: Amsterdam, The Netherlands, 2024; pp. 71–80. [Google Scholar] [CrossRef]
- Zheng, Q.; Huang, W.; Xia, Q.; Dong, Y.; Ye, H.; Jiang, H.; Chen, S.; Huang, S. Remote Sensing Monitoring of Rice Diseases and Pests from Different Data Sources: A Review. Agronomy 2023, 13, 1851. [Google Scholar] [CrossRef]
- Li, R.; Chen, S.; Matsumoto, H.; Gouda, M.; Gafforov, Y.; Wang, M.; Liu, Y. Predicting rice diseases using advanced technologies at different scales: Present status and future perspectives. aBIOTECH 2023, 4, 359–371. [Google Scholar] [CrossRef]
- Barbedo, J.G.A. Detecting and Classifying Pests in Crops Using Proximal Images and Machine Learning: A Review. AI 2020, 1, 312–328. [Google Scholar] [CrossRef]
- Sun, Y.; Lin, Y.; Zhao, G.; Svanberg, S. Identification of Flying Insects in the Spatial, Spectral, and Time Domains with Focus on Mosquito Imaging. Sensors 2021, 21, 3329. [Google Scholar] [CrossRef]
- Subramanian, K.S.; Pazhanivelan, S.; Srinivasan, G.; Santhi, R.; Sathiah, N. Drones in Insect Pest Management. Front. Agron. 2021, 3, 640885. [Google Scholar] [CrossRef]
- Fanso, S.V.C.; Castillo, V.R.A. Agroecosistema del cultivo Oryza sativa L., Arroz, en la Provincia de Lambayeque. Cienc. Soc. 2023, 3, 59–85. Available online: https://revistas2.unprg.edu.pe/ojs/index.php/CURSO/article/view/565 (accessed on 12 December 2024).
- Jafar, A.; Bibi, N.; Naqvi, R.A.; Sadeghi-Niaraki, A.; Jeong, D. Revolutionizing agriculture with artificial intelligence: Plant disease detection methods, applications, and their limitations. Front. Plant Sci. 2024, 15, 1356260. [Google Scholar] [CrossRef]
- García-Parra, M.; De la Barrera, F.; Plazas-Leguizamón, N.; Colmenares-Cruz, A.; Cancimance, A.; Soler-Fonseca, D. The Sustainable Development Goals in America: Overview. La Granja 2022, 36, 45–59. [Google Scholar] [CrossRef]
- Sahasranamam, V.; Ramesh, T.; Muthumanickam, D.; Karthikkumar, A. AI and Neural Network-Based Approach for Paddy Disease Identification and Classification. Int. Res. J. Multidiscip. Technovation 2024, 6, 101–111. [Google Scholar] [CrossRef]
- Ritharson, P.I.; Raimond, K.; Mary, X.A.; Robert, J.E.; Andrew, J. DeepRice: A deep learning and deep feature based classification of Rice leaf disease subtypes. Artif. Intell. Agric. 2024, 11, 34–49. [Google Scholar] [CrossRef]
- Agustin, M.; Hermawan, I.; Arnaldy, D.; Muharram, A.T.; Warsuta, B. Design of Livestream Video System and Classification of Rice Disease. JOIV Int. J. Inform. Vis. 2023, 7, 139–145. [Google Scholar] [CrossRef]
- Patil, R.R.; Kumar, S.; Chiwhane, S.; Rani, R.; Pippal, S.K. An Artificial-Intelligence-Based Novel Rice Grade Model for Severity Estimation of Rice Diseases. Agriculture 2022, 13, 47. [Google Scholar] [CrossRef]
- Bharanidharan, N.; Chakravarthy, S.R.S.; Rajaguru, H.; Kumar, V.V.; Mahesh, T.R.; Guluwadi, S. Multiclass Paddy Disease Detection Using Filter-Based Feature Transformation Technique. IEEE Access 2023, 11, 109477–109487. [Google Scholar] [CrossRef]
- Shovon, S.H.; Mozumder, S.J.; Pal, O.K.; Mridha, M.F.; Asai, N.; Shin, J. PlantDet: A Robust Multi-Model Ensemble Method Based on Deep Learning For Plant Disease Detection. IEEE Access 2023, 11, 34846–34859. [Google Scholar] [CrossRef]
- Jain, S.; Kumar, R.; Agrawal, K. Performance analysis of various deep learning models for detecting rice diseases. J. Auton. Intell. 2023, 7, 1282. [Google Scholar] [CrossRef]
- Bijoy, M.H.; Hasan, N.; Biswas, M.; Mazumdar, S.; Jimenez, A.; Ahmed, F.; Rasheduzzaman, M.; Momen, S. Towards Sustainable Agriculture: A Novel Approach for Rice Leaf Disease Detection Using dCNN and Enhanced Dataset. IEEE Access 2024, 12, 34174–34191. [Google Scholar] [CrossRef]
- Patil, R.R.; Kumar, S. Rice Transformer: A Novel Integrated Management System for Controlling Rice Diseases. IEEE Access 2022, 10, 87698–87714. [Google Scholar] [CrossRef]
- Mannepalli, P.K.; Pathre, A.; Chhabra, G.; Ujjainkar, P.A.; Wanjari, S. Diagnosis of bacterial leaf blight, leaf smut, and brown spot in rice leafs using VGG16. Procedia Comput. Sci. 2024, 235, 193–200. [Google Scholar] [CrossRef]
- Chen, W.; Zheng, L.; Xiong, J. Algorithm for Crop Disease Detection Based on Channel Attention Mechanism and Lightweight Up-Sampling Operator. IEEE Access 2024, 12, 109886–109899. [Google Scholar] [CrossRef]
- Hussain, A.; Srikaanth, P.B. Leveraging Deep Learning and Farmland Fertility Algorithm for Automated Rice Pest Detection and Classification Model. KSII Trans. Internet Inf. Syst. 2024, 18, 959–979. [Google Scholar] [CrossRef]
- Hasan, M.; Rahman, T.; Uddin, A.F.M.S.; Galib, S.M.; Akhond, M.R.; Uddin, J.; Hossain, A. Enhancing Rice Crop Management: Disease Classification Using Convolutional Neural Networks and Mobile Application Integration. Agriculture 2023, 13, 1549. [Google Scholar] [CrossRef]
- Wijayanto, A.K.; Prasetyo, L.B.; Hudjimartsu, S.A.; Sigit, G.; Hongo, C. Textural features for BLB disease damage assessment in paddy fields using drone data and machine learning: Enhancing disease detection accuracy. Smart Agric. Technol. 2024, 8, 100498. [Google Scholar] [CrossRef]
- Barman, U.; Das, D.; Sonowal, G.; Dutta, M. Innovative Approaches to Rice (Oryza sativa) Crop Health: A Comprehensive Analysis of Deep Transfer Learning for Early Disease Detection. Yuz. Yil Univ. J. Agric. Sci. 2024, 34, 314–322. [Google Scholar] [CrossRef]
- Sachdeva, J.; Sharma, D.; Ahuja, C.K. Comparative Analysis of Different Deep Convolutional Neural Network Architectures for Classification of Brain Tumor on Magnetic Resonance Images. Arch. Comput. Methods Eng. 2024, 31, 1959–1978. [Google Scholar] [CrossRef]
- Choudhary, N.; Sharma, A.; Rathore, V.S.; Tiwari, N. Performance Comparison of ResNet50V2 and VGG16 Models for Feature Extraction in Deep Learning. Lect. Notes Netw. Syst. 2024, 812, 223–229. [Google Scholar] [CrossRef]


| Research | Technique | Data | Device | Results | Objective |
|---|---|---|---|---|---|
| [16] | EfficientNet-B0, VGG16, ResNet101, MobileNet, and Optimized Faster RCNN | 1200 images | CCD Camera | EfficientNet-B0: 96.43% accuracy. VGG16: 89.31% accuracy. ResNet101: 90.42% accuracy. | Disease Detection in Rice (Brown Spot, Bacterial Blight and Rice Blast). |
| [17] | Feature Transformation Filter with Lemur Optimization and ML Techniques (KNN, RFC, LDA, HGBC) | 636 thermal images | FLIR E8 Thermal Camera | KNN with transformation achieved 90% balanced accuracy. | Identification of Multiple Diseases in Rice Leaves (Rice Blast, Brown Leaf Spot, Leaf Folder, Hispa and Bacterial Leaf Blight). |
| [18] | Ensemble Model: PlantDet based on InceptionResNetV2, EfficientNetV2L, and Xception. | 2710 images | Huawei Honor 8x Mobile | PlantDet: 98.53% accuracy for rice leaves and 97.50% for betel leaves. | Disease Detection in Rice Leaves (Bacterial Leaf Blight, Brown Spot, Leaf Blast, Leaf Scald, and Narrow Brown Spot) and Betel Leaves in Real-World Environments. |
| [19] | ResNet50, VGG16, MobileNet, GoogleNet, AlexNet, Xception | 30,000 images | - | ResNet50: 97.5% accuracy | Identification of Rice Diseases (Rice Blast, Rice Sheath Blight, Bacterial Leaf Blight, Tungro Disease, Rice Grassy Stunt Virus, Rice Yellow Mottle Virus, Bakanae Disease, Brown Spot, and Rice Tungro Bacilliform Virus). |
| [13] | ResNet50 | 13,876 images | - | ResNet50: 92.83% accuracy | Identification and Classification Of Rice Diseases (Bacterial Leaf Blight, Bacterial Leaf Streak, Bacterial Panicle Blight, Rice Blast, and Brown Spot). |
| [20] | dCNN model, compared with AlexNet, MobileNetV2, ResNet50, DenseNet121, and SwinTransformer. | Public dataset | - | dCNN: 99.8% accuracy. ResNet50: ~99.7% accuracy. MobileNetV3: 99.5% accuracy. SwinTransformer: ~99.6% accuracy. | Identification of Rice Diseases (Brown Spot, Tungro, Bacterial Blight, Sheath Blight, and Blast). |
| [21] | Rice Transformer model, multimodal fusion (images + sensor data). | 4200 images | CCD camera and sensors (DHT22, pH, humidity). | Rice Transformer: 97.38% accuracy | Rice Disease Classification (Blast, Brown Spot, and Bacterial Blight). |
| [22] | VGG16 Support Vector Machine (SVM) Random Forest (RF) | Public dataset | High-resolution camera | VGG16: 97.77% accuracy | Identification of Common Diseases in Rice Leaves (Bacterial Leaf Blight, Leaf Smut, and Brown Spot). |
| [14] | VGG16 | 5932 images | Smartphones DSLR Camera | VGG16: 99.94% accuracy | Classification of Disease Subtypes in Rice Leaves (Blast, Brown Spot, Bacterial Blight, and Tungro) at Mild and Severe Levels. |
| [23] | YOLOv5 | Plant Village dataset and other field captures. | Integrated camera of Xiaomi K60 for field data collection. | YOLOv5: 90% accuracy | Pest and Disease Detection in Crops under Complex Natural Conditions of Plant Village. |
| [24] | Optimized NASNetLarge | IP102 Dataset | UAV Camera | NASNetLarge optimizado: 97.58% accuracy | Automatic Identification of Rice Pests (Rice Leaf Roller, Rice Leaf Caterpillar, Paddy Stem Maggot, Asiatic Rice Borer, Yellow Rice Borer, Rice Gall Midge, Rice Stemfly, Brown Plant Hopper, White Backed Plant Hopper, Small Brown Plant Hopper, Rice Water Weevil, Rice Leafhopper, Grain Spreader Thrips, and Spiny Beetle). |
| [25] | CNN Optimized with K-means Clustering and Background Segmentation Preprocessing. | 2700 images | - | CNN with K-means Clustering: 97.9% accuracy. | Classification of Rice Diseases (Bacterial Leaf Blight, Brown Spot, and Leaf Smut) and Integration into Mobile Applications for Real-Time Management. |
| [26] | Texture Analysis Based on Haralick Features and NDTI, Combined with Random Forest for Classification. | RGB and Multispectral Images | DJI Phantom 4 Multispectral and Trinity F90+ VTOL | Texture Analysis: 98.4% Accuracy Using Random Forest. | Detection of a Disease (Bacterial Leaf Blight) in Rice Leaves by Integrating Textural, Thermal, and Spectral Features. |
| [15] | YOLO v4-Tiny | 5447 images | Raspberry Pi Camera V2 | YOLO v4-Tiny: 80% Accuracy | Development of a System for Live Video Streaming from Drones and Real-Time Classification of Rice Diseases (Brown Spot, Leaf Blast, and Bacterial Blight). |
| [27] | VGGNet, ResNet50, MobileNet, and a Custom CNN Model. | 5932 images | Digital Cameras | Customized CNN models achieved F1 scores ranging from 95% to 99%. MobileNet and ResNet50 demonstrated superior performance with F1 scores in the range of 99% to 100%. In comparison, VGG16 exhibited F1 scores between 95% and 99%. | Evaluation of CNN Models for the Identification of Rice Diseases, Including Bacterial Leaf Blight, Blast, Brown Spot, and Tungro. |
| Criteria | Pacanguilla | Lambayeque |
|---|---|---|
| Cultivation Area | 5896.79 m2 | 23,850.1 m2 |
| UAV Altitude | 20 m | 20 m |
| Angle | 180° | 180° |
| Illumination | Direct sunlight | Direct sunlight |
| Wind Speed | 12 km/h | 16 km/h |
| Temperature | 23 °C | 27 °C |
| Humidity | 70% | 58% |
| Time | Between 9:00 a.m. and 11:00 a.m. | Between 9:00 a.m. and 11:00 a.m. |
| Day | 12 January 2024 | 14 April 2024 |
| Longitude | −79.4223778 | −79.8861823 |
| Latitude | −7.1476868 | −6.6727899 |
| Algorithms | Precision | Accuracy | Recall | F1-Score | Specificity |
|---|---|---|---|---|---|
| VGG16 | 98.274% | 98.214% | 98.204% | 98.212% | 99.105% |
| ResNet50 | 98.245% | 98.214% | 98.216% | 98.210% | 99.108% |
Disclaimer/Publisher’s Note: The statements, opinions and data contained in all publications are solely those of the individual author(s) and contributor(s) and not of MDPI and/or the editor(s). MDPI and/or the editor(s) disclaim responsibility for any injury to people or property resulting from any ideas, methods, instructions or products referred to in the content. |
© 2025 by the authors. Licensee MDPI, Basel, Switzerland. This article is an open access article distributed under the terms and conditions of the Creative Commons Attribution (CC BY) license (https://creativecommons.org/licenses/by/4.0/).
Share and Cite
Rivera-Cartagena, A.; Mejia-Cabrera, H.I.; Arcila-Diaz, J. Detection of Tagosodes orizicolus in Aerial Images of Rice Crops Using Machine Learning. AgriEngineering 2025, 7, 147. https://doi.org/10.3390/agriengineering7050147
Rivera-Cartagena A, Mejia-Cabrera HI, Arcila-Diaz J. Detection of Tagosodes orizicolus in Aerial Images of Rice Crops Using Machine Learning. AgriEngineering. 2025; 7(5):147. https://doi.org/10.3390/agriengineering7050147
Chicago/Turabian StyleRivera-Cartagena, Angig, Heber I. Mejia-Cabrera, and Juan Arcila-Diaz. 2025. "Detection of Tagosodes orizicolus in Aerial Images of Rice Crops Using Machine Learning" AgriEngineering 7, no. 5: 147. https://doi.org/10.3390/agriengineering7050147
APA StyleRivera-Cartagena, A., Mejia-Cabrera, H. I., & Arcila-Diaz, J. (2025). Detection of Tagosodes orizicolus in Aerial Images of Rice Crops Using Machine Learning. AgriEngineering, 7(5), 147. https://doi.org/10.3390/agriengineering7050147