1. Introduction
In today’s rapidly evolving agricultural landscape, the integration of technology and sustainable practices is essential for meeting growing global food demands. This paper explores the current trends and challenges in agriculture, highlighting the importance of precision farming and innovative techniques in enhancing productivity and sustainability.
The precision of sunflower sowing plays a crucial role in determining plant establishment, growth uniformity, and ultimately, yield potential [
1]. This study aimed to evaluate the factors influencing sowing accuracy and their impact on sunflower performance. By understanding these dynamics, it is possible to enhance cultivation practices and optimise production efficiency.
The sunflower (
Helianthus annuus L.) occupies an important place in the global market, representing the third largest oilseed crop in the world (9% of global production), the fourth largest vegetable oil market (9.2% of global production), and the third largest oilseed meal produced (5.6% of global production) [
2].
Precision agriculture, with various agronomic and technical innovations, plays a crucial role in optimising sunflower yields by means of ensuring a uniform plant distribution and the optimal utilisation of available water and nutrients for the soil [
3]. Agronomic innovations are important factors that can be used to help face new challenges due to changing climate scenarios [
4]. Different agronomic parameters, such as the local environment, spatial variability in soil characteristics [
5,
6], precision sowing techniques and machinery [
7], and site-specific genotype characteristics, along with the use of fertilisation strategies [
8,
9], significantly influence the yield and general crop performance of sunflowers in diverse cropping systems [
10].
Spatial variability factors in soil properties, such as the plasticity, moisture content, and nutrient availability, directly affect the seed placement accuracy and seedling emergence [
11,
12]. The soil heterogeneity affects the seedling emergence and growth dynamics directly and indirectly. Variability in the organic matter content, compaction levels, and micro-relief can lead to differences in soil water retention and aeration, impacting root penetration and nutrient uptake [
13]. In addition, differences in tillage and soil moisture content influence the germination efficiency of sunflowers, making it important to choose a suitable site-specific tillage method before seedbed preparation [
14].
Precision sowing aims to mitigate these adverse effects by ensuring an even plant density, seed depth, and spacing, which are critical for a uniform crop stand and high yield formation [
15,
16,
17]. Nevertheless, field heterogeneity can lead to uneven plant distribution, affecting the inter-plant competition for resources and ultimately influencing the yield formation [
18]. The effectiveness of precision sowing largely depends on the technological aspects and parameters of the machinery used for sowing [
19]. Precision seed drills equipped with advanced steering systems, RTK guidance, and automated sowing depth control can enhance seed placement uniformity [
20,
21]. Factors such as the sowing speed, downforce adjustment, and soil-engaging components influence the quality of seed distribution [
22,
23,
24]. High-speed sowing may lead to seed bouncing and irregular spacing, whereas appropriate machinery calibration ensures optimal emergence and stand establishment [
25].
Research in recent years has shown that in sunflowers (although their adaptability is extraordinary), the number of plants per hectare and the available area per unit of growing area are of crucial importance [
1], the most important characteristic of which is the uniformity of sowing [
20]. The most accurate uniformity of sowing that can be achieved varies from one seeding technology to another, depending to a large extent on the applied technical solutions of the seeder and its settings [
26].
In a conventional tillage system, there is little to no residual stubble on the soil surface, and the cultivated soil structure poses the least difficult challenge to the technical solutions of the seeder. However, the detrimental effects on the soil life and water balance, as well as the soil-destructive properties, are causing an increasing number of farmers to rethink their tillage practices [
27].
No-till cropping systems require a higher level of technology [
28,
29]. In these cropping systems, the seed drills must simultaneously manage the straw residues on the soil surface in order to prepare a suitable seedbed for sunflowers and to ensure optimal seed-soil contact and the most even spacing of the seedbed [
30]. It is important for reducing production costs to apply a variable dose of nutrients in one pass, along with the sowing [
31].
Different sunflower genotypes exhibit diverse responses to non-uniform sowing conditions, influencing plant vigour, root development, and adaptation to soil variability and heterogeneous field zones [
32]. Selecting the genotypes with high emergence potential and stress tolerance is critical for maximising yield in variable field environments [
33]. Precision sowing technologies such as a variable sowing rate can optimise plant population density based on the soil characteristics, improving resource efficiency and yield stability [
34,
35].
Optimising precision sowing techniques in sunflower production requires a comprehensive understanding of the influencing factors while integrating advanced sensing technologies, real-time soil mapping, and adaptive sowing strategies to enhance the sowing efficiency and yield potential. The main goal of this research was to clarify the effects of diverse agronomic environments on precision sowing characteristics and their relationships with yield formation, thereby increasing the efficiency of sunflower production.
The main objectives in designing and conducting the present research were the following:
to undertake an analysis of the interaction between the management, soil, and environmental variables and their effects on sowing quality and yield in the case of precision sunflower production
to quantify the effects of different field characteristics, productivity zones, and crop density on sowing uniformity, double and missing sowing rates, and on yield parameters such as yield, oil, and moisture content and thousand seed weight
to assess the environmental differentiation between yield and sowing quality indices according to the physical and chemical parameters of soil
to clarify the interrelationship and significance of factors such as altitude, quantity, and the deviation of precipitation and the severity of temperature
2. Materials and Methods
2.1. Location of Examined Fields
A sowing experiment was set up between 2021 and 2023. The farm is located in Mezőszemere (Heves county, Hungary). The sowing experiments were established in the areas of Maklár, Szihalom, Mezőszemere, and Egerfarmos. The typical soil type in the experimental areas is meadow, which is a general soil type in the Borsod-Mezőseg region. Meadow soils are fully suitable for sunflower production, and they are characterised by a varying degree of heterogeneity within the field due to the nature of the region’s water management, creating an excellent opportunity for the application of precision technologies.
Due to the specific nature of sunflower production, a three-year-long variable-number sowing experiment was set up in six experimental fields between 2021 and 2023, in two different experimental fields per year, in order to avoid the obvious harmful consequences of monoculture production on sunflower.
2.2. Weather Conditions of the Examined Fields
The weather events (temperature, precipitation) of the studied period (2021–2023) were also suitable for examining the crop-year effect. A weather station (Sencrop Raincrop RC0039851) (Sencrop, Lille, France) was used to collect data. The station was located at the central site of the experimental farm (Mezőszemere, N 47.74406° E 20.52253°); 7.4, 4.4, 2.0, 5.4, 3.3 and 2.7 km southeast, north, southeast, northwest, southeast, and east from fields 2021A, 2021B, 2022A, 2022B, 2023A, and 2023B, respectively.
The weather data were measured in each year’s vegetation period in terms of sunflower production (between January and August for precipitation, and between April and August for temperature) in the experimental region. After comparing the obtained data to the average of the same periods of the five years preceding the experimental period (2016–2020) [
36], the following conclusions could be made. The year 2021 was less rainy (374.5 mm) than average (405.8 mm) and it had slightly cooler (18.07 °C) than average (19.00 °C) weather. The winter precipitation was adequate and there was sufficient and evenly distributed precipitation for the sunflower crop during the vegetation period. The number of heat days (Tmax ≥ 30 °C) was moderate (34 days). The year 2022 was notably drier (225.2 mm) and warmer (19.73 °C) than average. The amount of winter precipitation was not sufficient and there was little precipitation during the vegetation period, about 25% of which fell at the end of August, when the sunflower crop could no longer use it. In addition, the number of heat days was record high (55 days) during the growing season, which also meant serious stress for the sunflower plant. The year 2023 was much rainier (561.6 mm) and cooler (18.36 °C) than average. The winter precipitation was particularly abundant, and a large amount of precipitation fell during the vegetation period. The number of heat days (37 days) was almost the same as in 2021, but the abundant rainfall created almost ideal conditions for the heat-preferring sunflower crop to produce a favourable yield.
2.3. Selection Criteria of the Productivity Zones and Analysis of Soil Composition
Images of the Sentinel-2 satellite were used to establish the productivity zones. The images were taken between 2017 and 2020. The yield and height data during harvesting were recorded by the harvester’s computer (John Deere GreenstarTM 3 Display, Deere & Company, Moline, IL, USA) between 2017 and 2020. Aerial photographs were used to map the productivity zones of the study areas and to measure their area, providing 10 × 10 m resolution of ground surface detail. These photographs were taken on multiple occasions during the examined years. A Maximum Likelihood decision and an accuracy test, i.e., the usual image analysis chain based on statistical classification pre-processing, were used to perform plant mapping. In addition to the applied satellite imagery, the height and yield data measured by the harvesters—available on a yearly basis—were used for the purpose of monitoring crop development, as well as to estimate yield. The data of the high-resolution satellite images provided time curves for the plants. Yield was calculated from this data, although yield data were also logged by the harvester, used as reference data, corrected for the average data of the given field.
Soil samples were taken from 0–30cm soil depth at 16 points in the area of the productivity zones. An average sample weighing approximately 2 kg was formed from the excavated soil samples for each zone. After identification, the samples were transported to the laboratory of the Szolnoki Talajvédelmi Laboratórium Ltd. for examination. The obtained soil samples were examined by applying methods in accordance with the Hungarian Standards MSZ EN ISO 10390:2022 (Soil pH, Salt, CaCO
3) [
37], MSZ–08–0205:1978 (Soil plasticity) [
38], MSZ EN ISO 12782-5:2012 (Humus) [
39], and MSZ 20135:1999 (N, P
2O
5, K
2O, Mg, Na, Zn, Cu, Mn, S) [
40].
A geospatial information system was established using the results obtained from the data collection for further use. In determining productivity, a yield level was identified as expected from the area’s productivity (4 t ha−1), assigned to the different zones in accordance with the prepared productivity map. The yield was modified positively or negatively based on the productivity data. An average productivity pixel was evaluated as 100%, and pixels with homogeneous productivity formed zones.
It was considered that these productivity zones were created and classified as three productivity categories (low, medium, high) which should have been separated from each other to the greatest possible extent.
2.4. Selection Criteria of the Crop Density Levels
The crop density (seed number) changes which occurred during the experimental sowing were carried out automatically by the on-board computer of the tractor, following a previously compiled sowing plan.
The experimental sowing plan was set up in accordance with the various productivity zone categories as follows: According to the seed manufacturer’s recommendations concerning the area of the experimental fields, the standard nominal sowing rate of the SY Bacardi CLP sunflower hybrid was 55,000 seeds ha−1.
In the low-productivity zone, the standard nominal crop density (55,000 seeds ha
−1) was used, and the crop density was reduced by 20% (44,000 seeds ha
−1) and 40% (33,000 seeds ha
−1). In the medium-productivity zone, the standard nominal crop density (55,000 seeds ha
−1) was applied, and the crop density increased by 20% (66,000 seeds ha
−1) and reduced by 20% (44,000 seeds ha
−1). In the high-productivity zone, in addition to the standard nominal sowing rate (55,000 seeds ha
−1), the crop density was increased by 20% (66,000 seeds ha
−1) and by 40% (77,000 seeds ha
−1) (
Table 1).
2.5. Sowing Technique and Experimental Design
The production technology of the sowing experiments was the same during the three years and on all fields, including soil preparation, as well as pesticide and nutrition management; only the numbers of sown seeds varied, according to the productivity zone sowing plan. Sowing was implemented with a Horsch Maestro 12.75 SW (Horsch Maschinen Gmbh, Schwandorf, Germany) seed drill with a Precision Planting Sowing Unit (Precision Planting, Tremont, IL, USA).
Regarding the feasibility aspects of the experiment, four blocks (four replicates) were assigned in each field and productivity zone, with 9 m wide (12 rows) and 100 m long strips of low, medium, or high crop density adjacent to each other in each block. In the established productivity zones, the experimental sowing plots were physically marked (signal stakes) in addition to recording the EOV coordinates of the corner points (TopCon GMS–2). Based on these coordinates, the average altitude of the plots was also calculated. A 3 m wide area perpendicular to the sowing area was left unsown both at the beginning and end of the 100 m long experimental sowing section. In addition, the three rows before the first and after the last experiment row were left unsown for the entire experiment, resulting in an unsown frame around the experiment with the aim of helping harvesting, as well as the identification of the area.
2.6. The Process of Data Collection
Plant distance was monitored at BBCH 16–18 of the sunflower phenological stages. Six of the total twelve rows were randomly selected for each differentiated number of sowing strips. Within the 100 m long rows of the six rows, a 10 m long section was designated at an arbitrary point in each row, in which plant numbers in the rows and the distance between plants were recorded (n = 48,902). Using the obtained data, it was possible to calculate the number of sprouted plants per hectare.
For each plot, the 100 m long experiment plots were cut and harvested separately. Harvested sunflowers were emptied on the transport vehicle, followed by measurement per plot using a mobile weighing unit (Avery Weight-Tronix Model 640) (Avery Weigh-Tronix, LLC, Fairmont, MN, USA). An average sample of approx. 1 kg of sunflower seeds was taken from the transport vehicle at five points and was packed in paper bags to determine the thousand seed weight, as well as the moisture and oil content in the Laboratory of the Agricultural Instrument Center of the University of Debrecen. Test samples were prepared according to the MSZ EN ISO 664:2008 standard [
41] and were tested for moisture according to the MSZ EN ISO 665:2020 standard [
42] and for oil content according to the MSZ EN ISO 659:2009 standard [
43]. The authors also performed measurement of thousand seed weight by weighing two hundred seeds in two replicates from the average sample and converting this value to one thousand seed weight.
2.7. The Process of Data Preparation
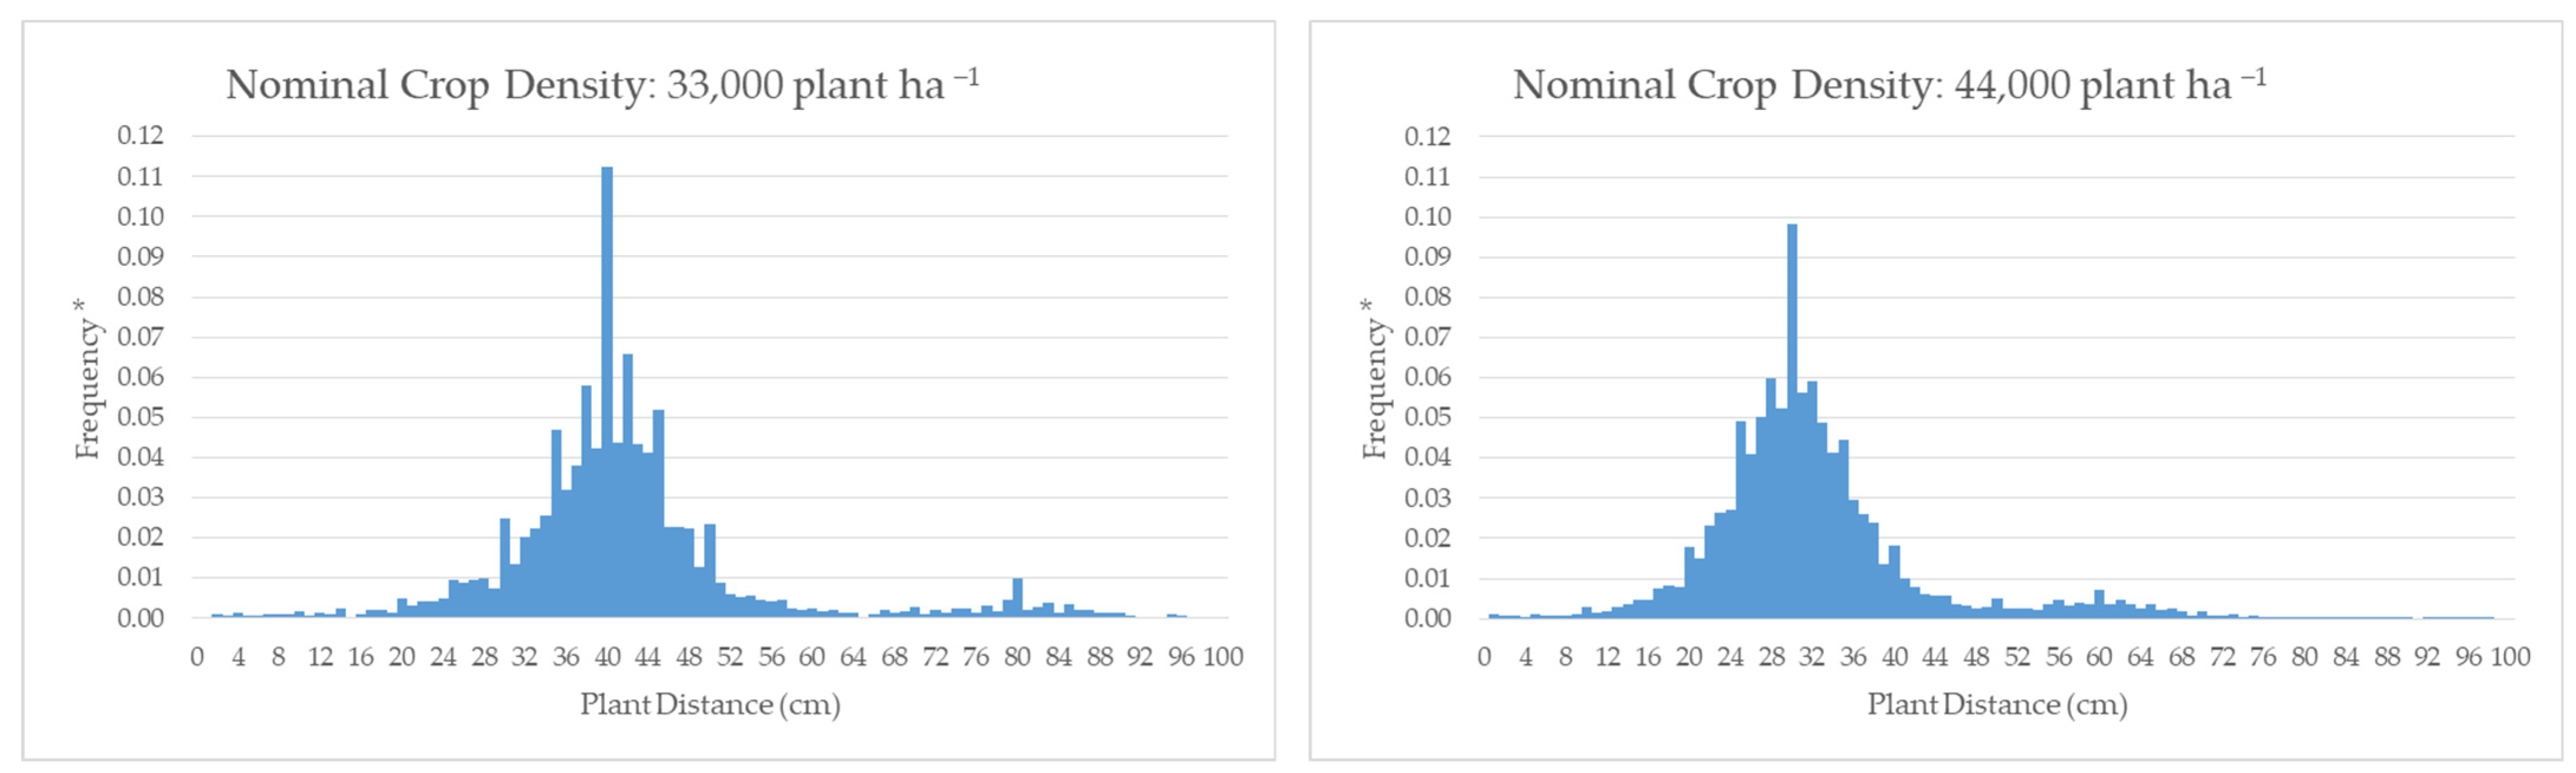
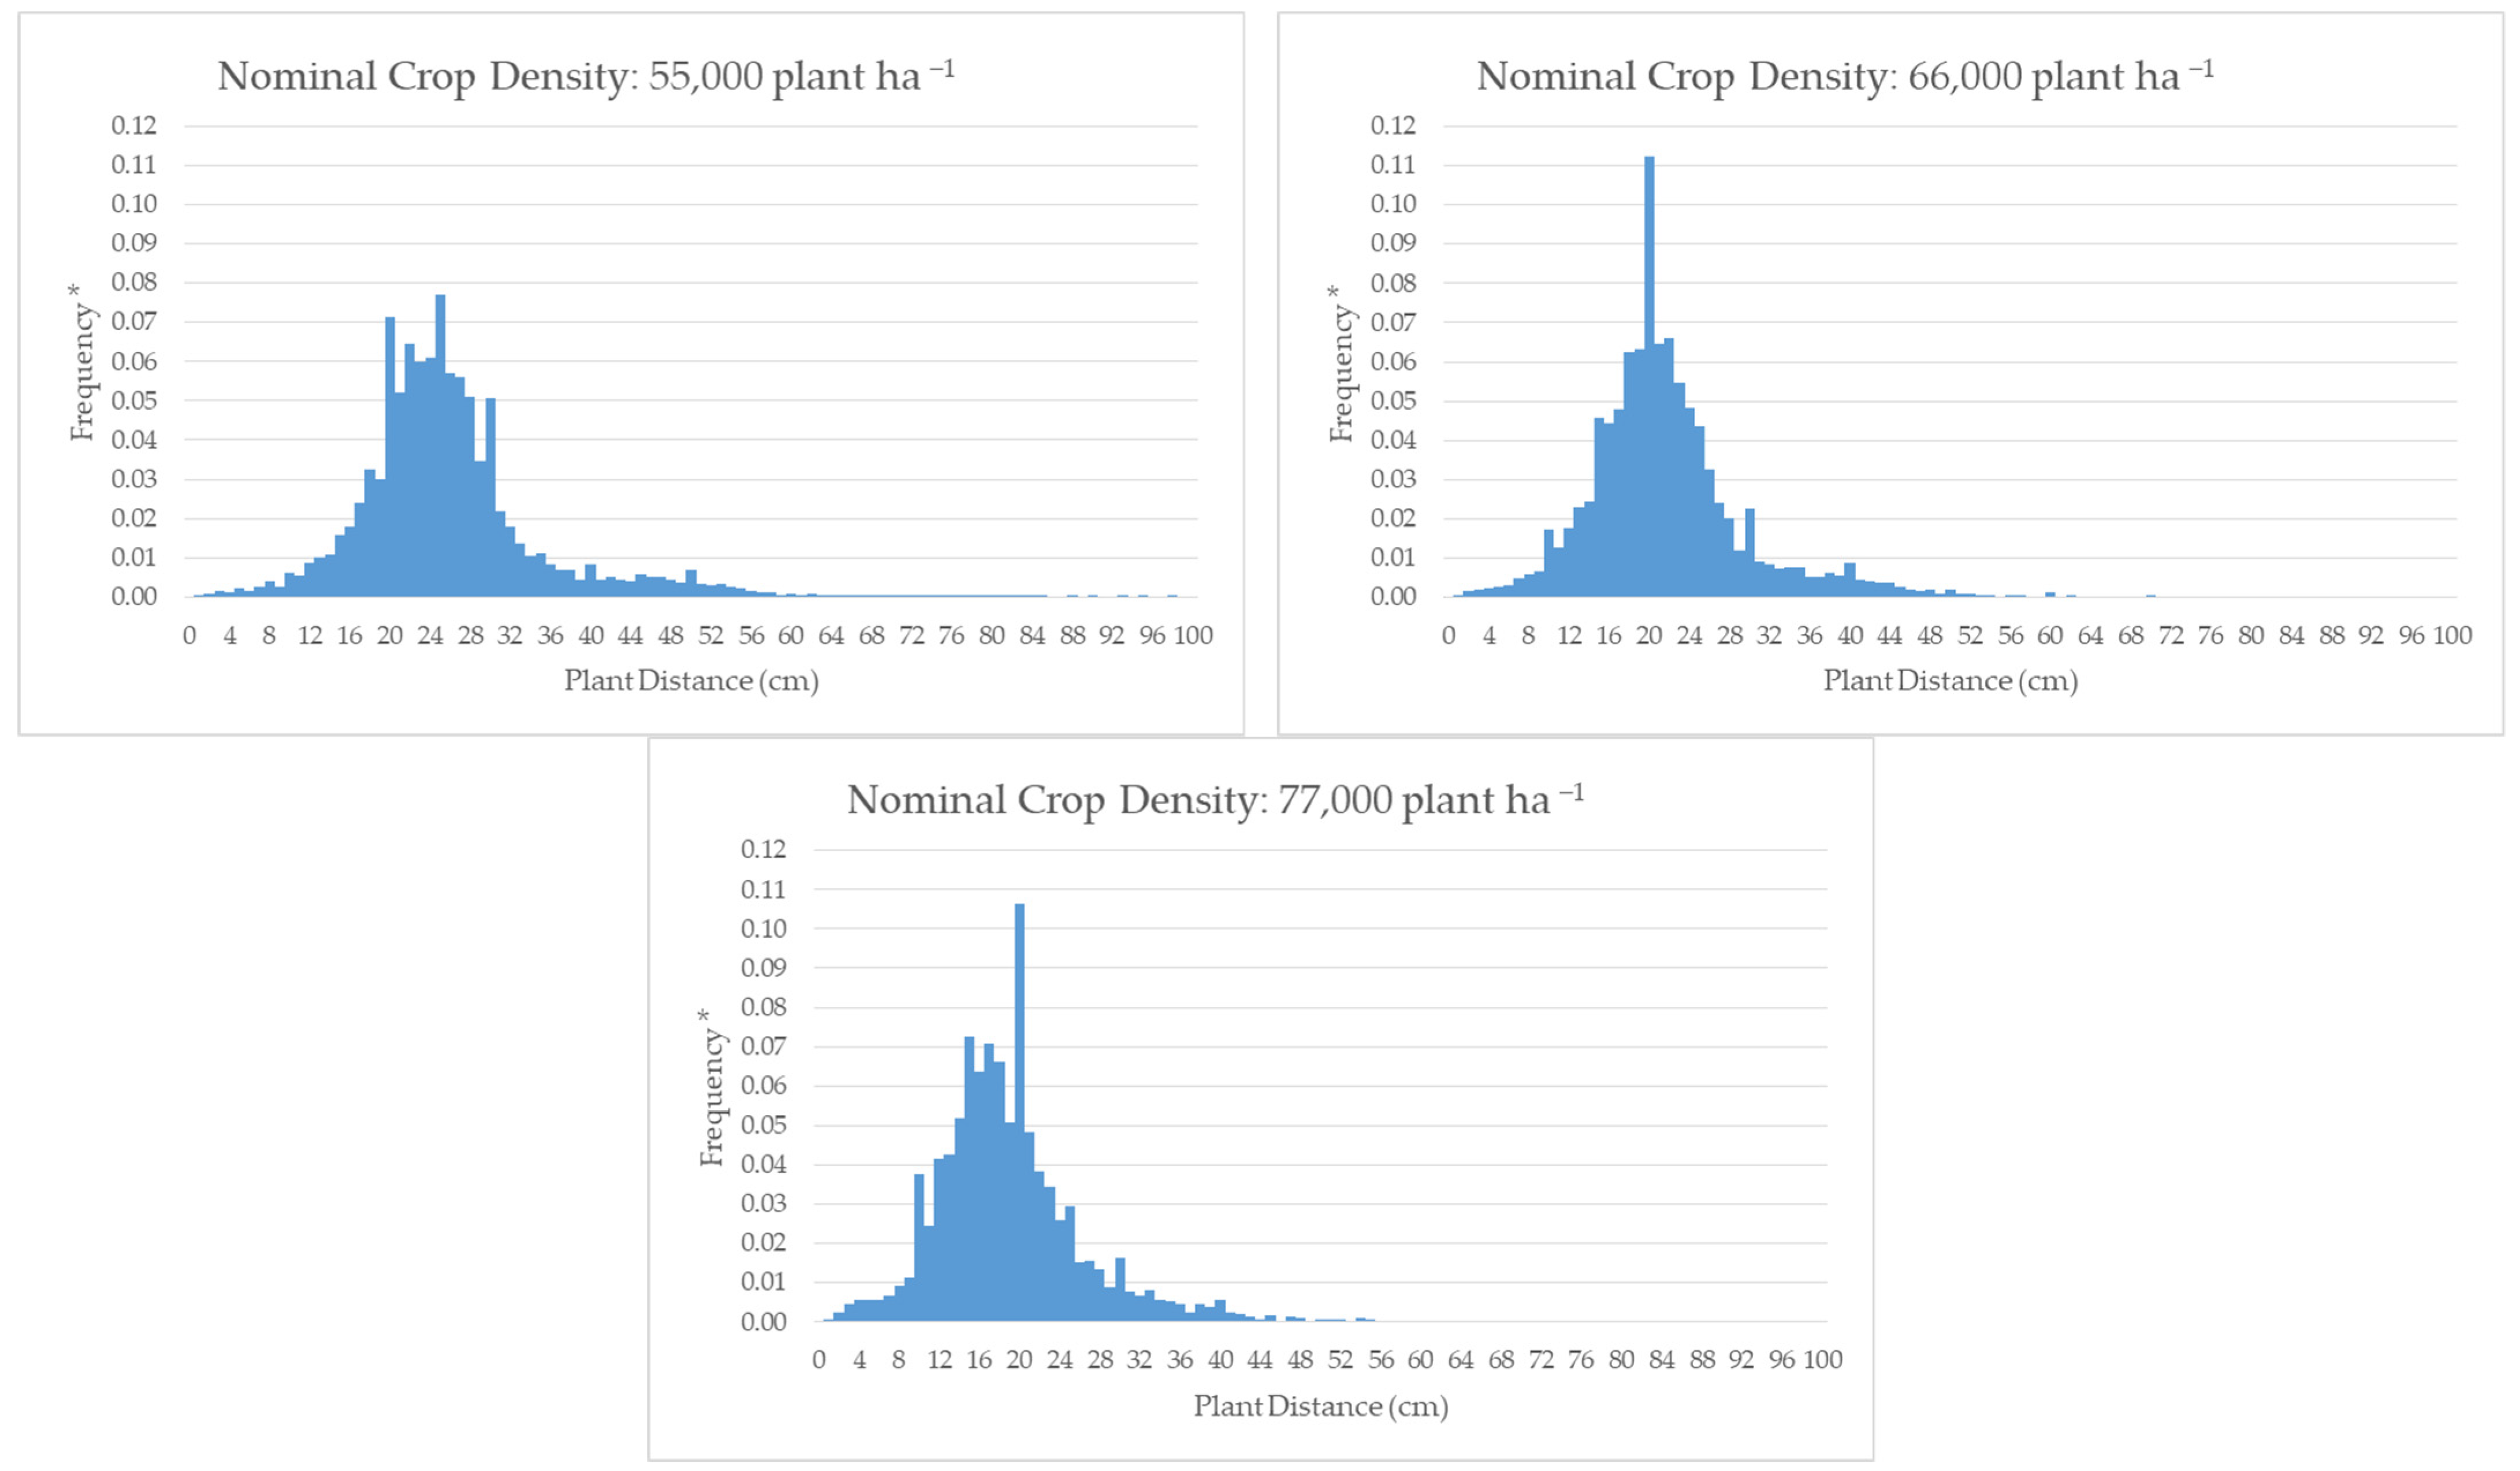
The measured plant distances showed a normal distribution for any nominal crop densities (
Figure 1). Double and missing sowing rates were determined by the difference from the required plant distance. All cases were classified as double sowing where the measured plant distance was less than half of the required plant distance (n = 1829), and as missing sowing where the measured plant distance was larger than 1.5 times the required plant distance (n = 5244). Crop failure was either due to sowing problems or incomplete seed germination (
Table 2). At the same time, cases without double or missing sowing were also selected (n = 41,829).
In the next step, the ratio of double and missing sowing was calculated for each parcel (n = 216). For the determination of sowing uniformity, the relative difference (%) between the measured plant distance and the required plant distance based on the nominal crop density was calculated—excluding cases of missing or double sowing—for each crop-plant (n = 41,829) using the following formula:
where
Dr means the relative difference in plant distance,
dm means the measured plant distance, and
dr means the required plant distance.
The yield data were converted to 1 ha (kg ha−1) and corrected for 8% moisture content. All yield variables (yield, moisture, oil content, thousand seed weight) were tested separately for each plot (n = 216).
All independent and dependent variables are presented in
Table 3.
Before the statistical analysis, the nature of distribution of all of the soil, yield, and seedling quality variables, as well as altitude, were tested in the dataset. Cases where the value of skewness was less than −0.5 (left or negatively skewed) were transformed by square as x
2 transformation, while cases where the value of skewness was higher than +0.5 (right or positively skewed) were transformed by logarithmical, as ln(x + 1) transformation [
44].
2.8. The Process of Data Analysis
In the first step of the statistical analysis, the effect of the field (n = 6), productivity zone (low, average, or high), and crop density level (low, average, or high) were tested by Multi-way Analysis of Variance (Multi-way ANOVA) separately on the yield, seed oil content, seed moisture, thousand seed weight, double sowing, missing sowing at the parcel level (n = 216), and sowing uniformity—excluding cases of missing or double sowing—at the crop level (n = 41,829) [
45]. Significant cases were also tested by Tukey’s post hoc test [
46]. It was originally planned to include the year of the survey as a separate factor in the analysis, but only the field was included as a factor after realising that there was a high proportion of significant differences between the pairs of fields within the same year.
The connections among the soil and environmental variables, and between the group of soil and environmental variables and the group of the yield variables, as well as the group of sowing quality variables, were also tested by Pearson’s correlation analysis at the parcel level (n = 216) [
47].
The next step was to conduct Principal Component Analysis (PCA) to describe the relationships among the fields, as well as the soil and environmental variables. As a part of the analysis, the Principal Components (PCs) with the greatest impact (Initial Eigenvalues above 5%) were selected (4) and the relationships among the selected PCs, field zones (n = 18), as well as the soil (n = 14) and environmental variables (n = 5), were determined [
48].
In the next step, datasets were tested with Analysis of Covariance (ANCOVA) to measure the effect of the Field, covariated by PC
1–4 separately on the yield (yield, moisture, seed oil content, and thousand seed weight) and sowing quality factors (double and missing sowing) at the parcel level (n = 216), and on the sowing uniformity at the plant level (n = 41,829) [
49]. In order to measure the additional explanatory effect of ANCOVAs for each yield and sowing quality variable, the values of partial eta squared were also calculated and compared both for the Field variable and the full factorial model in ANCOVAs [
50].
All statistical analyses were performed in R environment using the corrr, dplyr, and MASS packages at the 95% confidence level.
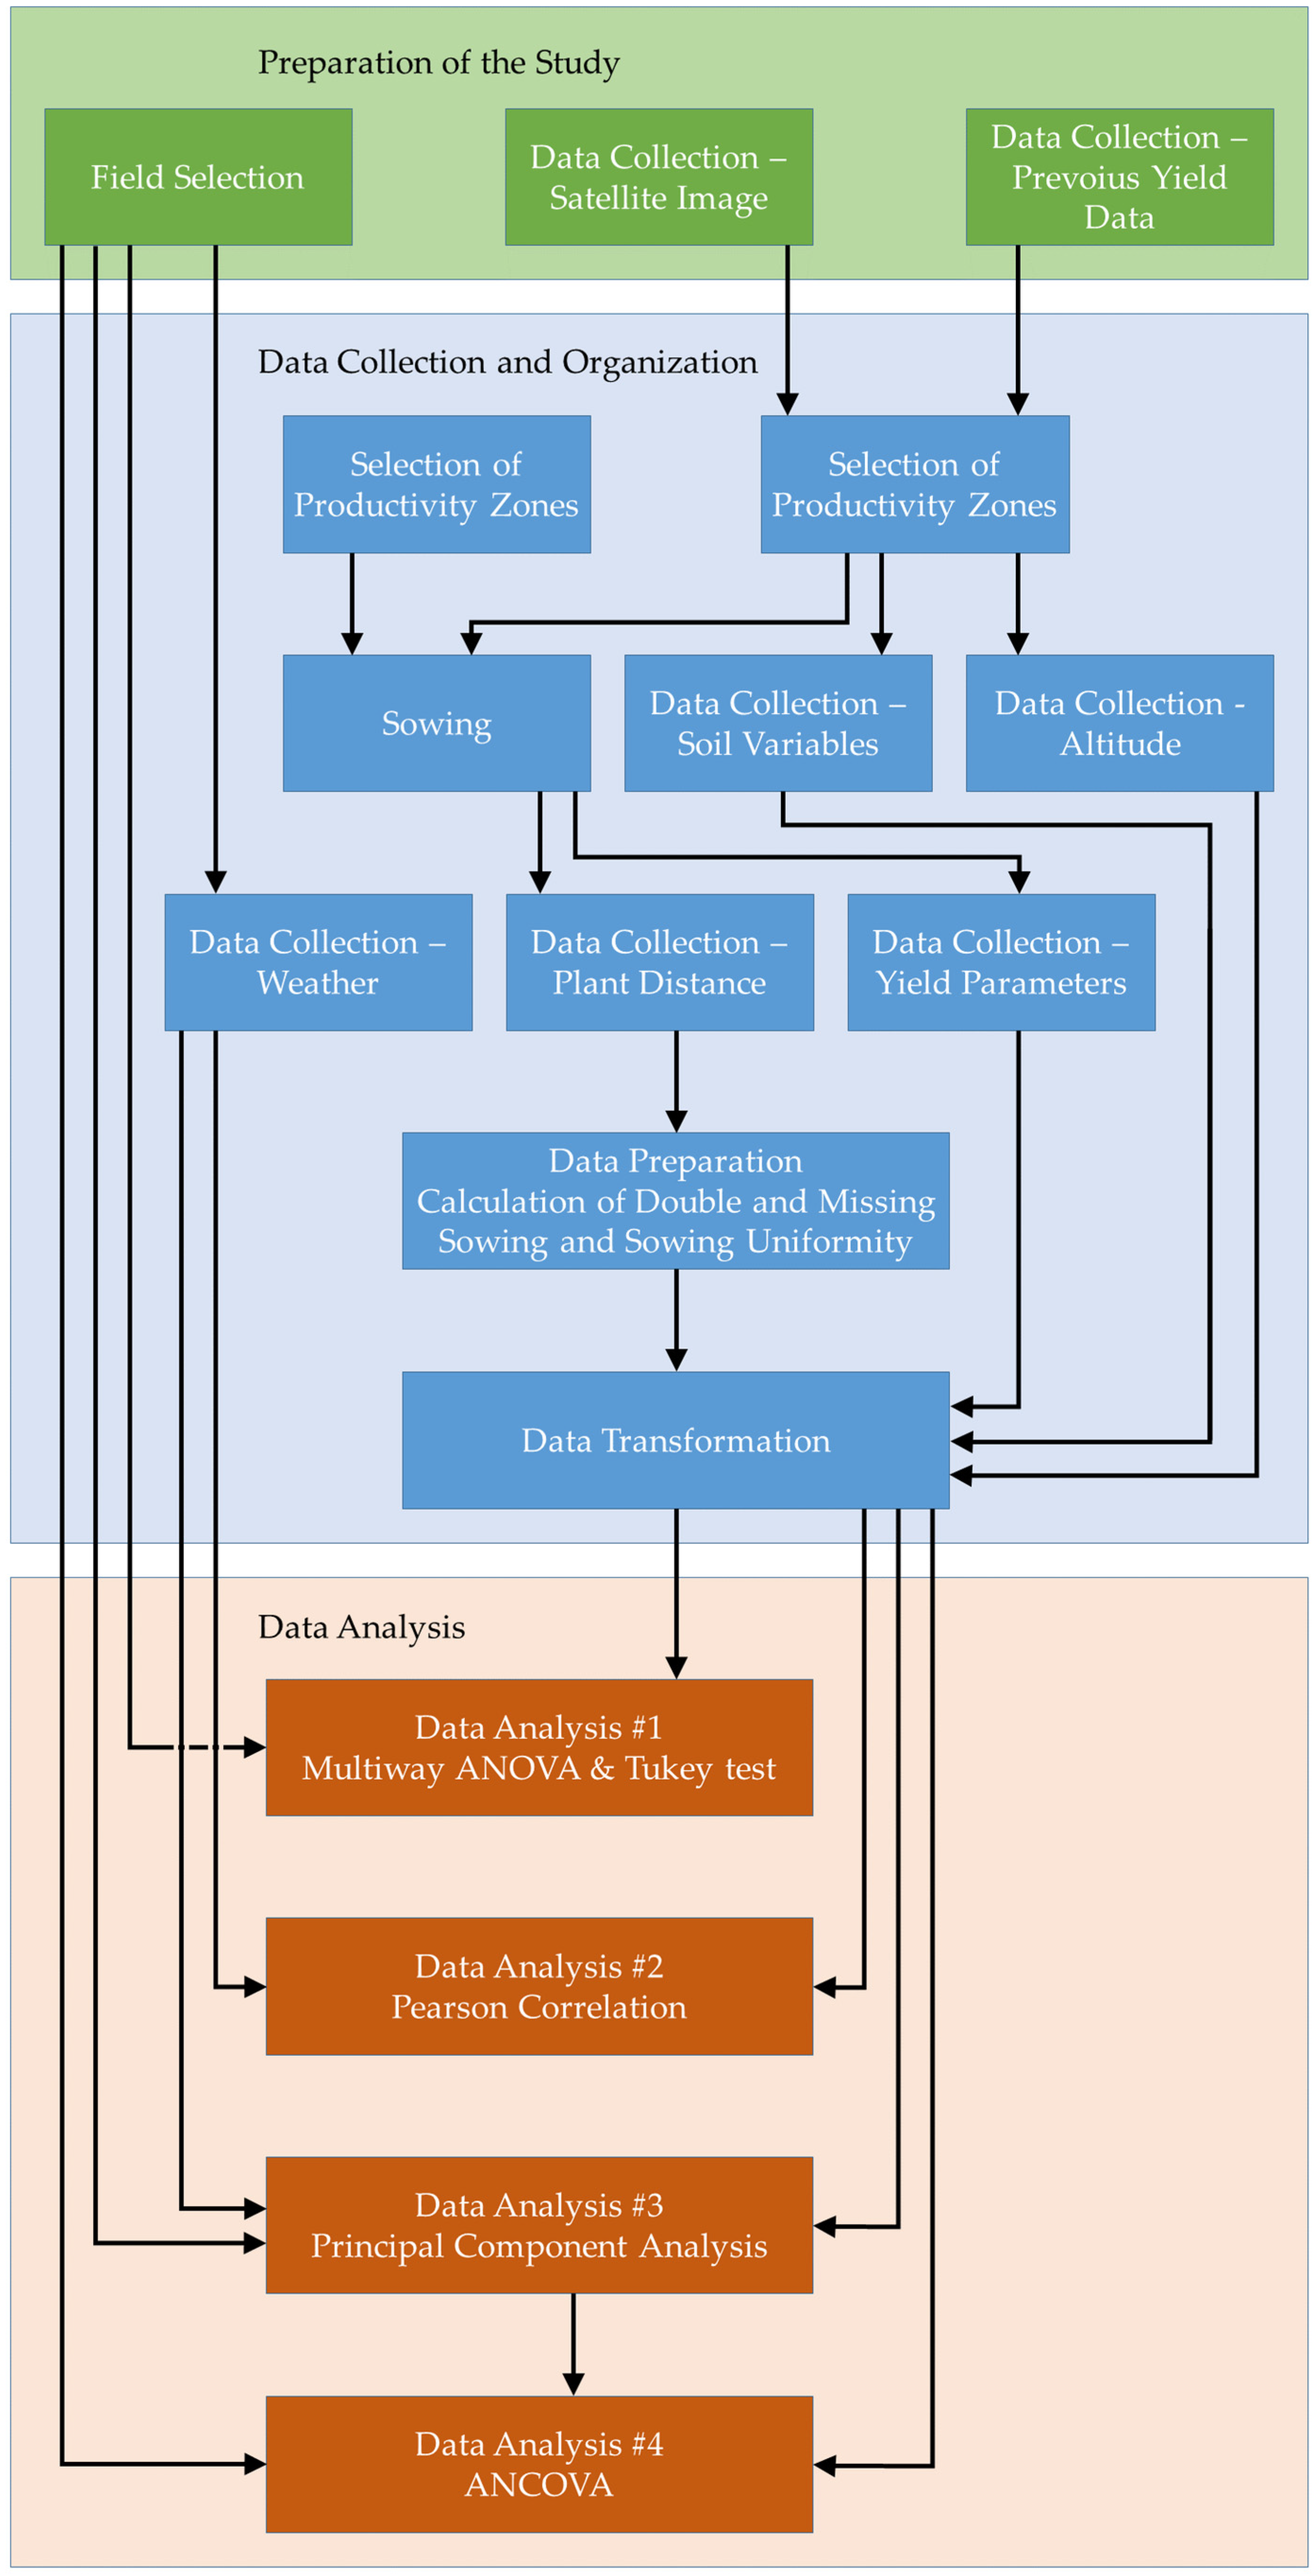
The processes of selection, data collection, data processing, and data analysis used are shown in
Figure A1.
3. Results
3.1. The Effect of the Field Conditions, Productivity Zone, and Crop Density Level on the Yield Variables and Sowing Quality Variables
The obtained results indicate that the year 2021A achieved the highest mean yield of 4262 kg ha−1, while 2022B recorded the lowest yield at 2575 kg ha−1. This substantial difference highlights the impact of the environmental and management factors on crop performance. The field variable resulted in a significant difference in every year of the research, with 499–1075 kg ha−1 yield effect, respectively. The high productivity zone resulted in a 41% higher yield than the zone with low characteristics. As a contrast, the nominal crop density had no significant effect on the yield, resulting in only 32 kg ha−1 difference.
In terms of seed moisture, the obtained data show that 2023A had the highest moisture content at 6.99%, compared to 2023B, which had a lower moisture level of 5.74%. This variation is crucial, as it can affect both the storage and quality of the harvested seeds. The analysis also indicates that the seed moisture levels decreased from low zones (6.33%) to high zones (5.93%), suggesting that environmental conditions in different zones play a significant role in moisture retention. No significant difference was measured when focusing on the effect of the nominal crop density.
Oil content analysis reveals that the field 2021A had the highest oil content at 47.56%, while the field 2022A had the lowest at 42.67%. The data indicate a consistent trend where oil content increased from low density (45.79%) to high density (46.68%), suggesting that higher crop density may enhance oil production. Productivity zones had a significant (p < 0.001) effect, causing lower oil content in the low productivity zone.
The thousand seed weight (TSW) varied significantly, with the field 2023A showing the highest weight at 77.75 g, while the field 2022B had the lowest at 40.66 g. TSW was significantly different only in 2022 and 2023, with 17.92 and 27.24 g difference in favour of the fields 2022A and 2023A. This variation is critical for understanding seed quality and potential yield. Mean weight also increased from low density (55.03 g) to high density (61.58 g), indicating that crop density may positively influence the seed weight.
In conclusion, the obtained data underscores the importance of the year, zone, and crop density in determining yield and quality (
Table 4).
The analysis of sowing metrics, including double sowing, missing sowing, and the relative deviation of crop density and sowing uniformity provides critical insights into crop management practices across various fields, zones, and nominal crop densities.
The obtained results indicate significant differences in the double sowing percentages across different fields and years. Notably, 2022A exhibited the highest mean double sowing percentage at 4.49%, while 2023B recorded the lowest at 2.27%. Tukey’s comparison confirmed that these groups were statistically distinct, emphasising the variability in sowing practices over time. The double sowing rate was significantly affected by the field in 2022 and 2023, with changes of 1.04% and 1.43%, respectively. In terms of zones, the high zone showed a mean double sowing percentage of 4.58%, compared to the low zone’s value of 2.71%, resulting in a significantly higher value of the high zone, i.e., by 1.11% and 1.87%. This finding suggests that environmental conditions in high zones may contribute to increased instances of double sowing, potentially impacting overall crop yield. The obtained results demonstrated that the nominal crop density had a significant effect on the double sowing rate, resulting in a significantly lower value in the low nominal crop density compared to the medium and high ones, respectively.
The analysis of the missing sowing revealed even more pronounced differences, with 2022A having the highest mean percentage at 17.20%, while 2023B had the lowest at 5.90%. Tukey’s comparison indicated significant differences between the examined groups, highlighting the high percentage of the missing sowing in 2022A. The field variable had a significant effect in every year, causing a higher rate of missing sowing in Field 2021B, 2022A, and 2023A (+1.23%, +8.08%, and +4.00%) than in 2021A, 2022B, and 2023B. The zone analysis showed that the high zone had a mean of 11.36%, while the medium zone recorded a lower mean of 9.77%. Significant differences were only measured between the medium and high productivity zones (p < 0.001). Furthermore, the nominal crop density results indicate that the high-density group had the highest mean missing sowing percentage at 13.08%. With the increase of the nominal crop density, there was a significant difference between the traits, resulting in a significantly higher missing sowing rate in the medium nominal crop density compared to the low one (+1.72%), and also in the high nominal crop density compared to the medium (+2.93%). This finding suggests that increased crop density may lead to a higher likelihood of missing seeds.
Sowing uniformity also varied significantly across the fields, zones, and nominal crop density values (
p < 0.001). The highest mean of relative deviation of plant distance was observed in 2022A at 18.72%, while 2023B had the lowest mean value at 14.61%. The difference between the fields was significant in each year, resulting in a significantly lower value for the Field A in 2021 (−1.47%) and higher values in 2022 and 2023 (+1.85% and +1.57%), respectively, than on Field B. The analysis indicated that the high productivity zone had the highest mean relative deviation at 18.17%, significantly higher than 16.37%, when compared to the medium productivity zone and also higher than 14.46%, compared to the low one. This finding suggests that managing the crop density may be more challenging in these areas. The nominal crop density level results further revealed that the high-density group had a significantly higher value in the relative deviation of plant distance, with a mean of 17.63%, indicating a potential correlation between the higher density and increased relative deviation (
Table 5).
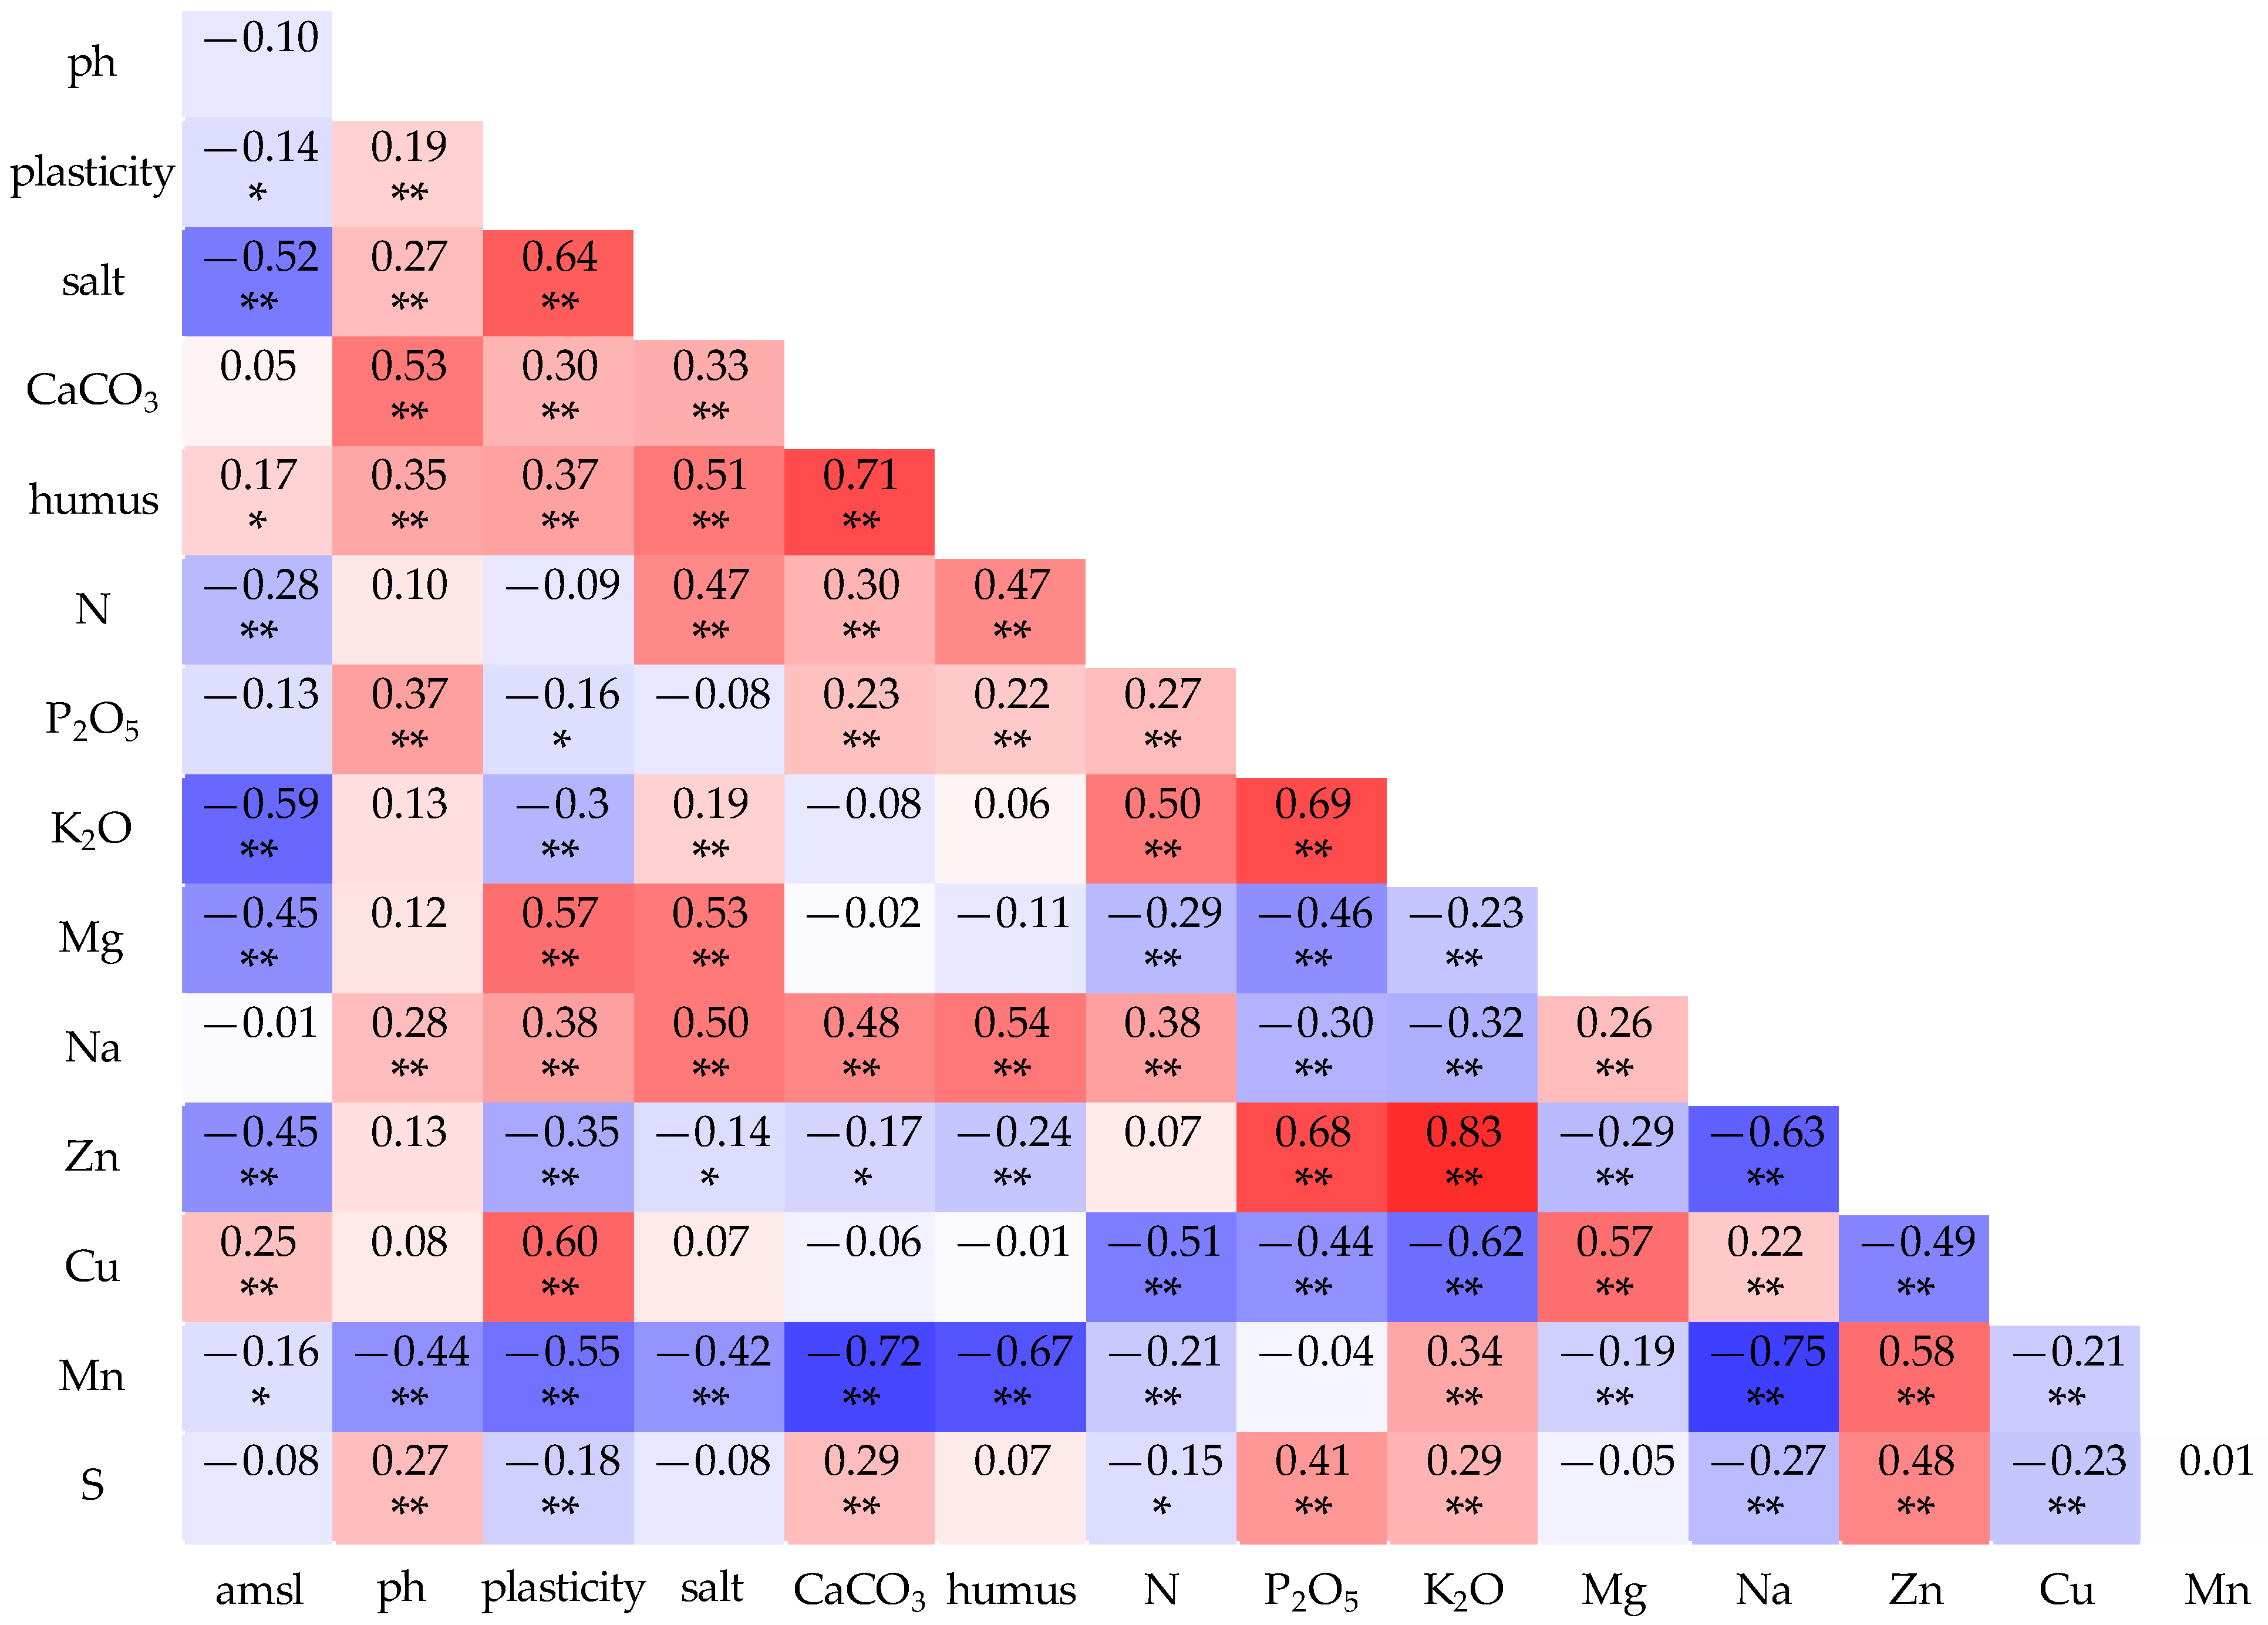
3.2. Examination of the Relationship Between Soil Variables and Altitude
Pearson’s correlation analysis found a correlation between the altitude (amsl) and soil salinity. The correlation was negative, i.e., salinity decreased with increasing altitude (R = −0.52). A similar negative correlation was measured for amsl K
2O, Mg, Zn, where the correlation was also negative, and it had a similar medium strength of significance. The R value was −0.45 for Mg and Zn and −0.59 for K
2O. For AMSL and the other variables, a negative but weak correlation was measured. The highest correlation for the pH was measured with CaCO
3, where the direction of the correlation was positive with a medium significance (R = 0.53), with the same level of significance for the pH and P
2O
5 (R = 0.37), humus (R = 0.35), salinity (R = 0.27), and Na (R = 0.28). The strongest moderate correlations were measured between the soil plasticity and the salt content (R = 0.64) and Mg (0.57) and Cu (R = 0.60) (
p < = 0.015). There was an opposite trend between the soil plasticity and Mn content, where the R value was −0.55 (
p = 0.05). There was a moderately strong correlation between the soil salinity and the humus, nitrogen, Mg, and Na contents, with the highest R value of 0.53 between the Mg content and salinity (
p = 0.05). In the analysis of the CaCO
3 values of the soil, the strongest correlation values were observed for two factors, R = 0.71 (
p = 0.05) for the humus content and an opposite negative correlation R = −0.72 (
p = 0.05) for the Mn content. The correlation between CaCO
3 and Mn for the humus was similar, i.e., a moderate positive correlation. A moderately strong positive correlation was measured for the nitrogen and potassium content, with an R value of 0.5, and a weak correlation with nitrogen for phosphorus. These results suggest that nitrogen and potassium, the most important macroelements for sunflower, are correlated in the soils. Compared to nitrogen, a similar but stronger correlation was measured between phosphorus and potassium, with an R value of 0.69. In the correlation analysis, the strongest correlation was measured between the potassium and Zn content, where the R value was 0.83 (
p = 0.05). These results suggest that the Zn content can be a feasible micronutrient in soil, even for future crops. There was a strong negative correlation between the Na and Mn content, where R was −0.75 (
p = 0.05) (
Figure 2).
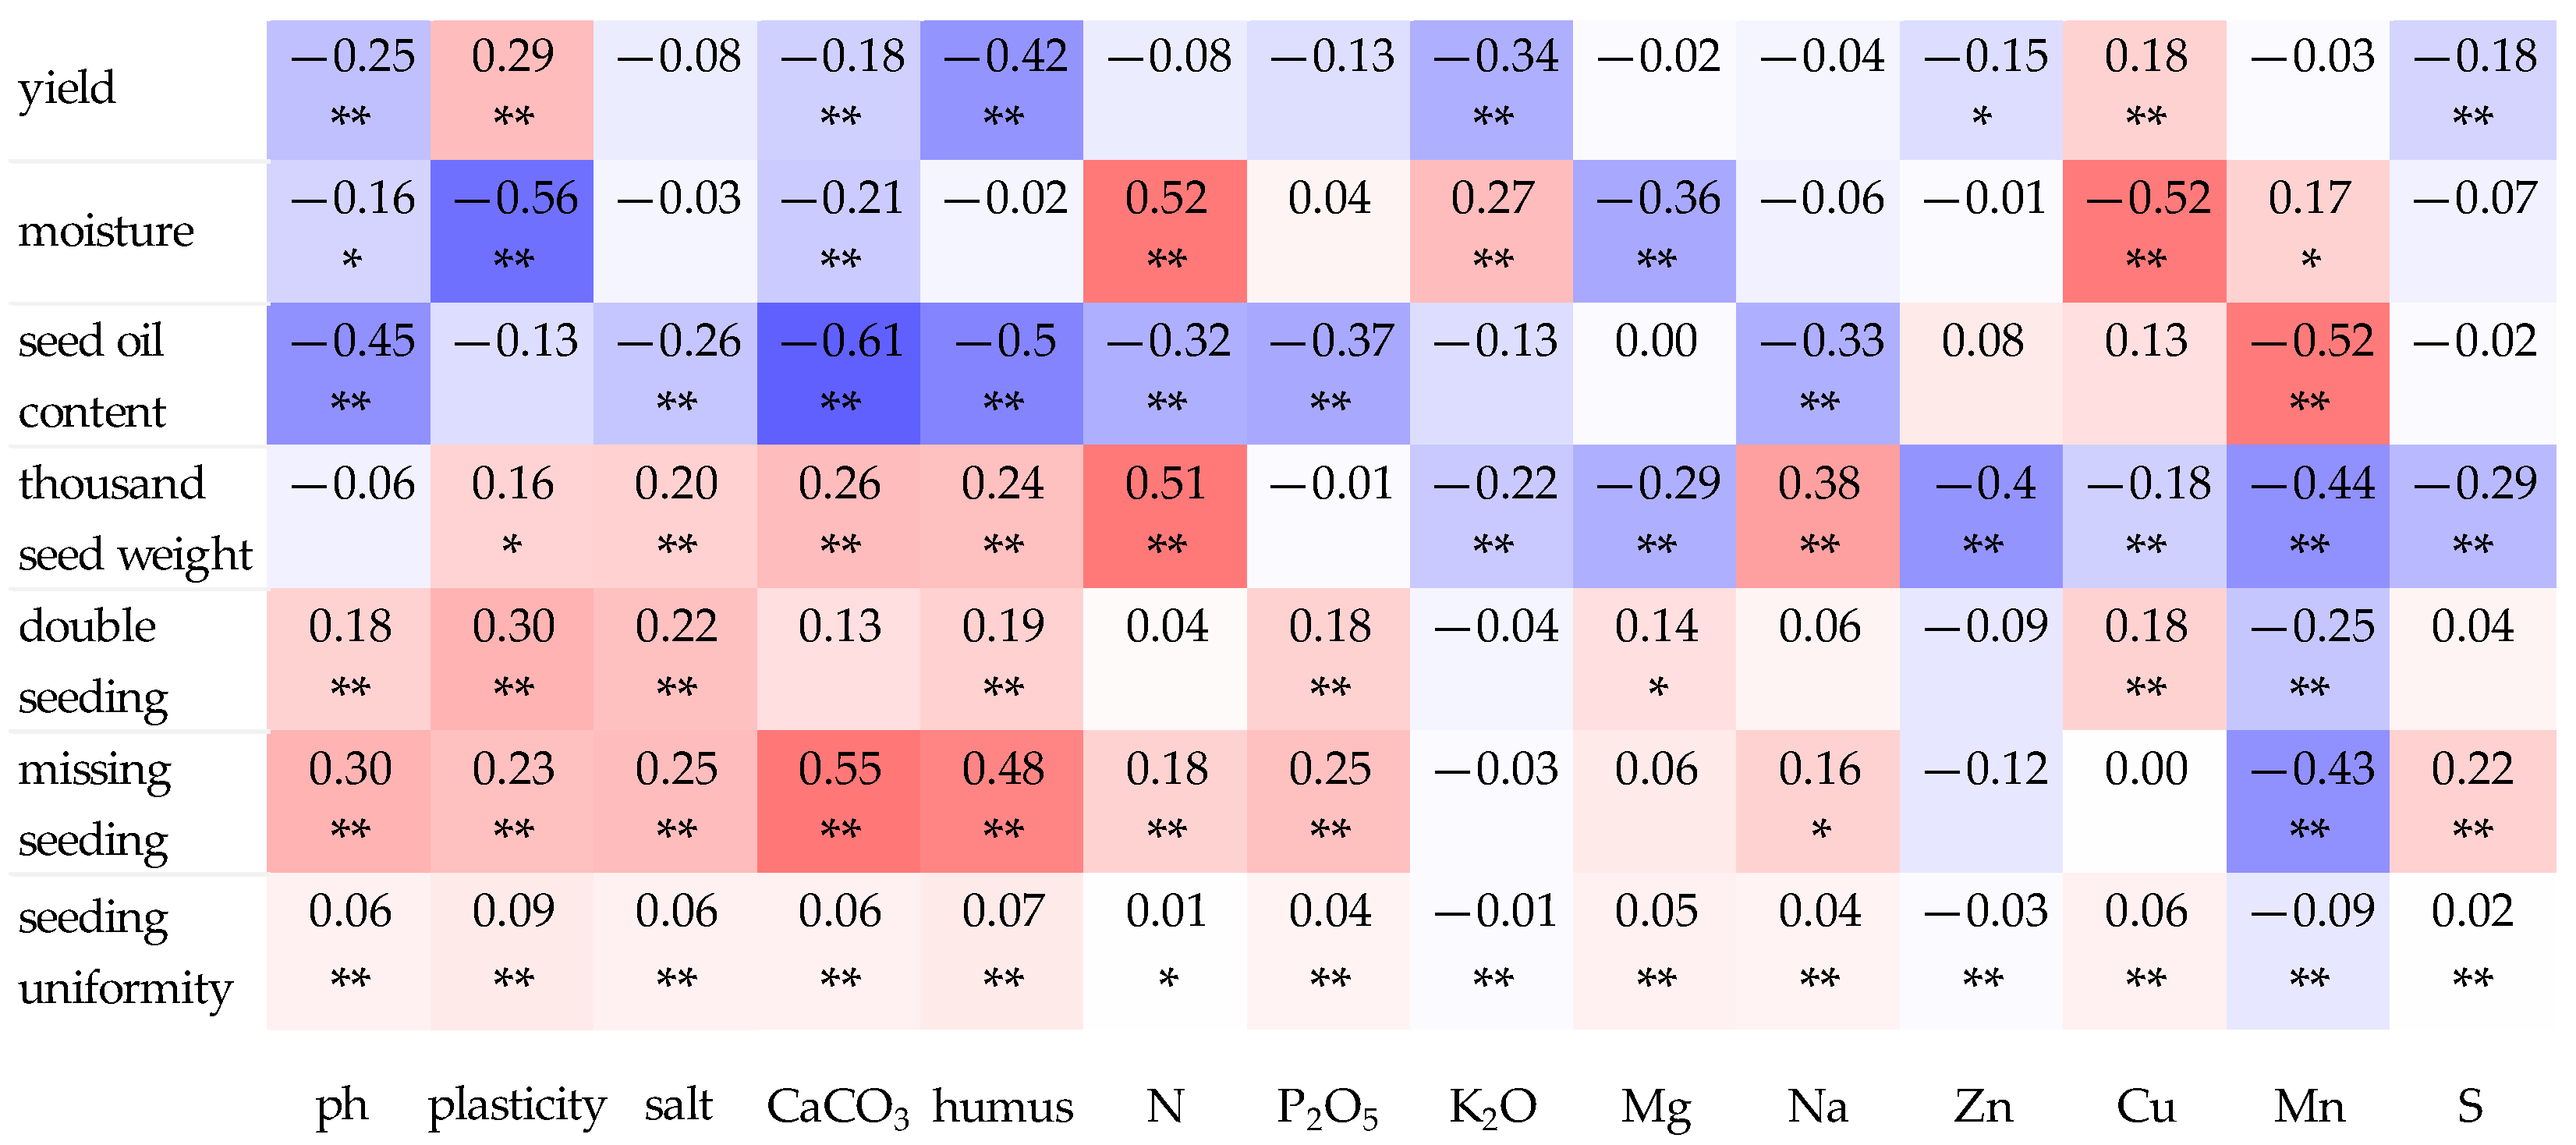
3.3. Effect of the Soil and Environmental Variables on Yield and the Sowing Quality Variables
The yield was most influenced by the soil humus content (R = −0.42) and the soil potassium content (R = −0.34). For both factors, there was a negative to medium strong correlation. The correlation between the moisture content and soil plasticity was –0.56 for R, 0.52 for nitrogen, and −0.52 for Cu, indicating that the nitrogen, copper, and the soil plasticity increased with increasing grain moisture in the area. The factors showing a significant correlation between the oil content of the crop and the examined factors were all negatively correlated, with the strongest correlations being for CaCO
3 (R = −0.61) and Cu (R = −0.52). The thousand seed weight was moderately strongly positively correlated with nitrogen (R = 0.51) and Na (R = 0.38), whereas Zn (R = −0.40) and Mn (R = −0.44) were moderately strongly negatively correlated (
p = 0.05). These results suggest that the increase in nitrogen and Na can be used to estimate the thousand seed weight and to plan the effect of measuring Zn and Mn in relation to thousand seed weight. There was a weak negative correlation between the double sowing rates and Mn (R = −0.25). The missing sowing was more affected by each parameter than the double sowing, as there was a positive medium-strong correlation between CaCO
3 (R = 0.55) and humus (R = 0.48). An opposite correlation with similar strength was measured for Mn and missing sowing. In the case of sowing uniformity, the magnitude of the relationship was significant but low for all measured parameters (
Figure 3).
There was no significant correlation between asml and each parameter, except for thousand seed weight, where a low positive correlation was measured at the
p = 0.10 significance level. As the amount of precipitation increased, yield increased significantly with a medium strong (R = 0.47) positive correlation. Similarly, a positive medium strong correlation with the precipitation was measured for the thousand seed weight and the seed oil, with R = 0.41 and R = 0.43 (
p = 0.05), respectively. In contrast, there was a moderate negative correlation (R = −0.46) between the rainfall and the missing seed values (
p = 0.05). For precipitation and days with 5 mm rain, the same trend was observed for all measured parameters, so that not only the amount of precipitation but also its distribution had a similar influence on both the quantitative and qualitative parameters of the crop. The temperature and the seed oil content resulted in a negative moderately strong correlation (R = 0.57), while there was a positive weak correlation with missing seeds (R = 0.35). There was a negative correlation between the heat days factor and the yield factors tested in most cases, with the strongest correlation between the seed oil content and heat days (R = −0.48) (
Figure 4).
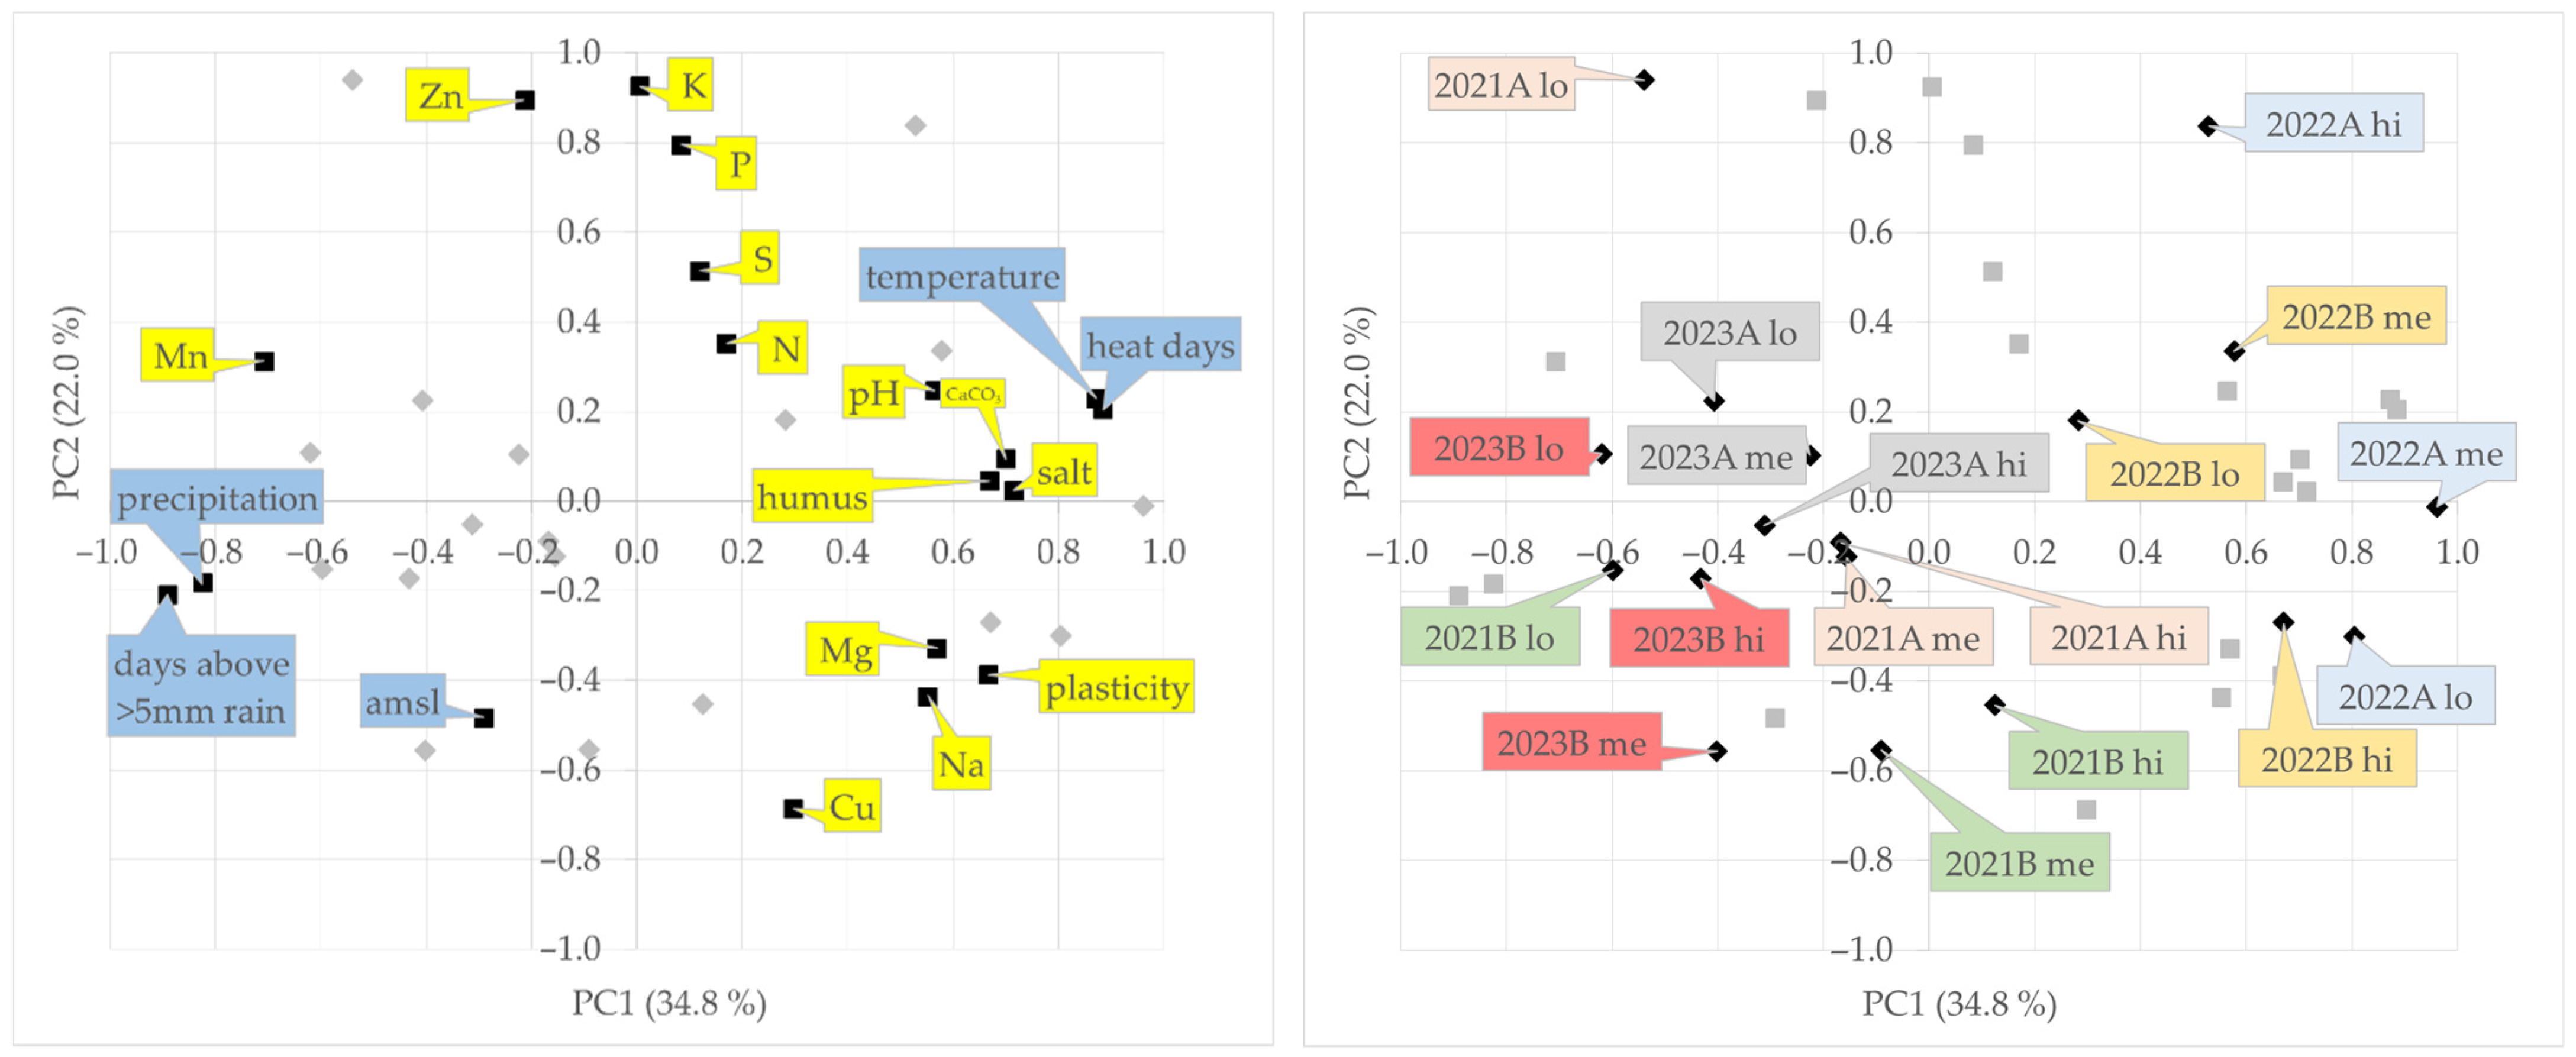
3.4. The Role of the Soil and Environmental Variables in the Field Effects
Based on the data reduction process, a total of four PCs were selected with initial eigenvalues of 34.8, 22.0, 14.6, and 10.6% of variance, and with 82.0% cumulative proportion of the total variance (
Figure 5).
The PCA plot showed a horse-shoe-like pattern in the case of the soil variables but allowed the variables to be grouped together. There were close relationships between the soil plasticity and the soil Na and Mg content, between the soil humus and the lime (CaCO
3) and salt content; between the soil N and S content, and between the soil K and P content. Within the environmental variables, a close relationship was found between the precipitation and the number of days above 5 mm rainfall, as well as between the temperature and the number of heat days. The connection between altitude and the other environmental variables was weak. The PCA plot also described the difference in weather between years, as the highest average temperature and the lowest precipitation was recorded in 2022. When comparing the difference between the management zones within a field and between different fields, it could be seen that the difference between the management zones assigned in the same field was smaller than the difference between the management zones of similar level in different fields, except for the field 2021A and, to a lesser extent, the field 2021B. The connection between the field and soil variables was also significant, but the connection between the productivity zone level and the soil variables was weak. In general, the fields in 2022 had a higher nutrient content—except for Mn, but the fields in 2021 and 2023 were not significantly different from each other. Comparing the effect of the principal components, it can be seen that PC1 influenced all weather and most soil variables, but PC2 had an effect on some soil variables but none of the environmental variables. In the case of the fields and productivity zones, the influence of PC1 was slightly higher than that of PC2 (
Figure 6).
However, no differences were found in the case of the
p values, and the additional explanatory power of the ANCOVAs was evident in the case of all yield and sowing quality variables by the increase of 1.0–36.3% of partial eta squared values. The independent explanatory effect of the Field variable was the highest for the yield, moisture, and the thousand seed weight (69.4, 60.7, and 68.7%), but it could be increased to 76.6, 76.4, and 86.3% in a full factorial model. The weak independent explanatory effect of the Field variable for the oil content (21.2%) and the missing sowing (29.3) was also increased by the full factorial model, but these values achieved only 57.5 and 53.0%, respectively. In the case of double sowing and sowing uniformity, both the independent explanatory effect of the Field and the effect of the full factorial model were weak (
Table 6).
4. Discussion
The observed negative correlations between the altitude and the soil salinity (R = −0.52), as well as with the K
2O, Mg, and Zn concentrations, aligned with findings from various studies examining the influence of elevation on the soil properties. Egyptian researchers demonstrated a strong inverse relationship between surface elevation and the soil salinity, with higher altitudes exhibiting lower electrical conductivity (EC) values. This trend was quantified using regression models, which produced R
2 values up to 0.94, indicating that elevation is a significant predictor of the soil salinity in enclosed desert depressions [
51]. Similarly, a study investigating the effects of the altitude on the soil plasticity and quality found that the soil EC decreased with increasing elevation, suggesting reduced salt accumulation at higher altitudes. This pattern was attributed to factors such as the decreased accumulation of base-forming cations such as Ca
2+, Mg
2+, and K
+, and lower levels of CaCO
3 at higher elevations [
52]. These findings are consistent with the negative correlations observed between the altitude and the K
2O, Mg, and Zn content in the current study. The positive correlation between soil pH and CaCO
3 content (R = 0.53) was corroborated by the research indicating that higher CaCO
3 concentrations can lead to increased soil pH due to the buffering capacity of the carbonate minerals. This relationship influences the availability of micronutrients, as increased pH levels can decrease the solubility of elements such as Fe, Mn, Cu, and Zn, thereby reducing their bioavailability [
53]. The strong positive correlations between the soil plasticity and both the salinity (R = 0.64) and Mg content (R = 0.57) suggest that finer-textured soils, which have higher clay content, may retain more salts and magnesium. This finding is supported by studies showing that soils with higher clay and organic matter content have significantly higher micronutrient concentrations, including Mg [
53]. Conversely, the negative correlation between soil plasticity and Mn content (R = −0.55) may indicate that coarser-textured soils, with lower clay content, have reduced Mn retention capacity [
54].
The highest yield was measured in 2021A (4262 kg ha
−1) and the lowest in 2022B (2575 kg ha
−1). Environmental factors and the productivity zones had a major impact on the yield, with high zones producing 41% more on average. The seed moisture content varied, with 2023A having the highest moisture at 6.99%. The oil content increased with crop density, while the thousand seed weight (TSW) was the highest in 2023A (77.75 g). The crop density and the productivity zones were crucial in affecting the seed quality and yield [
55].
The humus and potassium content of the soil negatively impacted yield, with correlation coefficients of −0.42 and −0.34, respectively. The 2022 growing season had low yields but high humus content in these fields; Orehovacki et al. (2009) [
56] obtained the opposite results in their experiment. When the soil humus content was examined, the humus content was associated with lower yields in some fields, suggesting that the effect of crop year on yield is stronger than the effect of the humus content in the zone. A similar result was obtained by Demydenko (2018) [
57], according to which the crop rotation and the different seasons, as well as the use of fertilisers and different tillage systems, were all factors that strongly influenced the humus status of the soils, strongly connected to the achievable yield. The grain moisture was positively influenced by the nitrogen and copper content, as well as the soil plasticity. Similar results were achieved by Tahoun et al., (2022) [
58]. Oil content had negative correlations with the CaCO
3 (−0.61) and copper content (−0.52). The thousand seed weight showed a positive correlation with the nitrogen (0.51) and sodium contents (0.38), while the zinc (−0.40) and manganese contents (−0.44) were negatively correlated. These results suggest that nitrogen and sodium can help in estimating the seed weight [
59], while zinc and manganese affect it negatively.
The altitude and the thousand seed weight did not demonstrate significant correlations with the other parameters. Precipitation had a medium strong positive correlation with yield (R = 0.47) and the thousand seed weight (R = 0.41). The same results were measured by Stephens and Lyons (1998) [
60], Nugroho et al. (2003) [
61], and Ray et al. (2015) [
62]. Also, a medium strong positive correlation was found between precipitation and the seed oil content (R = 0.43), while it negatively correlated with the missing seed values (R = −0.46). Precipitation influenced the crop quantity and quality. Temperature negatively correlated with the seed oil content (R = −0.57). The same result was found by Wang et al. (2023) [
63], i.e., heat days had a negative impact on yield, with the strongest negative correlation being observed for the seed oil content (R = −0.48).
The manganese content was found to be negatively correlated with several factors that are important for soil quality classification, such as the pH, plasticity, and the salt, CaCO
3, humus, nitrogen, and sodium contents of the soil. Saniga et al. (2005) [
64] found a similar relationship between plasticity and nutrient content on plant growth. Based on these relationships, the development of the crop quality and quantity parameters is, in many cases, a result of a number of physiological and biological processes in addition to the quality parameters of the crop. By taking this knowledge into account, farmers can even differentiate their crops by paying attention to missing and double seeds and relying on the zonal values of the area in question, using the relationship between these factors.
The performed analysis showed that precipitation and its distribution had a significant positive effect on yield, the thousand seed weight, and the seed oil content. Similarly to the results of van der Merwe (2015) [
65], the temperature and heat days negatively influenced the seed oil content and yield. The PCA plot grouped the soil variables, showing strong relationships between the soil plasticity and the Na and Mg, humus and CaCO
3 and salt, N and S, and K and P contents. Environmental variables such as precipitation and rainy days, as well as temperature and heat days, were closely related, similarly to the results of Hardwick Jones et al. (2010) [
66]. Altitude showed weak connections with the other environmental factors. Weather differences were notable between the examined years, with 2022 having the highest temperature and lowest precipitation; in this year, the humus content did not have any significant effect on yield. Management zones within the same field had smaller differences than those between the similar zones across fields, except for the 2021A and 2021B fields. These results were contrary to those of Kumar et al. (2022) [
67], who concluded that spatial variability in nutrients caused significant spatial variability in the plant growth and yield across the field.
Altogether, the limitations of the current research are two-sided in nature, i.e., both agronomic and mechanical. Agronomically, the spatial and temporal variability in the soil structure and the moisture levels can affect early plant development, including the fact that the crop year and the field effects could not be evaluated individually as a consequence of the applied crop rotation. With regard to the mechanical obstacles, precision seeders have certain limitations in terms of adapting to heterogeneous field conditions, particularly in maintaining consistent sowing depth, spacing, and seed singulation in soils with a variable extent of compaction or residue cover.
Future research should prioritise the co-development of agronomic strategies and advanced seeder technologies for sunflower cultivation, including economic aspects, with short- and long-term cost-efficiency analyses.
5. Conclusions
The soil composition, crop density, and environmental conditions interact in complex ways to determine crop yields and yield quality. Based on the obtained results, potassium was observed to negatively affect productivity, while nitrogen and sodium influenced seed weight. The use of management zones and the spatial variability within and among fields contributed to differences in the crop performance. The authors concluded that nutrient interactions further complicated this relationship; for example, a positive correlation between the soil pH and calcium carbonate (CaCO3) levels influenced the availability of micronutrients, thereby affecting the crop outcomes across different field zones.
As a conclusion and key outcome for precision sowing, the present research demonstrated that variability in sowing parameters—such as rates of double and missing sowing, as well as sowing uniformity—was significantly influenced by the field conditions, productivity zones, and the nominal crop density. These findings underscore the importance of implementing site-specific management strategies to optimise sunflower production and maximise yield.
Overall, of the various factors influencing sunflower production, the crop year proved to be more significant than the soil parameters, due to the strong influence of the annual climatic variability. The field zone was also identified as a more critical determinant of the sowing and yield variability than crop density, highlighting the importance of spatial management within fields and indicating possible directions for future research.


 ,
, 


