Greenhouse Environment Sentinel with Hybrid LSTM-SVM for Proactive Climate Management


Abstract
1. Introduction
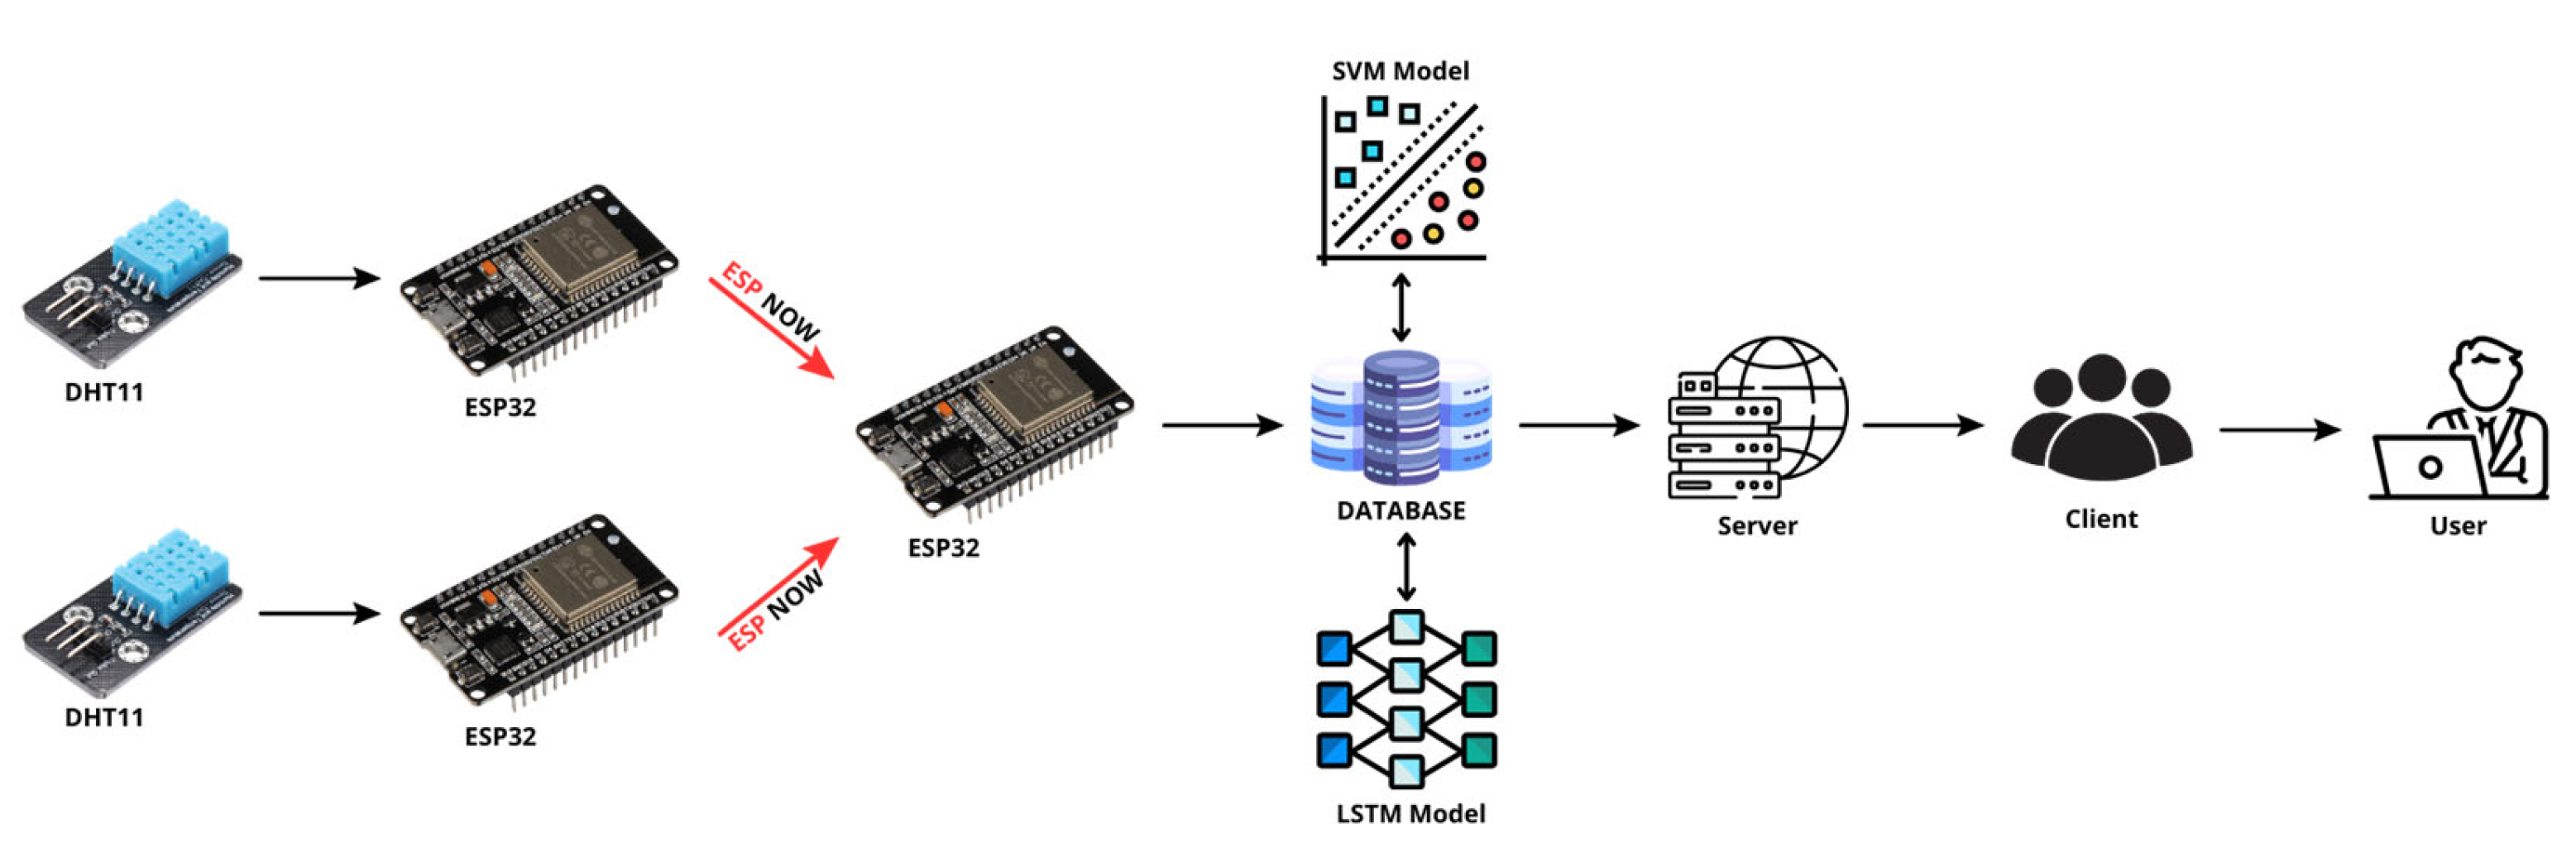
2. Materials and Methods
- LSTM: As a specialized form of Recurrent Neural Network, LSTM is utilized for time-series forecasting. It detects long-term patterns in the collected data, allowing for highly precise predictions of future conditions like temperature and humidity. This enables proactive adjustments to ensure that the greenhouse environment remains ideal for plant growth [64].
- SVM: The Support Vector Machine algorithm is applied for climate classification, categorizing environmental conditions into predefined labels such as “optimal”, “suboptimal”, or “critical”. By identifying complex relationships within the input data, the SVM enables data-driven decision making to maintain or modify greenhouse conditions as needed [65].
Machine Learning Models’ Efficacy
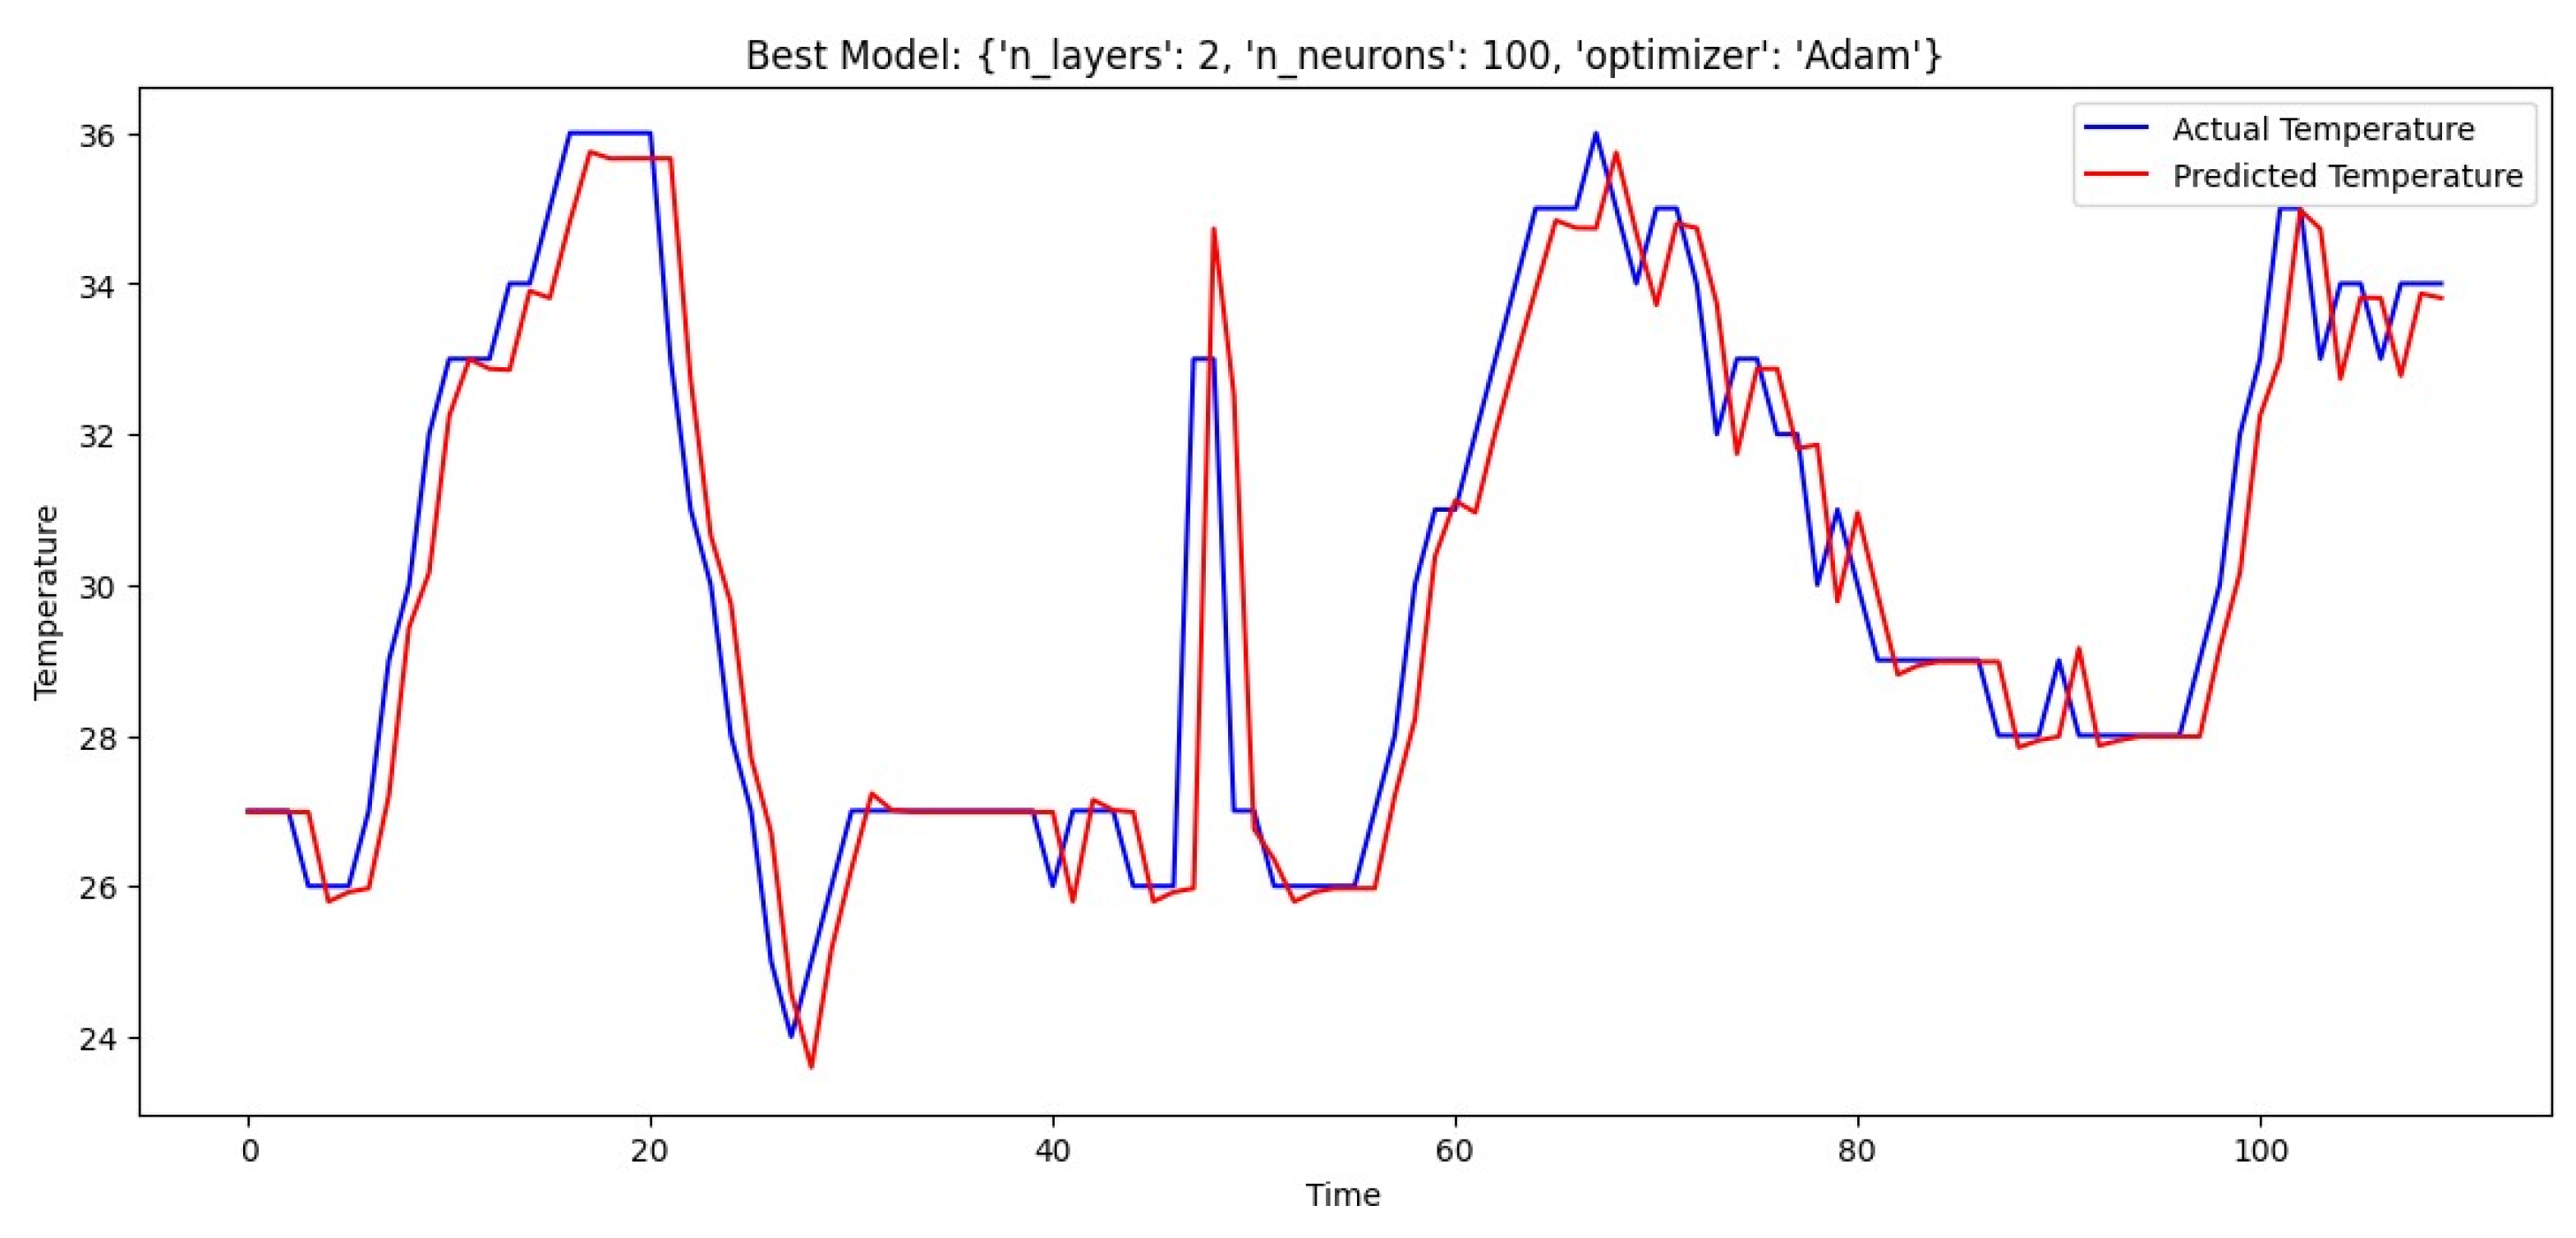
3. Results
4. Discussion
4.1. Comparative Performance of Machine Learning Models
4.2. Parameter-Specific Model Performance
4.3. Classification Performance
4.4. Advancements over Existing Solutions
5. Conclusions
Author Contributions
Funding
Data Availability Statement
Acknowledgments
Conflicts of Interest
Abbreviations
| SVM | Support Vector Machine |
| LDA | Linear Discriminant Analysis |
| KNN | K-Nearest Neighbors |
| RBF | Radial Basis Function |
| LSTM | Long Short-Term Memory |
| RMSE | Root-Mean-Square Error |
| MAE | Mean Absolute Error |
| R² | Coefficient of Determination |
| AI | Artificial Intelligence |
| IoT | Internet of Things |
| CEA | Controlled Environment Agriculture |
| DL | Deep Learning |
| GDD | Growing Degree Day |
| ML | Machine Learning |
| NLP | Natural Language Processing |
| TP | True Positive |
| TN | True Negative |
| FP | False Positive |
| FN | False Negative |
| 1D CNN | 1D Convolutional Neural Network |
| GRU | Gated Recurrent Unit |
| Simple RNN | Simple Recurrent Neural Network |
References
- Patel, V.K.; Singh, L.P.; Sharma, D.; Singh, K.; Sudan, S.; Koul, V.K. Trends in Greenhouse Production Technology with Special Reference to Protected Cultivation of Horticultural Crops. Int. J. Multidiscip. Res. 2024, 6, 1–2. [Google Scholar] [CrossRef]
- Battikh, A.; Zaid, R.; Tayeh, A.; Kittana, A.; Jallad, J.; Alsadi, S.; Foqha, T.; Alahdal, D.; Kanan, M. Greenhouse Automation using ESP32: A Comprehensive Study on Monitoring and Controlling Environmental Parameters for Optimal Plant Growth. In Proceedings of the 2023 2nd International Engineering Conference on Electrical, Energy, and Artificial Intelligence (EICEEAI), Zarqa, Jordan, 27–28 December 2023; pp. 1–6. [Google Scholar] [CrossRef]
- Abdullah, N.; Durani, N.A.B.; Bin Shari, M.F.; Siong, K.S.; Hau, V.K.W.; Siong, W.N.; Ahmad, I.K.A. Towards Smart Agriculture Monitoring Using Fuzzy Systems. IEEE Access 2021, 9, 4097–4111. [Google Scholar] [CrossRef]
- Shamshiri, R.R.; Hameed, I.A.; Thorp, K.R.; Balasundram, S.K.; Shafian, S.; Fatemieh, M.; Sultan, M.; Mahns, B.; Samiei, S. Greenhouse Automation Using Wireless Sensors and IoT Instruments Integrated with Artificial Intelligence; IntechOpen: London, UK, 2021. [Google Scholar] [CrossRef]
- Bersani, C.; Ruggiero, C.; Sacile, R.; Soussi, A.; Zero, E. Internet of Things Approaches for Monitoring and Control of Smart Greenhouses in Industry 4.0. Energies 2022, 15, 3834. [Google Scholar] [CrossRef]
- Nassar, J.M.; Khan, S.M.; Villalva, D.R.; Nour, M.M.; Almuslem, A.S.; Hussain, M.M. Compliant plant wearables for localized microclimate and plant growth monitoring. npj Flex. Electron. 2018, 2, 24. [Google Scholar] [CrossRef]
- Huang, W.; Wang, X. The Impact of Technological Innovations on Agricultural Productivity and Environmental Sustainability in China. Sustainability 2024, 16, 8480. [Google Scholar] [CrossRef]
- Pathak, S.K. Strategic Management of Eco-Innovation and Emerging Technologies for Sustainability in Agro-Based Industries. Int. J. Multidiscip. Res. 2024, 6, 5. [Google Scholar] [CrossRef]
- Yao, S.; Wu, G. Research on the Efficiency of Green Agricultural Science and Technology Innovation Resource Allocation Based on a Three-Stage DEA Model—A Case Study of Anhui Province, China. Int. J. Environ. Res. Public Health 2022, 19, 13683. [Google Scholar] [CrossRef]
- Shanto, S.S.; Rahman, M.; Oasik, J.M.; Hossain, H. Smart Greenhouse Monitoring System Using Blynk IoT App. J. Eng. Res. Rep. 2023, 25, 94–107. [Google Scholar] [CrossRef]
- Liang, X.-Z.; Wu, Y.; Chambers, R.G.; Schmoldt, D.L.; Gao, W.; Liu, C.; Liu, Y.-A.; Sun, C.; Kennedy, J.A. Determining climate effects on US total agricultural productivity. Proc. Natl. Acad. Sci. USA 2017, 114, E2285–E2292. [Google Scholar] [CrossRef]
- Njuki, E.; Bravo-Ureta, B.E.; O’donnell, C.J. A new look at the decomposition of agricultural productivity growth incorporating weather effects. PLoS ONE 2018, 13, e0192432. [Google Scholar] [CrossRef]
- Anandhi, A. Growing degree days—Ecosystem indicator for changing diurnal temperatures and their impact on corn growth stages in Kansas. Ecol. Indic. 2016, 61, 149–158. [Google Scholar] [CrossRef]
- Parent, B.; Leclere, M.; Lacube, S.; Semenov, M.A.; Welcker, C.; Martre, P.; Tardieu, F. Maize yields over Europe may increase in spite of climate change, with an appropriate use of the genetic variability of flowering time. Proc. Natl. Acad. Sci. USA 2018, 115, 10642–10647. [Google Scholar] [CrossRef] [PubMed]
- Li, Y.; Guan, K.; Schnitkey, G.D.; DeLucia, E.; Peng, B. Excessive rainfall leads to maize yield loss of a comparable magnitude to extreme drought in the United States. Glob. Chang. Biol. 2019, 25, 2325–2337. [Google Scholar] [CrossRef]
- Campos, M.N.; Sevilla, P.M.; Montoya, J.M.; Cárdenas, O.L.; Torres, M.L.d.G.; García, L.A.S. Rainfall Potential and Consequences on Structural Soil Degradation of the Most Important Agricultural Region of Mexico. Atmosphere 2024, 15, 581. [Google Scholar] [CrossRef]
- Benami, E.; Jin, Z.; Carter, M.R.; Ghosh, A.; Hijmans, R.J.; Hobbs, A.; Kenduiywo, B.; Lobell, D.B. Uniting remote sensing, crop modelling and economics for agricultural risk management. Nat. Rev. Earth Environ. 2021, 2, 140–159. [Google Scholar] [CrossRef]
- Dobhal, S.; Kumar, R.; Bhardwaj, A.K.; Chavan, S.B.; Uthappa, A.R.; Kumar, M.; Singh, A.; Jinger, D.; Rawat, P.; Handa, A.; et al. Global assessment of production benefits and risk reduction in agroforestry during extreme weather events under climate change scenarios. Front. For. Glob. Chang. 2024, 7, 1379741. [Google Scholar] [CrossRef]
- Semeraro, T.; Scarano, A.; Leggieri, A.; Calisi, A.; De Caroli, M. Impact of Climate Change on Agroecosystems and Potential Adaptation Strategies. Land 2023, 12, 1117. [Google Scholar] [CrossRef]
- Monjezi, P.H.; Taki, M.; Mehdizadeh, S.A.; Rohani, A.; Ahamed, S. Prediction of Greenhouse Indoor Air Temperature Using Artificial Intelligence (AI) Combined with Sensitivity Analysis. Horticulturae 2023, 9, 853. [Google Scholar] [CrossRef]
- Maraveas, C. Incorporating Artificial Intelligence Technology in Smart Greenhouses: Current State of the Art. Appl. Sci. 2023, 13, 14. [Google Scholar] [CrossRef]
- Chukwunweike, J.N.; Eze, C.C.; Abubakar, I.; Izekor, L.O.; Adeniran, A.A. Integrating deep learning, MATLAB, and advanced CAD for predictive root cause analysis in PLC systems: A multi-tool approach to enhancing industrial automation and reliability. World J. Adv. Res. Rev. 2024, 23, 2538–3557. [Google Scholar] [CrossRef]
- Haut, J.M.; Paoletti, M.E.; Moreno-Alvarez, S.; Plaza, J.; Rico-Gallego, J.-A.; Plaza, A. Distributed Deep Learning for Remote Sensing Data Interpretation. Proc. IEEE 2021, 109, 1320–1349. [Google Scholar] [CrossRef]
- Yan, P.; Abdulkadir, A.; Luley, P.-P.; Rosenthal, M.; Schatte, G.A.; Grewe, B.F.; Stadelmann, T. A Comprehensive Survey of Deep Transfer Learning for Anomaly Detection in Industrial Time Series: Methods, Applications, and Directions. IEEE Access 2023, 12, 3768–3789. [Google Scholar] [CrossRef]
- Baseca, C.C.; Sendra, S.; Lloret, J.; Tomas, J. A Smart Decision System for Digital Farming. Agronomy 2019, 9, 216. [Google Scholar] [CrossRef]
- Abdelghany, E.S.; Farghaly, M.B.; Almalki, M.M.; Sarhan, H.H.; Essa, M.E.-S.M. Machine Learning and IoT Trends for Intelligent Prediction of Aircraft Wing Anti-Icing System Temperature. Aerospace 2023, 10, 676. [Google Scholar] [CrossRef]
- Patil, A.A.; Kulkarni, K. A Hybrid Machine Learning - Numerical Weather Prediction Approach for Rainfall Prediction. In Proceedings of the 2023 IEEE India Geoscience and Remote Sensing Symposium (InGARSS), Bangalore, India, 10–13 December 2023; pp. 1–4. [Google Scholar] [CrossRef]
- Dudek, G. Short-Term Load Forecasting Using Neural Networks with Pattern Similarity-Based Error Weights. Energies 2021, 14, 3224. [Google Scholar] [CrossRef]
- Mimenbayeva, A.; Issakova, G.; Tanykpayeva, B.; Tursumbayeva, A.; Suleimenova, R.; Tulkibaev, A. Applying Machine Learning for Analysis and Forecasting of Agricultural Crop Yields. Sci. J. Astana IT Univ. 2024, 17, 28–42. [Google Scholar] [CrossRef]
- Yang, J.; Yu, M.; Liu, Q.; Li, Y.; Duffy, D.Q.; Yang, C. A high spatiotemporal resolution framework for urban temperature prediction using IoT data. Comput. Geosci. 2022, 159, 104991. [Google Scholar] [CrossRef]
- Ladi, T.; Jabalameli, S.; Sharifi, A. Applications of machine learning and deep learning methods for climate change mitigation and adaptation. Environ. Plan. B Urban Anal. City Sci. 2022, 49, 1314–1330. [Google Scholar] [CrossRef]
- Dalal, S.; Seth, B.; Radulescu, M.; Cilan, T.F.; Serbanescu, L. Optimized Deep Learning with Learning without Forgetting (LwF) for Weather Classification for Sustainable Transportation and Traffic Safety. Sustainability 2023, 15, 6070. [Google Scholar] [CrossRef]
- Schultz, M.G.; Betancourt, C.; Gong, B.; Kleinert, F.; Langguth, M.; Leufen, L.H.; Mozaffari, A.; Stadtler, S. Can deep learning beat numerical weather prediction? Philos. Trans. R. Soc. A Math. Phys. Eng. Sci. 2021, 379, 20200097. [Google Scholar] [CrossRef]
- Wu, Y.; Xue, W. Data-Driven Weather Forecasting and Climate Modeling from the Perspective of Development. Atmosphere 2024, 15, 689. [Google Scholar] [CrossRef]
- Augustin, J. Industry-Specific Applications of Site Reliability Engineering. Int. J. Res. Appl. Sci. Eng. Technol. 2024, 12, 1366–1371. [Google Scholar] [CrossRef]
- Sharma, A.; Ismail, Z.S. Weather Classification Model Performance: Using CNN, Keras-Tensor Flow. ITM Web Conf. 2022, 42, 01006. [Google Scholar] [CrossRef]
- Debdas, S.; Pandey, S.; Gupta, S.; Dash, R.K.; Patnaik, M.C.; Singh, A.A. Optimizing Resource Efficiency in Smart Greenhouses Through IoT. In Proceedings of the 2024 5th International Conference for Emerging Technology (INCET), Belgaum, India, 24–26 May 2024; pp. 1–7. [Google Scholar] [CrossRef]
- Huang, S.; Liu, Q.; Wu, Y.; Chen, M.; Yin, H.; Zhao, J. Edible Mushroom Greenhouse Environment Prediction Model Based on Attention CNN-LSTM. Agronomy 2024, 14, 473. [Google Scholar] [CrossRef]
- García-Vázquez, F.; Ponce-González, J.R.; Guerrero-Osuna, H.A.; Carrasco-Navarro, R.; Luque-Vega, L.F.; Mata-Romero, M.E.; Martínez-Blanco, M.d.R.; Castañeda-Miranda, C.L.; Díaz-Flórez, G. Prediction of Internal Temperature in Greenhouses Using the Supervised Learning Techniques: Linear and Support Vector Regressions. Appl. Sci. 2023, 13, 8531. [Google Scholar] [CrossRef]
- Mohammadpour, R.; Shaharuddin, S.; Chang, C.K.; Zakaria, N.A.; Ab Ghani, A.; Chan, N.W. Prediction of water quality index in constructed wetlands using support vector machine. Environ. Sci. Pollut. Res. 2015, 22, 6208–6219. [Google Scholar] [CrossRef]
- Goyal, V.; Yadav, A.; Mukherjee, R. Performance Evaluation of Machine Learning and Deep Learning Models for Temperature Prediction in Poultry Farming. In Proceedings of the 2022 10th International Conference on Emerging Trends in Engineering and Technology—Signal and Information Processing (ICETET-SIP-22), Nagpur, India, 29–30 April 2022; pp. 1–6. [Google Scholar] [CrossRef]
- Purwandari, K.; Cenggoro, T.W.; Sigalingging, J.W.C.; Pardamean, B. Twitter-based classification for integrated source data of weather observations. IAES Int. J. Artif. Intell. 2023, 12, 271–283. [Google Scholar] [CrossRef]
- Tian, H.; Wang, P.; Tansey, K.; Zhang, J.; Zhang, S.; Li, H. An LSTM neural network for improving wheat yield estimates by integrating remote sensing data and meteorological data in the Guanzhong Plain, PR China. Agric. For. Meteorol. 2021, 310, 108629. [Google Scholar] [CrossRef]
- Esparza-Gómez, J.M.; Luque-Vega, L.F.; Guerrero-Osuna, H.A.; Carrasco-Navarro, R.; García-Vázquez, F.; Mata-Romero, M.E.; Olvera-Olvera, C.A.; Carlos-Mancilla, M.A.; Solís-Sánchez, L.O. Long Short-Term Memory Recurrent Neural Network and Extreme Gradient Boosting Algorithms Applied in a Greenhouse’s Internal Temperature Prediction. Appl. Sci. 2023, 13, 12341. [Google Scholar] [CrossRef]
- Pepper, N.; Crespo, L.; Montomoli, F. Adaptive Learning for Reliability Analysis using Support Vector Machines. Reliab. Eng. Syst. Saf. 2022, 226, 108635. [Google Scholar] [CrossRef]
- Aryanto, I.K.A.A.; Maneetham, D.; Crisnapati, P.N. IoT-enhanced infant incubator monitoring system with 1D-CNN temperature prediction model. Indones. J. Electr. Eng. Comput. Sci. 2024, 34, 900–912. [Google Scholar] [CrossRef]
- Paguay, J.A.C.; Brito, G.A.H.; Rojas, D.L.H.; Calva, J.J.C. Secure home automation system based on ESP-NOW mesh network, MQTT and Home Assistant platform. IEEE Lat. Am. Trans. 2023, 21, 829–838. [Google Scholar] [CrossRef]
- Guo, Y.; Zhao, H.; Zhang, S.; Wang, Y.; Chow, D. Modeling and optimization of environment in agricultural greenhouses for improving cleaner and sustainable crop production. J. Clean. Prod. 2020, 285, 124843. [Google Scholar] [CrossRef]
- Venkat, B.B.S.; Lalasa, B.; Reddy Tharun, V.; Vadrevu, S.; Chellamani, G.K. Smart Agro-Industrial Monitoring System Using Multi-Sensors and ESP-NOW Protocol. In Proceedings of the 2023 International Conference on Wireless Communications Signal Processing and Networking (WiSPNET), Chennai, India, 29–31 March 2023; pp. 01–05. [Google Scholar] [CrossRef]
- Zhang, B. Low Power Consumption Monitoring Method of Agricultural Greenhouse Environment Based on Wireless Sensor Network. INMATEH Agric. Eng. 2022, 68, 435–447. [Google Scholar] [CrossRef]
- Hung, C.-W.; Zhuang, Y.-D.; Lee, C.-H.; Wang, C.-C.; Yang, H.-H. Transmission Power Control in Wireless Sensor Networks Using Fuzzy Adaptive Data Rate. Sensors 2022, 22, 9963. [Google Scholar] [CrossRef]
- Belkadi, A.; Mezghani, D.; Mami, A. Design and Implementation of Flc Applied to a Smart Greenhouse. Eng. Agricola 2020, 40, 777–790. [Google Scholar] [CrossRef]
- Peng, W.; Ni, Q. A Hybrid SVM-LSTM Temperature Prediction Model Based on Empirical Mode Decomposition and Residual Prediction. In Proceedings of the 2020 IEEE International Conference on Systems, Man, and Cybernetics (SMC), Toronto, ON, Canada, 11–14 October 2020; pp. 1616–1621. [Google Scholar]
- Soheli, S.J.; Jahan, N.; Hossain, B.; Adhikary, A.; Khan, A.R.; Wahiduzzaman, M. Smart Greenhouse Monitoring System Using Internet of Things and Artificial Intelligence. Wirel. Pers. Commun. 2022, 124, 3603–3634. [Google Scholar] [CrossRef]
- Sree, M.S.; Rajeswari, V.R.; Prathima, T.; Latha, P.; Sudhakar, P. Influence of Agroclimatic Indices on Morphological and Growth Attributes of Maize (Zea mays L.). Int. J. Curr. Microbiol. Appl. Sci. 2018, 7, 2582–2590. [Google Scholar] [CrossRef]
- Šafranj, J.; Katić, M.; Zivlak, J. Classification in scientific and technical writing. In Proceedings of the 10th International Symposium on Graphic Engineering and Design, Novi Sad, Serbia, 12–14 November 2020; pp. 469–474. [Google Scholar] [CrossRef]
- Stavropoulos, G.; Violos, J.; Tsanakas, S.; Leivadeas, A. Enabling Artificial Intelligent Virtual Sensors in an IoT Environment. Sensors 2023, 23, 1328. [Google Scholar] [CrossRef]
- Sarker, I.H. Machine Learning: Algorithms, Real-World Applications and Research Directions. SN Comput. Sci. 2021, 2, 160. [Google Scholar] [CrossRef]
- Sarker, I.H.; Kayes, A.S.M.; Watters, P. Effectiveness analysis of machine learning classification models for predicting personalized context-aware smartphone usage. J. Big Data 2019, 6, 57. [Google Scholar] [CrossRef]
- Huang, C.; Li, Y. A Short-Term Prediction Method for PV Power Generation Based on SVM Weather Classification and PSO-BP Neural Network. In Proceedings of the 2023 IEEE 2nd International Power Electronics and Application Symposium (PEAS), Guangzhou, China, 10–13 November 2023; pp. 2544–2549. [Google Scholar] [CrossRef]
- Muawanah, S.; Muzayanah, U.; Pandin, M.G.R.; Alam, M.D.S.; Trisnaningtyas, J.P.N. Stress and Coping Strategies of Madrasah’s Teachers on Applying Distance Learning During COVID-19 Pandemic in Indonesia. Qubahan Acad. J. 2023, 3, 206–218. [Google Scholar] [CrossRef]
- Nižetić, S.; Šolić, P.; González-de-Artaza, D.L.-d.I.; Patrono, L. Internet of Things (IoT): Opportunities, issues and challenges towards a smart and sustainable future. J. Clean. Prod. 2020, 274, 122877. [Google Scholar] [CrossRef]
- Tung, Y.-C.; Lien, Y.-H.; Liu, L.-W.; David Honesty B., M.; Devi, P.K. IOT-Smart Monitoring of Pet Housing. In Proceedings of the 2024 International Conference on Wireless Communications Signal Processing and Networking (WiSPNET), Chennai, India, 21–23 March 2024; pp. 1–6. [Google Scholar]
- Ozbek, A.; Ünal, Ş.; Bilgili, M. Daily average relative humidity forecasting with LSTM neural network and ANFIS approaches. Theor. Appl. Clim. 2022, 150, 697–714. [Google Scholar] [CrossRef]
- Ibrahim, Y.; Muhammad, A.I.; Rabiu, A.M. Optimized SVM—Based Network Anomaly Detection with Genetic Algorithm and Recursive Feature Elimination. In Proceedings of the 2023 2nd International Conference on Multidisciplinary Engineering and Applied Science (ICMEAS), Abuja, Nigeria, 1–3 November 2023; pp. 1–5. [Google Scholar] [CrossRef]
- Robeson, S.M.; Willmott, C.J. Decomposition of the mean absolute error (MAE) into systematic and unsystematic components. PLoS ONE 2023, 18, e0279774. [Google Scholar] [CrossRef]
- Hasnain, M.; Pasha, M.F.; Ghani, I.; Imran, M.; Alzahrani, M.Y.; Budiarto, R. Evaluating Trust Prediction and Confusion Matrix Measures for Web Services Ranking. IEEE Access 2020, 8, 90847–90861. [Google Scholar] [CrossRef]


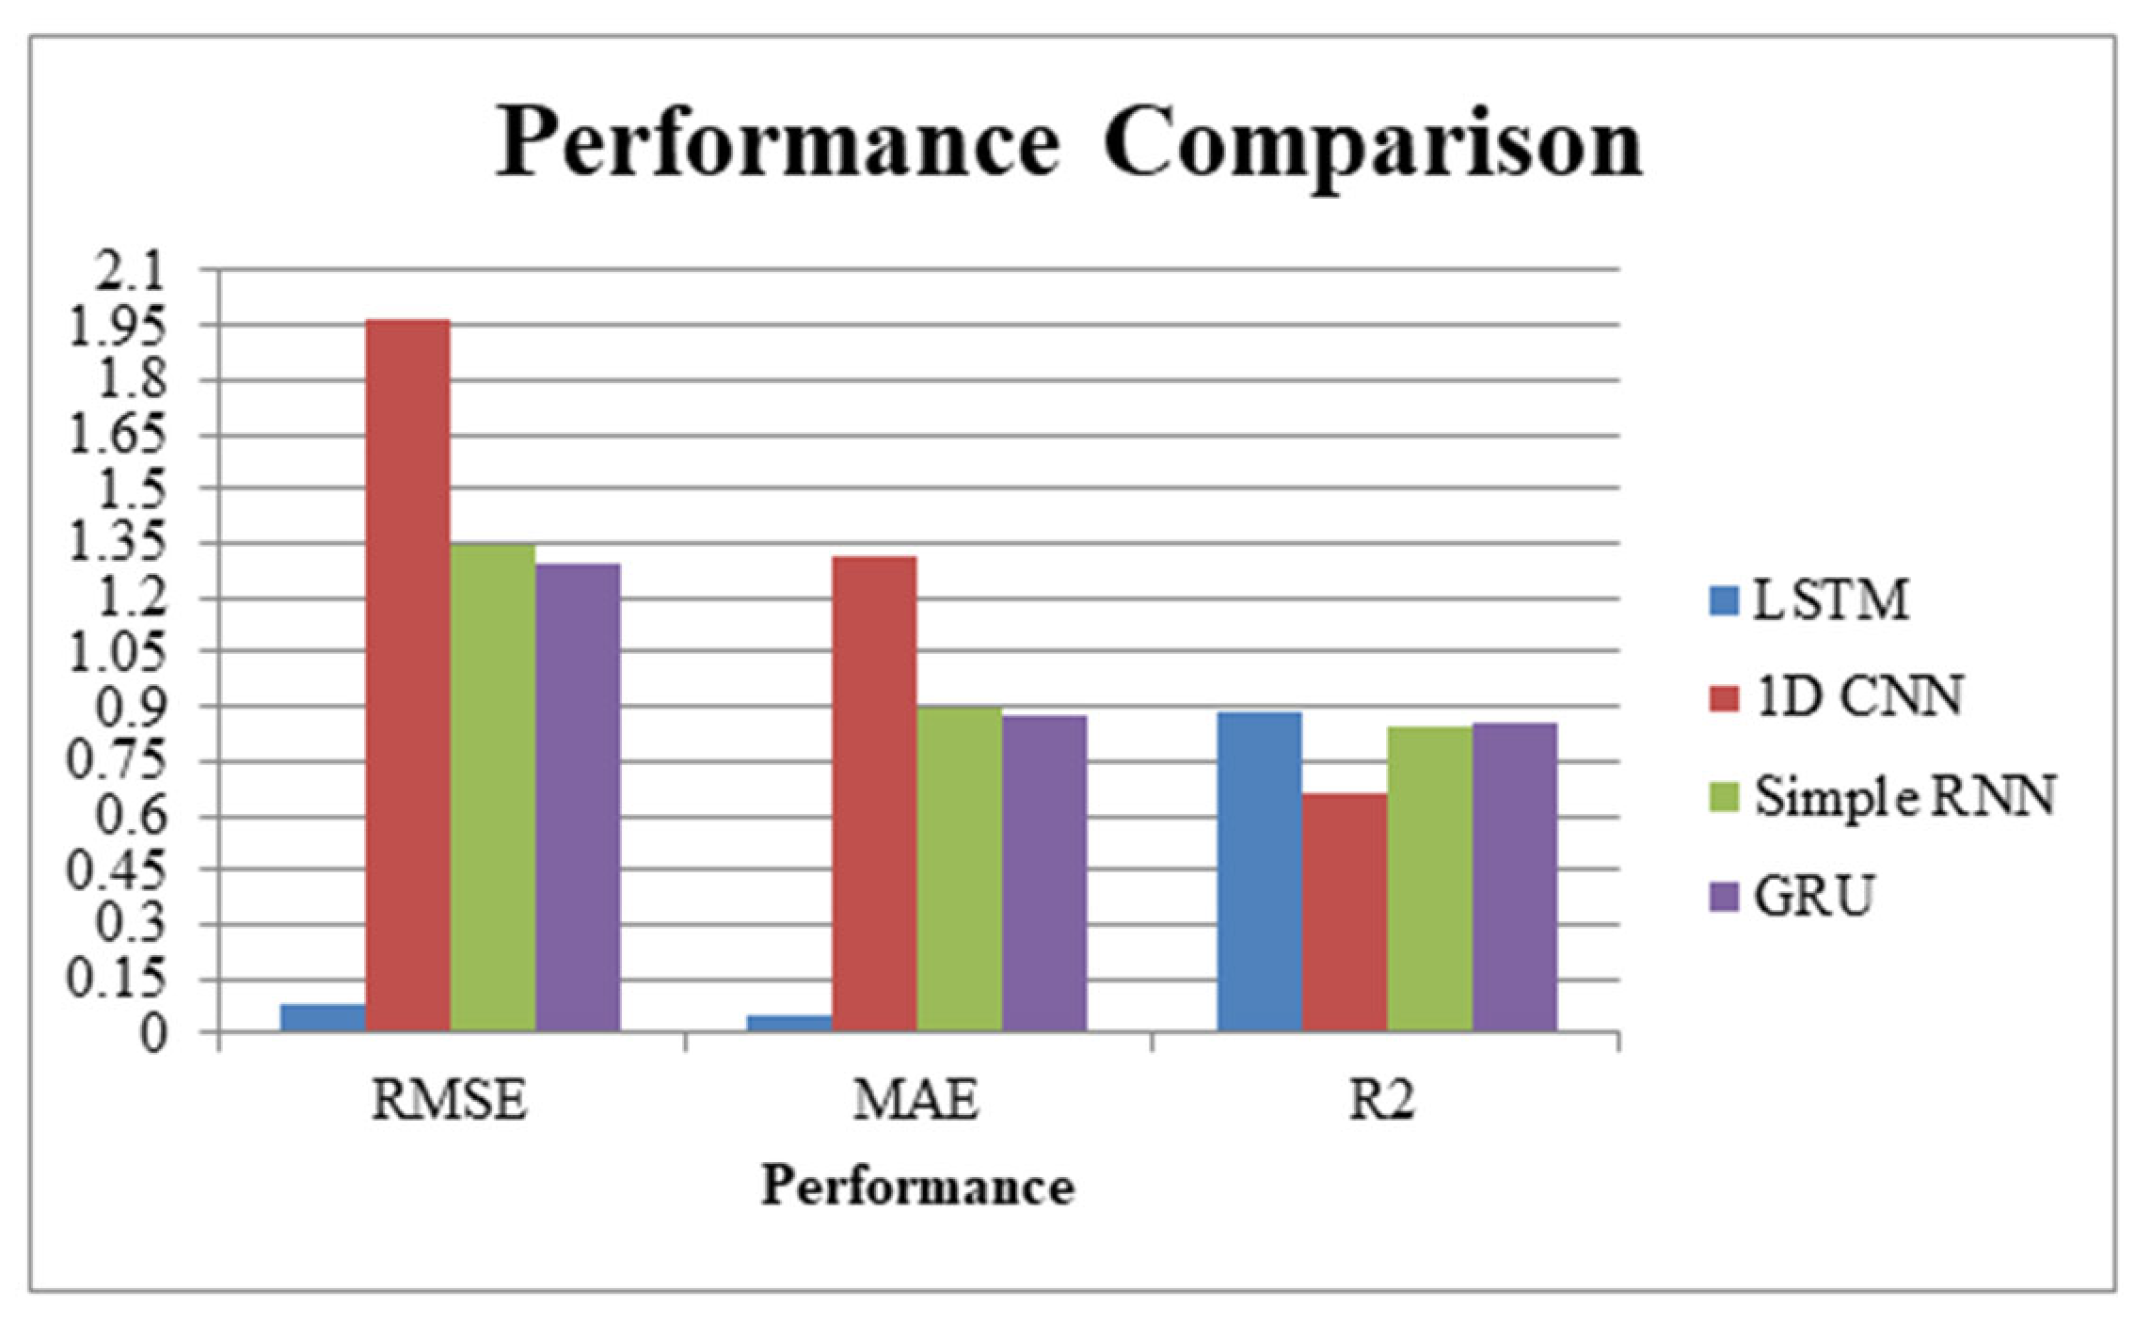
| Model | Root-Mean-Square Error | Mean Absolute Error | Coefficient of Determination |
|---|---|---|---|
| Long Short-Term Memory | 0.07658074051141 | 0.045361392199993 | 0.88251054286956 |
| 1D Convolutional Neural Network | 1.967316532501899 | 1.310166257099040 | 0.661335370556097 |
| Simple Recurrent Neural Network | 1.343030451976966 | 0.899931509517928 | 0.842168720381621 |
| Gated Recurrent Unit | 1.289534416874227 | 0.877133175007347 | 0.854491878874283 |
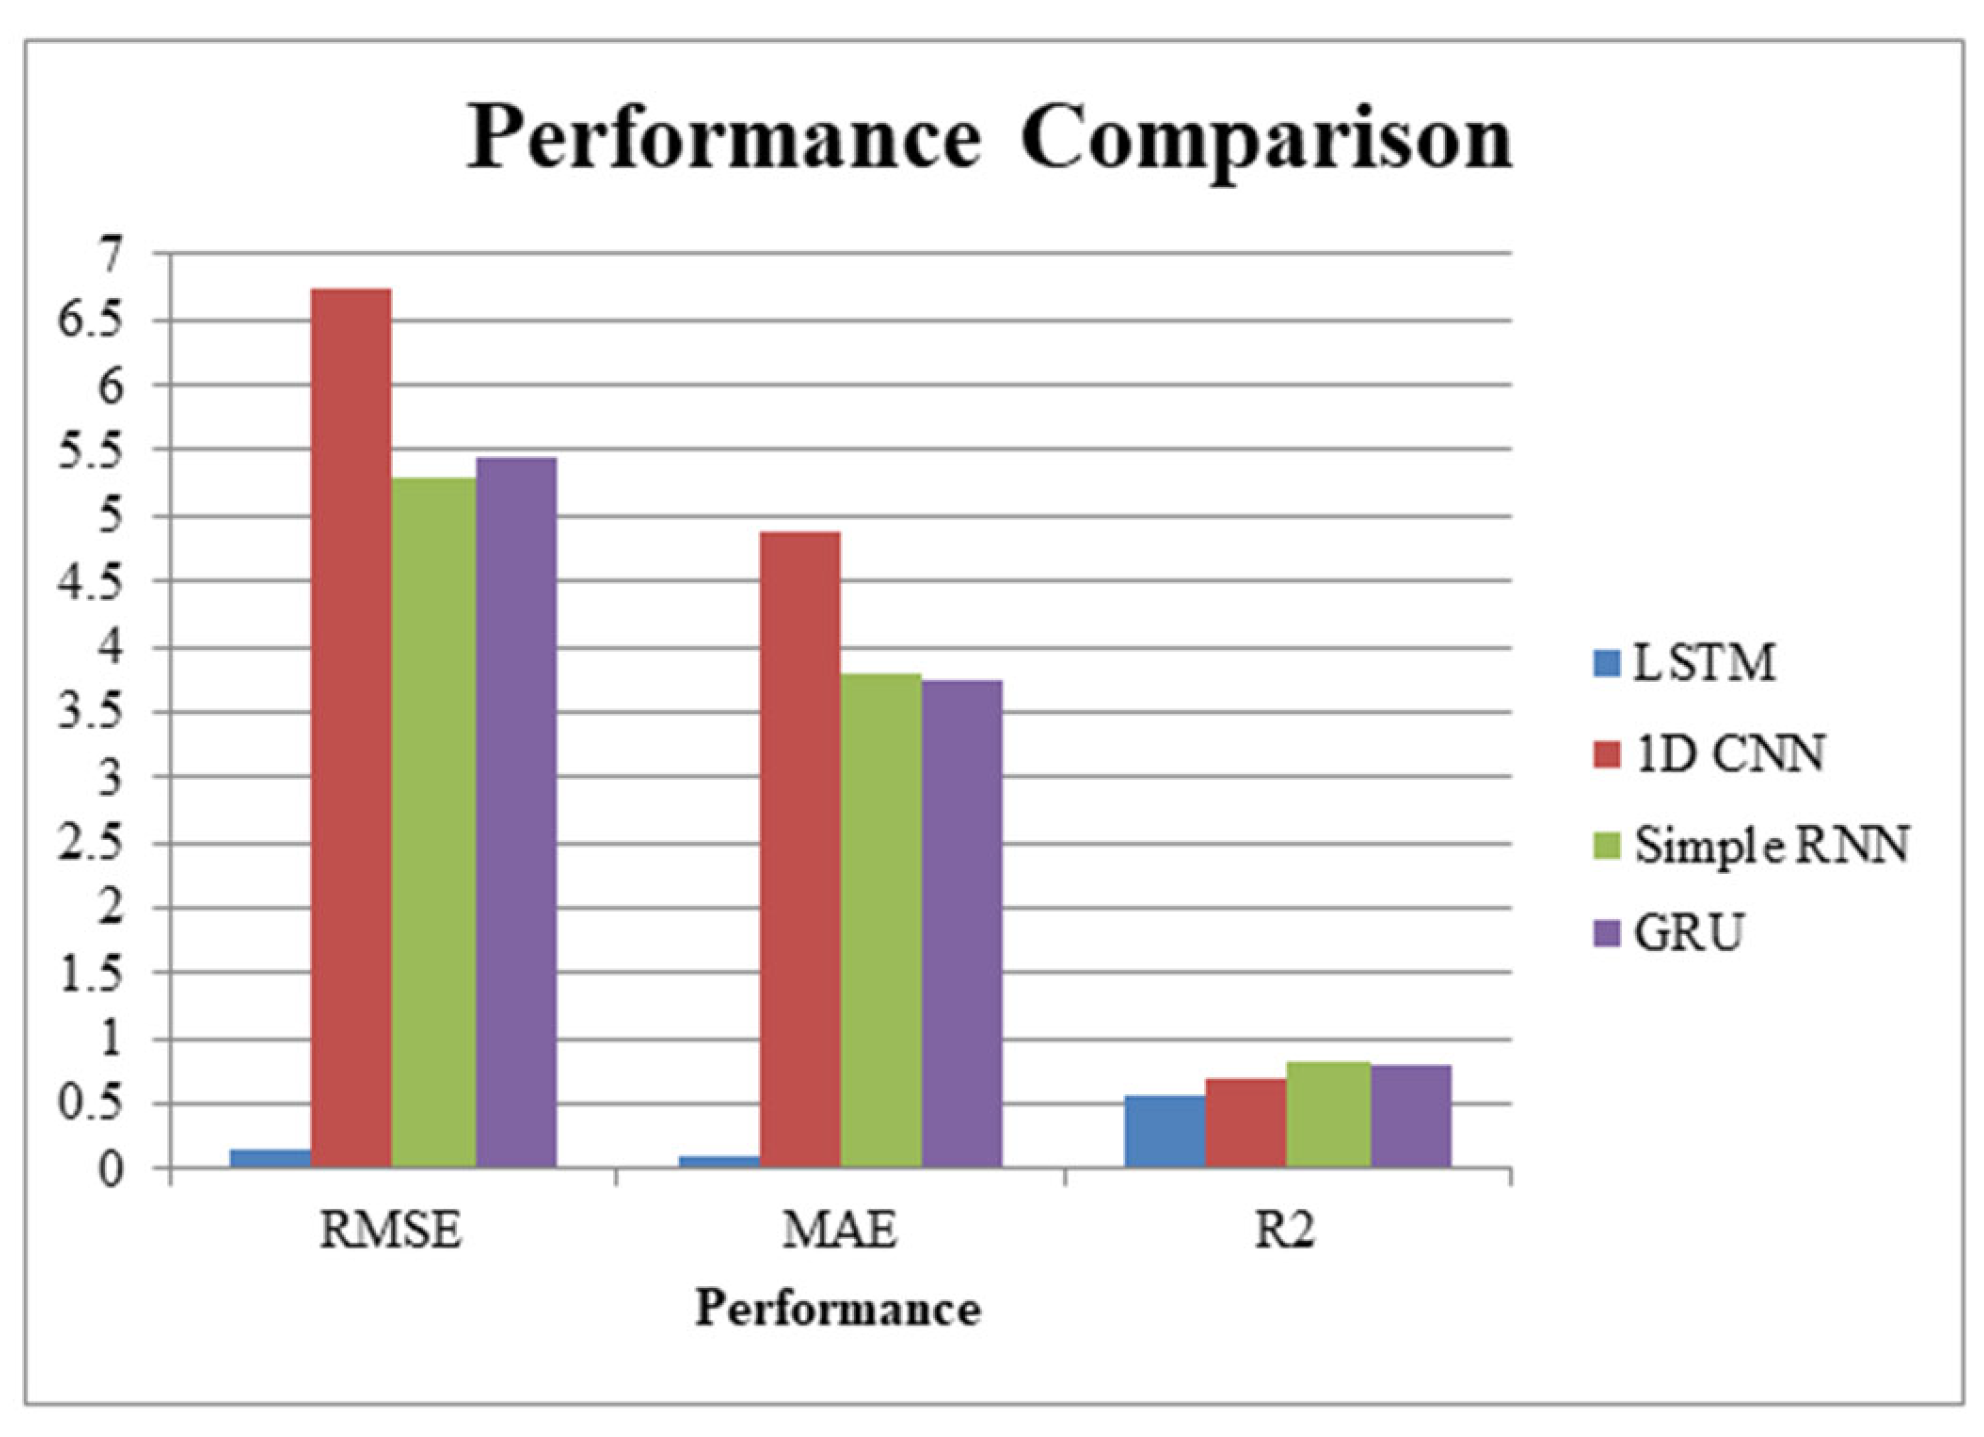
| Model | Root-Mean-Square Error | Mean Absolute Error | Coefficient of Determination |
|---|---|---|---|
| Long Short-Term Memory | 0.15201973915100 | 0.11063334345817 | 0.5637690424919 |
| 1D Convolutional Neural Network | 6.73887923888866 | 4.89100042119756 | 0.70725943806178 |
| Simple Recurrent Neural Network | 5.30337885034024 | 3.80406759451101 | 0.81869371504223 |
| Gated Recurrent Unit | 5.45224095949879 | 3.75048611615155 | 0.80837258702500 |
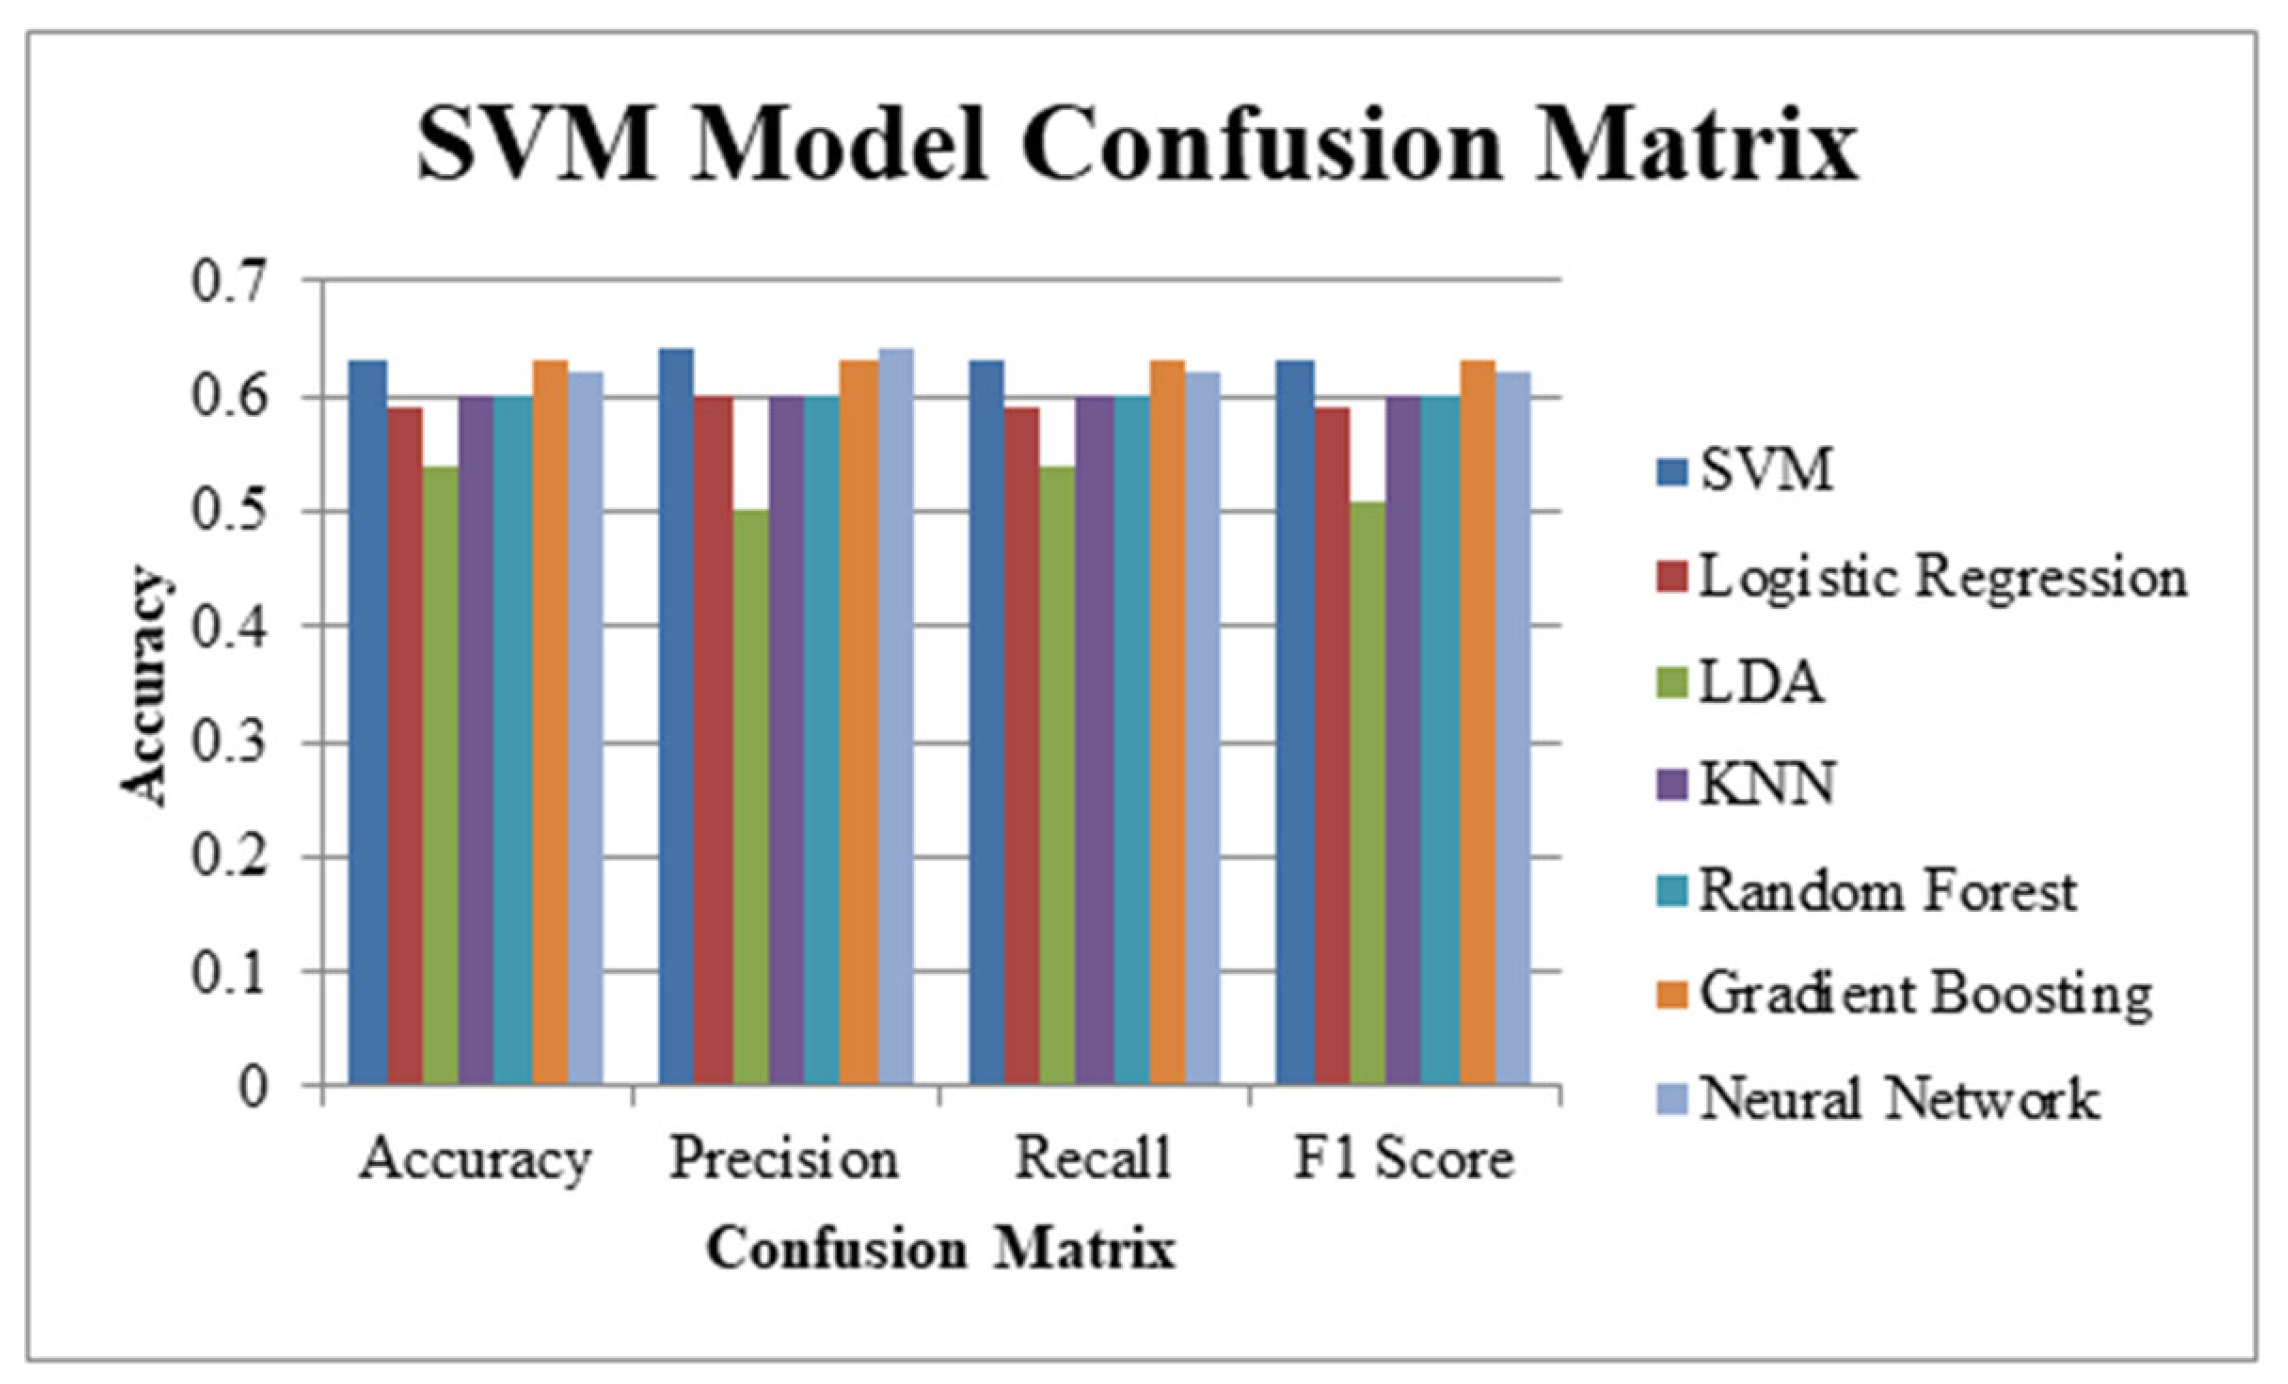
| Model | Accuracy | Precision | Recall | F1-Score |
|---|---|---|---|---|
| Support Vector Machine | 0.63 | 0.64 | 0.63 | 0.63 |
| Logistic Regression | 0.59 | 0.60 | 0.59 | 0.59 |
| Linear Discriminant Analysis | 0.54 | 0.50 | 0.54 | 0.51 |
| K-Nearest Neighbors | 0.60 | 0.60 | 0.60 | 0.60 |
| Random Forest | 0.60 | 0.60 | 0.60 | 0.60 |
| Gradient Boosting | 0.63 | 0.63 | 0.63 | 0.63 |
| Neural Network | 0.62 | 0.64 | 0.62 | 0.62 |
Disclaimer/Publisher’s Note: The statements, opinions and data contained in all publications are solely those of the individual author(s) and contributor(s) and not of MDPI and/or the editor(s). MDPI and/or the editor(s) disclaim responsibility for any injury to people or property resulting from any ideas, methods, instructions or products referred to in the content. |
© 2025 by the authors. Licensee MDPI, Basel, Switzerland. This article is an open access article distributed under the terms and conditions of the Creative Commons Attribution (CC BY) license (https://creativecommons.org/licenses/by/4.0/).
Share and Cite
Tung, Y.-C.; Syahputri, N.W.; Diputra, I.G.N.A.S. Greenhouse Environment Sentinel with Hybrid LSTM-SVM for Proactive Climate Management. AgriEngineering 2025, 7, 96. https://doi.org/10.3390/agriengineering7040096
Tung Y-C, Syahputri NW, Diputra IGNAS. Greenhouse Environment Sentinel with Hybrid LSTM-SVM for Proactive Climate Management. AgriEngineering. 2025; 7(4):96. https://doi.org/10.3390/agriengineering7040096
Chicago/Turabian StyleTung, Yi-Chih, Nasyah Wulandari Syahputri, and I. Gusti Nyoman Anton Surya Diputra. 2025. "Greenhouse Environment Sentinel with Hybrid LSTM-SVM for Proactive Climate Management" AgriEngineering 7, no. 4: 96. https://doi.org/10.3390/agriengineering7040096
APA StyleTung, Y.-C., Syahputri, N. W., & Diputra, I. G. N. A. S. (2025). Greenhouse Environment Sentinel with Hybrid LSTM-SVM for Proactive Climate Management. AgriEngineering, 7(4), 96. https://doi.org/10.3390/agriengineering7040096