


Deep Learning-Based System for Early Symptoms Recognition of Grapevine Red Blotch and Leafroll Diseases and Its Implementation on Edge Computing Devices

 , , ,
, , ,  , , ,
, , ,  , and
, and
Abstract
1. Introduction
2. Related Work
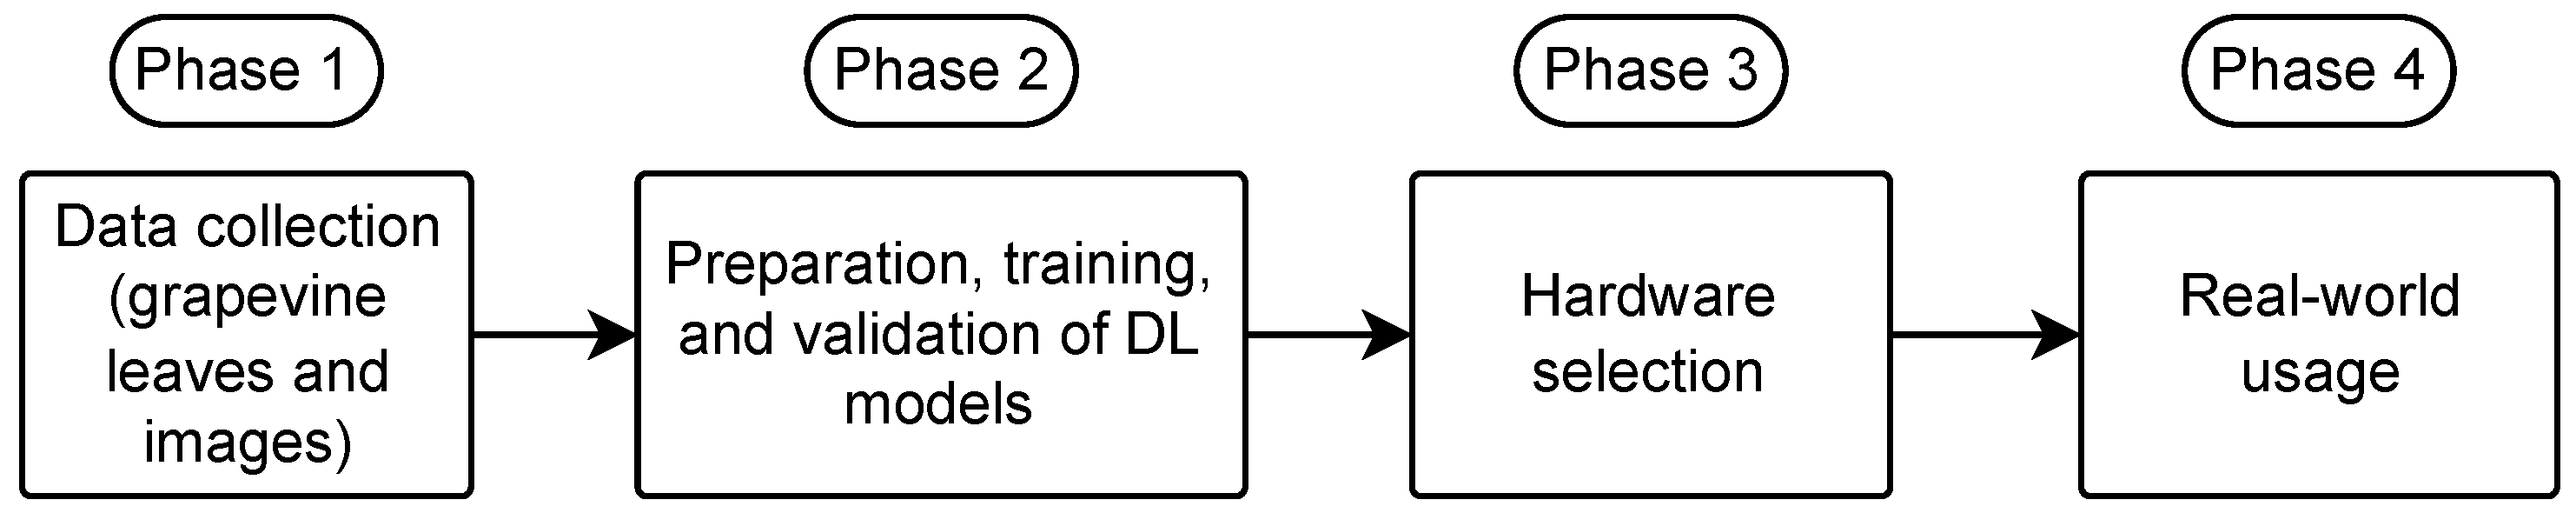
3. Materials and Methods
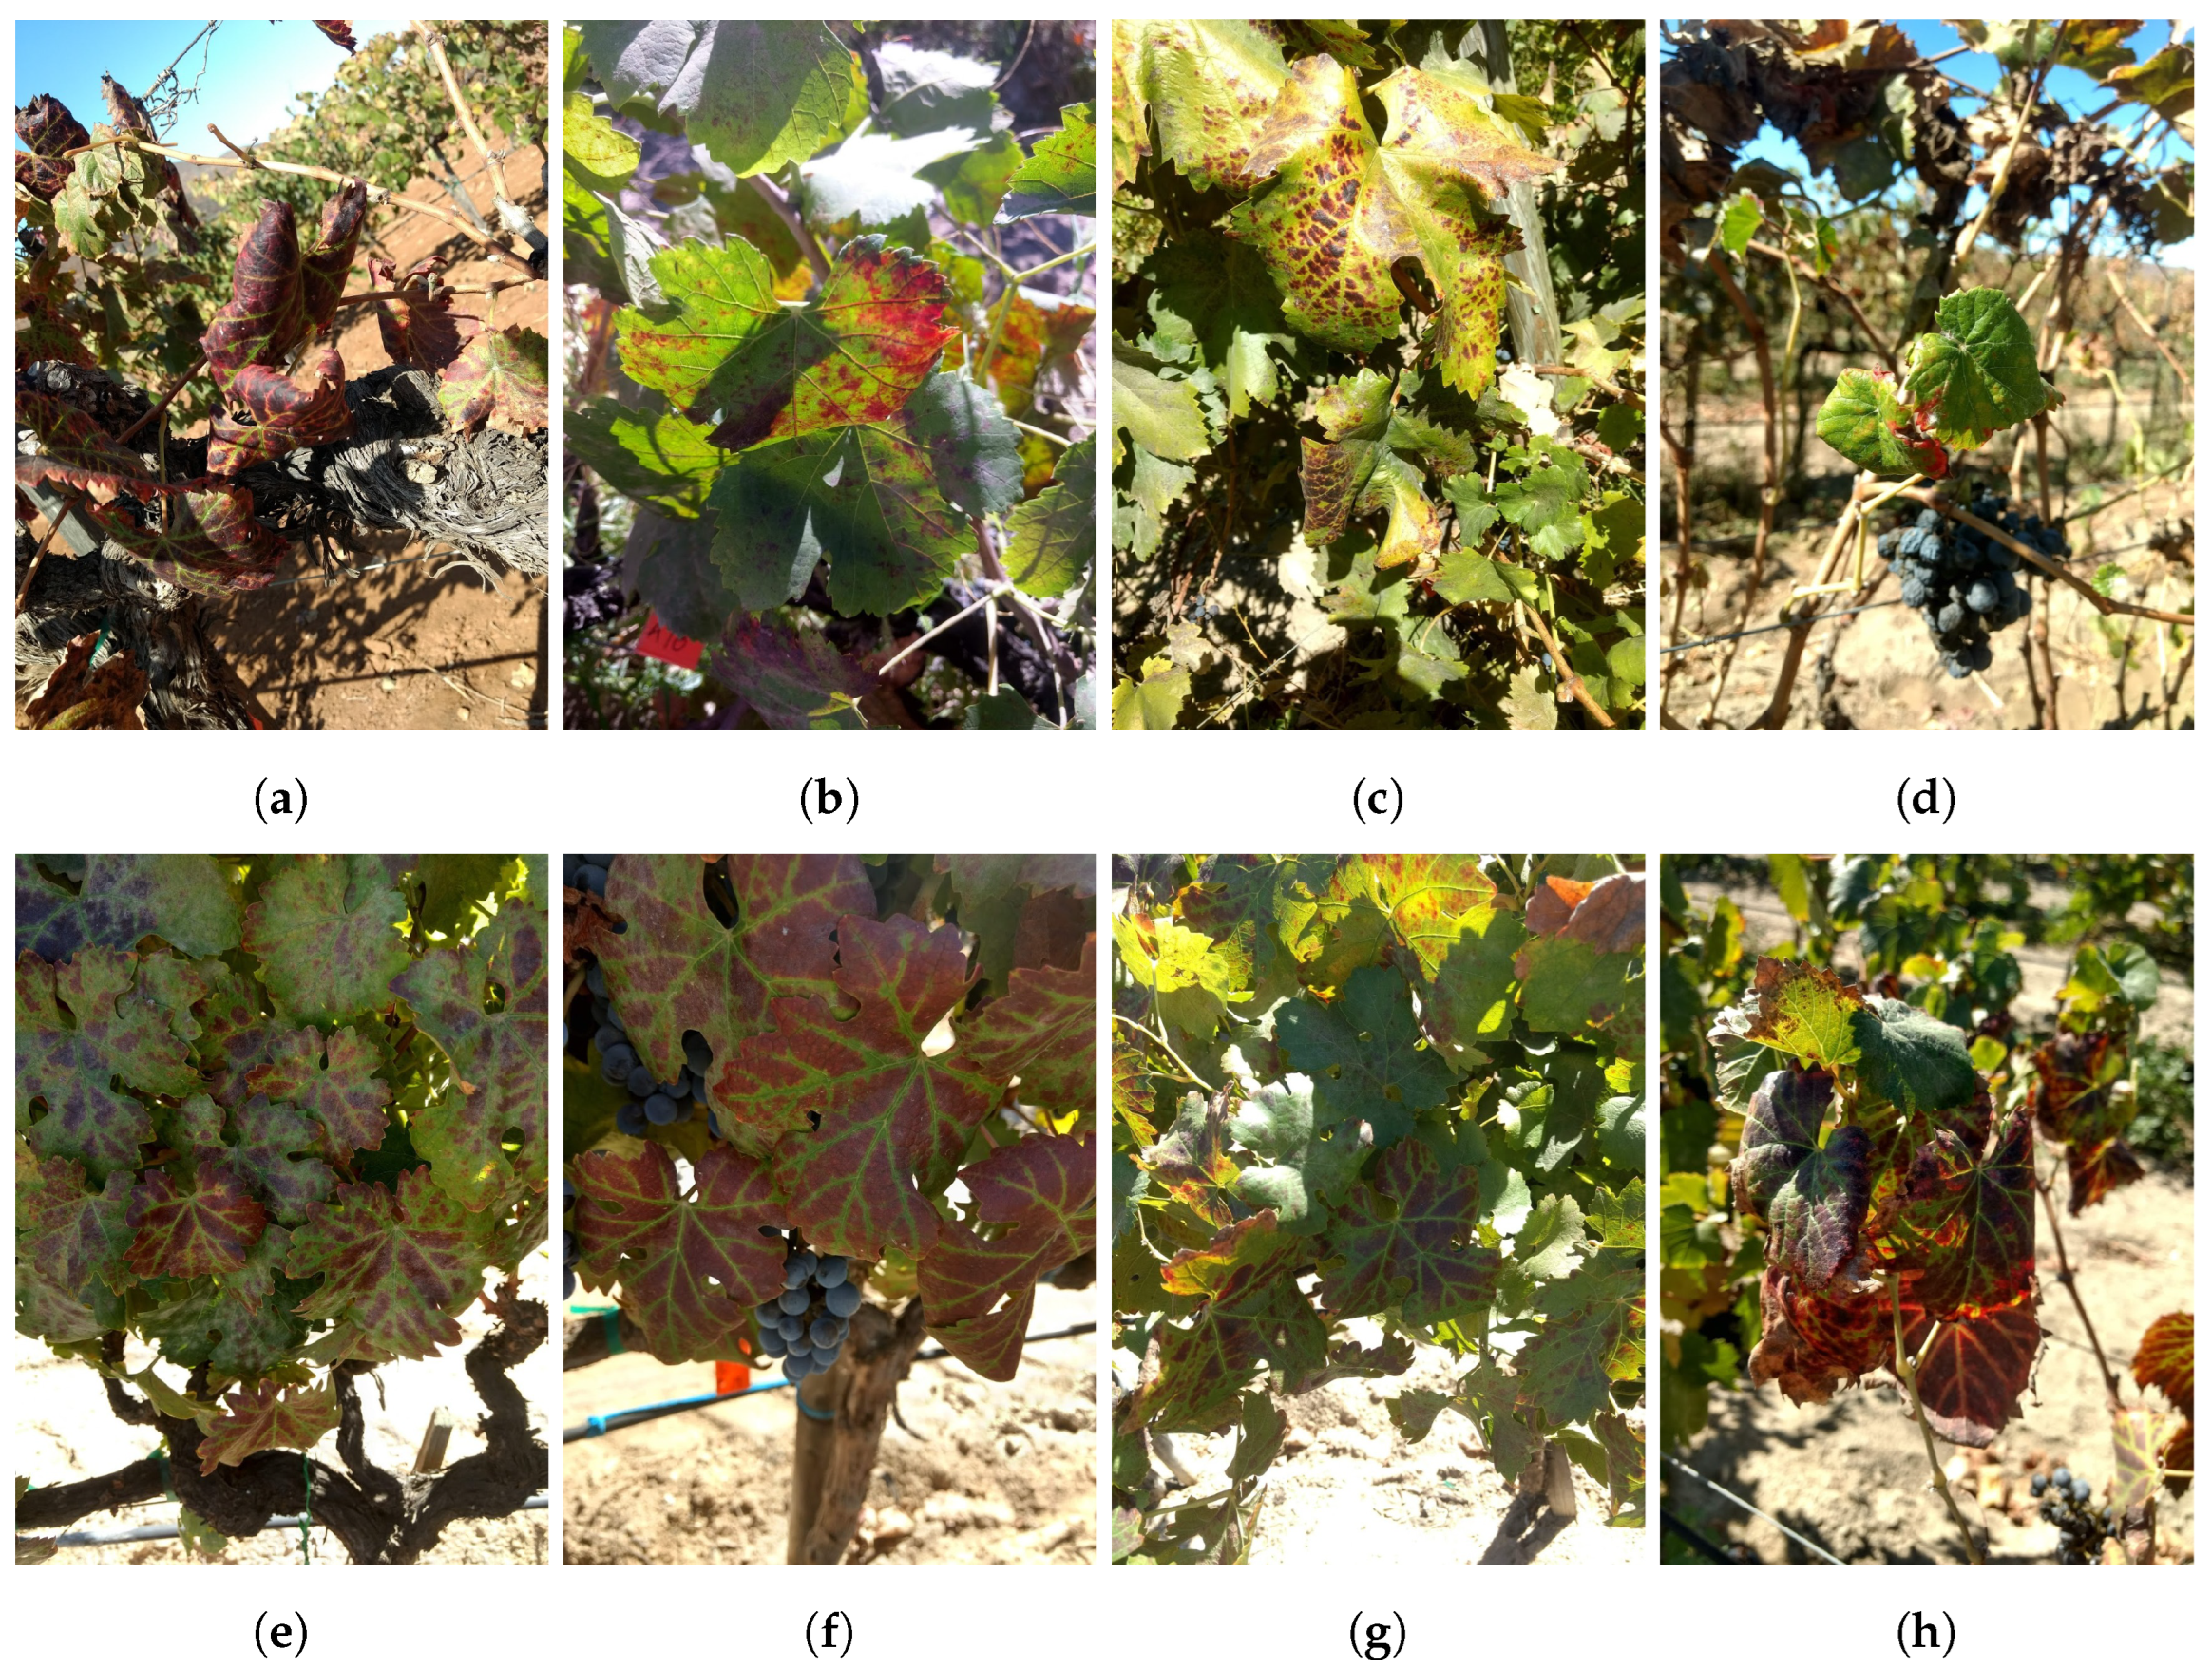
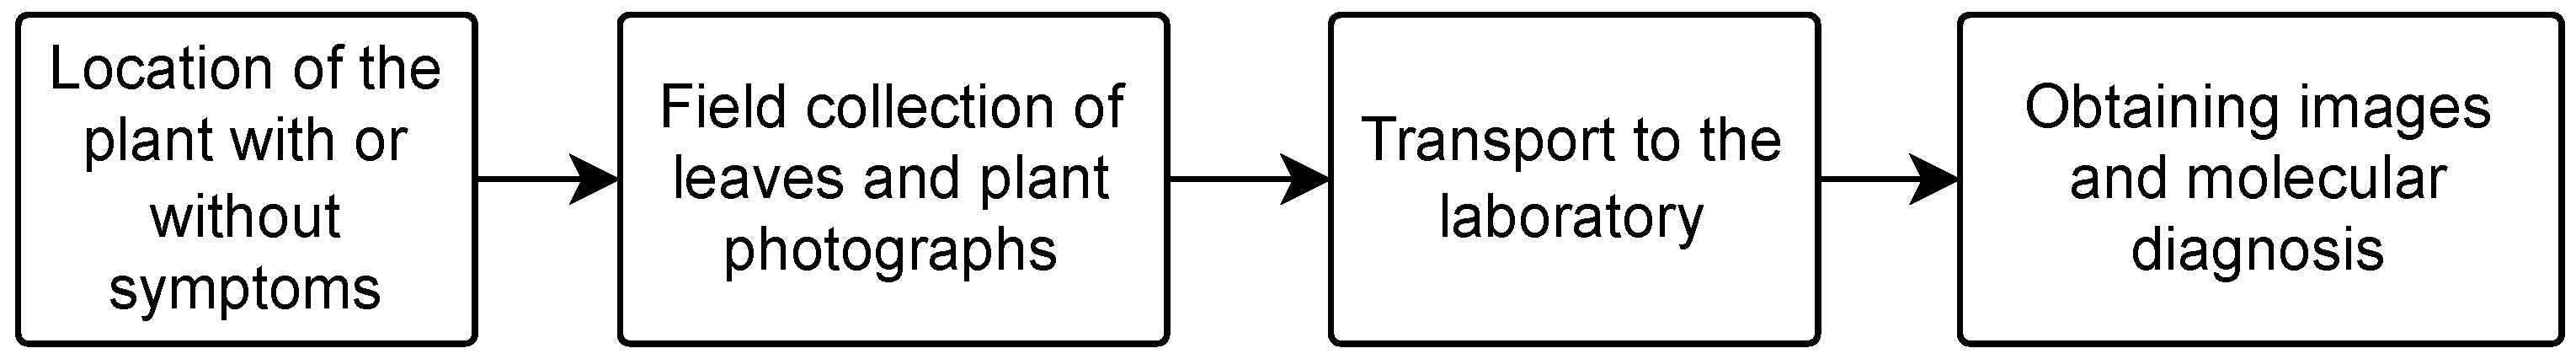
3.1. Data Collection
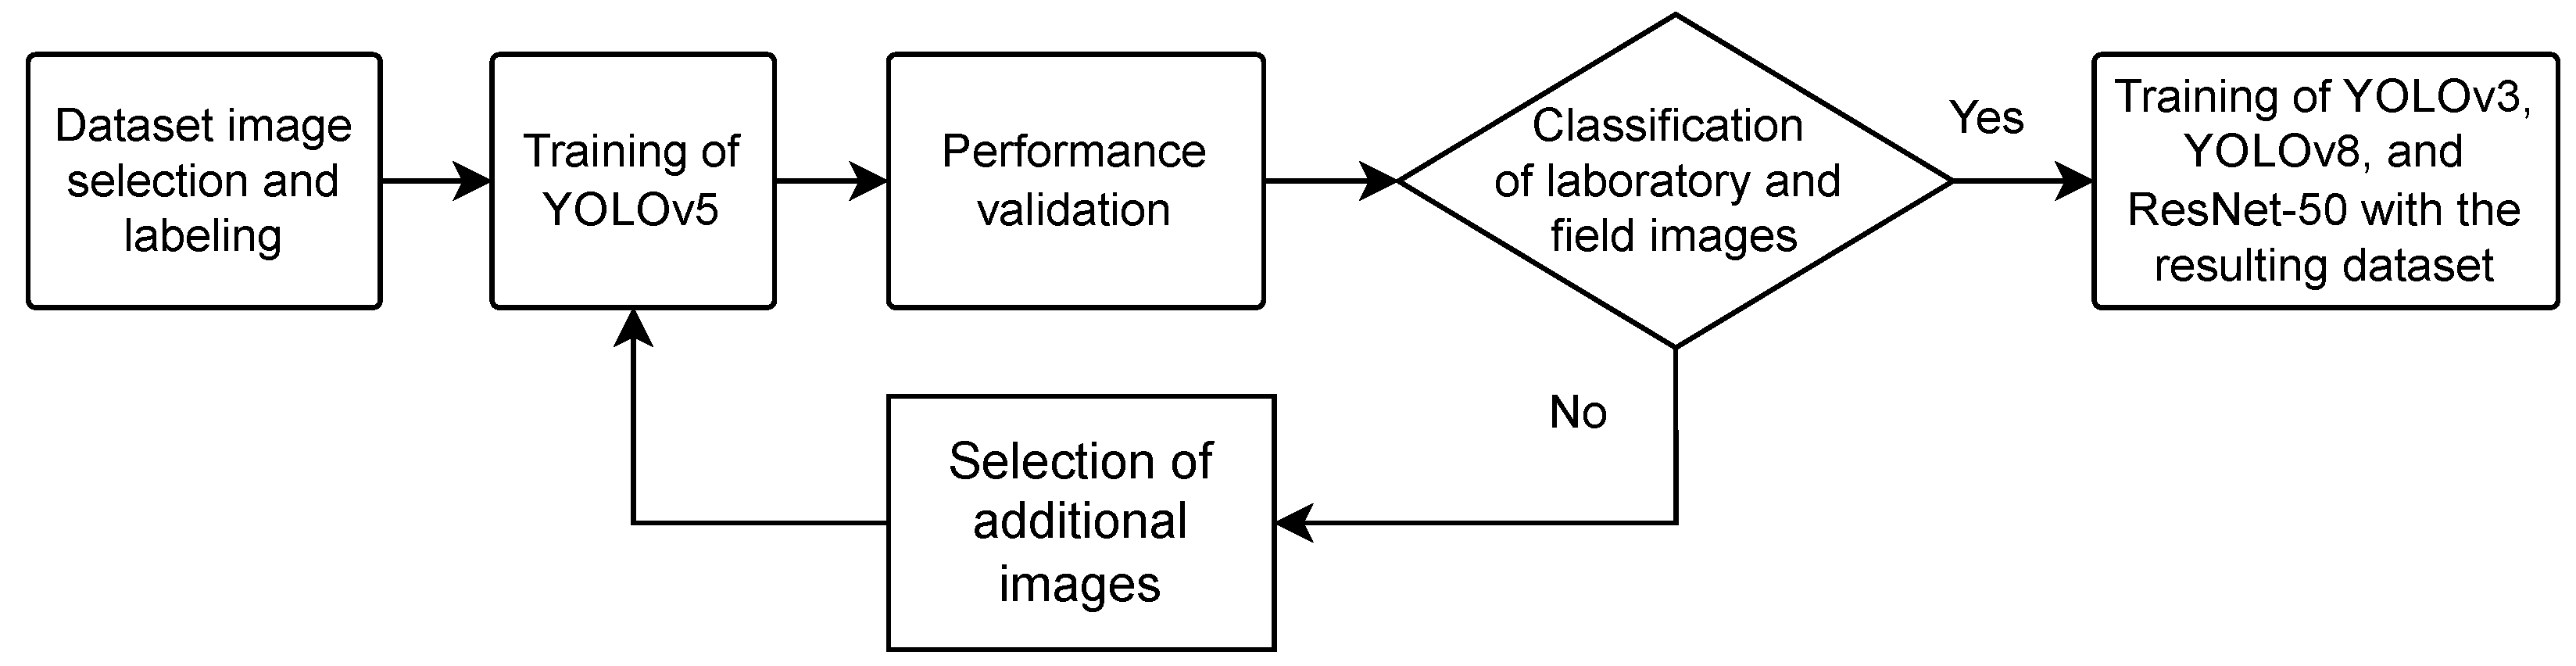
3.2. DL Models Training
3.3. Hardware Selection
3.4. Real-World Usage
4. Results
4.1. Data Collection and Preparation
4.2. Training and Validation of DL Models
4.3. Hardware Selection
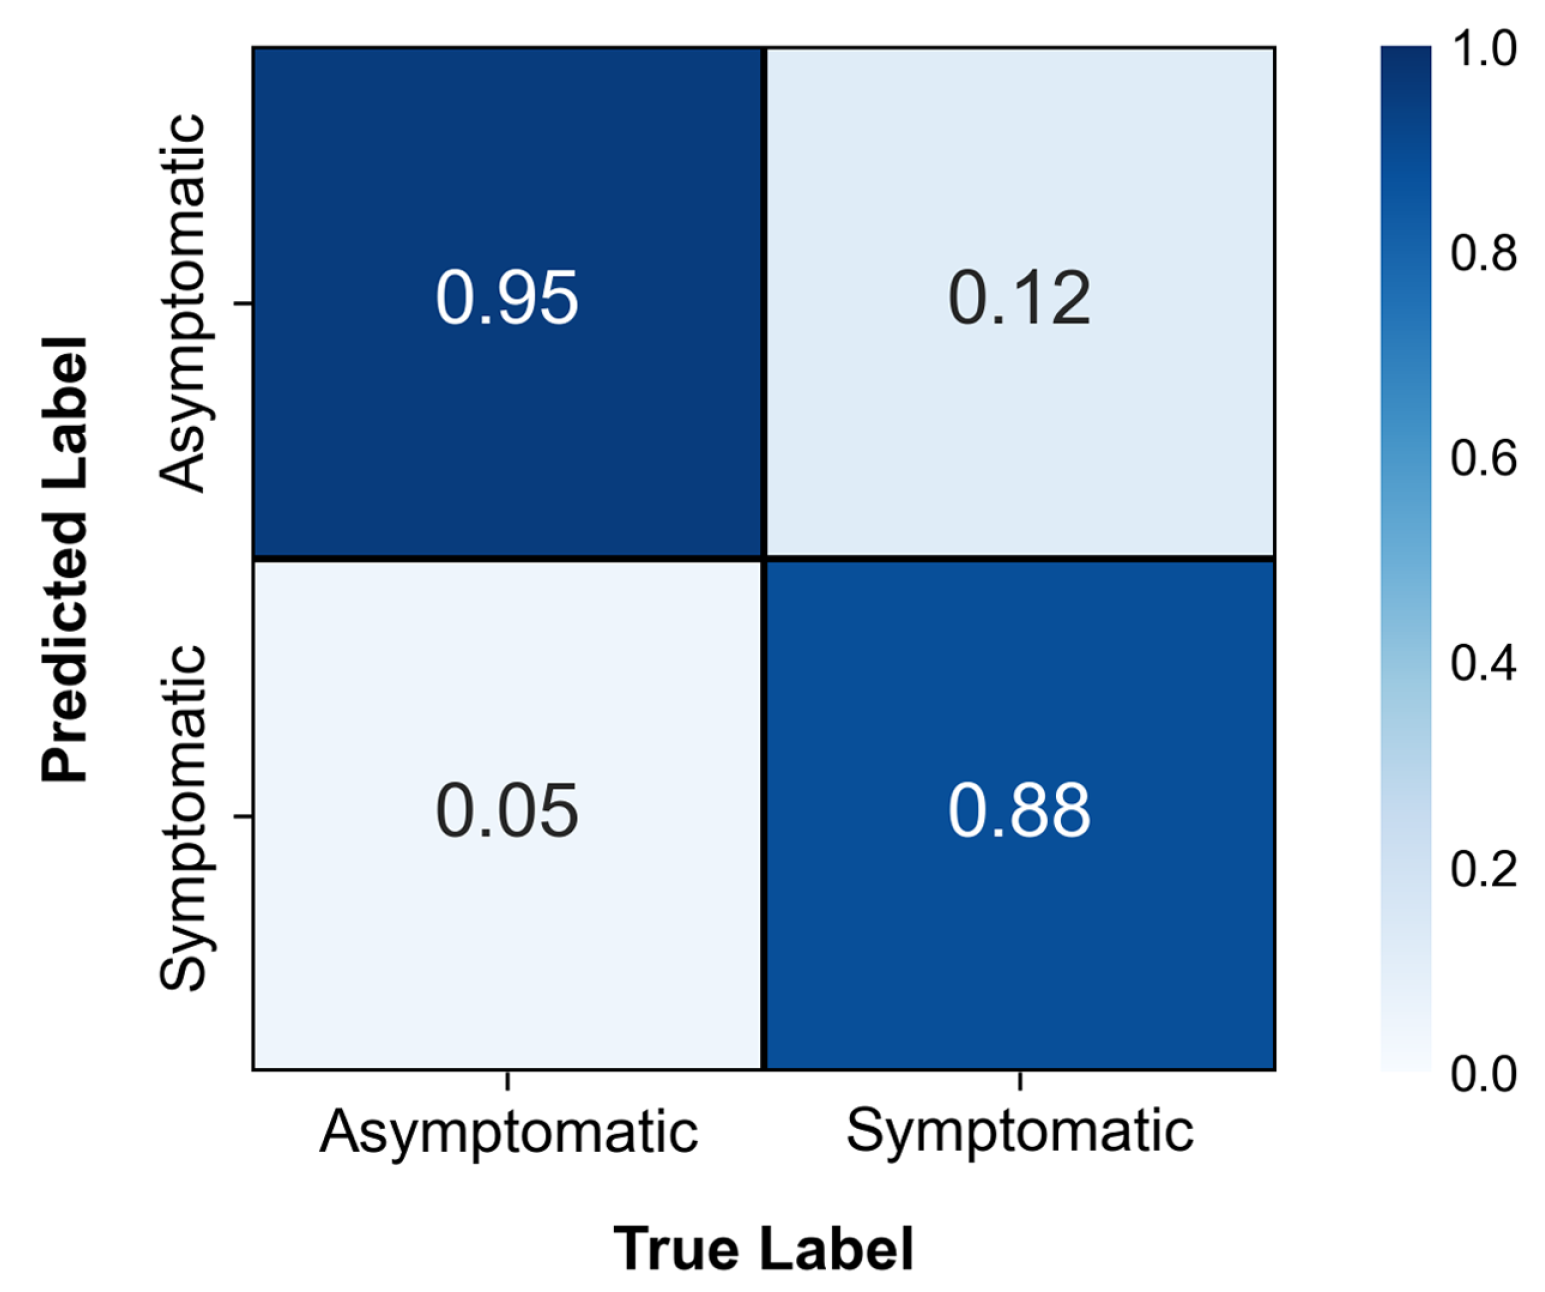
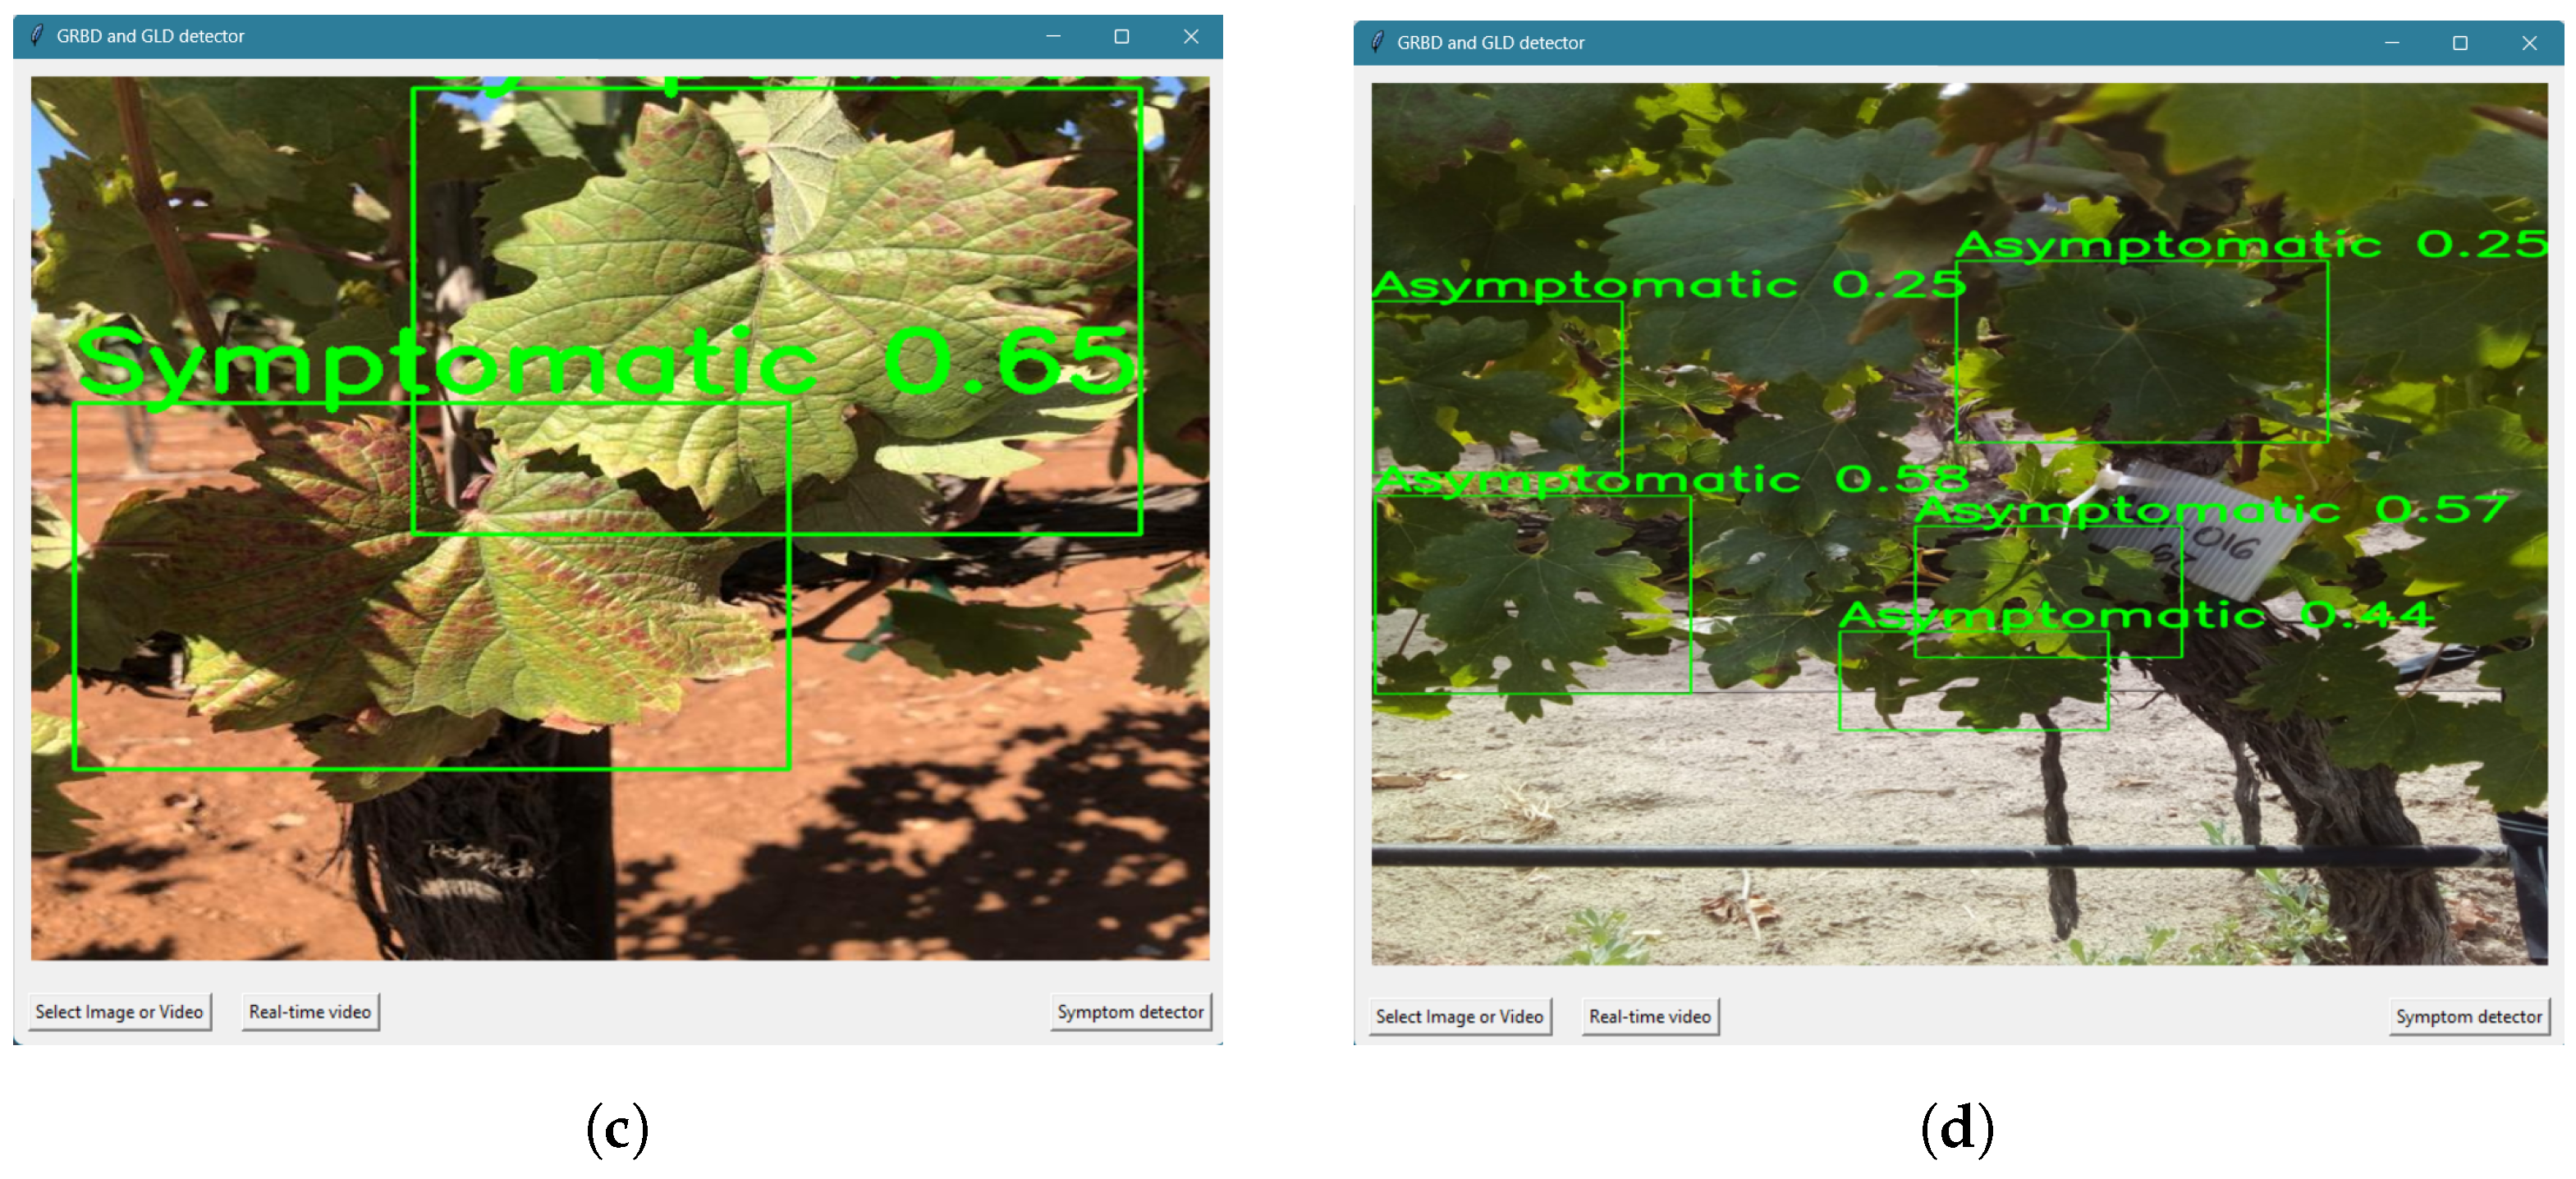
4.4. Real-World Usage Scenario
5. Discussion
6. Conclusions
Future Work
Author Contributions
Funding
Institutional Review Board Statement
Informed Consent Statement
Data Availability Statement
Acknowledgments
Conflicts of Interest
Abbreviations
| AI | Artificial intelligence |
| ANN | Artificial Neural Network |
| CBAM | Convolutional Block Attention Module |
| CNN | Convolutional Neural Network |
| DL | Deep learning |
| GLD | Grapevine leafroll disease |
| GLRaVs | Grapevine leafroll-associated viruses |
| GRBD | Grapevine red blotch disease |
| GRBV | Grapevine red blotch virus |
| LS-SVM | Least squares support vector machine |
| ML | Machine learning |
| RT-PCR | Reverse transcription polymerase chain reaction |
| ResNet | Residual network |
| RF | Random Forest |
| YOLO | You Only Look Once |
References
- Gatou, P.; Tsiara, X.; Spitalas, A.; Sioutas, S.; Vonitsanos, G. Artificial Intelligence Techniques in Grapevine Research: A Comparative Study with an Extensive Review of Datasets, Diseases, and Techniques Evaluation. Sensors 2024, 24, 6211. [Google Scholar] [CrossRef] [PubMed]
- International Organisation of Vine and Wine. 2022. Available online: https://www.oiv.int/sites/default/files/documents/OIV_Actualidad_de_la_coyuntura_del_sector_vitivinicola_mundial_en_2022_0.pdf (accessed on 2 February 2024).
- Instituto Nacional de Estadística y Geografía (INEGI). Economy and Productive Sectors: Agriculture. 2025. Available online: https://www.inegi.org.mx/temas/agricultura/ (accessed on 20 February 2025).
- Grape Production in Mexico 2022. Available online: https://www.gob.mx/siap/documentos/produccion-de-uva-en-mexico-2022 (accessed on 19 December 2023).
- Sembradas 4,365 hectáreas con vid en la Zona Costa de baja California: Agricultura. 2023. Available online: https://www.gob.mx/agricultura/bajacalifornia/articulos/sembradas-4-365-hectareas-con-vid-en-la-zona-costa-de-baja-california-agricultura (accessed on 29 January 2024).
- Yepes, L.M.; Cieniewicz, E.; Krenz, B.; McLane, H.; Thompson, J.R.; Perry, K.L.; Fuchs, M. Causative Role of Grapevine Red Blotch Virus in Red Blotch Disease. Phytopathology® 2018, 108, 902–909. [Google Scholar] [CrossRef] [PubMed]
- Gasperin-Bulbarela, J.; Licea-Navarro, A.F.; Pino-Villar, C.; Hernández-Martínez, R.; Carrillo-Tripp, J. First Report of Grapevine Red Blotch Virus in Mexico. Plant Dis. 2019, 103, 381. [Google Scholar] [CrossRef]
- Krenz, B.; Fuchs, M.; Thompson, J.R. Grapevine red blotch disease: A comprehensive Q&A guide. PLoS Pathog. 2023, 19, e1011671. [Google Scholar] [CrossRef]
- ICTV. Genus: Grablovirus. 2010. Available online: https://ictv.global/report/chapter/geminiviridae/geminiviridae/grablovirus (accessed on 19 December 2023).
- Fiallo-Olivé, E.; Lett, J.M.; Martin, D.P.; Roumagnac, P.; Varsani, A.; Zerbini, F.M.; Navas-Castillo, J. ICTV Virus Taxonomy Profile: Geminiviridae 2021. J. Gen. Virol. 2021, 102, 001696. [Google Scholar] [CrossRef] [PubMed]
- Fuchs, M.; Bar-Joseph, M.; Candresse, T.; Maree, H.J.; Martelli, G.P.; Melzer, M.J.; Menzel, W.; Minafra, A.; Sabanadzovic, S.; ICTV Report Consortium. ICTV Virus Taxonomy Profile: Closteroviridae. J. Gen. Virol. 2020, 101, 364–365. [Google Scholar] [CrossRef]
- Hommay, G.; Beuve, M.; Herrbach, E. Transmission of Grapevine Leafroll-Associated Viruses and Grapevine Virus A by Vineyard-Sampled Soft Scales (Parthenolecanium corni, Hemiptera: Coccidae). Viruses 2022, 14, 2679. [Google Scholar] [CrossRef]
- Cabaleiro, C.; Pesqueira, A.M.; Segura, A. Planococcus ficus and the spread of grapevine leafroll disease in vineyards: A 30-year-long case study in north-West Spain. Eur. J. Plant Pathol. 2022, 163, 733–747. [Google Scholar] [CrossRef]
- Comité Estatal de Sanidad Vegetal de Baja California. Plagas de vid. 2023. Available online: https://www.cesvbc.org/copia-de-manejo-fitosanitario-de-fr (accessed on 29 January 2024).
- Herrbach, E.; Alliaume, A.; Prator, C.A.; Daane, K.M.; Cooper, M.L.; Almeida, R.P.P. Vector Transmission of Grapevine Leafroll-Associated Viruses. In Grapevine Viruses: Molecular Biology, Diagnostics and Management; Springer International Publishing: Cham, Switzerland, 2017; pp. 483–503. [Google Scholar] [CrossRef]
- Atallah, S.S.; Gómez, M.I.; Fuchs, M.F.; Martinson, T.E. Economic Impact of Grapevine Leafroll Disease on Vitis vinifera cv. Cabernet franc in Finger Lakes Vineyards of New York. Am. J. Enol. Vitic. 2012, 63, 73–79. [Google Scholar] [CrossRef]
- Gao, Z.; Khot, L.R.; Naidu, R.A.; Zhang, Q. Early detection of grapevine leafroll disease in a red-berried wine grape cultivar using hyperspectral imaging. Comput. Electron. Agric. 2020, 179, 105807. [Google Scholar] [CrossRef]
- Burger, J.T.; Maree, H.J.; Gouveia, P.; Naidu, R.A. Grapevine leafroll-associated virus3. In Grapevine Viruses: Molecular Biology, Diagnostics and Management; Springer International Publishing: Cham, Switzerland, 2017; pp. 167–195. [Google Scholar] [CrossRef]
- Bahder, B.W.; Zalom, F.G.; Jayanth, M.; Sudarshana, M.R. Phylogeny of Geminivirus Coat Protein Sequences and Digital PCR Aid in Identifying Spissistilus festinus as a Vector of Grapevine red blotch-associated virus. Phytopathology® 2016, 106, 1223–1230. [Google Scholar] [CrossRef] [PubMed]
- Blanco-Ulate, B.; Hopfer, H.; Figueroa-Balderas, R.; Ye, Z.; Rivero, R.M.; Albacete, A.; Pérez-Alfocea, F.; Koyama, R.; Anderson, M.M.; Smith, R.J.; et al. Red blotch disease alters grape berry development and metabolism by interfering with the transcriptional and hormonal regulation of ripening. J. Exp. Bot. 2017, 68, 1225–1238. [Google Scholar] [CrossRef] [PubMed]
- Rumbaugh, A.C.; Sudarshana, M.R.; Oberholster, A. Grapevine Red Blotch Disease Etiology and Its Impact on Grapevine Physiology and Berry and Wine Composition. Horticulturae 2021, 7, 552. [Google Scholar] [CrossRef]
- Ricketts, K.D.; Gómez, M.I.; Fuchs, M.F.; Martinson, T.E.; Smith, R.J.; Cooper, M.L.; Moyer, M.M.; Wise, A. Mitigating the Economic Impact of Grapevine Red Blotch: Optimizing Disease Management Strategies in U.S. Vineyards. Am. J. Enol. Vitic. 2017, 68, 127–135. [Google Scholar] [CrossRef]
- Sudarshana, M.R.; Perry, K.L.; Fuchs, M.F. Grapevine Red Blotch-Associated Virus, an Emerging Threat to the Grapevine Industry. Phytopathology® 2015, 105, 1026–1032. [Google Scholar] [CrossRef] [PubMed]
- Lee, L.; Reynolds, A.; Lan, Y.; Meng, B. Identification of unique electromagnetic signatures from GLRaV-3 infected grapevine leaves in different stages of virus development. Smart Agric. Technol. 2024, 8, 100464. [Google Scholar] [CrossRef]
- Calvi, B.L. Effects of Red-leaf Disease on Cabernet Sauvignon at the Oakville Experimental Vineyard and Mitigation by Harvest Delay and Crop Adjustment. Master’s Thesis, University of California, Davis, CA, USA, 2011. [Google Scholar]
- Krenz, B.; Thompson, J.R.; McLane, H.L.; Fuchs, M.; Perry, K.L. Grapevine red blotch-associated virus Is Widespread in the United States. Phytopathology® 2014, 104, 1232–1240. [Google Scholar] [CrossRef] [PubMed]
- Naidu, R.A.; Maree, H.J.; Burger, J.T. Grapevine Leafroll Disease and Associated Viruses: A Unique Pathosystem. Annu. Rev. Phytopathol. 2015, 53, 613–634. [Google Scholar] [CrossRef] [PubMed]
- Naidu, R.; Rowhani, A.; Fuchs, M.; Golino, D.; Martelli, G.P. Grapevine Leafroll: A Complex Viral Disease Affecting a High-Value Fruit Crop. Plant Dis. 2014, 98, 1172–1180. [Google Scholar] [CrossRef]
- Martelli, G. Directory of virus and virus-like diseases of the grapevine and their agents. J. Plant Pathol. 2014, 96, 1–136. [Google Scholar]
- Sekharamantry, P.K.; Rao, M.S.; Srinivas, Y.; Uriti, A. PSR-LeafNet: A Deep Learning Framework for Identifying Medicinal Plant Leaves Using Support Vector Machines. Big Data Cogn. Comput. 2024, 8, 176. [Google Scholar] [CrossRef]
- Sawyer, E.; Laroche-Pinel, E.; Flasco, M.; Cooper, M.L.; Corrales, B.; Fuchs, M.; Brillante, L. Phenotyping grapevine red blotch virus and grapevine leafroll-associated viruses before and after symptom expression through machine-learning analysis of hyperspectral images. Front. Plant Sci. 2023, 14, 1117869. [Google Scholar] [CrossRef] [PubMed]
- Maeda Gutiérrez, V.; Guerrero Méndez, C.; Olvera Olvera, C.A.; Araiza Esquivel, M.A.; Espinoza García, G.; Bordón López, R. Convolutional neural networks for detection and classification of plant diseases based on digital imagenes. Rev. BiolóGico Agropecu. Tuxpan 2018. [Google Scholar] [CrossRef]
- Kunduracioglu, I.; Pacal, I. Advancements in deep learning for accurate classification of grape leaves and diagnosis of grape diseases. J. Plant Dis. Prot. 2024, 131, 1061–1080. [Google Scholar] [CrossRef]
- Elsherbiny, O.; Elaraby, A.; Alahmadi, M.; Hamdan, M.; Gao, J. Rapid Grapevine Health Diagnosis Based on Digital Imaging and Deep Learning. Plants 2024, 13, 135. [Google Scholar] [CrossRef] [PubMed]
- Pinheiro, I.; Moreira, G.; Queirós da Silva, D.; Magalhães, S.; Valente, A.; Moura Oliveira, P.; Cunha, M.; Santos, F. Deep Learning YOLO-Based Solution for Grape Bunch Detection and Assessment of Biophysical Lesions. Agronomy 2023, 13, 1120. [Google Scholar] [CrossRef]
- Wang, C.; Wang, Y.; Ma, G.; Bian, G.; Ma, C. Identification of Grape Diseases Based on Improved YOLOXS. Appl. Sci. 2023, 13, 5978. [Google Scholar] [CrossRef]
- Schieck, M.; Krajsic, P.; Loos, F.; Hussein, A.; Franczyk, B.; Kozierkiewicz, A.; Pietranik, M. Comparison of deep learning methods for grapevine growth stage recognition. Comput. Electron. Agric. 2023, 211, 107944. [Google Scholar] [CrossRef]
- Foundation Plant Services, UC Davis. FPS Grape Program—Sample Collection. 2025. Available online: http://fps.ucdavis.edu/samplecollection.cfm (accessed on 24 January 2025).
- García, K.; Carrillo Tripp, J. Grapevine Virus and Symptom Database (GVS-DB); Mendeley Data. 2024. Available online: https://data.mendeley.com/datasets/wkbd3wsjpj/1 (accessed on 5 December 2024).
- Gambino, G.; Perrone, I.; Gribaudo, I. A Rapid and effective method for RNA extraction from different tissues of grapevine and other woody plants. Phytochem. Anal. 2008, 19, 520–525. [Google Scholar] [CrossRef]
- Osman, F.; Leutenegger, C.; Golino, D.; Rowhani, A. Real-time RT-PCR (TaqMan) assays for the detection of Grapevine Leafroll associated viruses 1-5 and 9. J. Virol. Methods 2007, 141, 22–29. [Google Scholar] [CrossRef]
- Jocher, G. YOLOv5 by Ultralytics. 2020. [Google Scholar] [CrossRef]
- Liu, H.; Sun, F.; Gu, J.; Deng, L. SF-YOLOv5: A Lightweight Small Object Detection Algorithm Based on Improved Feature Fusion Mode. Sensors 2022, 22, 5817. [Google Scholar] [CrossRef]
- Ultralytics. Data Augmentation—Tools and Libraries. 2024. Available online: https://www.ultralytics.com/glossary/data-augmentation#tools-and-libraries (accessed on 18 January 2024).
- Redmon, J.; Farhadi, A. YOLOv3: An Incremental Improvement. arXiv 2018. [Google Scholar] [CrossRef]
- Reis, D.; Kupec, J.; Hong, J.; Daoudi, A. Real-Time Flying Object Detection with YOLOv8. arXiv 2023. [Google Scholar] [CrossRef]
- Jocher, G.; Chaurasia, A.; Qiu, J. Ultralytics YOLOv8. 2023. [Google Scholar] [CrossRef]
- He, K.; Zhang, X.; Ren, S.; Sun, J. Deep Residual Learning for Image Recognition. arXiv 2015. [Google Scholar] [CrossRef]
- Bendjillali, R.I.; Beladgham, M.; Merit, K.; Taleb-Ahmed, A. Illumination-robust face recognition based on deep convolutional neural networks architectures. Indones. J. Electr. Eng. Comput. Sci. 2020, 18, 1015–1027. [Google Scholar] [CrossRef]
- Dwyer, B.; Nelson, J.; Hansen, T. Roboflow, Version 1.0. 2024. Available online: https://roboflow.com (accessed on 18 January 2024).
- Galarza-Falfan, J.; García-Guerrero, E.E.; Aguirre-Castro, O.A.; López-Bonilla, O.R.; Tamayo-Pérez, U.J.; Cárdenas-Valdez, J.R.; Hernández-Mejía, C.; Borrego-Dominguez, S.; Inzunza-Gonzalez, E. Path Planning for Autonomous Mobile Robot Using Intelligent Algorithms. Technologies 2024, 12, 82. [Google Scholar] [CrossRef]
- Ju, Y.L.; Yue, X.F.; Zhao, X.F.; Zhao, H.; Fang, Y.L. Physiological, micro-morphological and metabolomic analysis of grapevine (Vitis vinifera L.) leaf of plants under water stress. Plant Physiol. Biochem. 2018, 130, 501–510. [Google Scholar] [CrossRef] [PubMed]


| Reference | Contributions | Algorithm/Model | Dataset | Results | Year |
|---|---|---|---|---|---|
| This work | Identification of symptoms related to GLD and GRBD in grapevines (Vitis vinifera) | DL, CNN and YOLOv5 | 3198 grapevine leaf images | YOLOv5 achieved an Accuracy of 95.36%, Overall Recall 95.77%, and F1-score 95.56% | 2025 |
| Kunduracioglu et al. [33] | Accurate classification of grapevine leaves and diagnosis of grape diseases | Performance comparison of 14 CNN and 17 vision Transformer models | 4062 images from the PlantVillage dataset and 500 images from the Grapevine dataset | 4 models reached an Accuracy of 100% for both datasets | 2024 |
| Elsherbiny et al. [34] | Rapid grapevine diagnosis using DL | CNN, LSTM, DNN, transfer learning with VGG16, VGG19, ResNet50, and ResNet101V2 | 295 images from the PlantVillage dataset | Validation Accuracy, Precision, Recall, and F1-score of 96.6% and an intersection over union of 93.4% | 2024 |
| Sawyer et al. [31] | Detection of GLD and GRBD in grapevine leaves | RF and 3D CNN | 500 hyperspectral images | The CNN model performed better, with an average Precision of 87% against 82.8% from the RF model | 2023 |
| Pinheiro et al. [35] | Grape bunch detection and identification of biophysical lesions | YOLOv5x6, YOLOv7-E6E, and YOLOR-CSP-X | 910 images | YOLOv7 achieved the best results with a Precision of 98%, a Recall of 90%, an F1-score of 94%, and a mAP of 77% | 2023 |
| Wang et al. [36] | Identification of 15 grape diseases | Improved YOLOXS and Convolutional Block Attention Module (CBAM) | China State Key Laboratory of Plant Pest Biology dataset | Average Precision of 99.1% | 2023 |
| Schieck et al. [37] | Grapevine growth stage recognition using DL models | ResNet, DenseNet, and InceptionV3 | Grapevine growth stage dataset (BBCH 71-79) | ResNet achieved the best classification results with an average Accuracy of 88.1% | 2023 |
| Gao et al. [17] | Identification of GLRaV-3 virus during asymptomatic and symptomatic stages of GLD | Least squares support vector machine (LS-SVM) | 500 hyperspectral images | Classifier Precision between 66.67% and 89.93% | 2020 |
| Edge Computing Device | CPU | GPU | RAM | Cost [USD] |
|---|---|---|---|---|
| Personal computer (laptop) | Ryzen 7 5800H | RTX 3050 | 40 GB | 1000.00 |
| Jetson Nano | Quad-core ARM Cortex-A57 | 128-core Maxwell | 2 GB LPDDR4 | 149.00 |
| Raspberry Pi 4 | Quad-core ARM Cortex-A72 | Broadcom VideoCore VI | 4 GB LPDDR4 | 72.80 |
| Year | Number of Images | Grapevine Cultivar | Leaves with Molecular Diagnosis Photographed |
|---|---|---|---|
| 2023 | 989 | Tempranillo, Syrah, Cabernet Sauvignon, Malbec, Nebbiolo, Barbera, Chenin blanc, Thompson, Crimson, Grenache, Red globe, Sauvignon blanc, and Mision | 347 |
| 2022 | 1044 | Tempranillo, Syrah, Cabernet Sauvignon, Chenin blanc, Colombard, Malbec, Nebbiolo, Merlot, Chardonnay, Grenache, Red globe, Carignan, and Petite Syrah | 453 |
| 2021 | 1142 | Cabernet Sauvignon, Nebbiolo italiana, Merlot, and Nebbiolo | 0 |
| 2019 | 13 | Gamay, Nebbiolo, Mounedre, Petit verdot, Merlot, Cabernet Sauvignon, Mision, and Crimson | 0 |
| 2018 | 10 | Nebbiolo, Temporal, Chardonnay, and Tempranillo | 0 |
| Total | 3198 | 23 different cultivars | 800 |
| Model | Resolution | Wide Angle Aperture | Ultra-Wide Angle Aperture | Telephoto Lens | Image Format |
|---|---|---|---|---|---|
| iPhone 8 | 12 MP | ƒ/1.8 | NA | NA | HEIF and JPEG |
| iPhone 10 | 12 MP | ƒ/1.8 | NA | ƒ/2.4 lens aperture | HEIF and JPEG |
| iPhone 13 | 12 MP | ƒ/1.6 | ƒ/2.4 lens aperture, 120° field of view | NA | HEIF and JPEG |
| iPhone 14 | 12 MP | ƒ/1.5 | ƒ/2.4 lens aperture, 120° field of view | NA | HEIF and JPEG |
| Hyperparameter | Value |
| Image size (–img) | 416 |
| Batch size (–batch) | 5 |
| Number of epochs (–epochs) | 30 |
| Data configuration file (–data) | data.yaml |
| Pre-trained weights (–weights) | yolov5s.pt |
| Experiment name (–name) | yolov5s_results_EN |
| Device (–device) | 1 |
| Cache images (–cache) | Enabled |
| Learning rate | 0.01 (default initial value) |
| Optimizer | SGD (Stochastic Gradient Descent) |
| Data Augmentation Hyperparameter | Value |
| HSV Hue | 0.015 |
| HSV Saturation | 0.7 |
| HSV Value | 0.4 |
| Translate | 0.1 |
| Scale | 0.5 |
| Flip left–right | 0.5 |
| Mosaic | 1 |
| Asymptomatic | Symptomatic | Total | |
|---|---|---|---|
| RT-PCR diagnosis | 200 | 600 | 800 |
| Visual symptoms diagnosis | 1335 | 1063 | 2398 |
| Total | 1535 | 1663 | 3198 |
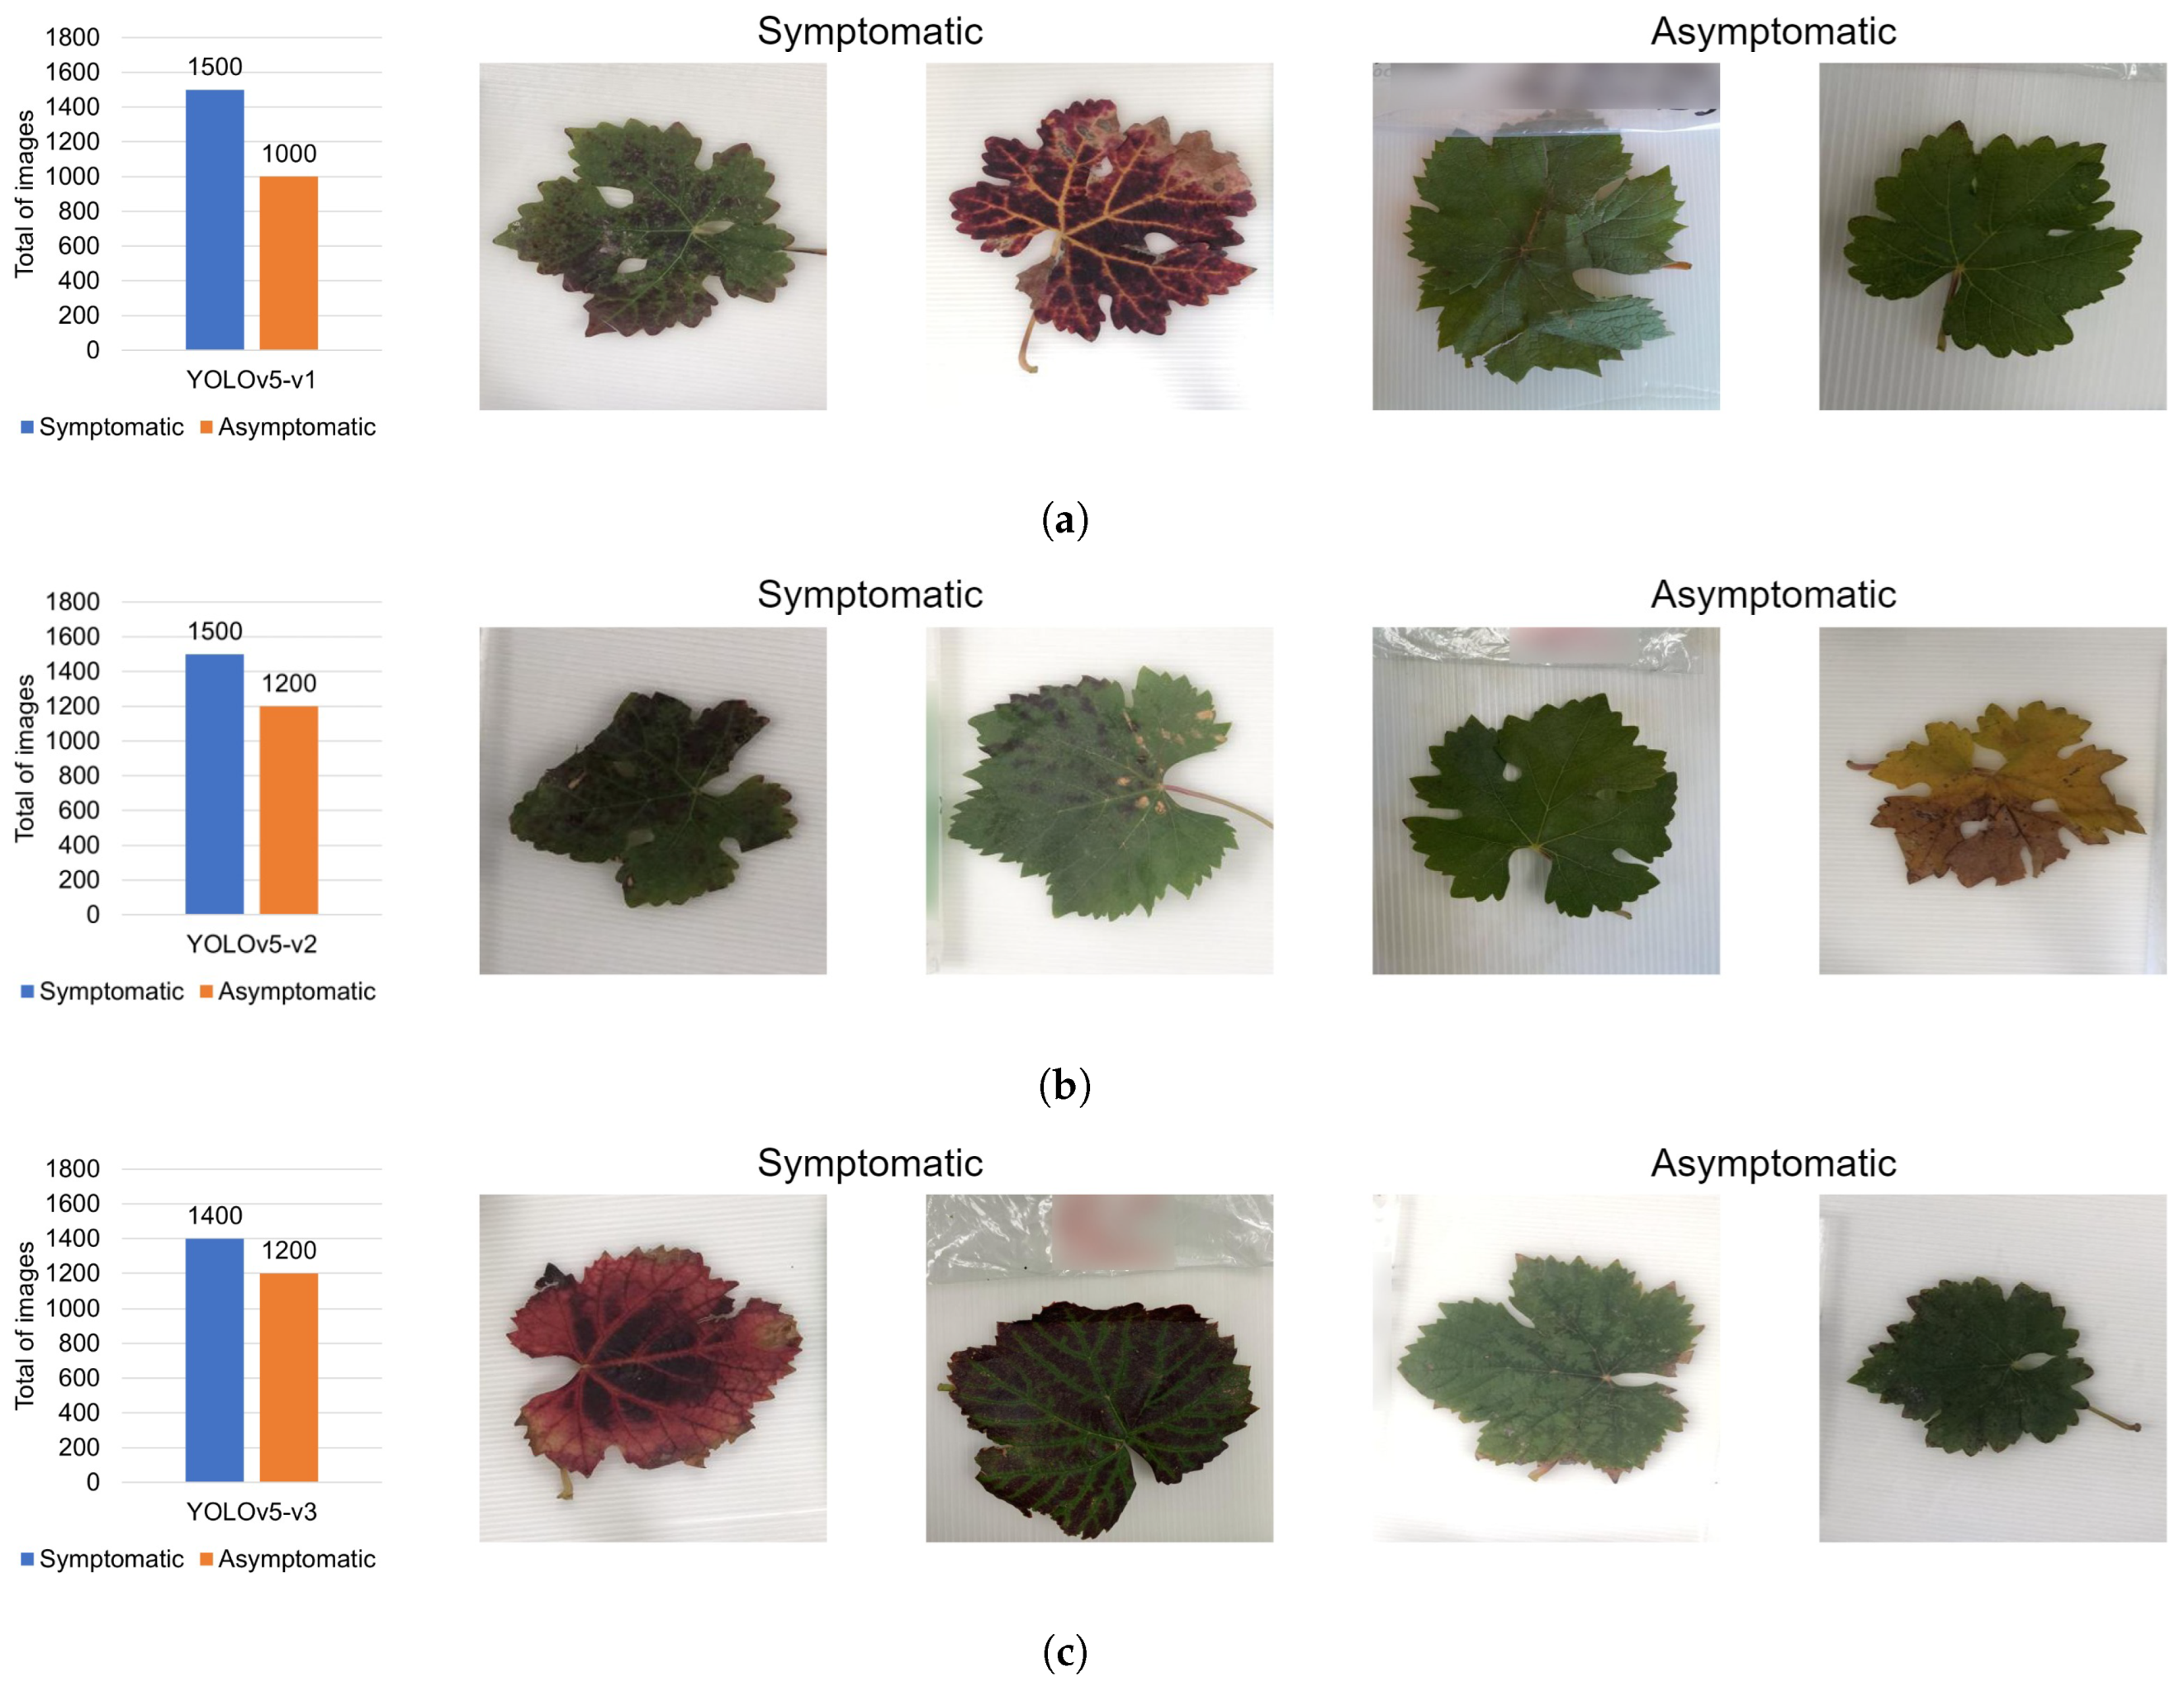
| Metrics | YOLOv5-v1 | YOLOv5-v2 | YOLOv5-v3 | YOLOv5-v4 | YOLOv5-v5 |
|---|---|---|---|---|---|
| Asymptomatic class Precision | 95.52% | 95.92% | 93.93% | 97.76% | 94.85% |
| Asymptomatic class error | 4.48% | 4.08% | 6.07% | 2.24% | 5.15% |
| Symptomatic class Precision | 88.06% | 94.12% | 92.94% | 95.05% | 95.87% |
| Symptomatic class error | 11.94% | 5.88% | 7.06% | 4.95% | 4.13% |
| Accuracy | 91.41% | 95.00% | 93.43% | 96.37% | 95.36% |
| Classification of individual leaves | Yes | Yes | Yes | Yes | Yes |
| Classification of asymptomatic grapevine leaves | No | No | Yes | Yes | Yes |
| Classification of symptomatic grapevine leaves | No | No | No | Yes | Yes |
| Classification of low-resolution images | No | No | No | No | Yes |
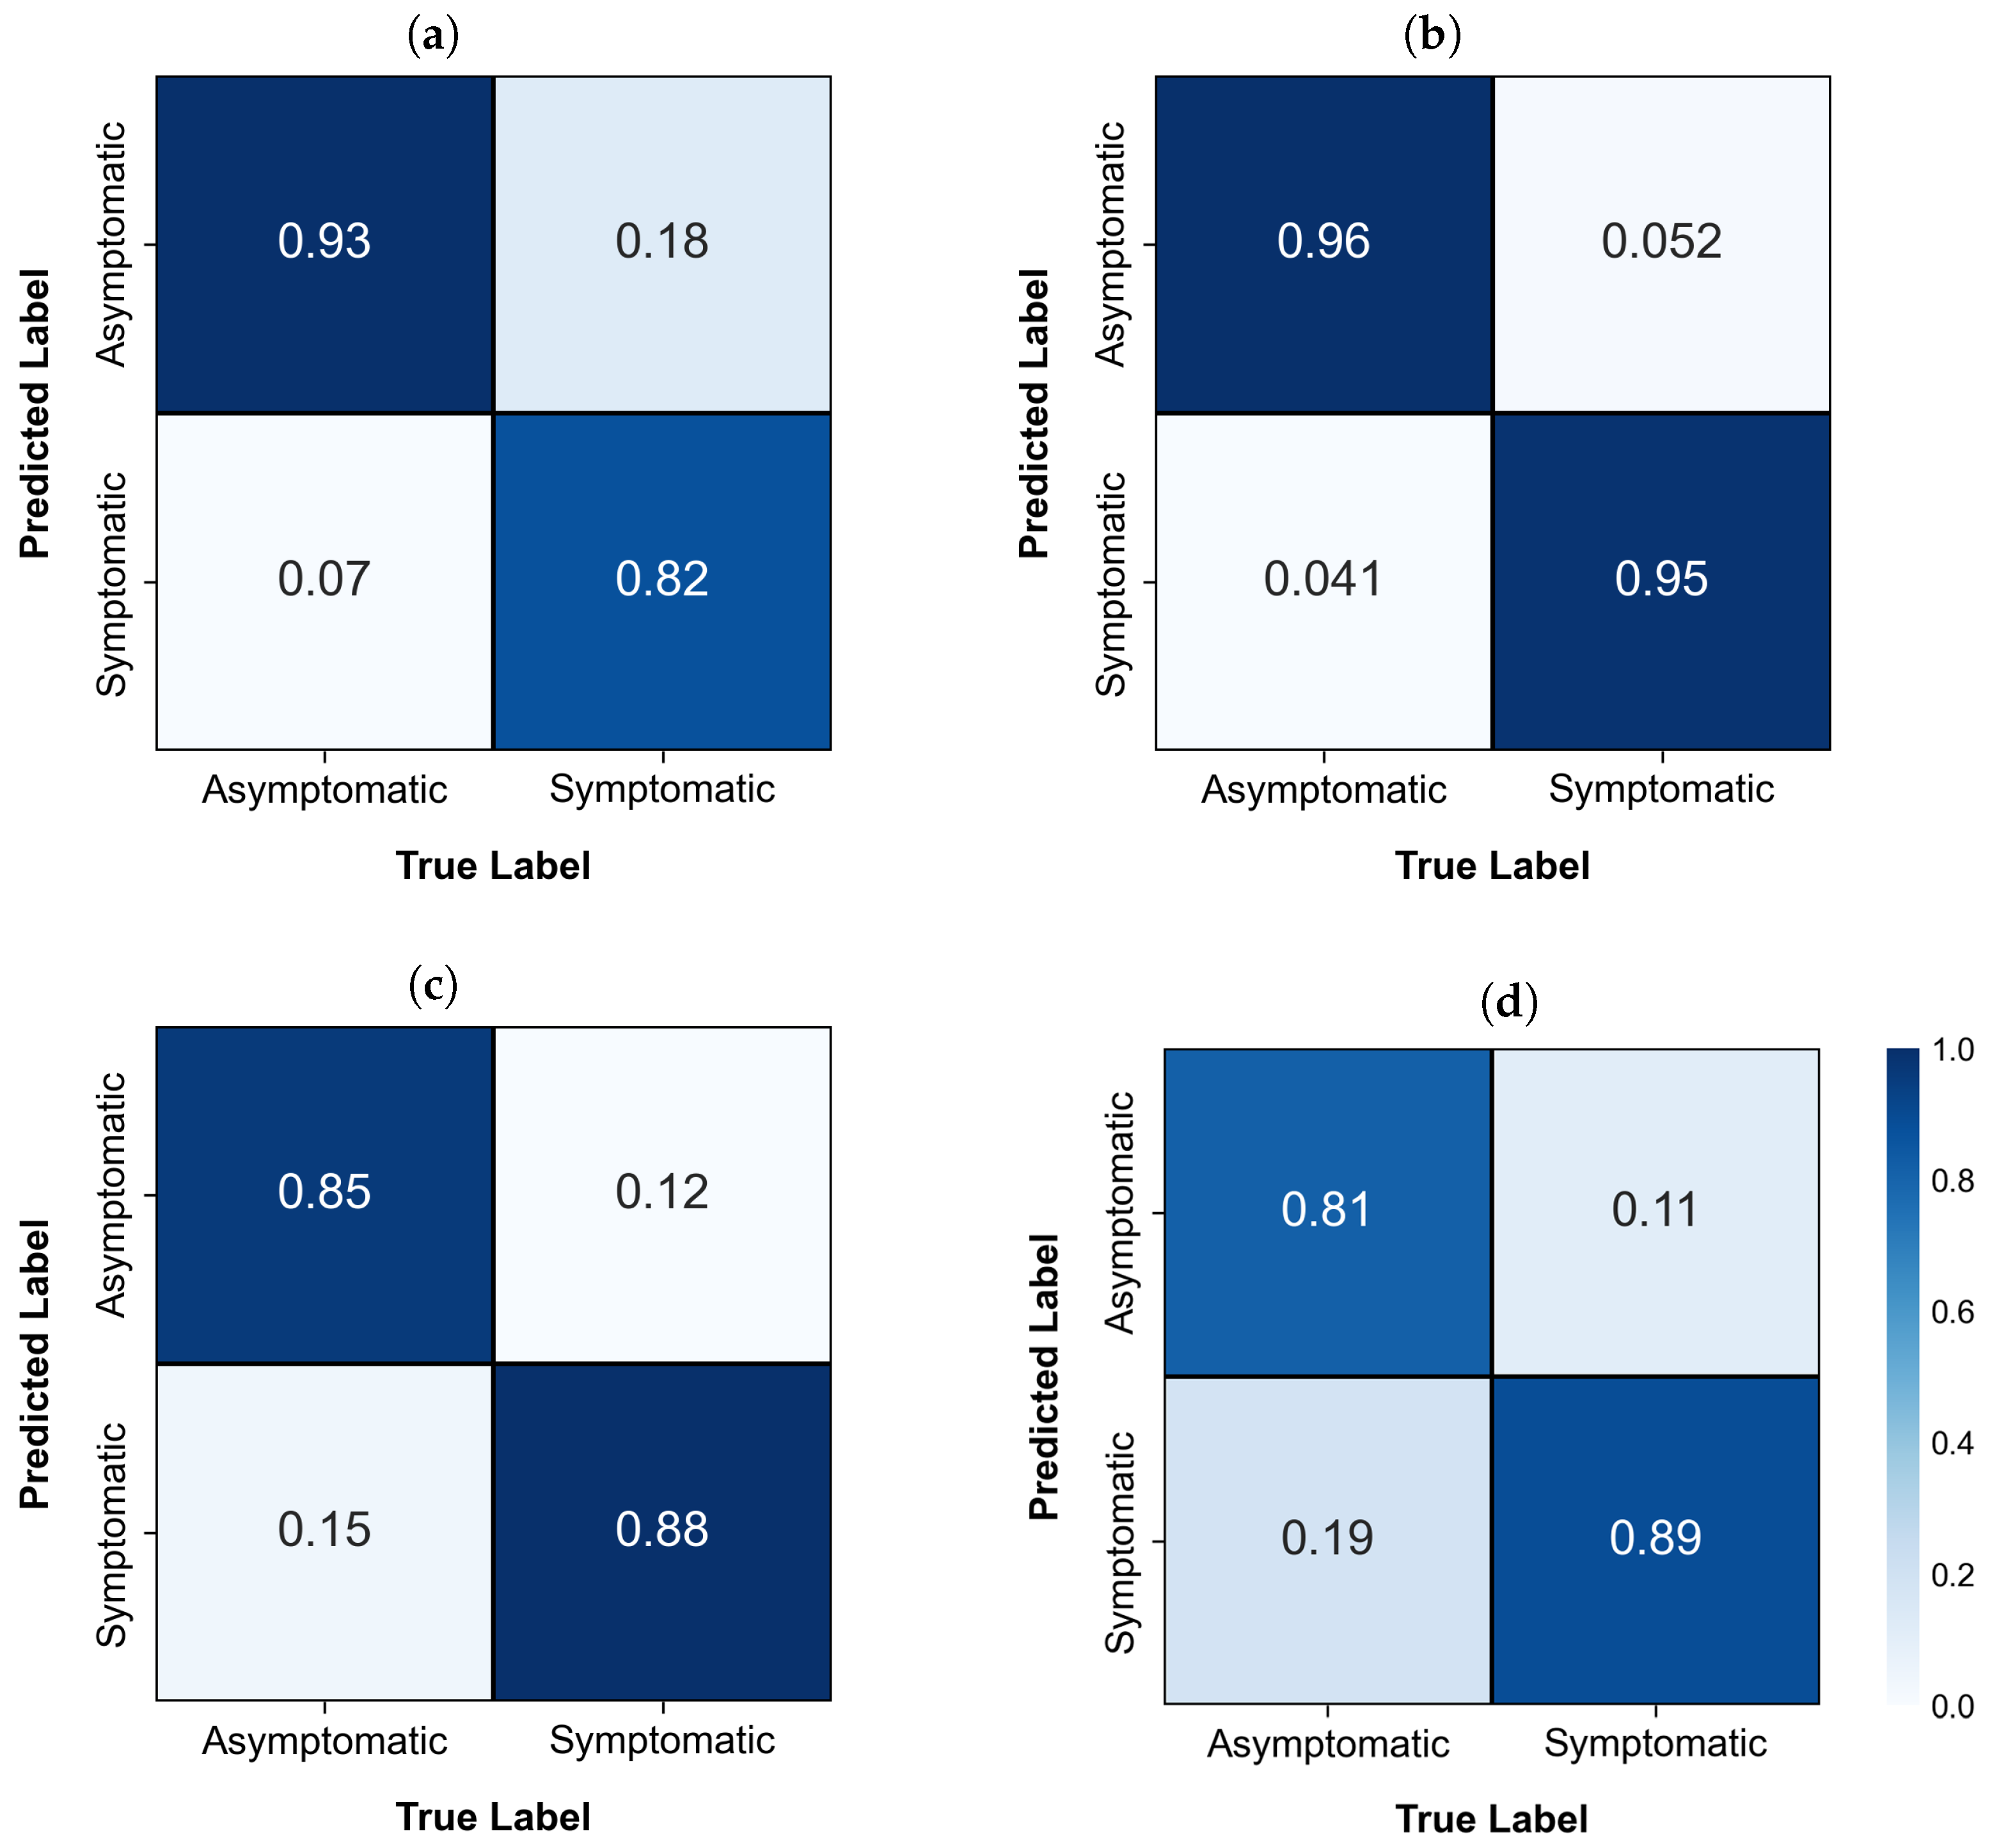
| Model | Classes | Accuracy | Precision | 1-Precision | Recall | 1-Recall | F1-Score |
|---|---|---|---|---|---|---|---|
| YOLOv3 | Asymptomatic | 0.8750 | 0.8378 | 0.1622 | 0.9300 | 0.0700 | 0.8815 |
| Symptomatic | 0.9213 | 0.0787 | 0.8200 | 0.1800 | 0.8677 | ||
| YOLOv5 | Asymptomatic | 0.9536 | 0.9485 | 0.0515 | 0.9592 | 0.0408 | 0.9538 |
| Symptomatic | 0.9587 | 0.0413 | 0.9479 | 0.0521 | 0.9533 | ||
| YOLOv8 | Asymptomatic | 0.8650 | 0.8763 | 0.1237 | 0.8500 | 0.1500 | 0.8629 |
| Symptomatic | 0.8544 | 0.1456 | 0.8800 | 0.1200 | 0.8670 | ||
| ResNet-50 | Asymptomatic | 0.8516 | 0.8799 | 0.1201 | 0.8143 | 0.1857 | 0.8459 |
| Symptomatic | 0.8272 | 0.1728 | 0.8889 | 0.1111 | 0.8569 |
| Image Resolution | Classes | Accuracy | Precision | 1-Precision | Recall | 1-Recall | F1-Score |
|---|---|---|---|---|---|---|---|
| 240 × 240 | Asymptomatic | 0.8763 | 0.8309 | 0.1691 | 0.9450 | 0.0550 | 0.8843 |
| Symptomatic | 0.9362 | 0.0638 | 0.8077 | 0.1923 | 0.8672 | ||
| 480 × 480 | Asymptomatic | 0.9125 | 0.8837 | 0.1163 | 0.9500 | 0.0500 | 0.9157 |
| Symptomatic | 0.9459 | 0.0541 | 0.8750 | 0.1250 | 0.9091 | ||
| 640 × 640 | Asymptomatic | 0.9300 | 0.8909 | 0.1091 | 0.9800 | 0.0200 | 0.9333 |
| Symptomatic | 0.9778 | 0.0222 | 0.8800 | 0.1200 | 0.9263 |
| Edge Computing Device | Inference Time Based on Image Resolution [ms] | FPS | ||||
|---|---|---|---|---|---|---|
| 240 × 240 | 480 × 480 | 640 × 640 | 240 × 240 | 480 × 480 | 640 × 640 | |
| Raspberry Pi | 521.4 | 1309.8 | 2160.7 | 1.8181 | 0.9012 | 0.5554 |
| Jetson NANO | 315.2 | 757.3 | 1277.4 | 3.9682 | 1.8181 | 1.0204 |
| Personal computer (laptop) | 10.4 | 10.4 | 10.5 | 114.9425 | 96.15384 | 78.74015 |
Disclaimer/Publisher’s Note: The statements, opinions and data contained in all publications are solely those of the individual author(s) and contributor(s) and not of MDPI and/or the editor(s). MDPI and/or the editor(s) disclaim responsibility for any injury to people or property resulting from any ideas, methods, instructions or products referred to in the content. |
© 2025 by the authors. Licensee MDPI, Basel, Switzerland. This article is an open access article distributed under the terms and conditions of the Creative Commons Attribution (CC BY) license (https://creativecommons.org/licenses/by/4.0/).
Share and Cite
Lazcano-García, C.; García-Resendiz, K.G.; Carrillo-Tripp, J.; Inzunza-Gonzalez, E.; García-Guerrero, E.E.; Cervantes-Vasquez, D.; Galarza-Falfan, J.; Lopez-Mercado, C.A.; Aguirre-Castro, O.A. Deep Learning-Based System for Early Symptoms Recognition of Grapevine Red Blotch and Leafroll Diseases and Its Implementation on Edge Computing Devices. AgriEngineering 2025, 7, 63. https://doi.org/10.3390/agriengineering7030063
Lazcano-García C, García-Resendiz KG, Carrillo-Tripp J, Inzunza-Gonzalez E, García-Guerrero EE, Cervantes-Vasquez D, Galarza-Falfan J, Lopez-Mercado CA, Aguirre-Castro OA. Deep Learning-Based System for Early Symptoms Recognition of Grapevine Red Blotch and Leafroll Diseases and Its Implementation on Edge Computing Devices. AgriEngineering. 2025; 7(3):63. https://doi.org/10.3390/agriengineering7030063
Chicago/Turabian StyleLazcano-García, Carolina, Karen Guadalupe García-Resendiz, Jimena Carrillo-Tripp, Everardo Inzunza-Gonzalez, Enrique Efrén García-Guerrero, David Cervantes-Vasquez, Jorge Galarza-Falfan, Cesar Alberto Lopez-Mercado, and Oscar Adrian Aguirre-Castro. 2025. "Deep Learning-Based System for Early Symptoms Recognition of Grapevine Red Blotch and Leafroll Diseases and Its Implementation on Edge Computing Devices" AgriEngineering 7, no. 3: 63. https://doi.org/10.3390/agriengineering7030063
APA StyleLazcano-García, C., García-Resendiz, K. G., Carrillo-Tripp, J., Inzunza-Gonzalez, E., García-Guerrero, E. E., Cervantes-Vasquez, D., Galarza-Falfan, J., Lopez-Mercado, C. A., & Aguirre-Castro, O. A. (2025). Deep Learning-Based System for Early Symptoms Recognition of Grapevine Red Blotch and Leafroll Diseases and Its Implementation on Edge Computing Devices. AgriEngineering, 7(3), 63. https://doi.org/10.3390/agriengineering7030063