Abstract
Given the current climate change scenario, it is essential to find strategies to reduce environmental risks and obtain economically sustainable agricultural productions. This study investigated the impact of various agronomic treatments on an almond orchard in northeastern Portugal, focusing on their relationships with crop growth/vigour and yield. The experiment was conducted using a factorial design that combined three variables: almond cultivar (Constantí and Vairo), irrigation regime (full and regulated deficit irrigation), and kaolin application (with or without application). These combinations resulted in eight distinct treatments, each replicated across two experimental plots. To monitor the crop physiological status, two drone flights equipped with a multispectral camera were flown during the kernel-filling stage (3 and 30 August 2021). Vegetation indices (VI) derived from the multispectral images were used to assess the crop vigour. In relation to the production data, including kernel and in-shell almond weights, these were collected in 14 representative trees of each treatment. Lastly, parametric and nonparametric regression analyses were performed to better understand relationships between VI and crop yields and derive predictive models. The main results can be summarised as follows: (a) cv. Vairo was more vulnerable to the regulated deficit irrigation strategy with striking repercussions on almond production, translating into an average reduction per tree of 22% and 16% in almond kernel and in-shell almonds compared to full irrigation, respectively; (b) kaolin application did not reflect statistically significant differences in the mean crop yield, as Tukey’s pairwise comparisons involving kaolin as a differentiating factor (e.g., C100+k—C100, V100+K—V100) showed confidence intervals with central value close to zero; and (c) regression analysis using the nonparametric random forest model and individualised treatments demonstrated a better agreement with the observed data (R2 > 0.7). This research provided valuable insights into how cultivar selection, irrigation strategy, and kaolin application can influence the almond crop performance. When integrating multispectral aerial monitoring and advanced statistical modelling, it enables an effective assessment of both crop vigour and expected yield, supporting the development of more informed and adaptive management practices to face emerging environmental challenges.
1. Introduction
The almond (Prunus dulcis Mill.) is one of the most widely cultivated nuts worldwide, with a significant expansion in the Mediterranean basin [1,2], where environmental conditions present opportunities and challenges for crop growth and production. Opportunities lie in its ability to thrive in specific and diversified environments influenced by the local climate, soil type, water availability, and usual management practices, although its adaptation is highly dependent on the cultivar type [3,4]. Some almond cultivars, such as cv. Arrubia and Texas are more tolerant to drought or heat stress, while others, like cv. Tuono and Cossu may require more consistent water availability during the growing season to maintain high yields [5]. Therefore, selecting the right cultivar for specific edaphoclimatic conditions is fundamental to successful cultivation and optimised crop management. Nevertheless, the growing concern over climate change, driven by rising temperatures, water scarcity, and fluctuating rainfall patterns, is increasingly posing challenges to almond farming due to phenological variations that may affect the final yield and fruit quality [6,7,8]. These changes highlight the need for adaptive and sustainable strategies that ensure economically viable production systems whilst minimising environmental risks.
To face these challenges, farmers and almond growers, in particular, have explored various agronomic treatments, such as cultivar selection and irrigation strategies, among other agronomic practices, aimed at optimising water use, improving tree health, and increasing crop yields. According to the literature, one of the most critical aspects is related to irrigation management. Conventional methods often apply full irrigation (FI) throughout the growing season to meet the maximum crop water requirements, which can become unsustainable in water-scarce regions. In response, sustained and regulated deficit irrigation (SDI and RDI) has emerged as a promising water-saving strategy. SDI aimed to provide a certain level of water (i.e., a fraction of the crop evapotranspiration—ETc) during the growing season [9], while RDI focuses on reduced irrigation for specific phenological periods when trees are less sensitive to water stress [10,11]. Several studies have shown that both SDI and RDI can improve the water-use efficiency while maintaining or even enhancing almond yield and quality, making them more economically advantageous alternatives to FI [7,8,12]. However, their effectiveness may depend on other factors, such as cultivar sensitivity, environmental conditions, and the timing of water reduction [4,6,13], and hence, there is no generalised consensus on deficit irrigation (DI) effects. Some authors did not find significant yield losses when applying DI during the kernel-filling stage, as long as the plant water stress was moderate [14,15], contrary to other experiments, where specific DI strategies compromised almond yields [16,17]. Another management practice under investigation is the foliar kaolin application. Kaolin has been shown to reduce environmental stress on crops by reflecting excess sunlight and reducing heat load, leading to a possible decrease in the plant transpiration rate and an improvement in water-use efficiency terms [18]. Additionally, kaolin has pest-deterrent properties, potentially reducing the need for chemical pesticides [19,20].
Along with the agronomic treatments, technological advances have significantly improved the ability to monitor the crop’s physiological status and predict yields [21]. From the monitoring point of view, the use of unmanned aerial vehicles (UAVs) equipped with a variety of remote-sensing sensors, such as lidar and thermal, multi- and hyper-spectral cameras, has contributed to revolutionising the digitalisation of the local-scale agricultural sector by providing real-time surface reflectance values with high spatial and spectral resolutions and minimal atmospheric interference [22,23,24]. Focusing on agricultural land use, this remotely sensed information is often used as spectral bands or to derive vegetation indices (VI) oriented towards the assessment of the plant vigour and stress (e.g., biomass density, water shortages, and nitrogen and chlorophyll contents) in different phenological stages and their relationships with the crop yield [25,26,27].
From a set of 33 UAV-derived VI, the Normalised Difference Vegetation Index (NDVI), the Green NDVI (GNDVI), and the Normalised Difference Red Edge (NDRE) were identified as the most relevant when applying a machine learning approach (RF—random forest) combined with feature ranking to obtain improved maize yield predictions [28]. Another study involving 55 VI to predict corn yields demonstrated that VI computed from the Red Edge spectral band, or even using this band alone, can effectively capture enhanced prediction results compared to other VI [29]. However, according to a recent systematic comprehensive review, the NDVI emerges as one of the most widely used VI (60 studies) [22]. By incorporating other UAV-based crop parameters, namely, the Leaf Area Index (LAI) and the Soil and Plant Analyzer Development (SPAD) derived from VI, Han et al. [30] obtained high correlations (R2: 0.749–0.911) when comparing measured data with winter wheat yield estimates resulting from multivariable linear regression. Similarly, VI highly correlated with the LAI, proved to be more effective in estimating crop yield, particularly those composed by the Red Edge (720 nm) and near-infrared (NIR, 800 nm) bands [31]. In almond orchards, spectral VI have been designed to optimise irrigation practices by identifying water stress levels and guiding water application timings. Thereby, almond growers can monitor the canopy health and predict the harvest timing more accurately, ensuring that trees are not under- or over-irrigated [32,33].
To better understand the complex relationships between agronomic treatments and the crop physiological and productive responses, supervised parametric and nonparametric regression models have been commonly applied. Parametric regression is often used to predict crop yields based on a limited set of linearly related variables, while nonparametric machine learning algorithms have shown a superior performance when capturing non-linear relationships and interactions between multiple treatment factors. Using an ensemble of machine learning algorithms (e.g., Gaussian process regression, fuzzy inference system, SVR: support vector regression, decision tree, and RF) combined with the Bayesian model averaging technique, the most accurate rice grain yield predictions were accomplished [34]. Another ensemble application, including SVR, RF, and K-nearest neighbours (KNN), outperformed all the base models by estimating alfalfa yields [35]. Individually, the ordinary least squares (OLS) linear regression model and the nonparametric RF estimator have emerged as reliable options for predicting crop yields [22,36,37,38,39,40,41], occasionally employing recursive elimination techniques to select only the best predictive features [28,29,42,43,44]. In a broader context, the use of UAV-based multimodal data fusion techniques, which integrate spectral, thermal, and structural canopy features, combined with various regression models within a deep neural network (DNN) framework, provided a relatively accurate and robust estimation of soybean crop yield [45]. In summary, these machine and deep learning approaches have attracted increasing attention in estimating crop yields for their robustness and ease of data acquisition from heterogeneous sources, such as remote sensing and sensor networks [21].
By combining agronomic treatments with advanced remote sensing technologies and regression models, monitoring and predictive capabilities are strengthened to effectively support crop management. Under different management scenarios, particularly irrigation, machine learning techniques based on remote sensing and in situ measurements have often been used to determine yields for certain agricultural crops and thus identify both the most suitable irrigation treatment and the best-performing predictive model. These integrated approaches are, therefore, valuable tools in precision agriculture, helping to diagnose yield-limiting factors and make timely and informed decisions on how to boost the farm profitability, safeguarding food security and environmental sustainability [41,46,47]. However, the vast majority of these studies that statistically relate spectral biophysical indicators with crop yields have primarily focused on grain crops, such as wheat, rice, bean, maize, cotton, and coffee, without accounting for the influence of management practices [31,34,38,40,48,49,50,51,52,53].
To fill the research gaps identified, the objective and innovative aspect of this study is to investigate potential relationships between spectral VI and agricultural yields arising from different treatments on almond orchards. For this purpose, farm-level experiments involving two cultivars, two irrigation strategies, and kaolin application were implemented, and harvest and UAV-based measurements were carried out to evaluate the crop performance. As a result, a set of VI derived from UAV images, in conjunction with production data per almond tree, provided deeper insights into the impact of the targeted treatments and enabled the development of crop yield predictive models.
2. Materials and Methods
2.1. Case Study and Field Trials
The study was conducted in an almond orchard located in the municipality of Alfândega da Fé, in the northeastern part of Portugal (41°20′37″ N; 6°56′32″ W; 555 m a.s.l.), which was subjected to different management practices (treatments) in order to evaluate the response of two almond cultivars (Constantí and Vairo) (Figure 1). The almond has become increasingly relevant in the region’s agricultural and economic reality, given the relatively favourable edaphoclimatic conditions for its cultivation. The climate is typically Mediterranean with some continental influences, characterised by mild and wet winters and warm and dry summers (Csb-type Köppen–Geiger climate classification) [54], especially at lower altitudes, where the land use is predominantly agricultural. Regarding soils, structurally, these are quite diverse, influenced by the region’s complex geology and topography. According to the soil map for the northeast Portugal [55], lithosols associated with luvisols are prevalent. Luvisols are generally fertile soils suitable for agriculture and are, therefore, recommended for growing almond trees.
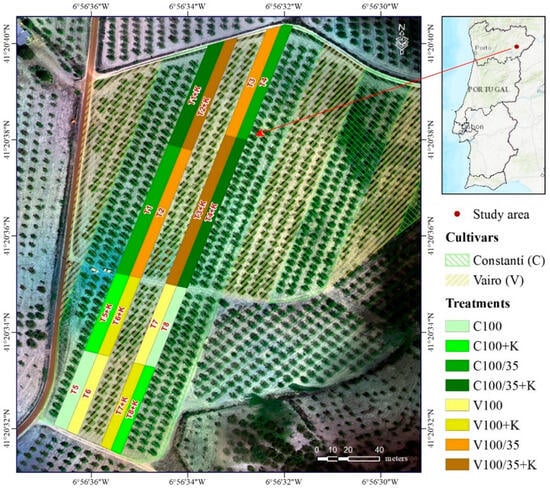
Figure 1.
Geographic location of the study area and its experimental design. Eight distinct treatments, combining three factorial variables: almond cultivar (Constantí—C; Vairo—V), irrigation regime (full irrigation—100; regulated deficit irrigation—100/35), and kaolin (with application—K), were delineated. Each treatment was replicated in two experimental plots.
The on-farm experiment was designed for the 2019–2021 period, combining three factors: cultivar, irrigation strategy, and foliar kaolin application. During that period, a set of measurements was performed to evaluate the almond kernel composition (e.g., oleic acid content, total volatiles) [56], quality parameters (e.g., morphology, colour, and nutritional value) [57], and physiological and agronomic parameters (e.g., leaf area, leaf water potential, and water-use efficiency—WUE) [58]. To complement these assessments, this work aimed to analyse the overall effect of various management practices on the crop’s growth and productivity in the last year of the field trials (2021). To this end, eight groups resulting from the combination of the three factors were delineated, hereinafter referred to as treatments. Each treatment was randomly replicated in two experimental plots (Figure 1 and Table 1), and 14 almond trees were assessed (seven in each plot) considering the multifactorial analysis: cultivar (Constantí and Vairo), irrigation regime (FI and RDI), and kaolin application (Yes or No). Full irrigation (FI) corresponded to 100% of crop evapotranspiration (ETc) throughout the entire irrigation period (7 June to 6 September), while the regulated deficit irrigation (RDI) treatment supplied 100% of ETc until the kernel-filling stage (14 July) and 35% of ETc thereafter until the harvest. The ETc was estimated using the FAO Penman–Monteith equation for reference evapotranspiration (ETo), adopting a crop coefficient (Kc) of 0.9 for the mid-season stage [59]. In 2021, the total irrigation water supplied was 2458.3 m3/ha in FI and 1433.6 m3/ha in RDI. The kaolin was applied at a rate of 2 L/tree of an aqueous kaolin suspension (4%) (BAS 24000 F, SURROUND®—95%) at the onset of the kernel-filling stage, coinciding with the transition to deficit irrigation in the corresponding treatments. Further details on the experimental design are provided in Barreales et al. [58].

Table 1.
Treatments implemented in experimental plots within an almond orchard.
From the crop growth point of view, the use of UAV technology was the solution adopted to cover the entire study area and spectral features, expressed through VI. Concerning the productivity data, the weight of in-shell almonds and almond kernels extracted from the monitored trees in each treatment was considered.
2.2. Remotely Sensed Image Acquisition and Processing
To capture vegetation features in a broad spatial and spectral range, a multirotor drone (DJI Matrice 300 RTK [60]) coupled with a multispectral camera covering 5 high-resolution narrow bands (RedEdge-MX [61]) was used, which includes the following centre wavelengths: 475 nm (Blue), 560 nm (Green), 668 nm (Red), 717 nm (Red Edge), and 842 nm (NIR—near infrared).
Two flights under clear sky conditions at 100 m altitude (above ground level) were conducted on 3 and 30 August 2021. These dates were chosen given the biomass density peak and the proximity of the harvesting season, so a closer relationship between VI and crop yields is expected. This observation is corroborated in other studies [29,34,38], as spectral data resulting from UAV and satellite measurements in months close to the harvest period showed a better correlation with crop yields and are, therefore, the most suitable for developing predictive models.
The obtained aerial images, with around 7 cm per pixel, were then photogrammetrically processed using the Agisoft software (Metashape Professional version 1.8.3) [62] to build orthomosaics for each spectral band. Afterwards, the spectral bands were combined to produce the VI analysed in this study (Table 2).

Table 2.
Set of vegetation indices tested in the present study.
2.3. Multivariate Statistical Analysis
Based on field and UAV monitoring results, a comprehensive statistical analysis in Python (version 3.12.4) relating management practices (treatments), almond yields (in kg/tree), and spectral features (VI), was carried out as follows (Figure 2):
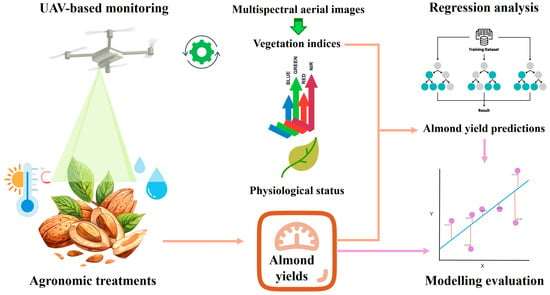
Figure 2.
Methodological scheme followed to establish statistical relationships involving management practices (treatments), vegetation indices, and almond yields.
- Treatments—descriptive statistics summarising their relationship with crop yields are presented. Then, an analysis of variance (ANOVA) was performed to compare means of the various treatments and assess significant differences among them, as well as multiple comparisons between treatment pairs using the Tukey test.
- Predictions—this component was designed for developing a supervised machine learning approach, when using the OLS and RF regression models to predict crop yields in each treatment based on selected spectral features (VI).
- Evaluation—the effectiveness of the crop yield predictive models was evaluated through the following statistical metrics: coefficient of determination (R2), mean absolute error (MAE), and root mean square error (RMSE).
2.3.1. Comparison of Treatments
In order to understand how each treatment influences the crop yield, expressed as the weight of in-shell almonds and almond kernel per tree, some descriptive statistics were reproduced in a boxplot, which provides a clear visual representation of the range of production values, and their central tendency (median) and spread (25th and 75th percentiles).
Secondly, any statistically significant differences between the treatments were evaluated by using the following:
- Analysis of variance (ANOVA)—one-way ANOVA was conducted to examine the almond production means of all treatments. Significant differences (p-value ≤ 0.05) are found if at least one mean is statistically different. In that case, the influence of the three targeted factors and their interactions (Table 1) on the almond production was also explored (three-way ANOVA). This multifactorial analysis enables us to understand not only the individual effect of each factor, but also how these factors interact with each other [72].
- Tukey’s Honestly Significant Difference (HSD) test—after ANOVA application, as there were significant overall differences among treatment means, multiple comparisons between pairs of treatments were performed to identify which pairs differ statistically. For each pairwise comparison, this post hoc test also provides a 95% confidence interval of the mean difference, representing the range within which the true difference in means is likely to be found. When the confidence interval includes zero, the difference between two treatments is not statistically significant [72].
2.3.2. Integration of Spectral Features to Predict Crop Yields
Once relationships between treatments and crop yields were established, the spectral features (expressed through mean values of each VI per tree canopy) were incorporated to assess their association with production data concerning the monitored almond trees, and identify those that contribute to developing robust and accurate predictive models. To this end, the following supervised learning methodology was outlined.
- Feature selection
A machine learning technique for recursive feature elimination with 10-fold cross-validation (RFECV) using the estimators “LinearRegression” (parametric) and “RandomForestRegressor” (nonparametric) was applied to find the optimal number and rank the best features to be included in the final modelling. This technique starts with all features tested in the present study (Table 2), recursively removing the least important ones and evaluating the model performance at each step. Thereby, the overfitting is controlled by eliminating non-informative or redundant features, helping to simplify the model and reduce computing costs, while maintaining or enhancing its predictive performance [73]. This feature selection procedure is particularly useful in statistical analyses involving samples or groups with few observations and too many features to be trained and tested.
- Regression models
Selected features through RFECV involving the tested parametric and nonparametric estimators were then used to fit the corresponding regression models:
- Parametric OLS model—This is employed in linear regression to estimate the relationship between explanatory variables (VI) and a dependent variable (crop yields) by minimising the sum of squared errors. It provides regression coefficients, and evaluates the statistical significance and model fit under linearity, independence, and homoscedasticity assumptions, and normal error distribution [74].
- Nonparametric RF model—This is based on an ensemble learning algorithm that builds multiple decision trees on different subsets (random samples) from the original data and combines their outputs to obtain accurate predictions. In addition, it reduces the risk of overfitting by averaging the results (regression) or by using majority voting (feature importance ranking), effectively handling the non-linearity of the predictors [75].
2.3.3. Modelling Evaluation
Lastly, crop yield predictions resulting from OLS and RF applications to the treatments were statistically evaluated using the R2, MAE, and RMSE (Equations (1)–(3)). These metrics provide a comprehensive understanding of the accuracy and reliability of the estimated results, measuring the variance explained by the models and the absolute and squared mean magnitude of errors:
where yi is the observed yield per tree i in each treatment; ŷi is the corresponding predicted yield per tree i in each treatment; ȳ is the mean of the observed yield in each treatment; n is the number of trees in each treatment.
3. Results and Discussion
3.1. Influence of Treatments on Crop Yields
Starting with an analysis of how the treatments impact crop yields (Figure 3), it is noteworthy that almond production values are substantially lower in the cv. Vairo, especially for treatments with RDI (V100/35 and V100/35+k). This evidence could be attributed to several factors related to the cultivar morphology (e.g., leaves, fruits, and root), physiology (e.g., photosynthetic and transpiration rates, stomatal conductance, and WUE), and its response to water stress, whose critical period is centred from June to September, considering the almond tree’s vegetative cycle in the study region [58]. In morphological terms, the worst performance in RDI for cv. Vairo compared to cv. Constantí could be related to the leaf characteristics, as these have a direct effect on the canopy’s resistance to drought. According to measurements previously carried out in this case study for both cultivars [58], it should be noted that the cv. Vairo accounted for a larger leaf area, making it more susceptible to water stress conditions. Physiologically, this cultivar showed lower photosynthetic activity and WUE, leading to a more significant reduction in vegetative growth and yield when irrigation is limited. Mirás-Avalos et al. [14] attribute the yield loss to the severity of the water stress and, to a lesser extent, to the DI strategy implemented. By adding kaolin, the response for the cv. Vairo was not very conclusive, maintaining production levels very close to those observed in the base treatments (V100 and V100/35). This outcome may be attributed to the complex interaction between environmental conditions and the prevailing effects on the cultivar.
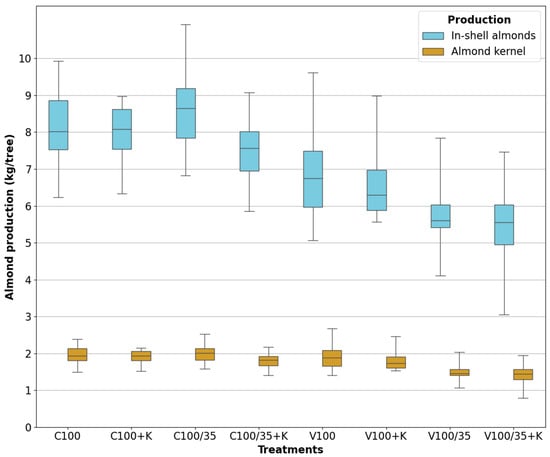
Figure 3.
Almond production (in-shell almonds and almond kernel in kg/tree) resulting from the implemented treatments. Each box shows the 25th, 50th, and 75th percentiles, while the extremes represent the minimum and maximum values.
Concerning the cv. Constantí, minor crop yield differences between FI and RDI treatments (C100 and C100/35) were found, indicating that a reduction in irrigation water up to 35% of ETc during the kernel-filling stage did not lead to a significant decrease in production values. This supports the theory proposed by other studies [7,15], suggesting that certain almond cultivars are less sensitive to water deficits during and after this phenological phase due to their moderate or low evaporative demand. In turn, a relatively marked production loss occurred in RDI with foliar kaolin application (C100/35+k), most likely due to the combined effect of the plant hydration and thermal status and the kaolin efficiency in mitigating heat injury. Thus, the fact that this cultivar shows an inhibiting response to kaolin under DI conditions can be largely attributed to the complex relationship between the stem water potential (i.e., water status) and the gas exchange (i.e., photosynthetic activity). Therefore, by reducing leaf temperature, the stomatal conductance and carbon dioxide (CO2) assimilation rate can be affected, and hence, the slight decrease in almond yields. In FI, the kaolin effect was barely noticeable. Such experimental inconsistencies involving kaolin application have been reported in several studies [76,77,78,79], although it is recognised that kaolin may improve tree health and yield. These studies indicate that potential benefits on photosynthetic capacity occur when plants are under moderate or severe water stress; however, they cannot take advantage of all the radiation that reaches the leaves. For these reasons, the effects of kaolin application on almond orchards, particularly in combination with other management practices, warrant further investigation.
Looking at the almond production data in each treatment, it is clear that the weight of in-shell almonds is directly proportional to the almond kernel.
Once production differences between treatments were discussed, an analysis of variance to verify whether any of the treatments differ statistically (one-way ANOVA), as well as to assess the influence of the targeted factors and their combinations (three-way ANOVA), was carried out (Table 3). One-way ANOVA results revealed statistically significant differences among treatments, indicating that at least one treatment’s mean differs from the others (p-value ≅ 0.00). Analysing the influence of the factors, individually, significant differences were found (p-value ≤ 0.05). When combining them, it is perfectly evident that in all interactions involving the kaolin factor, its effect is not significant to change almond production (p-value ≥ 0.05 in both production types). This corroborates the previous analysis, where only the C100/35+K treatment differed considerably from the base treatment (C100/35).

Table 3.
Analysis of variance on almond production (in-shell almonds and almond kernel in kg/tree) considering all treatments (one-way ANOVA) and the effect of the analysed factors (C—Cultivar; I—Irrigation; K—Kaolin) and their interactions (three-way ANOVA).
Crossing the p-value with other statistical scores (SS—Sum of squares and F-test), once again, a smaller almond production variation is associated with the kaolin factor and its interactions (lower SS and F values for both production types).
Additionally, mean production differences between all possible pairs of treatments (28 combinations) were evaluated using the Tukey HSD test (Figure 4). The aim was to determine which specific treatments are significantly different from each other. As a result, the following aspects should be highlighted:
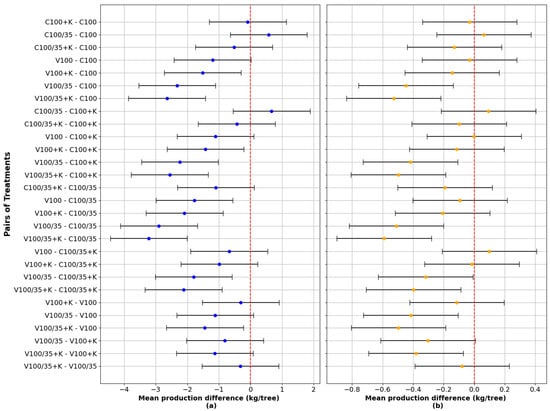
Figure 4.
Pairwise comparisons using Tukey’s HSD test. Each bar represents the mean production difference between treatments (in kg/tree) and its 95% confidence interval for (a) in-shell almonds and (b) almond kernel.
- In most pairwise comparisons, the cultivar factor contributed incisively to significant yield differences, as the mean difference did not contain zero;
- Differences tend to be negative, essentially due to the higher production records for the cv. Constantí, and in V100 compared to V100/35;
- The closest combinations to zero (central value) occurred mainly when the kaolin application was the differentiating factor. Zero in the error bars (i.e., confidence intervals) represents a probable absence of differences between the two treatments;
- In most cases, mean differences in in-shell almond production showed a relatively similar pattern to that of kernel production, although with values differing in magnitude.
3.2. Crop Yield Predictions and Evaluation
Ultimately, VI that reflect the crop growth and vigour were also incorporated to evaluate their relationship with the treatments and subsequent yields, thus providing a solid basis for developing predictive models.
For this purpose, the OLS and RF regression models using RFECV on the selected VI were applied to further refine the ideal number of variables, identifying those that accurately and significantly describe crop yields, considering the analysed treatments (Table A1 in Appendix A). OLS results for each treatment, UAV flight date, and production type are expressed through linear regression equations, which translate real-world relationships into quantifiable and actionable insights for prediction, decision-making support, and understanding the influence of each variable. In turn, the RF model provided high-accuracy predictions by selecting relevant features (VI) with reduced overfitting, ranking them according to their importance. In the different treatments, this is particularly useful for understanding which features have a greater influence on crop yields. Figure 5 presents the selected features for each treatment on 3 and 30 August 2021 and their weighting to predict in-shell almond yields. Similar results were achieved for almond kernel production (Figure A1 in Appendix B), with the following key points standing out:
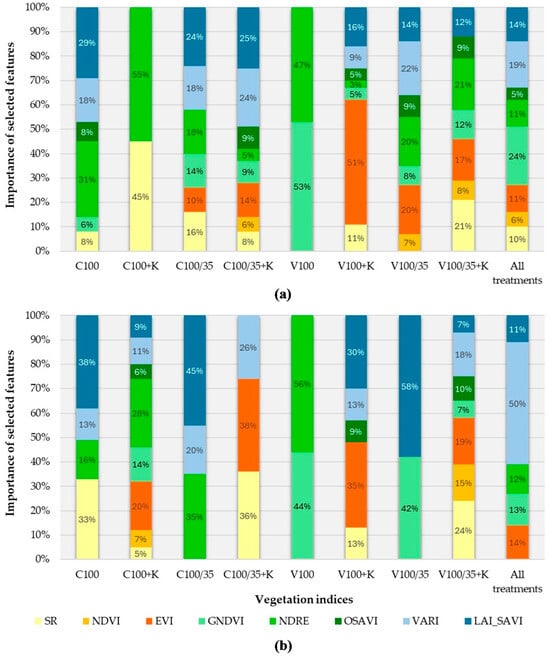
Figure 5.
Importance of selected features (in %), expressed through vegetation indices retrieved from UAV aerial images on 3 August 2021 (plot (a)) and 30 August 2021 (plot (b)), for each treatment using the RF regression model to predict in-shell almond productions.
- The UAV flight date, from which the analysed VI were produced, shows considerable differences with regard to the selected features and their weight in estimating crop yields for each treatment. This happens because distinct VI can respond differently depending on the crop’s physiological and phenological conditions, thus altering their relationship with the dependent variable (almond production);
- Within the treatments, reduced model complexity, i.e., with fewer explanatory variables (VI), was found in C100 + K and V100 for 3 August 2021, and in C100/35, C100/35+K, V100, and V100/35 for 30 August 2021. Thereby, simpler and more interpretable models were generated by reducing the risk of overfitting;
- When relating the VI with the treatments, the results are not so conclusive, as the crop response variability to the VI depends largely on how the dataset is trained (i.e., by combining decision trees). However, there is a certain preponderance attributed to the GNVI and NDRE, most likely due to the fact that these saturate later than NDVI and are, therefore, more sensitive to canopy density and leaf chlorophyll variations. These UAV-based VI were also emphasised by Killeen et al. and Ramos et al. [28,29] when predicting maize yields using an RF ranking approach.
Analysing the final crop yield predictions for the treatments by using the RFECV-selected features, overall, it should be emphasised that the individualised appraisal per treatment contributed to a better fitting of the predicted values, noticeable through the higher R2 and the trendline closest to the reference (Figure 6 and Figure 7). This is particularly marked in the OLS regression applications, demonstrating that the selected VI effectively reproduces the crop yields in each treatment, which, as previously analysed, differ statistically. For this reason, OLS results with all treatments (i.e., obtained without individualising VI and yield scores by treatment) had a worse performance. In contrast, RF predictions showed a better agreement with the observed values compared to OLS, even in the scenario with all treatments (plot d), which could be justified due to the multiple random interactions of the dataset, assuming non-linearity among the variables.
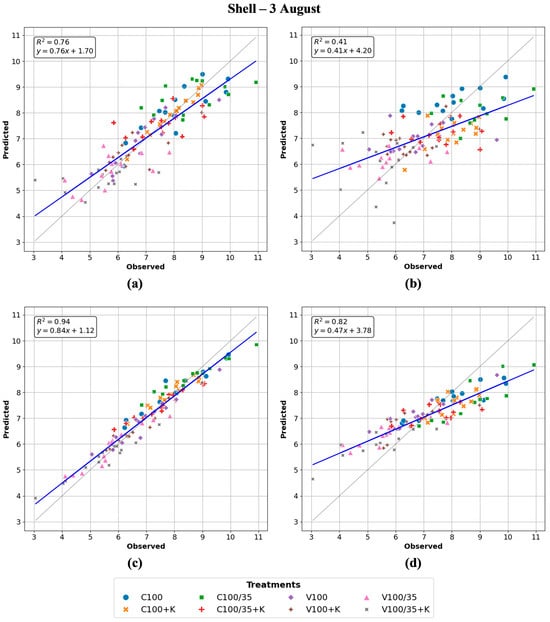
Figure 6.
Correlation between in-shell almond production (in kg/tree) observed and predicted based on vegetation indices retrieved from UAV flight on 3 August 2021 (trendline is blue, while the reference is dashed). Scenarios analysed: (a) OLS with individualised treatments; (b) OLS with all treatments; (c) RF with individualised treatments; and (d) RF with all treatments.
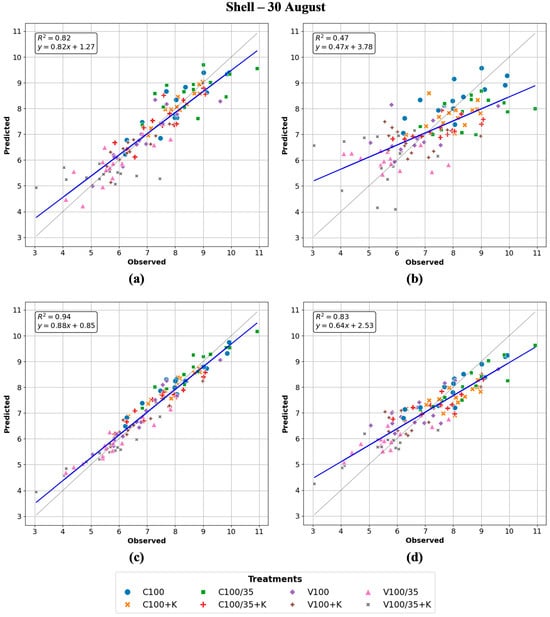
Figure 7.
Correlation between in-shell almond production (in kg/tree) observed and predicted based on vegetation indices retrieved from UAV flight on 30 August 2021 (trendline is blue, while the reference is dashed). Scenarios analysed: (a) OLS with individualised treatments; (b) OLS with all treatments; (c) RF with individualised treatments; and (d) RF with all treatments.
Statistical inaccuracies are associated with the difficulty of capturing extreme values in each treatment (plots a and c) and the heterogeneity of the dataset when integrating all treatments into a single regression analysis (plots b and d). Focusing on the UAV flight dates, from which the VI were derived, a slight improvement in the in-shell almond production estimates is observed for the OLS scenarios (plots a and b) on 30 August 2021. This evidence might be linked to the approaching harvest date. Concerning the almond kernel production, similar regression results were obtained (Figure A2 and Figure A3 in Appendix B).
Beyond the R2 correlation coefficient, the MAE and RMSE statistical metrics were also computed to evaluate the overall performance of the OLS and RF regression models (Figure 8), considering applications by the following:
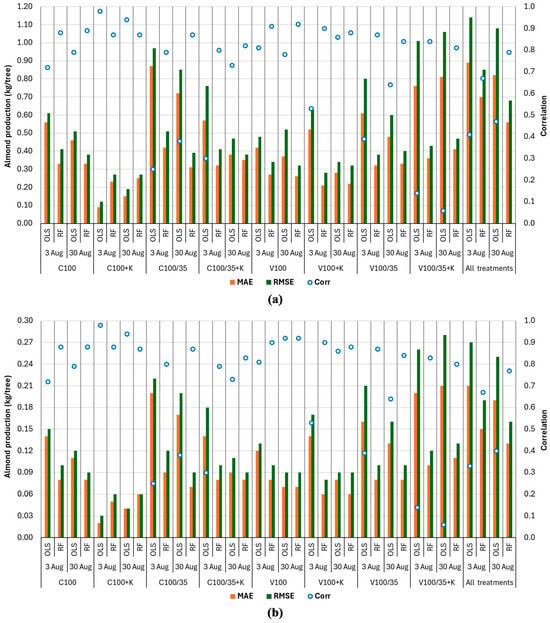
Figure 8.
Statistical metrics (MAE, RMSE, and Corr—correlation) resulting from regression analysis applied to the almond production data (in kg/tree) recorded in each treatment. In-shell almond production (plot (a)) and almond kernel (plot (b)) were estimated using the OLS and RF regression models based on vegetation indices retrieved from UAV flights on 3 and 30 August 2021.
- Treatment—the most significant deviations (higher MAE and RMSE) and lower R2 are associated with the C100/35, V100/35, and V100/35+K treatments, largely explained by the high data dispersion. For C100/35, larger deviations are also in line with the higher almond yields. By comparing the models, as previously mentioned, the RF algorithm contributed greatly to improved predictions. The exception is the C100+K treatment, where the OLS model generated more accurate results, indicating the existence of a predominantly linear and simple relationship among the variables. In the scenario with all treatments, the absolute and squared mean errors (MAE and RMSE) tend to be higher, reducing the variance explained by the models (R2).
- UAV flight date—in most treatments, lower average errors and a better correlation were found when dealing with special features (VI) from 30 August 2021. It therefore means that the closest spectral signature to the harvest may be a decisive factor for improving the performance of the regression models.
- Production type—when crossing plots a and b, a similar statistical pattern is observed, as the in-shell almond production is directly proportional to the extracted almond kernel. For this reason, part of the statistical analysis for almond kernel production is presented as auxiliary information (Appendix B).
This study demonstrated the importance of adopting sustainable management strategies that ensure economically viable productions whilst minimising environmental risks, as well as the potential of UAV-derived VI combined with machine learning approaches for estimating almond yields. However, it should be noted that the predictive capacity can be influenced by a series of factors, such as timing and frequency of flights, UAV camera specifications, photogrammetric processing techniques, dataset characteristics, and models and configurations adopted. This suggests that the optimal flight date should be selected based on the phenological stage most strongly associated with the crop yield, which may vary depending on plant species, local climate, and management practices. Such variability underscores the need for site-specific calibration when applying this methodology in different regions or growing conditions.
Regarding the modelling results, the regression analysis based on individualised treatments contributed to improved predictions. Nevertheless, the model’s applicability to other geographic contexts should be approached with caution, as local environmental and management variability may limit its generalisation beyond the training data. In addition, the variability observed between treatments, particularly in those with high yield dispersion, also affects the modelling accuracy and its ability to capture extreme values. To minimise these effects and enhance the regression robustness, cross-validation techniques were adopted to prevent overfitting and improve the generalisation process. By controlling overfitting, the models rely less on random noise or context-specific patterns and instead focus on the most consistent and influential predictors. This procedure naturally leads to simpler and more interpretable models, as it highlights the variables that truly explain yield variability, while discarding those with limited or unstable contributions.
Moreover, the possibility of integrating UAV technology with other earth observation (EO) platforms and in situ measurements across different phenological stages would support the development of a scalable and transferable modelling framework, applicable to a wide range of crops, regions, and management strategies. However, the high spatial resolution provided by UAV images offers a key advantage over satellite-based EO products, enabling the detection of fine-scale variability, which is especially important for perennial crops, like the almond tree. Thereby, subtle differences in canopy structure or vigour can translate into considerable yield variations. For the almond crop, Guimarães et al. [32] demonstrated that high-resolution remote sensing data combined with irrigation and climate information significantly enhance yield predictions.
4. Conclusions
This study explored possible relationships between UAV-derived VI and almond yields under various management treatments, providing a sound understanding of how these treatments impact almond production, and spectral VI can be used as reliable indicators for predicting the crop performance.
Among the treatments, the cultivar selection and the irrigation strategy were the main drivers of almond yield variability. The cv. Vairo showed yield reduction under regulated deficit irrigation (35% of ETc), indicating higher sensitivity to water stress, while the cv. Constantí maintained stable yields even under a limited water supply. Conversely, the application of kaolin, although intended to mitigate plant heat stress, did not lead to any significant change in crop yield and even resulted in a negative effect on the cv. Constantí under deficit irrigation, likely due to its detrimental interference with plant physiological processes. These evidences were statistically proven through variance analyses (ANOVA) and paired treatment comparisons (Tukey test).
To better understand the influence of the applied treatments, spectral VI were correlated with almond yields using the OLS and RF regression models. Indices sensitive to canopy structure and chlorophyll content, such as GNVI and NDRE, showed strong correlations with the yield, particularly those retrieved closer to the harvest date (30 August 2021). Furthermore, the modelling performance improved when regression analyses were conducted from individualised treatments, with the RF model providing more robust and reliable predictions than OLS by capturing non-linear relationships and reducing overfitting.
In conclusion, these findings emphasise the potential of spectral VI and machine learning techniques as powerful tools for precision agriculture, offering valuable insights for estimating crop yields and outlining sustainable management strategies. Notwithstanding their relevance, future research on agronomic treatments should include other environmental factors (e.g., meteorological variables, soil properties, and physiographic features) aimed at further refining crop yield predictions and optimising orchard management practices.
Author Contributions
Conceptualization, C.S., D.B., J.P.C., F.M. and A.C.R.; methodology, C.S., J.P.C. and A.C.R.; validation, C.S. and A.C.R.; formal analysis, C.S. and A.C.R.; investigation, C.S.; writing—original draft preparation, C.S.; writing—review and editing, C.S., D.B., J.P.C., F.M. and A.C.R. All authors have read and agreed to the published version of the manuscript.
Funding
This work was supported by national funds through FCT/MCTES (PIDDAC): CIMO UID/00690/2025 (10.54499/UID/00690/2025) and UID/PRR/00690/2025 (10.54499/UID/PRR/00690/2025); SusTEC, LA/P/0007/2020 (DOI: 10.54499/LA/P/0007/2020).
Institutional Review Board Statement
Not applicable.
Informed Consent Statement
Not applicable.
Data Availability Statement
The original contributions presented in this study are included in the article. Further inquiries can be directed to the corresponding author.
Conflicts of Interest
The authors declare no conflicts of interest.
Appendix A
Detailed alphanumeric information derived from the development of crop yield predictive models and their evaluation.

Table A1.
OLS and RF regression results and statistical metrics for the treatments, considering vegetation indices retrieved from UAV images (3 and 30 August 2021) and the almond production type.
Table A1.
OLS and RF regression results and statistical metrics for the treatments, considering vegetation indices retrieved from UAV images (3 and 30 August 2021) and the almond production type.
| Treatments | UAV Image Dates | Production Types | Models | Regression Results * | Statistical Metrics | ||
|---|---|---|---|---|---|---|---|
| R2 | MAE (kg/tree) | RMSE (kg/tree) | |||||
| C100 | 3 August 2021 | Shell | OLS | y = −10.57 + 126.44 GNDVI − 122,781.49 NDVI + 105,766.51 OSAVI | 0.72 | 0.56 | 0.61 |
| RF | NDRE: 0.31, LAI_SAVI: 0.29, VARI: 0.18, OSAVI: 0.08, SR: 0.08, GNDVI: 0.06 | 0.88 | 0.33 | 0.41 | |||
| Kernel | OLS | y = −2.54 + 30.41 GNDVI − 29,529.22 NDVI + 25,437.08 OSAVI | 0.72 | 0.14 | 0.15 | ||
| RF | NDRE: 0.32, LAI_SAVI: 0.28, VARI: 0.19, GNDVI: 0.08, OSAVI: 0.08, SR: 0.05 | 0.88 | 0.08 | 0.10 | |||
| 30 August 2021 | Shell | OLS | y = 45.54 + 108.22 EVI − 202,075.03 NDVI + 173,964.57 OSAVI − 74.41 VARI | 0.79 | 0.46 | 0.51 | |
| RF | LAI_SAVI: 0.38, SR: 0.33, NDRE: 0.16, VARI: 0.13 | 0.89 | 0.33 | 0.38 | |||
| Kernel | OLS | y = 10.95 + 26.02 EVI − 48,609.33 NDVI + 41,847.35 OSAVI − 17.89 VARI | 0.79 | 0.11 | 0.12 | ||
| RF | LAI_SAVI: 0.35, SR: 0.27, NDRE: 0.16, VARI: 0.09, GNDVI: 0.06, EVI: 0.04, OSAVI: 0.03 | 0.88 | 0.08 | 0.09 | |||
| C100+K | 3 August 2021 | Shell | OLS | y = −30.93 + 20.32 EVI + 116.74 GNDVI − 1.97 NDRE + 1798.08 NDVI − 1637.73 OSAVI + 1.62 SR − 84.25 VARI | 0.98 | 0.09 | 0.12 |
| RF | NDRE: 0.55, SR: 0.45 | 0.87 | 0.23 | 0.27 | |||
| Kernel | OLS | y = −7.40 + 4.86 EVI + 27.94 GNDVI − 0.47 NDRE + 424.82 NDVI − 387.20 OSAVI + 0.39 SR − 20.17 VARI | 0.98 | 0.02 | 0.03 | ||
| RF | NDRE: 0.50, GNDVI: 0.50 | 0.88 | 0.05 | 0.06 | |||
| 30 August 2021 | Shell | OLS | y = 0.36 + 14.01 EVI − 64.50 GNDVI + 107.17 NDRE + 347,395.55 NDVI − 299,485.12 OSAVI − 83.50 VARI | 0.94 | 0.15 | 0.19 | |
| RF | NDRE: 0.28, EVI: 0.20, GNDVI: 0.14, VARI: 0.11, LAI_SAVI: 0.09, NDVI: 0.07, OSAVI: 0.06, SR: 0.05 | 0.87 | 0.25 | 0.27 | |||
| Kernel | OLS | y = 0.09 + 3.35 EVI − 15.44 GNDVI + 25.65 NDRE + 83,166.21 NDVI − 71,696.49 OSAVI − 19.98 VARI | 0.94 | 0.04 | 0.04 | ||
| RF | NDRE: 0.27, EVI: 0.22, GNDVI: 0.14, VARI: 0.11, LAI_SAVI: 0.09, NDVI: 0.07, OSAVI: 0.06, SR: 0.04 | 0.87 | 0.06 | 0.06 | |||
| C100/35 | 3 August 2021 | Shell | OLS | y = −6.47 + 26.41 GNDVI − 1,267,243.94 NDVI + 1,092,458.64 OSAVI | 0.25 | 0.87 | 0.97 |
| RF | LAI_SAVI: 0.24, NDRE: 0.18, VARI: 0.18, SR: 0.16, GNDVI: 0.14, EVI: 0.10 | 0.79 | 0.42 | 0.51 | |||
| Kernel | OLS | y = −1.50 + 6.12 GNDVI − 293,566.27 NDVI + 253,075.99 OSAVI | 0.25 | 0.20 | 0.22 | ||
| RF | LAI_SAVI: 0.24, VARI: 0.17, NDRE: 0.15, OSAVI: 0.10, GNDVI: 0.10, EVI: 0.08, NDVI: 0.08, SR: 0.08 | 0.80 | 0.09 | 0.12 | |||
| 30 August 2021 | Shell | OLS | y = 14.96 + 387.99 GNDVI + 1,749,627.25 NDVI − 1,508,663.44 OSAVI + 194.07 VARI | 0.38 | 0.72 | 0.85 | |
| RF | LAI_SAVI: 0.45, NDRE: 0.35, VARI: 0.20 | 0.87 | 0.31 | 0.39 | |||
| Kernel | OLS | y = 3.46 + 89.88 GNDVI + 405,305.82 NDVI − 349,485.91 OSAVI + 44.96 VARI | 0.38 | 0.17 | 0.20 | ||
| RF | LAI_SAVI: 0.48, NDRE: 0.35, VARI: 0.17 | 0.87 | 0.07 | 0.09 | |||
| C100/35+K | 3 August 2021 | Shell | OLS | y = 5.29 − 79.55 GNDVI − 1,493,934.44 NDVI + 1,287,952.71 OSAVI | 0.30 | 0.57 | 0.76 |
| RF | LAI_SAVI: 0.25, VARI: 0.24, EVI: 0.14, GNDVI: 0.09, OSAVI: 0.09, SR: 0.08, NDVI: 0.06, NDRE: 0.05 | 0.80 | 0.32 | 0.41 | |||
| Kernel | OLS | y = 1.27 − 19.09 GNDVI − 358,502.35 NDVI + 309,072.51 OSAVI | 0.30 | 0.14 | 0.18 | ||
| RF | LAI_SAVI: 0.26, VARI: 0.24, SR: 0.14, EVI: 0.13, OSAVI: 0.12, GNDVI: 0.11 | 0.79 | 0.08 | 0.10 | |||
| 30 August 2021 | Shell | OLS | y = 1.52 + 69.10 NDRE + 1,233,352.10 NDVI − 1,063,263.57 OSAVI − 46.16 VARI | 0.73 | 0.38 | 0.47 | |
| RF | EVI: 0.38, SR: 0.36, VARI: 0.26 | 0.82 | 0.35 | 0.38 | |||
| Kernel | OLS | y = 0.37 + 16.58 NDRE + 295,951.23 NDVI − 255,137.33 OSAVI − 11.08 VARI | 0.73 | 0.09 | 0.11 | ||
| RF | EVI: 0.37, SR: 0.36, VARI: 0.27 | 0.83 | 0.08 | 0.09 | |||
| V100 | 3 August 2021 | Shell | OLS | y = −49.88 + 117.80 GNDVI + 335,659.77 NDVI − 289,393.31 OSAVI | 0.81 | 0.42 | 0.48 |
| RF | GNDVI: 0.53, NDRE: 0.47 | 0.91 | 0.27 | 0.34 | |||
| Kernel | OLS | y = −13.87 + 32.75 GNDVI + 93,320.44 NDVI − 80,457.40 OSAVI | 0.81 | 0.12 | 0.13 | ||
| RF | GNDVI: 0.46, NDRE: 0.31, LAI_SAVI: 0.23 | 0.90 | 0.08 | 0.10 | |||
| 30 August 2021 | Shell | OLS | y = 3.25 + 107.75 NDRE − 447,275.43 NDVI + 385,542.81 OSAVI | 0.78 | 0.37 | 0.52 | |
| RF | NDRE: 0.56, GNDVI: 0.44 | 0.92 | 0.26 | 0.32 | |||
| Kernel | OLS | y = 0.90 + 29.96 NDRE − 124,364.64 NDVI + 107,199.92 OSAVI | 0.92 | 0.07 | 0.09 | ||
| RF | NDRE: 0.56, GNDVI: 0.44 | 0.92 | 0.07 | 0.09 | |||
| V100+K | 3 August 2021 | Shell | OLS | y = −8.22 − 54.82 GNDVI + 405,592.38 NDVI − 349,590.51 OSAVI | 0.53 | 0.52 | 0.63 |
| RF | EVI: 0.51, LAI_SAVI: 0.16, SR: 0.11, VARI: 0.09, OSAVI: 0.05, GNDVI: 0.05, NDRE: 0.03 | 0.90 | 0.21 | 0.28 | |||
| Kernel | OLS | y = −2.25 − 15.02 GNDVI + 111,090.30 NDVI − 95,751.59 OSAVI | 0.53 | 0.14 | 0.17 | ||
| RF | EVI: 0.51, LAI_SAVI: 0.16, SR: 0.11, VARI: 0.09, OSAVI: 0.05, GNDVI: 0.04, NDRE: 0.04 | 0.90 | 0.06 | 0.08 | |||
| 30 August 2021 | Shell | OLS | y = −64.11 + 21.82 EVI + 349.00 GNDVI − 248.17 NDRE + 1,747,987.09 NDVI − 1,506,988.99 OSAVI − 5.81 SR + 58.25 VARI | 0.86 | 0.28 | 0.34 | |
| RF | EVI: 0.35, LAI_SAVI: 0.30, SR: 0.13, VARI: 0.13, OSAVI: 0.09 | 0.88 | 0.22 | 0.32 | |||
| Kernel | OLS | y = −17.56 + 5.98 EVI + 95.59 GNDVI − 67.97 NDRE + 478,770.09 NDVI − 412,761.20 OSAVI − 1.59 SR + 15.96 VARI | 0.86 | 0.08 | 0.09 | ||
| RF | EVI: 0.38, LAI_SAVI: 0.28, VARI: 0.13, SR: 0.13, OSAVI: 0.08 | 0.88 | 0.06 | 0.09 | |||
| V100/35 | 3 August 2021 | Shell | OLS | y = 11.14 − 21.55 GNDVI − 801,428.62 NDVI + 690,903.93 OSAVI | 0.39 | 0.61 | 0.80 |
| RF | VARI: 0.22, EVI: 0.20, NDRE: 0.20, LAI_SAVI: 0.14, OSAVI: 0.09, GNDVI: 0.08, NDVI: 0.07 | 0.87 | 0.32 | 0.38 | |||
| Kernel | OLS | y = 2.90 − 5.60 GNDVI − 208,256.50 NDVI + 179,535.93 OSAVI | 0.39 | 0.16 | 0.21 | ||
| RF | VARI: 0.22, EVI: 0.20, NDRE: 0.19, LAI_SAVI: 0.15, OSAVI: 0.09, GNDVI: 0.08, NDVI: 0.07 | 0.87 | 0.08 | 0.10 | |||
| 30 August 2021 | Shell | OLS | y = −13.91 + 93.55 EVI − 178.85 GNDVI − 2,348,816.12 NDVI + 2,024,891.02 OSAVI − 193.23 VARI | 0.64 | 0.48 | 0.60 | |
| RF | LAI_SAVI: 0.58, GNDVI: 0.42 | 0.84 | 0.33 | 0.40 | |||
| Kernel | OLS | y = −3.62 + 24.31 EVI − 46.48 GNDVI − 610,350.63 NDVI + 526,177.21 OSAVI − 50.21 VARI | 0.64 | 0.13 | 0.16 | ||
| RF | LAI_SAVI: 0.58, GNDVI: 0.42 | 0.84 | 0.08 | 0.10 | |||
| V100/35+K | 3 August 2021 | Shell | OLS | y = 6.89 + 17.94 GNDVI + 848,857.17 NDVI − 731,796.22 OSAVI | 0.14 | 0.76 | 1.01 |
| RF | NDRE: 0.21, SR: 0.21, EVI: 0.17, LAI_SAVI: 0.12, GNDVI: 0.12, OSAVI: 0.09, NDVI: 0.08 | 0.84 | 0.36 | 0.43 | |||
| Kernel | OLS | y = 1.79 + 4.67 GNDVI + 221,130.09 NDVI − 190,635.33 OSAVI | 0.14 | 0.20 | 0.26 | ||
| RF | NDRE: 0.22, EVI: 0.20, SR: 0.19, OSAVI: 0.15, GNDVI: 0.14, LAI_SAVI: 0.10 | 0.83 | 0.10 | 0.12 | |||
| 30 August 2021 | Shell | OLS | y = −0.79 + 28.18 GNDVI + 810,480.85 NDVI − 698,711.90 OSAVI | 0.06 | 0.81 | 1.06 | |
| RF | SR: 0.24, EVI: 0.19, VARI: 0.18, NDVI: 0.15, OSAVI: 0.10, GNDVI: 0.07, LAI_SAVI: 0.07 | 0.81 | 0.41 | 0.47 | |||
| Kernel | OLS | y = −0.21 + 7.34 GNDVI + 211,147.69 NDVI − 182,029.47 OSAVI | 0.06 | 0.21 | 0.28 | ||
| RF | SR: 0.23, EVI: 0.20, VARI: 0.17, NDVI: 0.14, OSAVI: 0.10, GNDVI: 0.08, LAI_SAVI: 0.08 | 0.80 | 0.11 | 0.13 | |||
| All treatments | 3 August 2021 | Shell | OLS | y = −35.89 + 12.25 EVI + 115.74 GNDVI − 71.92 NDRE − 532,134.94 NDVI + 458,715.31 OSAVI − 35.65 VARI | 0.41 | 0.89 | 1.14 |
| RF | GNDVI: 0.24, VARI: 0.19, LAI_SAVI: 0.14, NDRE: 0.11, EVI: 0.11, SR: 0.10, NDVI: 0.06, OSAVI: 0.05 | 0.67 | 0.70 | 0.85 | |||
| Kernel | OLS | y = −6.48 + 2.23 EVI + 20.15 GNDVI − 9.67 NDRE − 80,420.58 NDVI + 69,323.63 OSAVI − 6.59 VARI | 0.33 | 0.21 | 0.27 | ||
| RF | GNDVI: 0.25, NDRE: 0.17, LAI_SAVI: 0.17, VARI: 0.13, SR: 0.12, EVI: 0.09, OSAVI: 0.07 | 0.67 | 0.15 | 0.19 | |||
| 30 August 2021 | Shell | OLS | y = −17.01 + 12.33 EVI + 109.79 GNDVI − 21.26 NDRE + 76,670.78 NDVI − 66,166.38 OSAVI − 18.71 VARI | 0.47 | 0.82 | 1.08 | |
| RF | VARI: 0.50, EVI: 0.14, GNDVI: 0.13, NDRE: 0.12, LAI_SAVI: 0.11 | 0.79 | 0.56 | 0.68 | |||
| Kernel | OLS | y = −2.87 + 2.12 EVI + 24.06 GNDVI + 0.72 NDRE − 11,190.95 NDVI + 9629.70 OSAVI − 1.27 VARI | 0.40 | 0.19 | 0.25 | ||
| RF | VARI: 0.37, GNDVI: 0.20, NDRE: 0.18, EVI: 0.16, LAI_SAVI: 0.09 | 0.77 | 0.13 | 0.16 | |||
* OLS model—Linear regression equations; RF model—Importance of selected features.
Appendix B
Auxiliary graphical information based on the multivariate statistical analysis.
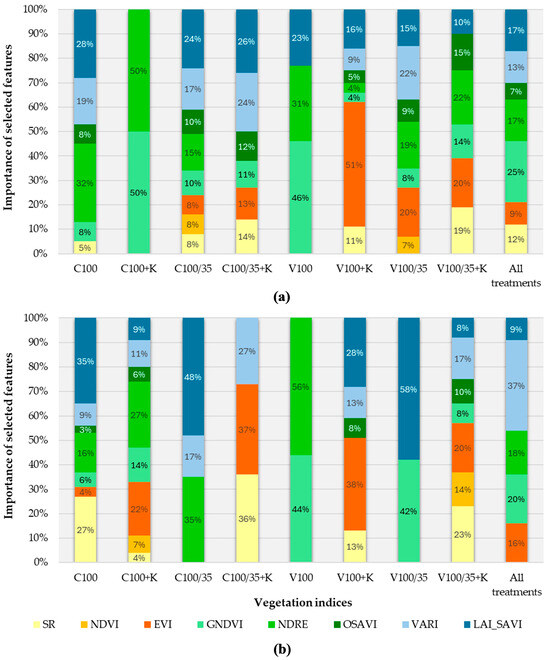
Figure A1.
Importance of selected features (in %), expressed through vegetation indices retrieved from UAV aerial images on 3 August 2021 (plot (a)) and 30 August 2021 (plot (b)), for each treatment using the RF regression model to predict almond kernel productions.
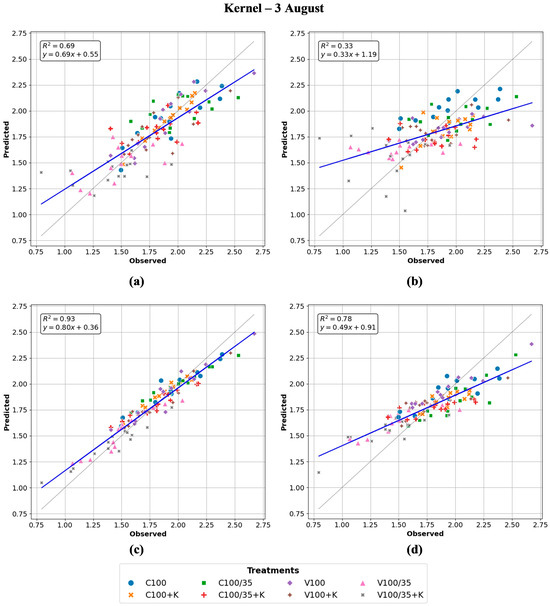
Figure A2.
Correlation between almond kernel production (in kg/tree) observed and predicted based on vegetation indices retrieved from UAV flight on 3 August 2021 (trendline is blue, while the reference is dashed). Scenarios analysed: (a) OLS with individualised treatments; (b) OLS with all treatments; (c) RF with individualised treatments; and (d) RF with all treatments.
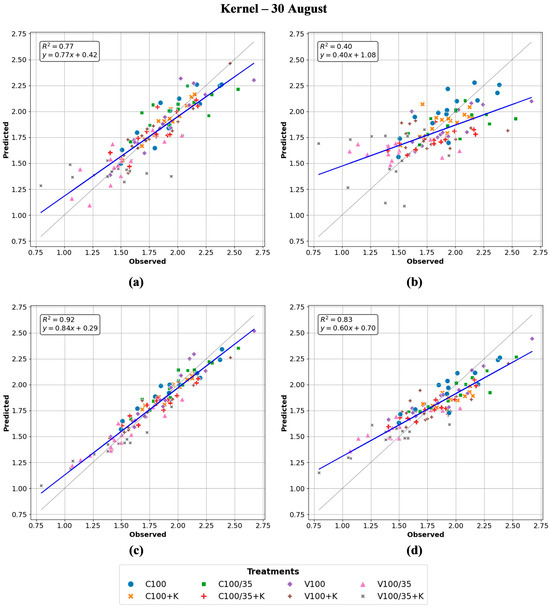
Figure A3.
Correlation between almond kernel production (in kg/tree) observed and predicted based on vegetation indices retrieved from UAV flight on 30 August 2021 (trendline is blue, while the reference is dashed). Scenarios analysed: (a) OLS with individualised treatments; (b) OLS with all treatments; (c) RF with individualised treatments; and (d) RF with all treatments.
References
- Ladizinsky, G. On the origin of almond. Genet. Resour. Crop Evol. 1999, 46, 143–147. [Google Scholar] [CrossRef]
- Delplancke, M.; Alvarez, N.; Benoit, L.; Espíndola, A.; Joly, H.I.; Neuenschwander, S.; Arrigo, N. Evolutionary history of almond tree domestication in the Mediterranean basin. Mol. Ecol. 2013, 22, 1092–1104. [Google Scholar] [CrossRef]
- Lordan, J.; Zazurca, L.; Maldonado, M.; Torguet, L.; Alegre, S.; Miarnau, X. Horticultural performance of ‘Marinada’ and ‘Vairo’ almond cultivars grown on a genetically diverse set of rootstocks. Sci. Hortic. 2019, 256, 108558. [Google Scholar] [CrossRef]
- Gutiérrez-Gordillo, S.; Durán Zuazo, V.H.; Hernández-Santana, V.; Gil, F.F.; Escalera, A.G.; Amores-Agüera, J.J.; García-Tejero, I.F. Cultivar Dependent Impact on Yield and Its Components of Young Almond Trees under Sustained-Deficit Irrigation in Semi-Arid Environments. Agronomy 2020, 10, 733. [Google Scholar] [CrossRef]
- Fernandes de Oliveira, A.; Mameli, M.G.; De Pau, L.; Satta, D. Almond Tree Adaptation to Water Stress: Differences in Physiological Performance and Yield Responses among Four Cultivar Grown in Mediterranean Environment. Plants 2023, 12, 1131. [Google Scholar] [CrossRef] [PubMed]
- Freitas, T.R.; Santos, J.A.; Silva, A.P.; Fraga, H. Reviewing the Adverse Climate Change Impacts and Adaptation Measures on Almond Trees (Prunus dulcis). Agriculture 2023, 13, 1423. [Google Scholar] [CrossRef]
- García-Tejero, I.F.; Gutiérrez Gordillo, S.; Souza, L.; Cuadros-Tavira, S.; Durán Zuazo, V.H. Fostering sustainable water use in almond (Prunus dulcis Mill.) orchards in a semiarid Mediterranean environment. Arch. Agron. Soil Sci. 2019, 65, 164–181. [Google Scholar] [CrossRef]
- Lipan, L.; Cano-Lamadrid, M.; Hernández, F.; Sendra, E.; Corell, M.; Vázquez-Araújo, L.; Moriana, A.; Carbonell-Barrachina, Á.A. Long-Term Correlation between Water Deficit and Quality Markers in HydroSOStainable Almonds. Agronomy 2020, 10, 1470. [Google Scholar] [CrossRef]
- Monksa, D.P.; Taylor, C.; Sommer, K.; Treeby, M.T. Deficit irrigation of almond trees did not decrease Yield. Acta Hortic. 2017, 1150, 251–260. [Google Scholar] [CrossRef]
- López-López, M.; Espadador, M.; Testi, L.; Lorite, I.J.; Orgaz, F.; Fereres, E. Water use of irrigated almond trees when subjected to water deficits. Agric. Water Manag. 2018, 195, 84–93. [Google Scholar] [CrossRef]
- Stewart, W.L.; Fulton, A.E.; Krueger, W.H.; Lampinen, B.D.; Shackel, K.A. Regulated deficit irrigation reduces water use of almonds without affecting yield. Calif. Agric. 2011, 65, 90–95. [Google Scholar] [CrossRef]
- Alcon, F.; Egea, G.; Nortes, P.A. Financial feasibility of implementing regulated and sustained deficit irrigation in almond orchards. Irrig. Sci. 2013, 31, 931–941. [Google Scholar] [CrossRef]
- Yadollahi, A.; Arzani, K.; Ebadi, A.; Wirthensohn, M.; Karimi, S. The response of different almond genotypes to moderate and severe water stress in order to screen for drought tolerance. Sci. Hortic. 2011, 129, 403–413. [Google Scholar] [CrossRef]
- Mirás-Avalos, J.M.; Gonzalez-Dugo, V.; García-Tejero, I.F.; López-Urrea, R.; Intrigliolo, D.S.; Egea, G. Quantitative analysis of almond yield response to irrigation regimes in Mediterranean Spain. Agric. Water Manag. 2023, 279, 108208. [Google Scholar] [CrossRef]
- Prgomet, I.; Pascual-Seva, N.; Morais, M.C.; Aires, A.; Barreales, D.; Castro Ribeiro, A.; Silva, A.P.; Barros, A.I.R.N.A.; Gonçalves, B. Physiological and biochemical performance of almond trees under deficit irrigation. Sci. Hortic. 2020, 261, 108990. [Google Scholar] [CrossRef]
- Sperling, O.; Gardi, I.; Ben-Gal, A.; Kamai, T. Deficit irrigation limits almond trees’ photosynthetic productivity and compromises yields. Agric. Water Manag. 2023, 289, 108562. [Google Scholar] [CrossRef]
- Collin, G.; Caron, J.; Létourneau, G.; Gallichand, J. Yield and Water Use in Almond under Deficit Irrigation. Agron. J. 2019, 111, 1381–1391. [Google Scholar] [CrossRef]
- Brito, C.; Dinis, L.T.; Moutinho-Pereira, J.; Correia, C. Kaolin, an emerging tool to alleviate the effects of abiotic stresses on crop performance. Sci. Hortic. 2019, 250, 310–316. [Google Scholar] [CrossRef]
- Marcotegui, A.; Sánchez-Ramos, I.; Pascual, S.; Fernández, C.E.; Cobos, G.; Armendáriz, I.; Cobo, A.; González-Núñez, M. Kaolin and potassium soap with thyme essential oil to control Monosteira unicostata and other phytophagous arthropods of almond trees in organic orchards. J. Pest Sci. 2015, 88, 753–765. [Google Scholar] [CrossRef]
- Sánchez-Ramos, I.; Marcotegui, A.; Pascual, S.; Fernández, C.E.; Cobos, G.; González-Núñez, M. Compatibility of organic farming treatments against Monosteira unicostata with non-target arthropod fauna of almond trees canopy. Span. J. Agric. Res. 2017, 15, 2. [Google Scholar] [CrossRef]
- Modi, A.; Sharma, P.; Saraswat, D.; Mehta, R. Review of Crop Yield Estimation Using Machine Learning and Deep Learning Techniques. Scalable Comput. 2022, 23, 59–79. [Google Scholar] [CrossRef]
- Gade, S.A.; Madolli, M.J.; García-Caparrós, P.; Ullah, H.; Cha-um, S.; Datta, A.; Himanshu, S.K. Advancements in UAV remote sensing for agricultural yield estimation: A systematic comprehensive review of platforms, sensors, and data analytics. Remote Sens. Appl. Soc. Environ. 2025, 37, 101418. [Google Scholar] [CrossRef]
- Saravia, D.; Valqui-Valqui, L.; Salazar, W.; Quille-Mamani, J.; Barboza, E.; Porras-Jorge, R.; Injante, P.; Arbizu, C.I. Yield Prediction of Four Bean (Phaseolus vulgaris) Cultivars Using Vegetation Indices Based on Multispectral Images from UAV in an Arid Zone of Peru. Drones 2023, 7, 325. [Google Scholar] [CrossRef]
- Avneri, A.; Aharon, S.; Brook, A.; Atsmon, G.; Smirnov, E.; Sadeh, R.; Abbo, S.; Peleg, Z.; Herrmann, I.; Bonfil, D.J.; et al. UAS-based imaging for prediction of chickpea crop biophysical parameters and yield. Comput. Electron. Agric. 2023, 205, 107581. [Google Scholar] [CrossRef]
- Saravia, D.; Salazar, W.; Valqui-Valqui, L.; Quille-Mamani, J.; Porras-Jorge, R.; Corredor, F.A.; Barboza, E.; Vásquez, H.V.; Casas Diaz, A.V.; Arbizu, C.I. Yield Predictions of Four Hybrids of Maize (Zea mays) Using Multispectral Images Obtained from UAV in the Coast of Peru. Agronomy 2022, 12, 2630. [Google Scholar] [CrossRef]
- Silveira, C.; Almeida, A.; Ribeiro, A.C. Technological Innovation in the Traditional Olive Orchard Management: Advances and Opportunities to the Northeastern Region of Portugal. Water 2022, 14, 4081. [Google Scholar] [CrossRef]
- Panda, S.S.; Ames, D.P.; Panigrahi, S. Application of Vegetation Indices for Agricultural Crop Yield Prediction Using Neural Network Techniques. Remote Sens. 2010, 2, 673–696. [Google Scholar] [CrossRef]
- Ramos, A.P.M.; Prado Osco, L.; Elis Garcia Furuya, D.; Nunes Gonçalves, W.; Cordeiro Santana, D.; Pereira Ribeiro Teodoro, L.; Antonio da Silva Junior, C.; Fernando Capristo-Silva, G.; Li, J.; Henrique Rojo Baio, F.; et al. A random forest ranking approach to predict yield in maize with uav-based vegetation spectral indices. Comput. Electron. Agric. 2020, 178, 105791. [Google Scholar] [CrossRef]
- Killeen, P.; Kiringa, I.; Yeap, T.; Branco, P. Corn Grain Yield Prediction Using UAV-Based High Spatiotemporal Resolution Imagery, Machine Learning, and Spatial Cross-Validation. Remote Sens. 2024, 16, 683. [Google Scholar] [CrossRef]
- Han, X.; Wei, Z.; Chen, H.; Zhang, B.; Li, Y.; Du, T. Inversion of Winter Wheat Growth Parameters and Yield Under Different Water Treatments Based on UAV Multispectral Remote Sensing. Front. Plant Sci. 2021, 12, 609876. [Google Scholar] [CrossRef]
- Zhou, X.; Zheng, H.B.; Xu, X.Q.; He, J.Y.; Ge, X.K.; Yao, X.; Cheng, T.; Zhu, Y.; Cao, W.X.; Tian, Y.C. Predicting grain yield in rice using multi-temporal vegetation indices from UAV-based multispectral and digital imagery. ISPRS J. Photogramm. Remote Sens. 2017, 130, 246–255. [Google Scholar] [CrossRef]
- Guimarães, N.; Fraga, H.; Sousa, J.J.; Pádua, L.; Bento, A.; Couto, P. Comparative Evaluation of Remote Sensing Platforms for Almond Yield Prediction. AgriEngineering 2024, 6, 240–258. [Google Scholar] [CrossRef]
- Gutiérrez-Gordillo, S.; de la Gala González-Santiago, J.; Trigo-Córdoba, E.; Rubio-Casal, A.E.; García-Tejero, I.F.; Egea, G. Monitoring of Emerging Water Stress Situations by Thermal and Vegetation Indices in Different Almond Cultivars. Agronomy 2021, 11, 1419. [Google Scholar] [CrossRef]
- Sarkar, T.K.; Roy, D.K.; Kang, Y.S.; Jun, S.R.; Park, J.W.; Ryu, C.S. Ensemble of Machine Learning Algorithms for Rice Grain Yield Prediction Using UAV-Based Remote Sensing. J. Biosyst. Eng. 2024, 49, 1–19. [Google Scholar] [CrossRef]
- Feng, L.; Zhang, Z.; Ma, Y.; Du, Q.; Williams, P.; Drewry, J.; Luck, B. Alfalfa yield prediction using UAV-based hyperspectral imagery and ensemble learning. Remote Sens. 2020, 12, 2028. [Google Scholar] [CrossRef]
- Fu, Z.; Jiang, J.; Gao, Y.; Krienke, B.; Wang, M.; Zhong, K.; Cao, Q.; Tian, Y.; Zhu, Y.; Cao, W.; et al. Wheat growth monitoring and yield estimation based on multi-rotor unmanned aerial vehicle. Remote Sens. 2020, 12, 508. [Google Scholar] [CrossRef]
- Canata, T.F.; Wei, M.C.F.; Maldaner, L.F.; Molin, J.P. Sugarcane yield mapping using high-resolution imagery data and machine learning technique. Remote Sens. 2021, 13, 232. [Google Scholar] [CrossRef]
- Martello, M.; Molin, J.P.; Wei, M.C.F.; Canal Filho, R.; Nicoletti, J.V.M. Coffee-Yield Estimation Using High-Resolution Time-Series Satellite Images and Machine Learning. AgriEngineering 2022, 4, 888–902. [Google Scholar] [CrossRef]
- Silveira, C.; Almeida, A.; Ribeiro, A.C. How Can a Changing Climate Influence the Productivity of Traditional Olive Orchards? Regression Analysis Applied to a Local Case Study in Portugal. Climate 2023, 11, 123. [Google Scholar] [CrossRef]
- Maseko, S.; van der Laan, M.; Tesfamariam, E.H.; Delport, M.; Otterman, H. Evaluating machine learning models and identifying key factors influencing spatial maize yield predictions in data intensive farm management. Eur. J. Agron. 2024, 157, 127193. [Google Scholar] [CrossRef]
- Baio, F.H.R.; Santana, D.C.; Teodoro, L.P.R.; de Oliveira, I.C.; Gava, R.; de Oliveira, J.L.G.; da Silva Junior, C.A.; Teodoro, P.E.; Shiratsuchi, L.S. Maize Yield Prediction with Machine Learning, Spectral Variables and Irrigation Management. Remote Sens. 2023, 15, 79. [Google Scholar] [CrossRef]
- Kpienbaareh, D.; Mohammed, K.; Luginaah, I.; Wang, J.; Bezner Kerr, R.; Lupafya, E.; Dakishoni, L. Estimating Groundnut Yield in Smallholder Agriculture Systems Using PlanetScope Data. Land 2022, 11, 1752. [Google Scholar] [CrossRef]
- Jhajharia, K.; Mathur, P. Prediction of crop yield using satellite vegetation indices combined with machine learning approaches. Adv. Space Res. 2023, 72, 3998–4007. [Google Scholar] [CrossRef]
- Shammi, S.A.; Huang, Y.; Feng, G.; Tewolde, H.; Zhang, X.; Jenkins, J.; Shankle, M. Application of UAV Multispectral Imaging to Monitor Soybean Growth with Yield Prediction through Machine Learning. Agronomy 2024, 14, 672. [Google Scholar] [CrossRef]
- Maimaitijiang, M.; Sagan, V.; Sidike, P.; Hartling, S.; Esposito, F.; Fritschi, F.B. Soybean yield prediction from UAV using multimodal data fusion and deep learning. Remote Sens. Environ. 2020, 237, 111599. [Google Scholar] [CrossRef]
- İrik, H.A.; Ropelewska, E.; Çetin, N. Using spectral vegetation indices and machine learning models for predicting the yield of sugar beet (Beta vulgaris L.) under different irrigation treatments. Comput. Electron. Agric. 2024, 221, 109019. [Google Scholar] [CrossRef]
- Elsayed, S.; El-Hendawy, S.; Dewir, Y.H.; Schmidhalter, U.; Ibrahim, H.H.; Ibrahim, M.M.; Elsherbiny, O.; Farouk, M. Estimating the leaf water status and grain yield of wheat under different irrigation regimes using optimized two-and three-band hyperspectral indices and multivariate regression models. Water 2021, 13, 2666. [Google Scholar] [CrossRef]
- Van Huu, B.; Quang Hieu, N.; Trong Hieu, L. Monitoring growth and predicting crop yield through UAV-mounted spectral camera analysis of the interplay between soil compaction and vegetation index. Emir. J. Food Agric. 2024, 36, 1–10. [Google Scholar] [CrossRef]
- Guo, Y.; Fu, Y.H.; Chen, S.; Hao, F.; Zhang, X.; de Beurs, K.; He, Y. Predicting grain yield of maize using a new multispectral-based canopy volumetric vegetation index. Ecol. Indic. 2024, 166, 112295. [Google Scholar] [CrossRef]
- Peralta, N.R.; Assefa, Y.; Du, J.; Barden, C.J.; Ciampitti, I.A. Mid-season high-resolution satellite imagery for forecasting site-specific corn yield. Remote Sens. 2016, 8, 848. [Google Scholar] [CrossRef]
- Du, M.; Noguchi, N. Monitoring of wheat growth status and mapping of wheat yield’s within-field spatial variations using color images acquired from UAV-camera System. Remote Sens. 2017, 9, 289. [Google Scholar] [CrossRef]
- Pang, A.; Chang, M.W.L.; Chen, Y. Evaluation of Random Forests (RF) for Regional and Local-Scale Wheat Yield Prediction in Southeast Australia. Sensors 2022, 22, 717. [Google Scholar] [CrossRef]
- Shanmugapriya, P.; Latha, K.R.; Pazhanivelan, S.; Kumaraperumal, R.; Karthikeyan, G.; Sudarmanian, N.S. Cotton yield prediction using drone derived LAI and chlorophyll content. J. Agrometeorol. 2022, 24, 348–352. [Google Scholar] [CrossRef]
- Peel, M.C.; Finlayson, B.L.; McMahon, T.A. Updated world map of the Köppen-Geiger climate classification. Hydrol. Earth Syst. Sci. 2007, 11, 1633–1644. [Google Scholar] [CrossRef]
- Coba Agroconsultores Soil Map, Current Land Use Map and Land Suitability Map of the Northeast of Portugal. 1991.
- Barreales, D.; Pereira, J.A.; Casal, S.; Ribeiro, A.C. Influence of sustained deficit irrigation and foliar kaolin application on almond kernel composition. Sci. Hortic. 2023, 321, 112262. [Google Scholar] [CrossRef]
- Barreales, D.; Fernandes, Â.; Barros, L.; Capitão, S.; Castro Ribeiro, A. Effects of regulated deficit irrigation and foliar kaolin application on quality parameters of almond [Prunus dulcis (Mill.) D.A. Webb]. J. Sci. Food Agric. 2023, 103, 7227–7240. [Google Scholar] [CrossRef] [PubMed]
- Barreales, D.; Capitão, S.; Bento, A.A.; Casquero, P.A.; Ribeiro, A.C. Adapting Almond Production to Climate Change through Deficit Irrigation and Foliar Kaolin Application in a Mediterranean Climate. Atmosphere 2023, 14, 1593. [Google Scholar] [CrossRef]
- Allen, R.G.; Pereira, L.S.; Raes, D.; Smith, M. Crop Evapotranspiration-Guidelines for Computing Crop Water Requirements-FAO Irrigation and Drainage Paper 56; FAO: Rome, Italy, 1998. [Google Scholar]
- DJI Support for Matrice 300 RTK. Available online: https://www.dji.com/pt/matrice-300 (accessed on 30 January 2025).
- MicaSense RedEdge-MX Integration Guide. Available online: https://support.micasense.com/hc/en-us/articles/360011389334-RedEdge-MX-Integration-Guide (accessed on 30 January 2025).
- Agisoft Agisoft Metashape: Professional Edition. Available online: https://www.agisoft.com/features/professional-edition/ (accessed on 30 January 2025).
- Chen, J.M. Evaluation of Vegetation Indices and a Modified Simple Ratio for Boreal Applications. Can. J. Remote Sens. 1996, 22, 229–242. [Google Scholar] [CrossRef]
- Huete, A.; Didan, K.; Miura, T.; Rodriguez, E.P.; Gao, X.; Ferreira, L.G. Overview of the radiometric and biophysical performance of the MODIS vegetation indices. Remote Sens. Environ. 2002, 83, 195–213. [Google Scholar] [CrossRef]
- Gitelson, A.A.; Merzlyak, M.N. Remote sensing of chlorophyll concentration in higher plant leaves. Adv. Space Res. 1998, 22, 689–692. [Google Scholar] [CrossRef]
- Jorge, J.; Vallbé, M.; Soler, J.A. Detection of irrigation inhomogeneities in an olive grove using the NDRE vegetation index obtained from UAV images. Eur. J. Remote Sens. 2019, 52, 169–177. [Google Scholar] [CrossRef]
- Rondeaux, G.; Steven, M.; Baret, F. Optimization of soil-adjusted vegetation indices. Remote Sens. Environ. 1996, 55, 95–107. [Google Scholar] [CrossRef]
- Steven, M.D. The Sensitivity of the OSAVI Vegetation Index to Observational Parameters. Remote Sens. Environ. 1998, 63, 49–60. [Google Scholar] [CrossRef]
- Gitelson, A.A.; Stark, R.; Grits, U.; Rundquist, D.; Kaufman, Y.; Derry, D. Vegetation and soil lines in visible spectral space: A concept and technique for remote estimation of vegetation fraction. Int. J. Remote Sens. 2002, 23, 2537–2562. [Google Scholar] [CrossRef]
- Biudes, M.S.; Machado, N.G.; de Morais Danelichen, V.H.; Souza, M.C.; Vourlitis, G.L.; de Souza Nogueira, J. Ground and remote sensing-based measurements of leaf area index in a transitional forest and seasonal flooded forest in Brazil. Int. J. Biometeorol. 2014, 58, 1181–1193. [Google Scholar] [CrossRef]
- Huete, A.R. A soil-adjusted vegetation index (SAVI). Remote Sens. Environ. 1988, 25, 295–309. [Google Scholar] [CrossRef]
- Lane, D.M. Introduction to Analysis of Variance. Available online: https://onlinestatbook.com/2/analysis_of_variance/intro.html (accessed on 10 March 2025).
- Scikit-Learn. Recursive Feature Elimination with Cross-Validation to Select Features. Available online: https://scikit-learn.org/stable/modules/generated/sklearn.feature_selection.RFECV.html (accessed on 10 March 2025).
- Scikit-Learn. Ordinary Least Squares Linear Regression. Available online: https://scikit-learn.org/stable/modules/generated/sklearn.linear_model.LinearRegression.html (accessed on 10 March 2025).
- Scikit-Learn. A Random Forest Regressor. Available online: https://scikit-learn.org/stable/modules/generated/sklearn.ensemble.RandomForestRegressor.html (accessed on 10 March 2025).
- Rosati, A.; Metcalf, S.G.; Buchner, R.P.; Fulton, A.E.; Lampinen, B.D. Physiological Effects of Kaolin Applications in Well-irrigated and Water-stressed Walnut and Almond Trees. Ann. Bot. 2006, 98, 267–275. [Google Scholar] [CrossRef]
- Gharaghani, A.; Javarzari, A.M.; Rezaei, A.; Nejati, R. Kaolin Spray Improves Growth, Physiological Functions, Yield, and Nut Quality of ‘Tardy Nonpareil’ Almond Under Deficit Irrigation Regimens. Erwerbs-Obstbau 2022, 65, 989–1001. [Google Scholar] [CrossRef]
- Segura-Monroy, S.; Uribe-Vallejo, A.; Ramírez-Godoy, A.; Restrepo-Díaz, H. Effect of Kaolin Application on Growth, Water Use Efficiency, and Leaf Epidermis Characteristics of Physalis peruviana L. Seedlings under Two Irrigation Regimes. J. Agric. Sci. Technol. 2015, 17, 1585–1596. [Google Scholar]
- Brito, C.; Gonçalves, A.; Silva, E.; Martins, S.; Pinto, L.; Rocha, L.; Arrobas, M.; Rodrigues, M.Â.; Moutinho-Pereira, J.; Correia, C.M. Kaolin foliar spray improves olive tree performance and yield under sustained deficit irrigation. Sci. Hortic. 2021, 277, 109795. [Google Scholar] [CrossRef]
Disclaimer/Publisher’s Note: The statements, opinions and data contained in all publications are solely those of the individual author(s) and contributor(s) and not of MDPI and/or the editor(s). MDPI and/or the editor(s) disclaim responsibility for any injury to people or property resulting from any ideas, methods, instructions or products referred to in the content. |
© 2025 by the authors. Licensee MDPI, Basel, Switzerland. This article is an open access article distributed under the terms and conditions of the Creative Commons Attribution (CC BY) license (https://creativecommons.org/licenses/by/4.0/).