Abstract
Sugarcane mechanized harvesting generates large volumes of data that are used to monitor harvesters’ functionalities. The dynamic interaction of the machine-onboard instrumentation–crop system introduces discrepant and noisy values into the data, requiring outlier detectors to support this complex and empirical decision. This study proposes an automatic filtering technique for sugarcane harvesting data to automate the process. A three-step automated filtering algorithm based on a sliding window was developed and further evaluated with four configurations of the maximum variation factor f and six SW sizes. The performance of the proposed method was assessed by using artificial outliers in the datasets with an outlier magnitude (OM) of ±0.01 to ±1.00. Three case studies with real crop data were presented to demonstrate the effectiveness of the proposed filter in detecting outliers of different magnitudes, compared to filtering by another method in the literature. In each dataset, the proposed filter detected nearly 100% of larger (OM = ±1.00 and ±0.80) and medium (OM = ±0.50) magnitudes’ outliers, and approximately 26% of smaller outliers (OM = ±0.10, ±0.05, and ±0.01). The proposed algorithm preserved wider ranges of data compared to the comparative method and presented equivalent results in the identification of regions with different productive potentials of sugarcane in the field. Therefore, the proposed method retained data that reflect sugarcane yield variability at the row level and it can be used in practical application scenarios to deal with large datasets obtained from sugarcane harvesters.
1. Introduction
Yield maps can be a valuable layer of information for agriculture decision making, enabling several precision agriculture (PA) applications. The mechanized harvest and Global Navigation Satellite System (GNSS) provided the acquisition of large volumes of data, but discrepant and noisy values became intrinsic of the machinery-onboard instrumentation–crop system. In agriculture, outliers can indicate not only anomalies in data acquisition, but also field variability, e.g., spatial variability of attributes []. Sugarcane exhibits high biomass variability at short distances (e.g., at the row level) [] and understanding its spatial distribution in the field is necessary for sustainable agricultural production, energy generation, and the development of public policies [], as aimed at by the Sustainable Development Goals (SDGs) established by the United Nations [].
Sugarcane is cultivated in rows and it is mechanically harvested every one or two rows []. Data acquisition during this operation can present errors, logging discrepant data into these voluminous datasets due to various factors, such as delays; problems with traffic control in the sugarcane row, causing misalignment of the harvester; difficulties in the harvester feeding process due to the terrain; errors in the readings of the sensors onboard the harvester; stops for machine maintenance in the field; problems with the hardware and software of the onboard harvester computer; and headland maneuvers, among other factors [,,]. Therefore, the harvesters’ generated data needs to be filtered out for later use in agricultural management, aiming at the elimination of outliers. An outlier is a data point that deviates considerably from the other points in the dataset. However, not every outlier is an error []. The decision on which data should be removed is complex and relies on detection methods, which are hard to implement and have no methodological consensus among researchers.
In recent years, several studies have been conducted to detect outliers in datasets derived from onboard harvester computers, primarily aiming to obtain yield maps [,,,,,,,,,,,]. Depending on the proposed approach, the filtering process is based on statistical models [,,,], distance [,,], density [,,,], and clustering [,,], among other methods. However, filtering relies on knowledge about outliers, such as their occurrence, probability, and intervals [,].
Outliers challenge the agricultural sector because (i) it is necessary to account for laws governing spatiality when analyzing the spatial structure of a variable (e.g., Tobler’s Law) and neighborhood matrix criteria (e.g., contiguity) []; (ii) they affect the statistical model assumptions []; (iii) there is a lack of a unified strategy for outlier detection []; (iv) there is a lack of a true reference about the outlier, meaning a definitive assessment of outlier detection performance in real field data is often impossible [,]; (v) they have unknown threshold settings, since the data from the field are not previously known and the limits vary according to the agricultural context; and (vi) most data filtering methods require user-adjustable input parameters, introducing subjectivity into the process []. For example, the filtering procedure in MapFilter 2.0 software [] requires the user to enter the boundary variation parameter in the global and local filtering stages, and requires manual entry of the spatial dependence value of the variable to be filtered. Therefore, this shows an opportunity to optimize the procedure for the specificities of sugarcane, proposing the automation of processes.
It is practical to conceive an outlier detection approach that is free from the influence of prior knowledge about such measurement discrepancies and suitable for online application. Thus, the sliding window (SW) algorithm implemented to a statistically based filter is proposed for filtering out data obtained from sugarcane harvests. The SW is a computational technique that generates a subset of a data structure, continually updating this subset, akin to the online algorithm [,]. The SW algorithm reduces the use of nested loops, replacing them with a single loop, minimizing time complexity []. Thus, the main contributions of this research are described in three aspects—(i) variable filter thresholds: an automated method for filtering out sugarcane harvester data is presented, in which the upper and lower thresholds are variable in the dataset; (ii) automation: an online algorithm based on SW is proposed, being computationally optimized for large volumes of data, and able to detect outlier values without requiring prior knowledge of the dataset; and (iii) filter performance indicator: artificial outliers were used to evaluate the performance of the proposed algorithm.
In view of the above, this study aims to (i) propose an automated filtering technique for sugarcane harvesters’ data based on the sliding window algorithm, focusing on yield; (ii) evaluate the effects of sliding window size and threshold configuration approaches on outlier detection performance; and (iii) compare the performance of the proposed method with other filtering procedures developed for high-density field data, to increase computational efficiency.
2. Materials and Methods
2.1. Obtaining Sugarcane Harvest Data and the Online Sliding Window Algorithm
The prevalent sugarcane harvesters in the market, and used in this study, cut and process a single row of sugarcane at a time. Harvest data acquisition in the field occurs sequentially as the harvester moves along the rows of sugarcane, with these data being stored in an onboard computer in the frequency of 0.20 Hz. Yield data were obtained from the commercial sensor system (Solinftec, Araçatuba, São Paulo, Brazil) embedded in the harvesters, along with GNSS receivers. This approach is based on the total weight of harvested sugarcane in the studied areas, spatially distributed in the field considering the hydraulic propulsion variations in the chopping system. A detailed description and validation of this system can be found in [].
Each data point acquired (n) is composed of multiple features (p), stored into different columns. Thus, data acquisition results in a matrix (M) of dimensions n × p. The SW algorithm will later perform selecting one feature at a time (univariate SW) with selected SW size. Each data point inside the SW is also called an element. Therefore, if the size of the SW is equal to five (five elements), for example, this corresponds to the record of five sugarcane harvesting points obtained in the field and stored in the file, as shown in the scheme for obtaining SW (Figure 1).
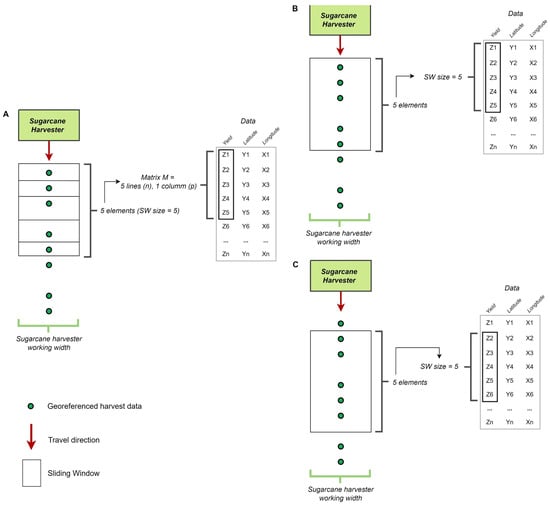
Figure 1.
Scheme for obtaining sliding window (SW) during sugarcane harvesting. Data array (A), initial window construction (B), window sliding from one subset to next until iteration of full matrix (C).
2.2. The Filtering-Out Method and the Development of the Sliding Window Algorithm
A window is a subsequence between the i-th and j-th received items, denoted as W[i, j] = (xi, xi+1, …, xj), where i < j, and i and j are the items in the sequence of a list. In the SW model, the window is represented by W[p − w + 1, p], where p is the current counting point within the window and w is the window size. Whenever a new instance arrives, the SW is queued in a first-in, first-out (FIFO) data structure, where the oldest one is discarded []. Therefore, only a constant amount of recent data is considered for data mining purposes []. The SW algorithm operates based on certain requirements: a matrix as input; contiguous elements; a window representing a range of elements; a state to be maintained in this window, in this case being the established setup for data filtering; and the complete iteration of the matrix.
In this study, the SW algorithm was developed and applied using real matrices, where during its execution, data are constantly updated within the window, generating subsets of data to be applied in filtering. The authors of [] highlight that the sliding window model can be of two types: count-based and time-based. In this study, the SW was count-based, meaning it always contained a fixed number of data points, e.g., a fixed number of elements representing SW size (Figure 2). This allows data to be processed in smaller batches at a time, reducing the effect of old data on filtering and improving the accuracy of data estimation [,].
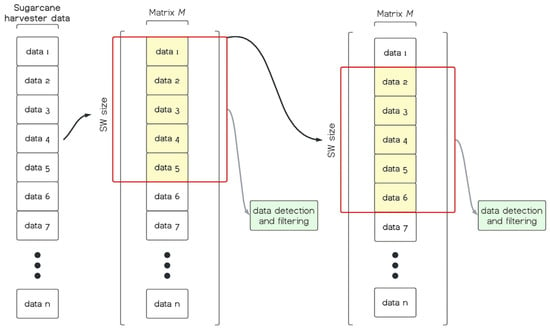
Figure 2.
Method of detection and filtering discrepant data using sliding window (SW) algorithm. Highlighted data in yellow represents SW size equal to five elements.
The SW-based algorithm was implemented in the data filtering method, based on statistics using the median value of the dataset, to determine the presence of outliers in data. Values within the upper limit (UL) and lower limit (LL) are considered inliers. Values above and below UL and LL are considered outliers and they can be removed from the dataset (Equations (1) and (2)).
where Medi is the median of values inside the SW, and f is the maximum variance factor accepted for the median.
Four configurations of the maximum variation factor f were investigated to establish a value of f to unify and automate the proposed data filtering. The smaller the value of f, the smaller the corresponding interval for the upper and lower limits, and therefore, outlier detection becomes more sensitive. Thus, the values of the factor f were defined and tested as 0.30, referred to as approach 1 (A1); 0.40, approach 2 (A2); 0.50, approach 3 (A3); and 0.90, approach 4 (A4). The proposed approaches were investigated with different configurations of SW size and limits resulting from the factor f, with SW sizes equal to 10, 20, 30, 50, 100, and 200.
The SW sizes were determined based on the length of the sugarcane rows, frequency of data collection, and harvester movement speed. The lengths of the sugarcane rows range from 15.54 to 1061.31 m (mean: 429.12 m, dataset 1) and from 8.01 to 720.90 m (mean: 213.05, dataset 2), which are commonly observed in sugarcane fields. Based on this, subsets were generated from the SW to include observations within a single row (smaller SW size) and observations spanning more than one row (larger SW size). Once the SW size was defined, it remained fixed while sliding through the dataset, as it represents a counting window (e.g., SW size equal to 10 corresponds to 10 observations). However, these observations may correspond to different row lengths, as each observation within the window reflects specific collection characteristics, such as the harvester’s speed and the time interval for georeferenced data storage.
On average, the following was true: (a) When the harvester’s mean speed was 4.00 km h−1 and the mean data collection interval was 5 s (mean values observed for datasets 1 and 2), the harvester’s displacement corresponded to SW = 10 → 55.56 m; SW = 20 → 111.10 m; SW = 30 → 166.67 m; SW = 50 → 277.78 m; SW = 100 → 555.56 m; and SW = 200 → 1111.10 m. (b) In other scenarios during the same harvest, for example, with a mean harvester speed of 4.00 km h−1 and a data collection interval of 3 s, the displacement corresponded to SW = 10 → 33.33 m; SW = 20 → 66.70 m; SW = 30 → 100.00 m; SW = 50 → 166.67 m; SW = 100 → 333.33 m; and SW = 200 → 666.70 m. Thus, the characteristics of the subsets generated by the SW reflect the specific conditions during data collection by the harvester.
The proposed automated filtering algorithm consists of three steps, represented by i, ii, and iii (Figure 3). Steps i and iii aim to filter out the data, while step ii aims to detect outliers with a fixed threshold value.
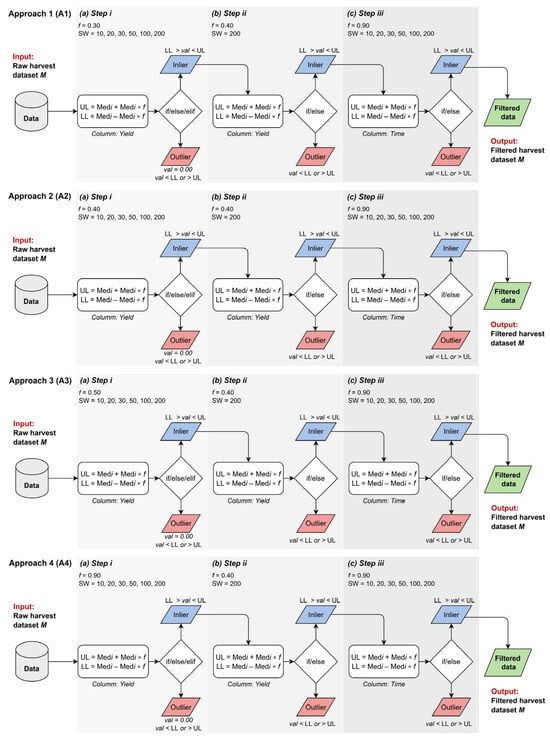
Figure 3.
Structure of proposed filtering algorithm for different approaches, in which different configurations of sliding window (SW) size and variation factor f were tested. A1, A2, A3, and A4: approaches 1, 2, 3, and 4; Medi: median of values located within sliding window; f: variation factor accepted for median; LL: lower limit; UL: upper limit; val: value.
(a) Step i (input: Raw harvest dataset M, output: Filtered yield column from M, forwarded to step ii): Automatically, by defining the factor f (0.30, 0.40, 0.50, or 0.90) and the size of the SW (10, 20, 30, 50, 100, or 200), the “yield” column of the dataset is selected for filtering. UL and LL values are obtained and vary throughout the algorithm execution, due to the SW size, factor f, and dataset values within the SW. During the algorithm execution, the window slides over the data matrix and performs the filtering operation, checking the data one by one. Each time the window slides over the data matrix, a new UL and LL are obtained, and the filtering process is performed. Each value (n) is examined to verify whether it falls within the filtering interval. If it does, it is classified as an inlier and retained in the dataset (if); if the value is not within the UL and LL, it is considered an outlier and removed from the dataset (else). If the data are equal to zero (0), it is also considered an outlier and removed (elif). This operation is completed by iterating over the entire column of the data matrix. At the end of step i, a filtered dataset is obtained and automatically inserted into step ii.
(b) Step ii (input: Filtered yield column from step i, output: Filtered yield column from M, forwarded to step iii): The filtered data from the previous step are transformed into a data matrix and the “yield” column is submitted for data filtering. The SW size and the factor f in this step are fixed and do not change under any circumstances, with SW equal to 200 and the factor f equal to 0.40. This was defined after numerous tests of SW size and factor f configurations for this second stage (not presented in the study), in which outliers could be identified in dispersion intervals different from those considered in step i. In preliminary tests, there were occasional incidences of observations with exceptionally high yield values for the sugarcane crop after filtering in step i (e.g., yield value equal to 250.00 Mg ha−1). These values remained in the dataset without being detected as outliers because they were located in a region with high yield values. Even when sliding the window, these values remained within the intervals considered to be inliers. Therefore, a larger SW and a relatively tolerant factor f were required, allowing for a larger set of data to determine the variations in LL and UL and, consequently, the removal of these observations. Similarly to step i, the conditional structure if, else, and elif occurs as the window slides and filters out the dataset. Step ii ends after iterating over the entire data matrix and the filtered dataset is automatically inserted into step iii.
(c) Step iii (input: Column time from the M filtered in step ii, output: Filtered harvest dataset M): The data matrix from step ii is inserted into a third filtering step. The “time” column is selected and filtered. This column refers to the time spent for data acquisition at a point in the field. The SW size is the same as determined in step i, and the factor f in this step is fixed and does not change under any circumstances, with f equal to 0.90. In previous tests, it was found that filtering the “time” variable required a configuration with a factor f with limit tolerances that only removed extreme values. This was because, after steps i and ii, fewer observations with anomalous data were expected for this variable. The conditional structure if and else occurs as the window slides over the data matrix and filters out the dataset, with reference to the time column. At the end of this step, the filtered dataset, the filtering execution time (in seconds) and the descriptive statistics of these filtered data (mean, maximum, and minimum values; coefficient of variation (CV); standard deviation (SD); skewness and kurtosis), and the sugarcane yield map of the studied fields are generated as outputs.
2.3. Dataset and Case Studies
Two case studies were conducted in commercial sugarcane fields in the northwest region of the State of São Paulo, Brazil. The first dataset originates from sugarcane fields located in the municipality of Catanduva (21°8′18″ S, 48°58′26″ W; altitude: 532 m) (dataset 1—case study 1) and the second dataset is from sugarcane fields in São José do Rio Preto (20°49′13″ S, 49°22′47″ W; altitude: 510 m) (dataset 2—case study 2) (Figure 4). In case study 1, the dataset is composed of six areas, in a total of 48.99 ha, while case study 2 is composed of 11 sugarcane areas of 73.43 ha total (Table 1).
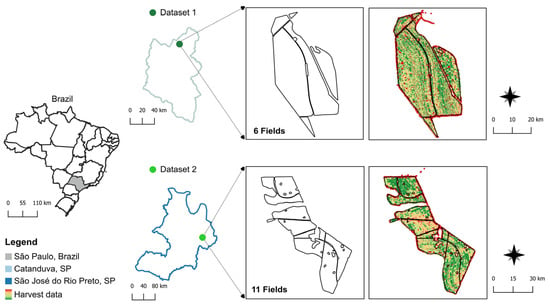
Figure 4.
Geographic locations of datasets 1 (Catanduva, SP) and 2 (São José do Rio Preto, SP), northwest region of the State of São Paulo, Brazil.

Table 1.
Characterization of sugarcane datasets 1 and 2.
2.4. Validation
To assess the performance of the proposed method, artificial outlier (AO) values were inserted into the datasets. The performance evaluation was based on the number of artificial outliers detected, as the number of introduced outliers is known. This method of filter performance evaluation has been utilized in recent studies, such as [,] in space research, to detect outliers in Two-Line Element sets (TLEs) of objects in Earth’s orbit. For this purpose, different data points (n) in the sugarcane harvester datasets were randomly selected, from which AOs were generated. In the selected points, yield values were subjected to magnitudes of outliers (OMs), with OM = ±0.01, ±0.05, ±0.10, ±0.50, ±0.80, and ±1.00, representing small (±0.01, ±0.05, and ±0.10)-, medium (±0.50)-, and large (±0.80 and ±1.00)-magnitude outliers (Equation (3)).
where Z is the original value of an element; Z0 is the value of the artificial outlier; and OM is the magnitude of the outlier, with ±0.01, ±0.05, ±0.10, ±0.50, ±0.80, and ±1.00.
The datasets from case studies 1 and 2 were contaminated with 1776 and 1620 artificial outlier values, representing approximately 2.50 and 2.30% of the data, respectively. From this, the performance in detecting AO for different configurations of SW size and factor f was evaluated. To achieve this, the ratio of AO detected to the total AO inserted was calculated.
The best-performing configuration of the proposed data filtering method was compared with the Mapfilter 2.0 software [] to detect AO. Mapfilter 2.0 is a procedure for filtering out high-density field data, employing the median of the dataset to calculate the lower and upper limits (global filtering). Also, it includes local filtering, in which the lower and upper limits are determined from the median of the data located within a radius band around a point, both in a single direction (anisotropic filter) and in any direction (isotropic filter). The MapFilter 2.0 parameters used in this study were boundary variation equal to 30.00% (global filtering), spatial dependence equal to 200.00 m, and boundary variation corresponding to 30.00% (local filtering). The boundary variation in MapFilter 2.0 is equivalent to the factor f of the SW algorithm.
Descriptive statistics of the proposed method and MapFilter 2.0 were analyzed, such as mean, maximum, and minimum values; the coefficient of variation; and standard deviation. The filtered data and the removed outliers were spatialized using the Geographic Information System (GIS) QGIS v. 3.22.10 []. The removed outliers were identified in terms of the operations of harvesting, displacement, stopping, and maneuvering.
Additionally, using the best-performing configuration of the proposed data filtering method, a new dataset (dataset 3—Mirassolândia, SP, Brazil, 20°37′01″ S, 49°27′50″ W; number of fields: 5; area: 110.30 ha; raw data: number of points = 83,250; density = 754.76 points ha−1; mean yield = 78.15 Mg ha−1) was filtered and spatialized to demonstrate that the proposed method is suitable for filtering sugarcane yield data without prior knowledge of the dataset. The algorithm development and analyses in this study were carried out through the JupyterLab virtual environment, using the Python programming language v. 3.10.5 [,]. The study was carried out on a laptop with a Windows operating system, an Intel Core i5 processor, 8 GB of memory ram, and a solid-state disk (SSD) of 256 GB.
3. Results and Discussion
3.1. Sliding Window Filtering Algorithm Performance
For datasets 1 and 2, the results obtained by the SW filtering algorithm indicated a reduction in the number of values identified as outliers as the SW size and the factor f increased (Figure 5). In dataset 1 (Figure 5A), the execution of the three algorithm steps demanded low processing time, ranging from 25.60 s (A1, SW = 100) to 36.65 s (A4, SW = 50). These are directly related to the premise of the SW algorithm, which aims to reduce the operation time []. Initial yield data filtering efforts lasted 40.00 min for a single dataset, prompting automation and optimization []. Algorithms improved for large agricultural databases, especially in sugarcane [,], yet full automation remains incomplete.
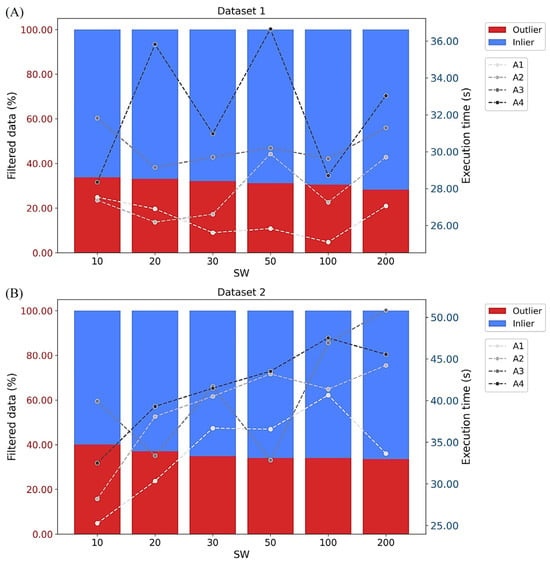
Figure 5.
Averages of the filtered data (outliers and inliers) for the different sliding window sizes in the proposed approaches (y-axis on the left) and execution times of the proposed filtering algorithm (y-axis on the right) for dataset 1 (A) and 2 (B). SW: sliding window. A1, A2, A3, and A4: approaches 1, 2, 3, and 4.
In dataset 1, the percentage of data removed in the harvesting of this sugarcane field ranged from 28.19% (A4, SW = 200) to 41.66% (A1, SW = 20). In [], values ranging among 16.00, 22.00, 31.00, and 40.00% were removed from the datasets of sugarcane harvester yield monitors, characterized as outliers. Even after filtering, point density can be considered high, with inlier values above 40,000.00 points, representing approximately 853 points per hectare.
The analysis of dataset 2 revealed that the algorithm’s execution time for filtering out the sugarcane yield dataset ranged from 25.21 s (A1, SW = 10) to 50.85 s (A3, SW = 200) (Figure 5B). These tests were conducted on a laptop equipped with an Intel Core i5 processor, using Python 3.10.5. Due to the low computational load, the algorithm demonstrated optimized processing. This indicates that the developed algorithm can be used in practical application scenarios, capable of handling large datasets, such as those from the mentioned case studies: case study 1 with a dataset from the sugarcane harvester yield monitor, composed of 70,119 observations; and case study 2, with 70,445 observations.
The algorithm demonstrated proficiency in identifying outliers, aligning consistently with manual assessment, especially concerning yield data that exceed the standard for sugarcane production (e.g., values exceeding 300.00 Mg ha−1) and the recording of harvesting data storage time in the file (e.g., values exceeding 20.00 s). This is relevant considering the average data acquisition frequency of 0.20 Hz. The outliers in certain intervals coincide with the trained human perception as outliers, increasing confidence in the automated filtering performed by the proposed online SW algorithm.
3.2. Performance of Artificial Outliers’ Detection
To find the appropriate SW size, the numbers of artificially inserted discrepant values detected with different SW sizes are depicted in Figure 6, where the detection performance was assessed for each limit-setting approach (factor f). Additional performance parameters of AO detection for the factor f and SW size settings are available in the Supplementary Materials (Tables S1 and S2). In both datasets, approaches A2, A3, and A4 exhibited inferior performance in detecting artificial outliers compared to approach A1.
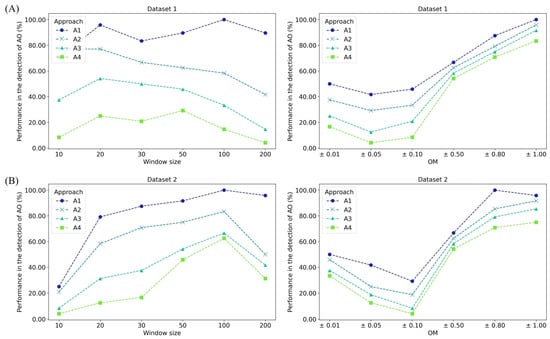
Figure 6.
Performance in the detection of artificial outliers (%) by the proposed data filtering under different approaches and SW sizes for dataset 1 (A) and dataset 2 (B). OM: Outlier magnitude. AO: Artificial outlier. A1, A2, A3, and A4: Approaches 1, 2, 3, and 4.
The number of outliers detected with the same magnitude is dependent on the SW size. For OM values ≥±0.80, most of the AOs were identified with detection performance close to or equal to 100% in all approaches (A1, A2, A3, and A4). As the OM reduced to ±0.50, the detection performance of AO decreased, especially for approaches A3 and A4, which detected approximately 74.00 to 78.00% of the outliers. For OM = ±0.10, approach A1 presented the best performance in comparison to the others; however, overall, the performance was lower compared with other OM amplitudes. These results indicate a variable standard of performance in detecting smaller OM values.
Dataset 2 exhibited a similar pattern to dataset 1. For OM values ≥±0.80, almost all AOs were detected, regardless of the SW size, with detection rates of 98.00 to 100.00%. For OM = ±0.50, inferior performance was observed in approaches A3 and A4, while approaches A1 and A2 stood out as having the best performance.
Analyzing OM values ≤±0.10, a decreased performance for A1 and A2 was observed, indicating a deterioration for the smallest OM values. The larger the tolerances, the fewer false positives or false outliers are identified. This occurs because the algorithm tolerates larger deviations in the SW limits. When comparing performance between approaches, A1 (f = 0.3) demonstrated the best performance, while A4 (f = 0.4) exhibited the greatest deterioration in performance. This discrepancy can be attributed to the fact that, in approach A4, the variation factor used to calculate the upper and lower limits resulted in a wider interval, encompassing both inliers and outliers. As this interval is variable across the data domain, it underwent expansion along the dataset, leading to a higher incidence of undetected AO, especially those of smaller magnitude (e.g., OM = ±0.10).
Observing approach A1 in Figure 6, the increasing SW size up to 100 was accompanied by a growth in the detection of AO, with a performance reduction for SW equal to 200. However, for an SW size of 100, the statistics related to sugarcane yield indicated values that are beyond the standard potential for sugarcane cultivation (dataset 1, maximum yield value equal to 805.60 Mg ha−1; Table 2).

Table 2.
Descriptive statistics of the yield values obtained by the proposed filtering method by SW sizes (10, 20, 30, 50, 100, and 200) for the A1 approach (f = 0.3).
The values in dataset 1 shown in Table 2 indicate that the filtering did not yield suitable statistical values for SW = 100 and SW = 200, including higher kurtosis values compared to SW intervals ≤ 50. For these SW sizes, the number of detected AO was greater in ascending order of SW = 10 < 30 < 50 < 20 for dataset 1. For dataset 2, it exhibited an ascending order of SW = 10 < 20 < 30 < 50. Such a situation, to determine the appropriate SW size, requires a commitment to determine an SW size that detects the smallest possible number of false positives and negatives, and for this, choosing one of the configurations corresponding to one of the points from Figure 6.
It was found that SW sizes equal to 20, 30, and 50 exhibited adequate performance in identifying AO and statistically coherent values with the reality of the data. An SW size of 50 stood out for presenting the highest average detection rates of AO across different magnitudes in both datasets when compared to SW sizes of 20 and 30. Hence, an SW size of 50 is suggested for filtering out sugarcane harvest data using approach A1.
The proposed method demonstrated a low false positive detection rate, minimizing the probability of detecting an element as an outlier when it is, in fact, an inlier. Figure 6 demonstrated that, under approach A1 and SW = 50, the false positive rates for harvest data are close to zero for artificial discrepant values with OM ≥ ±0.50 and are among the lowest for discrepant values with OM equal to ±0.10, ±0.05, and ±0.01.
It is relevant to highlight the inherent complexity in defining a threshold that accurately identifies discrepant data. The subset generated by the SW makes this threshold site-specific, comprehending the spatial relationships among them. Overall, the results obtained in the datasets indicate that approach A1, with SW adjustment limits (variation factor f) equal to 0.30 and an SW size equal to 50, is the strategy with the best performance in detecting discrepant values in sugarcane harvest data. Most artificial discrepant values, with OM ≥ ±0.50, can be detected, demonstrating the method’s capability in identifying true discrepant values.
Additionally, it was found that the proposed method identified and removed from the dataset records related to the movement of the harvester in the field (Figure 7A). These data include data about the machine’s movement between plots and in the access roads. In addition, the algorithm detected and removed data corresponding to the machine stopping in the field to replace the base cutter blade, corrective maintenance, lack of a truck to refuel/unload the harvested sugarcane, and washing and cleaning of equipment (Figure 7B). The proposed filtering method easily identified data with record times for other operations greater than harvest record times and with yield values set to zero, since these were operations in which the machine was not actually harvesting.
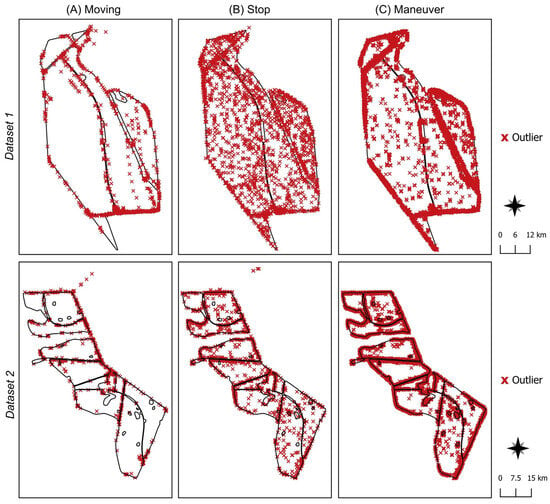
Figure 7.
The detection of outliers by the sliding window method proposed for the sugarcane harvesting data corresponding to the operations of displacement (A), stop (B), and maneuver (C) of the harvester in the field in datasets 1 and 2.
For the stored data as maneuvers (Figure 7C), there were two sources for the identification of discrepant data by the proposed filter: yield equal to zero and the time for maneuvering that exceeded the storage time of actual harvest data (values of up to 60.00 s). There were data within the field recorded as maneuvering in regions that did not have tracks for machinery displacement. This is possibly an operational error and these data were removed as the yield at these points was null.
These types of data generated in sugarcane fields may occur due to (i) fields with long sugarcane rows without segmentation by crossing tracks for machinery displacement—reaching harvesting capacity in places far from the roads with unloading/replenishing points will result in maneuvering in unwanted places []; (ii) the presence of very short row lengths, causing the greatest occurrence of maneuvering data, in addition to being economically and energetically unprofitable, as verified by []; (iii) the need for more route optimization studies in mechanized sugarcane harvesting [,]. All these factors and characteristics of sugarcane harvesting result in data with peculiarities that need to be processed using proper filters to generate reliable information on the sugarcane field.
3.3. Methods’ Performance Comparison
Using the best configuration of the proposed filtering method (approach A1, with SW adjustment limits (variation factor f) equal to 0.30 and an SW size equal to 50), the filter results were compared with those generated from MapFilter 2.0 (Table 3). It was found that up to the OM ≥ ±0.50, the AO detection of the proposed method showed close values, with a reduction in performance observed at OM equal to ±0.50. Below this OM, the proposed method exhibited performance degradation compared to MapFilter 2.0. While not desired, this makes sense when considering that the proposed method presents variation in the SW limits regarding the characterization of an outlier and inlier as the window slides through the database. Therefore, for datasets 1 and 2, lower magnitude values became more difficult to detect, as the outlier threshold depends on the subset of data generated in the SW.

Table 3.
Artificial outlier detection performance (%) by the proposed filtering method and by MapFilter 2.0.
MapFilter 2.0 detected 100% of AO of lower magnitude, highlighting its robustness. However, it was observed that it presented narrower ranges of yield values and lower variation in limits in the dataset compared to the SW method proposed. This may not be as favorable for data filtering, as there is a risk of eliminating legitimate data that, although corresponding to real field data, do not fall within the limits established by the filter. In this aspect, the proposed method stood out positively as it preserved wider data ranges, thus allowing the retention of information reflecting the existing variability in the field.
In general, the proposed method captures the dataset variability by preserving the range of values, encompassing both low and high yield levels. It primarily removes data points that deviate significantly within the subsets generated at each sliding window step. Future research should look for methods to enhance the detection of lower-magnitude outliers by improving the algorithm’s ability to identify errors intrinsically related to mechanized sugarcane harvesting while reducing the false positive rate. A key challenge lies in defining thresholds to distinguish outliers when subsets generated by the SW contain similar value classes, even when some data points are artificially inserted into the dataset. Positively, the developed algorithm demonstrates impartiality, confirming its lack of user bias.
In dataset 1, discrepant values of 40.43% were identified by the proposed method and 43.46% by the comparison method. In dataset 2, the percentages of discrepant values were 37.38% and 30.95%, respectively. The comparative filtering method removed a greater number of harvest points for dataset 1, while the proposed method had a greater data removal for dataset 2 (Table 4). There was a reduction in the standard deviation and coefficient of variation compared to the raw data, indicating greater consistency in the filtered data.

Table 4.
Descriptive statistics of raw and filtered yield data for datasets 1 and 2.
In dataset 1, the yield values ranged from 0.00 to 860.16 Mg ha−1 in the raw data, from 23.92 to 195.01 Mg ha−1 in the data filtered by the proposed method, and from 85.54 to 158.82 Mg ha−1 in the data filtered by the comparative method. For dataset 2, the values were from 0.00 to 233.99 Mg ha−1 for the raw data, from 16.91 to 83.43 Mg ha−1 for the data filtered by the proposed method, and from 34.43 to 63.44 Mg ha−1 for MapFilter 2.0. It is evident that the proposed SW algorithm preserved a greater range of yield values and greater data variability in the sugarcane fields compared to MapFilter 2.0, as highlighted by the higher CV and SD values. This is relevant because sugarcane exhibits high biomass variability over short distances [], indicating that the SW algorithm was able to handle yield spatial variability in the field at the row level. Despite differences in some statistical parameters, the filtering methods were equivalent in identifying regions with different sugarcane yield potentials. Therefore, the proposed method allowed for the retention of data reflecting the existing yield variability in the sugarcane fields (Figure 8).
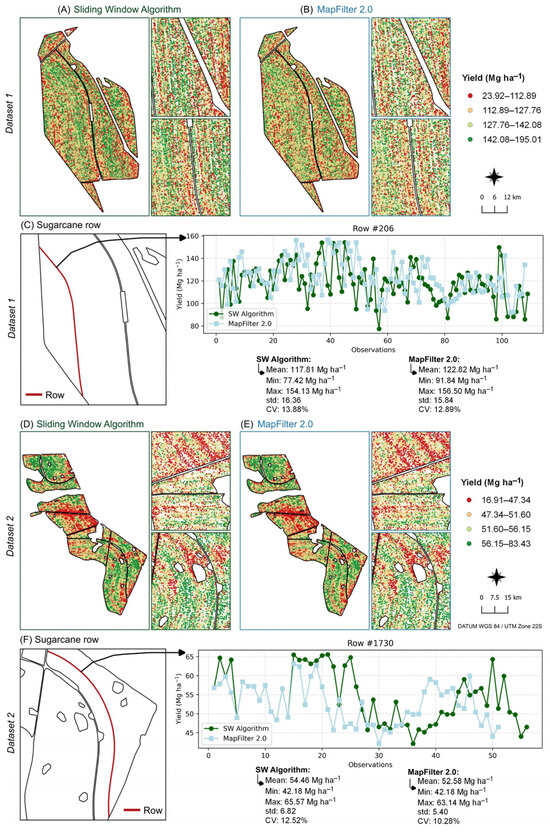
Figure 8.
Filtered yield maps from (A) the proposed sliding window algorithm and (B) Mapfilter 2.0 from dataset 1. Similarly, (D,E) show the results of dataset 2, filtered by the same methods. In (C,F), the observations of a row of sugarcane from each dataset are plotted, showing similarities in the observations, with the proposed filtering method capturing more variability in the row.
Like any algorithm, Mapfilter 2.0 and the SW algorithm transform a dataset, the ‘input’, into an ‘output’ corresponding to the filtered data. Although the ‘output’ of both methods is similar in terms of data statistics and spatialization into sugarcane yield classes, there are differences in terms of computational efficiency: (i) the proposed filtering is automated, in contrast to MapFilter 2.0, which requires the user to input parameters, adding subjectivity to the filtering process—automation is necessary to optimize time and resources in the operational processes of agricultural production, with the aim of increasing yield []; and (ii) the proposed filter has an optimized processing time, because not only is the algorithm’s execution time relatively short, but there is also no need to know the sugarcane harvest database beforehand to manually establish the parameters to carry out the filtering process, saving time of the data analyst. Dataset 3 demonstrates that, even without prior knowledge of the dataset, it is possible to filter the data and identify locations with high and low production potential, capturing the spatial variability within the sugarcane rows (Figure 9).
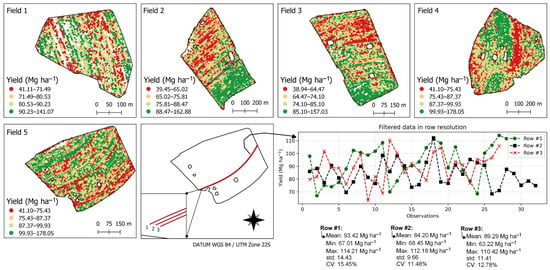
Figure 9.
Yield maps filtered by the proposed method using the best configuration of the sliding window algorithm (A1, SW = 50, f = 0.30) for dataset 3. Three rows in field 5 are highlighted, illustrating the variability within and between them.
Another aspect to highlight is the updated subset of data when the window slides and the direction of the filter. MapFilter 2.0 filters out the data in the direction of the row (anisotropic filter) and also includes filtering based on neighbors within a given radius, incorporating the values of neighboring rows in the calculation of the UL and LL thresholds (isotropic filter). In the proposed filter, the anisotropic phenomenon is highlighted, as the filtering occurs in the direction of the row. It is known that isotropic phenomena are relevant to the spatiality of natural phenomena when a single spatial model is sufficient to describe the spatial variability of the phenomenon under study []. However, sugarcane agricultural management is carried out in rows, where natural and anthropogenic factors, such as relief and gaps, for example, have an impact on the spatial continuity of the crop within the row. These factors are, therefore, likely to regulate the spatial structure of sugarcane yield. The proposed filter considers the data in the direction that have the maximum continuity of the phenomenon under study, which is the row direction.
Future studies should investigate modeling using geostatistical methods on datasets filtered by the proposed method and evaluate the spatial structure of yield in the sugarcane row, such as variogram parameters of the range, sill, and nugget effect. Additionally, the SW algorithm is set to be tested in the future to filter data from harvesters for other crops.
As in this study, the use of the SW algorithm, combined with the insertion of artificial data into datasets, has been increasingly explored by researchers. This approach aims to address issues such as the absence of a true reference for outliers and the need to update data, enabling the continuous and dynamic capture of a subset of the data that include the most recent and local information. Various fields of research have applied SW to solve problems in areas such as meteorology [], ecology [], medicine [], computer science [], astronomy [], and others. Thus, this study contributes to advancing knowledge by integrating these themes into the agricultural context, specifically in PA.
Two case studies (and an additional dataset) with real data obtained from agricultural operations in sugarcane fields were conducted. The proposed method for outlier detection and removal is simple, does not require specialized hardware, and is computationally optimized for large volumes of data. Furthermore, the approach taken and the filtering values obtained from the datasets in this study reflect a current debate about the treatment of data obtained from sensors with high spatial resolution, where an agricultural data analyst must be attentive not only to the quantity of data obtained in the field, but also to the quality of these data. All these factors ensure that the proposed approach can be implemented in other sugarcane harvesting fields.
4. Conclusions
In this study, an automated algorithm based on a sliding window implemented with a statistical data filtering method was developed. The following outlier detection strategy is suggested: (1) in step i, a sliding window size of 50 and a threshold configuration of f equal to 0.30; (2) in step ii, a sliding window size of 200 and a threshold configuration of f equal to 0.40; and (3) in step iii, a sliding window size of 50 and a threshold configuration of f equal to 0.90. When executing the algorithm, all filtering steps are performed automatically, eliminating the need to manually input values as parameters, thus avoiding subjective decision making. The proposed filter is capable of detecting nearly 100% of outliers of larger (OM = ±1.00 and ±0.80) and medium (OM = ±0.50) magnitudes, as expected, and approximately 26% of small outliers (OM = ±0.10, ±0.05, and ±0.01). The proposed filtering preserved the widest data intervals and showed equivalent results in identifying regions with different sugarcane production potentials in the field compared to the MapFilter 2.0 method. Therefore, the proposed method allowed for the retention of data reflecting the existing variability in the fields and it can be used for filtering harvester data in sugarcane fields.
Supplementary Materials
The following supporting information can be downloaded at: https://www.mdpi.com/article/10.3390/agriengineering6040275/s1, Table S1: Performance in the detection of artificial outliers (%) by the proposed data filtering under different approaches (A1, A2, A3, and A4) and Sliding Window (SW) sizes for dataset 1; Table S2: Performance in the detection of artificial outliers (%) by the proposed data filtering under different approaches (A1, A2, A3, and A4) and Sliding Window (SW) sizes for dataset 2.
Author Contributions
Conceptualization, E.R.O.d.S., J.P.M. and M.C.F.W.; methodology, E.R.O.d.S., J.P.M. and M.C.F.W.; software, E.R.O.d.S.; validation, E.R.O.d.S., J.P.M., M.C.F.W. and R.C.F.; formal analysis, E.R.O.d.S.; resources, J.P.M.; data curation, E.R.O.d.S.; writing—original draft preparation, E.R.O.d.S.; writing—review and editing, E.R.O.d.S., J.P.M., M.C.F.W. and R.C.F.; supervision, J.P.M. All authors have read and agreed to the published version of the manuscript.
Funding
This research received no external funding.
Data Availability Statement
The original contributions presented in the study are included in the article/Supplementary Materials; further inquiries can be directed to the corresponding author.
Acknowledgments
This work was supported by the Coordination for the Improvement of Higher Education Personnel (CAPES)—Finance Code 001. The authors would like to thank the sugarcane mills and the data monitoring providers of the datasets used in this study.
Conflicts of Interest
The authors declare no conflicts of interest.
References
- Fulton, J.; Hawkins, E.; Taylor, R.; Franzen, A. Yield Monitoring and Mapping. Precision Agriculture Basics. In ASA, CSSA, and SSSA Books; American Society of Agronomy: Madison, WI, USA, 2018; pp. 63–77. [Google Scholar] [CrossRef]
- Maldaner, L.F.; Molin, J.P.; Spekken, M. Methodology to filter out outliers in high spatial density data to improve maps reliability. Sci. Agric. 2022, 79, e20200178. [Google Scholar] [CrossRef]
- Mutran, V.M.; Ribeiro, C.O.; Nascimento, C.O.A.; Chachuat, B. Risk-conscious approach to optimizing bioenergy investments in the Brazilian sugarcane industry. In Computer Aided Chemical Engineering; Kiss, A.A., Zondervan, E., Lakerveld, R., Özkan, L., Eds.; Elsevier: Amsterdam, The Netherland, 2019; Volume 46, pp. 361–366. [Google Scholar] [CrossRef]
- United Nations (UN). Transforming our World: The 2030 Agenda for Sustainable Development. 2015. Available online: https://sustainabledevelopment.un.org/content/documents/21252030%20Agenda%20for%20Sustainable%20Development%20web.pdf (accessed on 11 February 2024).
- Braunbeck, O.A.; Oliveira, J.T.A. Colheita de cana-de-açúcar com auxílio mecânico. Eng. Agrícola 2006, 26, 300–308, (In Portuguese with English Abstract). [Google Scholar] [CrossRef]
- Spekken, M.; Molin, J.P.; Romanelli, T.L. Cost of boundary manoeuvres in sugarcane production. Biosyst. Eng. 2015, 129, 112–126. [Google Scholar] [CrossRef]
- Zhao, L.; Zhang, J.; Jiao, S.; Zheng, T.; Li, J.; Zhao, T. Ground surface detection method using ground penetrating radar signal for sugarcane harvester base-cutter control. Biosyst. Eng. 2022, 219, 103–123. [Google Scholar] [CrossRef]
- Mokoena, T.; Celik, T.; Marivate, V. Why is this an anomaly? Explaining anomalies using sequential explanations. Pattern Recognit. 2022, 121, 108227. [Google Scholar] [CrossRef]
- Blackmore, S.; Moore, M. Remedial Correction of Yield Map Data. Precis. Agric. 1999, 1, 53–66. [Google Scholar] [CrossRef]
- Gimenez, L.M.; Molin, J.P. Algoritmo para redução de erros em mapas de produtividade para Agricultura de Precisão. Rev. Bras. Agrocomputação 2004, 2, 5–10, (In Portuguese with English abstract). [Google Scholar]
- Menegatti, L.A.A.; Molin, J.P. Remoção de erros em mapas de produtividade via filtragem de dados brutos. Rev. Bras. Eng. Agrícola E Ambient. 2004, 8, 126–134, (In Portuguese with English abstract). [Google Scholar] [CrossRef]
- Simbahan, G.C.; Dobermann, A.; Ping, J.L. Screening Yield Monitor Data Improves Grain Yield Maps. Agron. J. 2004, 96, 1091–1102. [Google Scholar] [CrossRef]
- Ping, J.L.; Dobermann, A. Processing of Yield Map Data. Precis. Agric. 2005, 6, 193–212. [Google Scholar] [CrossRef]
- Sudduth, K.A.; Drummond, S.T. Yield Editor: Software for Removing Errors from Crop Yield Maps. Agron. J. 2007, 99, 1471–1482. [Google Scholar] [CrossRef]
- Gozdowski, D.; Samborski, S.; Dobers, E.S. Evaluation of methods for the detection of spatial outliers in the yield data of winter wheat. Colloq. Biom. 2010, 40, 41–51. [Google Scholar]
- Sun, W.; Whelan, B.; McBratney, A.B.; Minasny, B. An integrated framework for software to provide yield data cleaning and estimation of an opportunity index for site-specific crop management. Precis. Agric. 2013, 14, 376–391. [Google Scholar] [CrossRef]
- Leroux, C.; Jones, H.; Clenet, A.; Dreux, B.; Becu, M.; Tisseyre, B. A general method to filter out defective spatial observations from yield mapping datasets. Precis. Agric. 2018, 19, 789–808. [Google Scholar] [CrossRef]
- Vega, A.; Córdoba, M.; Castro-Franco, M.; Balzarini, M. Protocol for automating error removal from yield maps. Precis. Agric. 2019, 20, 1030–1044. [Google Scholar] [CrossRef]
- Maldaner, L.F.; Molin, J.P. Data processing within rows for sugarcane yield mapping. Sci. Agric. 2020, 77, e20180391. [Google Scholar]
- Schwertman, N.C.; Owens, M.A.; Adnan, R. A simple more general boxplot method for identifying outliers. Comput. Stat. Data Anal. 2004, 47, 165–174. [Google Scholar] [CrossRef]
- Carter, N.J.; Schwertman, N.C.; Kiser, T.L. A comparison of two boxplot methods for detecting univariate outliers which adjust for sample size and asymmetry. Stat. Methodol. 2009, 6, 604–621. [Google Scholar] [CrossRef]
- Han, J.; Pei, J.; Tong, H. (Eds.) Outlier Detection. In Data Mining; Morgan Kaufmann: Burlington, MA, USA, 2023; pp. 557–604. [Google Scholar] [CrossRef]
- Jung, J.M.; Kim, D.H.; Cho, H.; Lee, M.; Jeong, J.; Lee, D.H.; Seo, S.; Lee, W.H. Multi-algorithmic approach for detecting outliers in cattle intake data. J. Agric. Food Res. 2024, 15, 101021. [Google Scholar] [CrossRef]
- Zhang, H.; Liu, J.; Zhao, C. Distance Based Method for Outlier Detection of Body Sensor Networks. EAI Endorsed Trans. Wirel. Spectr. 2016, 16, e4. [Google Scholar] [CrossRef][Green Version]
- Muhr, D.; Affenzeller, M. Little data is often enough for distance-based outlier detection. Procedia Comput. Sci. 2022, 200, 984–992. [Google Scholar] [CrossRef]
- Puchhammer, P.; Kalubowila, C.; Braus, L.; Pospiech, S.; Sarala, P.; Filzmoser, P. A performance study of local outlier detection methods for mineral exploration with geochemical compositional data. J. Geochem. Explor. 2024, 258, 107392. [Google Scholar] [CrossRef]
- Tang, B.; He, H. A local density-based approach for outlier detection. Neurocomputing 2017, 241, 171–180. [Google Scholar] [CrossRef]
- Liu, F.; Yu, Y.; Song, P.; Fan, Y.; Tong, X. Scalable KDE-based top-n local outlier detection over large-scale data streams. Knowl.-Based Syst. 2020, 204, 106186. [Google Scholar] [CrossRef]
- Aydın, F. Boundary-aware local Density-based outlier detection. Inf. Sci. 2023, 647, 119520. [Google Scholar] [CrossRef]
- Zhou, Y.; Xia, H.; Yu, D.; Cheng, J.; Li, J. Outlier detection method based on high-density iteration. Inf. Sci. 2024, 662, 120286. [Google Scholar] [CrossRef]
- Huang, J.; Zhu, Q.; Yang, L.; Cheng, D.; Wu, Q. A novel outlier cluster detection algorithm without top-n parameter. Knowl.-Based Syst. 2017, 121, 32–40. [Google Scholar] [CrossRef]
- Nowak-Brzezińska, A.; Horyń, C. Outliers in rules—The comparision of LOF, COF and KMEANS algorithms. Procedia Comput. Sci. 2020, 176, 1420–1429. [Google Scholar] [CrossRef]
- Kiersztyn, A.; Pylak, D.; Horodelski, M.; Kiersztyn, K.; Urbanovich, P. Random clustering-based outlier detector. Inf. Sci. 2024, 667, 120498. [Google Scholar] [CrossRef]
- Qu, B.; Wang, Z.; Shen, B.; Dong, H. Decentralized dynamic state estimation for multi-machine power systems with non-Gaussian noises: Outlier detection and localization. Automatica 2023, 153, 111010. [Google Scholar] [CrossRef]
- Tobler, W. A computer movie simulating urban growth in the Detroit region. Econ. Geogr. 1970, 46, 234–240. [Google Scholar] [CrossRef]
- Smiti, A. A critical overview of outlier detection methods. Comput. Sci. Rev. 2020, 38, 100306. [Google Scholar] [CrossRef]
- Liu, J.; Liu, L.; Du, J.; Sang, J. TLE outlier detection based on expectation maximization algorithm. Adv. Space Res. 2021, 68, 2695–2712. [Google Scholar] [CrossRef]
- Souiden, I.; Omri, M.N.; Brahmi, Z. A survey of outlier detection in high dimensional data streams. Comput. Sci. Rev. 2022, 44, 100463. [Google Scholar] [CrossRef]
- Mieno, T.; Watanabe, K.; Nakashima, Y.; Inenaga, S.; Bannai, H.; Takeda, M. Palindromic trees for a sliding window and its applications. Inf. Process. Lett. 2022, 173, 106174. [Google Scholar] [CrossRef]
- Zeng, Z.; Cui, L.; Qian, M.; Zhang, Z.; Wei, K. A survey on sliding window sketch for network measurement. Comput. Netw. 2023, 226, 109696. [Google Scholar] [CrossRef]
- Datar, M.; Motwani, R. The Sliding-Window Computation Model and Results. In Data Streams: Advances in Database Systems; Aggarwal, C.C., Ed.; Springer: Boston, MA, USA, 2007; pp. 149–167. [Google Scholar] [CrossRef]
- Maldaner, L.F.; Canata, T.F.; Molin, J.P. An Approach to Sugarcane Yield Estimation Using Sensors in the Harvester and ZigBee Technology. Sugar. Tech. 2022, 24, 813–821. [Google Scholar] [CrossRef]
- Nori, F.; Deypir, M.; Sadreddini, M.H. A sliding window based algorithm for frequent closed itemset mining over data streams. J. Syst. Softw. 2013, 86, 615–623. [Google Scholar] [CrossRef]
- Souza, T.; Aquino, A.L.L.; Gomes, D.G. An Online Method to Detect Urban Computing Outliers via Higher-Order Singular Value Decomposition. Sensors 2019, 19, 4464. [Google Scholar] [CrossRef]
- Lidtke, A.A.; Gondelach, D.J.; Armellin, R. Optimising filtering of two-line element sets to increase re-entry prediction accuracy for GTO objects. Adv. Space Res. 2019, 63, 1289–1317. [Google Scholar] [CrossRef]
- QGIS.org. QGIS Geographic Information System. QGIS Association. 2024. Available online: http://www.qgis.org (accessed on 11 February 2022).
- Kluyver, T.; Ragan-Kelley, B.; Pérez, F.; Granger, B.; Bussonnier, M.; Frederic, J.; Kelley, K.; Hamrick, J.; Grout, J.; Corlay, S.; et al. Jupyter Notebooks—A publishing format for reproducible computational workflows. In Positioning and Power in Academic Publishing: Players, Agents and Agendas; Loizides, F., Schmidt, B., Eds.; IOS Press: Amsterdam, The Netherland, 2016; pp. 87–90. [Google Scholar] [CrossRef]
- Python. The Python Standard Library. 2024. Available online: https://docs.python.org/3/library/index.html (accessed on 15 March 2024).
- Santoro, E.; Soler, E.M.; Cherri, A.C. Route optimization in mechanized sugarcane harvesting. Comput. Electron. Agric. 2017, 141, 140–146. [Google Scholar] [CrossRef]
- Empresa Brasileira de Pesquisa Agropecuária (Embrapa). Automation and Precision Agriculture. 2024. Available online: https://www.embrapa.br/en/tema-automacao-e-agricultura-de-precisao/sobre-o-tema (accessed on 10 February 2024).
- Wu, J.; He, J.; Christakos, G. (Eds.) Classical geostatistics. In Quantitative Analysis and Modeling of Earth and Environmental Data; Elsevier: Amsterdam, The Netherland, 2022; pp. 149–211. [Google Scholar] [CrossRef]
- Smitha, P.S.; Narasimhan, B.; Sudheer, K.P.; Annamalai, H. An improved bias correction method of daily rainfall data using a sliding window technique for climate change impact assessment. J. Hydrol. 2018, 556, 100–118. [Google Scholar] [CrossRef]
- Xing, Q.; Yu, H.; Wang, H.; Yu, H. A sliding-window-threshold algorithm for identifying global mesoscale ocean fronts from satellite observations. Prog. Oceanogr. 2023, 2016, 103072. [Google Scholar] [CrossRef]
- Danay, L.; Ramon-Gonen, R.; Gorodetski, M.; Schwartz, D.G. Evaluating the effectiveness of a sliding window technique in machine learning models for mortality prediction in ICU cardiac arrest patients. Int. J. Med. Inform. 2024, 191, 105565. [Google Scholar] [CrossRef] [PubMed]
- Liu, Y.; Qian, Y.; Wang, B.; Zhang, Y. Improved sliding window decoding algorithm based on information reserved for spatially coupled LDPC codes. Phys. Commun. 2024, 64, 102359. [Google Scholar] [CrossRef]
Disclaimer/Publisher’s Note: The statements, opinions and data contained in all publications are solely those of the individual author(s) and contributor(s) and not of MDPI and/or the editor(s). MDPI and/or the editor(s) disclaim responsibility for any injury to people or property resulting from any ideas, methods, instructions or products referred to in the content. |
© 2024 by the authors. Licensee MDPI, Basel, Switzerland. This article is an open access article distributed under the terms and conditions of the Creative Commons Attribution (CC BY) license (https://creativecommons.org/licenses/by/4.0/).