Abstract
Accurate ear counting is essential for determining wheat yield, but traditional manual methods are labour-intensive and time-consuming. This study introduces an innovative approach by developing an automatic ear-counting system that leverages machine learning techniques applied to high-resolution images captured by unmanned aerial vehicles (UAVs). Drone-based images were captured during the late growth stage of wheat across 15 fields in Bosnia and Herzegovina. The images, processed to a resolution of 1024 × 1024 pixels, were manually annotated with regions of interest (ROIs) containing wheat ears. A dataset consisting of 556 high-resolution images was compiled, and advanced models including Faster R-CNN, YOLOv8, and RT-DETR were utilised for ear detection. The study found that although lower-quality images had a minor effect on detection accuracy, they did not significantly hinder the overall performance of the models. This research demonstrates the potential of digital technologies, particularly machine learning and UAVs, in transforming traditional agricultural practices. The novel application of automated ear counting via machine learning provides a scalable, efficient solution for yield prediction, enhancing sustainability and competitiveness in agriculture.
1. Introduction
Wheat is the basis of global food production, providing about 20% of the world’s calories and protein, making it a key factor in achieving food security, especially in developing regions [1]. The Food and Agriculture Organization of the United Nations (FAO) has adopted 17 global goals to be achieved by 2030, with the eradication of hunger and the achievement of food security being priorities [2]. Investments in various agricultural sectors, including advanced technologies, are essential to achieve these goals.
Wheat yield forecasting brings significant benefits to farmers, enabling them to make informed management and financial decisions [3]. However, yield prediction is a complex process due to many factors such as environmental conditions, soil quality, water availability, temperature and humidity, and agricultural practices [4]. Timely and accurate forecasts of wheat yield can significantly contribute to the improvement of management of agricultural practices and optimisation of resources [5].
Traditional methods of manual wheat ear counting are time-consuming and require significant resources, which limits their practical application in larger fields. The process usually involves using a 1 m2 frame to manually count the spikes and then extrapolate the results to the entire field. In large areas, this counting has to be repeated in several locations, further complicating the process [6]. Automating this process using advanced technologies can significantly improve efficiency and accuracy.
A recent review article highlights significant advancements such as drones, sensors, and machine learning, which enable farmers to maximise yields, reduce waste, and improve overall efficiency [7]. Unmanned aerial vehicles (UAVs), or drones, are remotely controlled aerial systems equipped with advanced technology like multispectral cameras, sensors, and communication tools, enabling them to gather data, make decisions, and execute actions. Reported results indicate that adopting UAVs can enhance precision agriculture by enabling real-time crop monitoring, classification, and management, leading to increased production with reduced costs and environmental impact [8]. UAVs can be effectively used for tasks like managing crops, monitoring crop growth, estimating yield, precisely spraying agrochemicals, combating invasive plants, surveying crops, and monitoring water stress [9,10,11,12,13,14].
Bosnia and Herzegovina’s agricultural sector presents a unique opportunity for innovation, given its underutilised agricultural land and favourable climatic conditions [15]. However, wheat production in the country struggles to meet demand, with average yields falling below both national and European averages [16]. Challenges such as outdated farming techniques, inadequate resource management, and the limited adoption of modern technology hinder progress [17]. Addressing these issues requires innovative solutions that integrate advanced technologies into traditional agricultural practices.
In 2017, agriculture transitioned from precision agriculture to Agriculture 4.0, or smart farming, emphasising sustainability and automating tasks like planting, harvesting, and soil sampling, thus increasing efficiency and reducing labour costs [18]. One study proposed a computationally efficient algorithm for ground-shooting image datasets, achieving a precision of 0.79–0.82 by using features such as colour and texture to train a TWSVM model [19]. Similarly, another recent study found PyTorch-based deep learning frameworks to outperform TensorFlow, with superior speed, accuracy (0.89–0.91), and inference times of 9.43–12.38 ms for wheat crop weed removal [20].
This study aims to bridge this gap by developing an automated system for wheat ear detection using computer vision and machine learning. By leveraging high-resolution UAV imagery, this study evaluates the effectiveness of state-of-the-art models, including Faster R-CNN, YOLOv8, and RT-DETR, in improving accuracy and efficiency compared to manual methods. The findings aim to support the modernisation of agricultural practices in Bosnia and Herzegovina, contributing to sustainable development and global food security.
The implementation example from Bosnia and Herzegovina serves as a promising pilot project, showcasing how sophisticated AI techniques can transition from theoretical research to practical applications in agriculture.
2. Materials and Methods
2.1. Locations
This study covers three locations in Bosnia and Herzegovina: Derventa, Odžak, and Goražde (Figure 1). Data were collected from a total of 15 different fields at each location, carefully selected based on the variability of factors such as weed presence, field size, and wheat density.
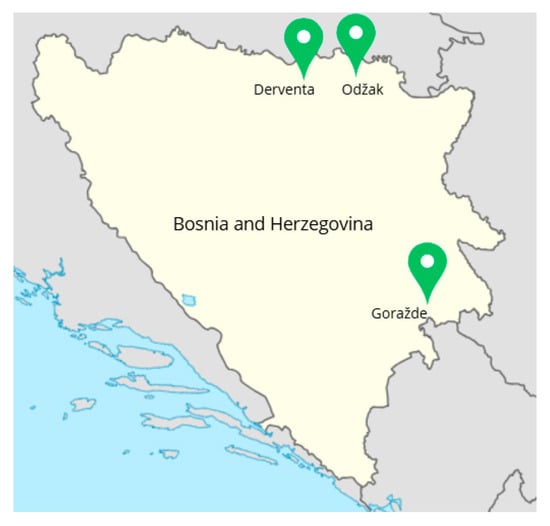
Figure 1.
Map showing three locations used for data collection.
The agricultural fields used in this study, managed by various cooperators, range from 0.3 ha to 45.5 ha (see Table 1) and include diverse wheat varieties including Simonida, Hurem, Sofru, Solenzara, Sosthene, Gabrio, Falado, Klima, and Pibrac. Data were collected on June 7th in Derventa and Odžak and on June 10th in Goražde. Average June temperatures were 29 °C in Derventa, 34 °C in Odžak, and 31 °C in Goražde, with precipitation of 90 mm, 82 mm, and 78 mm, respectively.

Table 1.
Lots used for data acquisition and their areas.
Selected fields in Derventa, Odžak, and Goražde represent a diverse cross-section of the agricultural landscape of Bosnia and Herzegovina. These locations were chosen to capture the geographic and climatic variations found throughout the country, including differences in elevation, terrain, and climate. By covering the lowland areas typical of northern Bosnia and the hilly southeastern area, the study can offer insights relevant to a wide range of agricultural conditions in Bosnia and Herzegovina. Although not all microclimate or soil types are represented, the fields reflect major agricultural zones and challenges across the country, making the findings broadly applicable to wheat yield prediction and agricultural strategy.
2.2. Data Collection
Adequate data acquisition, involving the collection and obtaining of diverse, high- quality data from various sources, is crucial for achieving accurate and adaptable AI models across different fields, including agriculture. For the purposes of this study, data were collected using both a digital camera and an aerial drone. Along with the drone, a 1 m × 1 m polyvinyl chloride (PVC) frame was used, while a 0.5 m × 0.5 m PVC frame was utilised with the camera. The result was two separate datasets: one consisting of images captured by the drone and the other consisting of images taken with the camera.
Training AI models on separate datasets revealed that drone images yielded better results compared to those taken with a digital camera. This performance difference can be explained by several factors: (1) the drone captured images at a constant height of 5 m and always at a right angle, ensuring consistency in the quality and perspective of the shots; (2) in contrast, images taken with the digital camera were subject to variations because the camera was operated by a person, making it difficult to maintain a constant height and proper angle during the shots. For these reasons, the special focus in this study is on drone images, because the final results of the analysis are far more precise.
A DJI Mavic 3 Pro Cine drone (Shenzhen, China), equipped with a 20-megapixel RGB camera, as shown in Table 2, was utilised. The drone’s camera supports high-dynamic-range (HDR) imaging, ensuring enhanced detail and colour accuracy in various lighting conditions. Additionally, the camera can record in ultra-high-definition (UHD) resolution. The drone has a flight distance capability of up to 15 km and a maximum flight time of 20 min per battery charge. It is equipped with a 3-axis adjustable gimbal, which stabilises the camera and allows for precise control over the camera’s orientation during flight.

Table 2.
Detailed drone specifications.
A Canon EOS R10 digital camera (Tokyo, Japan) was used for the second method. This camera features a 204.2-megapixel sensor, enabling high-resolution image capture, and records in full high-definition (FHD) resolution. More details are shown in Table 3. It utilises SD memory for storage, providing enough storage space for high-quality photographs.

Table 3.
Detailed camera specifications.
The collection of images started in the morning at 10:00, when temperatures were still low, as they rose above 29 °C during the day. For each lot, four to six sample points within the lot were chosen. When choosing the sample points, special consideration was made to ensure that they were adequately far apart and that the images captured all of the varying features within the field, including the density of the wheat, weed presence, and other factors. Afterwards, the drone operator captured images at the heights of 5 m, 10 m, and 20 m above ground level. Figure 2 shows a sample image taken at the height of 5 m, with an arrow pointing at the frame. This procedure was repeated for every sample point.
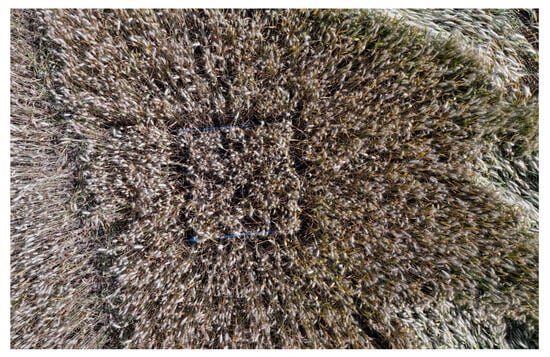
Figure 2.
Example image taken by drone at height of 5 m.
During the process of data acquisition, special attention was paid to ethical considerations. All applicable local laws and regulations relating to the flight of UAVs were observed. Additionally, during the process, no images of humans or their private property were taken without their permission and consent.
For images collected with a digital camera, a process similar to the one used for drone-based image collection was followed, with four to six sample points selected per plot. However, a different PVC frame measuring 0.5 × 0.5 m was used. The frame was held at approximately the same height as the wheat heads by an assistant, while the camera operator captured images. Figure 3 shows an image taken using this method. The camera was positioned directly above the frame with the lens parallel to the ground. This process was repeated for each sample point.
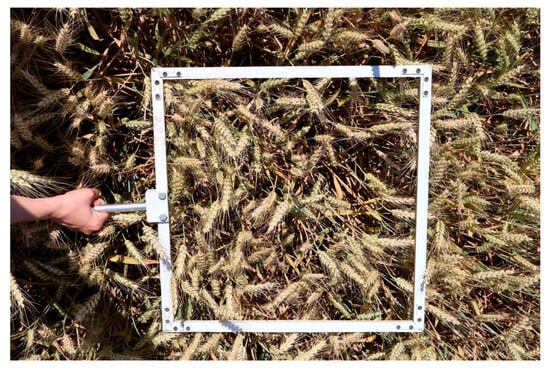
Figure 3.
Example image taken by handheld digital camera.
2.3. Data Preprocessing
After the images were collected, they were transferred to a more permanent storage medium. The images were moved from a more volatile storage medium, that is, the drone’s internal storage, to a less volatile storage medium, a repository hosted in the cloud and an external SSD disk for backup. Furthermore, it was necessary to process the images to ensure they were appropriate for the training of the AI model. To ensure their usability, several steps were performed, which are explained in more detail in this section.
The original images taken by the aerial drone were recorded with a resolution of 5280 × 2970 px, 96 dpi, and 24-bit colour depth. For the purposes of AI training, it was necessary to extract the frames. As the frames had varying positions within the images, it was not feasible to automate this process, and it was conducted manually. In this process, the area of the image that contained the PVC frame, which was positioned on the ground and delimited the sample area, was cropped out. Figure 4a shows the original image with a blue frame representing the boundaries of the area being analyzed (the red dots visible in the image are flowers in the fields). Figure 4b shows an image with the frame extracted.
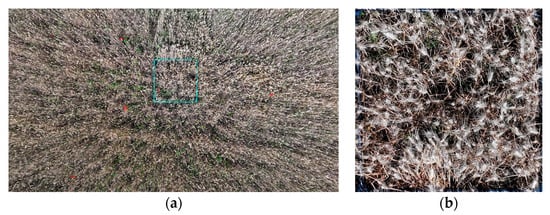
Figure 4.
(a) Original image take by arial drone; (b) scaled image with extracted frame.
Following the extraction of the frames, the images were scaled to a size of 2048 × 2048 px. Then, the scaled images were split into four separate images, each containing one quadrant of the scaled image at a size of 1024 × 1024 px. This was performed to facilitate the next step of the process, which was the annotation. Namely, larger images made it easier to detect wheat heads. Detailed overview of the entire process from image capture to annotation is presented by the diagram shown in Figure 5.

Figure 5.
Flowchart diagram depicting steps for image processing.
Image annotation involves selecting a region of interest (ROI) which contains the object that the model will be trained to detect. In this case, the ROI generally contained only one instance of the object, which was a wheat ear. Furthermore, each ROI was assigned a label corresponding to wheat ear, as this dataset was curated for the development of a model that will be used for detection of wheat ears. Only wheat ears were labelled, with no additional objects being annotated.
This process of labelling and annotating the images was conducted manually by humans. To ensure the accuracy and reliability of the dataset, a review protocol was implemented. In this process, one person would annotate the images by selecting and labelling the ROIs. Afterward, another person would review the labels, carefully examining the annotations to ensure correctness. If any discrepancies or errors were found, the reviewer would make the necessary corrections. This two-person review system helped to improve the overall quality and consistency of the dataset, minimising potential errors in the annotations and ensuring the dataset was suitable for training the detection model.
2.4. Models for Object Detection
We employed state-of-the-art object detection models and conducted several experiments to detect wheat ears on RGB images within our dataset. Specifically, we focused on three well-known models: Faster R-CNN [21], RT-DETR (Detection Transformer) [22], and YOLOv8 (“You Only Look Once”) [23]. These models were chosen due to their proven effectiveness in object detection tasks, each offering a unique balance between speed, accuracy, and computational complexity.
Faster R-CNN was selected for its high accuracy in detecting objects in complex scenes, making it ideal for detecting wheat ears in varying field conditions. RT-DETR was chosen for its ability to effectively handle occlusions and small objects, which are often present in agricultural images. YOLOv8, on the other hand, was selected for its exceptional speed and efficiency, making it suitable for real-time detection in large-scale monitoring applications. Each of these models provides distinct advantages, allowing us to evaluate performance across different requirements. Also, we selected these models based on our previous experience [24,25] with similar studies and their proven effectiveness in different research contexts. Additionally, these models are widely used and well regarded in the industry, further supporting their relevance and applicability to our work.
The initial dataset was split into training, validation, and test sets (56% training set, 14% validation set, and 30% test set) in a stratified manner. Each model was trained for 100 epochs.
The issue of image quality was immediately identified as a potential difficulty. Therefore, we first examined how blurry the images were and determined whether it was hard to differentiate the wheat ears in order to estimate the effect of this aspect on the model’s efficiency. To perform this task, a certain number of high-quality images from the original dataset was extracted, and the models were trained and evaluated using only those images. In the initial experiments, the dataset consisted of 4 training and 5 validation images, with a few hundred labelled wheat ears, and these sets were used to initially train our models.
To summarise, the development of the artificial intelligence model involved several key steps (Figure 6):
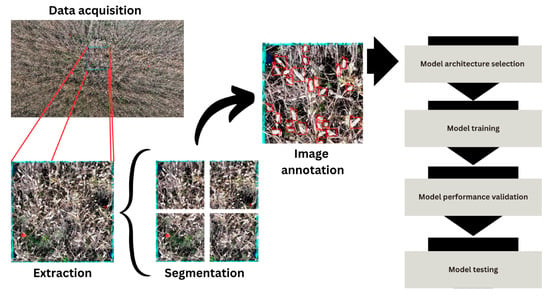
Figure 6.
Phases of AI model development.
- Data acquisition in the field (described in Section 2.2);
- Extraction of areas within the frame—blue boxes (described in Section 2.3);
- Segmentation of extracted image patches (described in Section 2.3);
- Image annotation to mark areas of interest—red boxes (described in Section 2.3);
- Model architecture selection (described in Section 2.4);
- Model training (described in Section 2.4);
- Model performance validation (described in Section 3);
- Model testing (described in Section 3).
2.4.1. Faster R-CNN
The development of object detection techniques such as Faster R-CNN has undergone a series of significant advancements from R-CNN through Fast R-CNN to the final detection model. One of the pioneering deep neural networks intended for object detection is the R-CNN, which induced a strong shift in how object detection is performed by combining CNNs and region proposal. It belongs to the class of two-stage detectors that break the detection process in two phases: region proposal generation and region classification and refinement. R-CNN trains to perform object detection and produce approximately 2000 candidate boxes using object proposals produced by a selective search algorithm [26]. Each candidate box is fixed in size and sent into the CNN for feature extraction. The extracted features are fed into a set of class-specific support vector machines (SVMs) to classify the region into object categories or background, while a regression model is used to refine the coordinates of the proposed bounding boxes. However, there are some limitations of R-CNN, such as its huge computational complexity and inaccurate generation of candidate region proposals due to the absence of inherent learning capability in the selective search algorithm [26].
Fast R-CNN overcomes the observed limitation by using the entire image and proposed regions as input for the CNN. Region proposals are identified and resized into fixed sizes by an ROI pooling layer [27]. After that, the softmax layer determines the objects present within each region proposal and predicts values. This enables a significant reduction in redundant computations, as well as memory consumption. However, it still inherits some drawbacks such as a lack of real-time performance and dependence on selective searches for generating region proposals, as well as the non-learning capability of selective search algorithms and inaccurate region proposal.
The merging of Fast R-CNN and a fully convolutional neural network—a region proposal network (RPN)—brings us to Faster R-CNN, which was designed to address remaining limitations of the previous versions. The RPN generates region proposals directly within the network and replaces the selective search of its predecessors. The input image is passed through a backbone network such as ResNet or VGG to extract a feature map for the entire image. Then, the RPN is used to generate region proposals through three tasks. Firstly, predefined boxes (anchors) of different sizes and aspect ratios are placed at each position of the feature map. For each anchor box in a given position, the RPN predicts the objectiveness score, the likelihood that the anchor contains an object or not, and bounding box refinements which suggest how the anchor box should be adjusted to better fit the object. Finally, anchor filtering is performed based on the objectness score, while the non-maximum suppression (NMS) algorithm is used to eject overlapping or redundant proposals. Obtained proposals are then passed through an ROI pooling layer that outputs a uniform feature map for each ROI, which can then be passed to fully connected layers for classification or bounding box regression.
Faster R-CNN comes in various configurations, but in our case, we utilised the Faster R-CNN R50 FPN configuration. This configuration contains 42 million parameters and is fundamentally based on the Faster R-CNN architecture. We use ResNet-50, an intense convolutional neural network, along with a feature pyramid network (FPN) as the backbone network [27]. The backbone network is responsible for extracting convolutional features from the entire input image, enabling the more efficient detection of objects of different sizes. Although two-stage detectors offer high detection accuracy, they are more computationally intensive and have slower inference, which presents the main limitation of this algorithm and makes it unsuitable for real-time detection. On the other hand, it can still be particularly valuable in scenarios where real-time processing is not a critical requirement.
2.4.2. YOLOv8
YOLOv8 is another CNN for object detection that is one of the latest iterations of the “You Only Look Once” (YOLO) family [25]. It was developed upon foundations laid by its predecessors, and it follows the core YOLO philosophy of real-time, single-stage object detection, where predictions for object classes and bounding boxes are made in one forward pass of the network. YOLOv8 uses a single neural network to predict bounding boxes and class probabilities directly from the input image rather than relying on a two-stage process like the previously mentioned Faster R-CNN.
In YOLOv8, the backbone is typically based on the CSP (cross-stage partial) [28] network, similar to what is used in YOLOv5, but with enhancements for speed and performance. The CSP structure helps in efficiently propagating gradient information, improving training stability, and reducing redundancy in the model. Then, in the neck part, features are aggregated from different scales to prepare them for detection. To capture multi-scale features, YOLOv8 employs an FPN (feature pyramid network) [29] and PANet (path aggregation network) [30]. The FPN helps in propagating lower-level features upwards, while the PANet adds a bottom-up path that helps propagate high-level semantic information downwards to lower-resolution feature maps to enhance information flow in the network. The head is responsible for the final stage of the detection process, where it predicts the coordinates of bounding boxes, class probabilities with appropriate class labels, and confidence scores for each detected object. During post-processing, NMS is applied to eliminate redundant detections.
While earlier versions primarily focused on object detection, YOLOv8 can handle multiple tasks, including object detection, image classification, and instance segmentation, making it more versatile. This model achieves state-of-the-art performance on many object detection benchmarks, such as COCO, with lower latency compared to other models. It is well suited for applications that require high-speed detection, such as autonomous driving, drones, and robotics, as well as applications in precision agriculture. Because of its easy-to-use properties, this model became very popular in the research and development community. Although this model performed well on benchmark datasets, some limitations often occurred and were identified in custom datasets. YOLOv8 typically underperforms in cluttered scenes where objects of interest overlap to a large extent or where there are severe contrast or illumination conditions, which is a general problem for every object detection model.
There are several complexity levels of the YOLOv8 model that allow the model to cover a wide range of use cases where either real-time application or high detection precision is necessary (n, s, m, l, and x, corresponding to nano, small, medium, large, and extra-large), and in our experiments, we used the YOLOv8 nano version that contained about 3 million parameters and proved suitable in some of our previous studies [24,25].
2.4.3. RT-DETR
RT-DETR (real-time detection transformer) [24] is a transformer-based object detection model designed to achieve real-time performance while maintaining high detection accuracy. It merges the strengths of transformer-based architectures, known for their ability to model long-range dependencies, with the speed and efficiency required for real-time object detection. It typically employs CNN layers or a lightweight version of Vision Transformer [31] to extract multi-scale feature maps. Then, the transformer encoder applies self-attention mechanisms to model long-range dependencies and relationships between different parts of the image. This allows the model to capture global context, which is crucial for understanding object locations and boundaries across the entire image. Another important property of RT-DETR is its ability to handle features at multiple scales thanks to the multi-scale attention mechanism, which allows for the better detection of objects of varying sizes. This mechanism, instead of just looking at one part of an image at a single resolution, attends to multiple feature maps extracted at different scales and decides what parts of the image at different resolutions need more focus.
In the decoder stage, object queries are used to predict object locations and classes. These queries are learnable embeddings that interact with the encoded image features via the transformer decoder. The object queries represent possible objects in the image. Through multiple layers of cross-attention and self-attention, the decoder refines these queries to predict object bounding boxes and classes. Bounding box prediction is typically performed using a fully connected (FC) layer or a linear layer that regresses the coordinates. Object classification is handled through another FC layer, assigning each query a probability distribution over object classes. Unlike traditional object detectors, RT-DETR is fully end-to-end, avoiding hand-crafted processes such as anchor generation. While Faster R-CNN and YOLOv8 struggle with detecting small objects, RT-DETR has proven to be effective and is successfully used to address this issue [32]. However, transformers, including RT-DETR, require extensive datasets to prevent overfitting, which means that training the model with limited data may lead to suboptimal results, and this represents one of its main limitations. In terms of parameters, RT-DETR typically has around 43 million parameters, which strikes a balance between model complexity and real-time performance, but this parameter count can limit its practical application in resource-constrained environments. This is known as the “large” RT-DETR version, but there is also a more complex “extra-large” version. In our experiments, we used the “large” version, while the “extra-large” version is out of the scope of our current research.
3. Results
The primary outcome of this study is the development of comprehensive datasets for agricultural use that can be utilised for training AI models in wheat ear detection. These datasets include high-resolution images collected under various field conditions, annotated to ensure accuracy in model training. The integration of modern technologies such as drones equipped with high-resolution cameras and handheld high-resolution cameras, combined with data collection and processing, can significantly enhance monitoring and yield prediction processes, ensuring improved agricultural outcomes.
The dataset resulting from this study contained 556 images (see Table 4) with annotated and labelled wheat heads. The purpose of the dataset is to train the wheat detection AI model, which will be trained on these images in the future. Figure 7 shows labelled image fragments—red boxes (described in Section 2.3). The images are separated into directories, with each directory corresponding to a lot.

Table 4.
Number of images per lot.
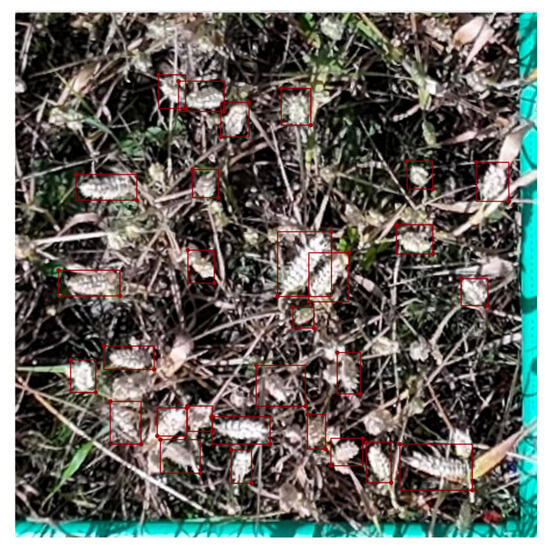
Figure 7.
Image fragment with labels.
The directory name consists of a unique name assigned to each lot (as shown in Table 1), the height at which the image was taken relative to ground level, and the type of sensor used to capture the images. Each image within the directory is named using the same basic information—the lot name, height, and sensor type—with the addition of a unique ID and quadrant designation. The image name is structured as follows: LotName_height_sensor_imageNumber_quadrantNumber.jpg. For example, an image could be named: Derventa_A_5m_dron_001_0_1.jpg.
Upon successful data acquisition and dataset preprocessing, deep learning models were developed for the purpose of detecting wheat ears. Metrics such as precision, recall, and F1-score were determined to highlight variations in detection performance and robustness, allowing for the identification of the most suitable model. Each model was trained for 100 epochs.
As previously mentioned in Section 2.4, the initial experiment included a small dataset consisting of four high-quality images in the training set and five high-quality images each in the validation and test set. After each training run, the number of low-quality images was gradually increased in the training set, and metrics were subsequently monitored. The results of the initial experiments are shown in Table 5.

Table 5.
Evaluation metrics for initial experiments with high-quality training images.
Each of the models performed well during training and validation and proved to be capable of solving this detection problem. The first experiment with only high-quality images achieved solid metrics of 0.77 precision and 0.72 recall after 100 epochs for RT-DETR, while Faster R-CNN and YOLOv8 achieved slightly lower metrics. Upon adding low-quality images to the training set, these metrics slightly deteriorated. Recall decreased, and the model became more selective. For each model, the number of false positive detections increased with the addition of low-quality images, but that change did not significantly affect test metrics. Initial experiments for YOLOv8 showed that the model was able to distinguish wheat ears, but with slightly higher possibility of missing certain ground truth labels, while Faster R-CNN and RT-DETR detected fewer false negatives; that is, these models tended to confuse and detect wheat ears in parts of an image where there were no ground truth labels. This may also be due to the fact that in low-quality images, some wheat ears may not be labelled in the ground truth data, but the model managed to detect them. After these initial tests, it was concluded that low-quality images did not significantly affect training, and therefore, training on the full dataset was performed.
Figure 8 shows an example of one low-quality image from the dataset (blue boxes in the images are described in Section 2.3), where Faster R-CNN achieved an F1 score of 0.87 (Figure 8a). For the same image, YOLOv8 and RT-DETR achieved the same F1 score of 0.77 (Figure 8b,c). The frequent overlap indicates that the Faster R-CNN struggled with distinguishing individual wheat ears, especially in densely populated areas, leading to multiple bounding boxes around the same or nearby objects.
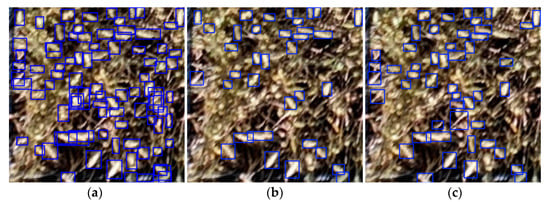
Figure 8.
Detection examples for low-quality images: (a) Faster R-CNN (F1:0.87), (b) RT-DETR (F1:0.77), (c) YOLOv8 (F1: 0.77).
Faster R-CNN performed slightly worse on an example of a high-quality image (Figure 9—blue boxes in the images are described in Section 2.3), achieving an F1 score of 0.81. Similarly, RT-DETR and YOLOv8 models also showed a decrease in their F1 scores on a high-quality image (0.74 for RT-DETR, Figure 9b; 0.69 for YOLOv8, Figure 9c), but the achieved metrics were satisfactory. Despite the higher image quality, Faster R-CNN still exhibited overlapping bounding boxes, indicating that even with better resolution, the model continues to struggle with precise localisation in certain areas, particularly when wheat ears are closely packed or occluded. Although Faster R-CNN exhibits better metrics in these examples, results from Table 5 suggest that RT-DETR is the most reliable model and the most suitable for performing wheat ear detection tasks.
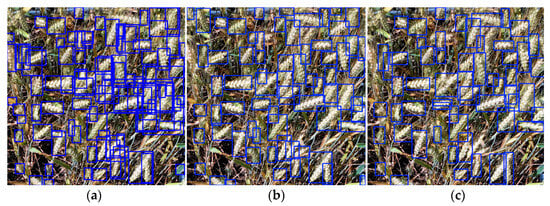
Figure 9.
Detection examples for high-quality images: (a) Faster R-CNN (F1: 0.81), (b) RT-DETR (F1: 0.74), (c) YOLOv8 (F1: 0.69).
After the initial testing and the conclusion that the developed algorithms are adequate for wheat ear detection and delivered satisfactory results, further testing was conducted on the complete dataset. This comprehensive evaluation aimed to ensure the robustness and reliability of the models across diverse data conditions. The outcomes of this extensive testing process are presented in Table 6, demonstrating the performance metrics achieved by each model and providing deeper insights into their effectiveness in real-world scenarios.

Table 6.
Evaluation metrics for final models.
The YOLOv8 model showed a comparative advantage compared to other models when it comes to precision. This is likely caused by the use of YOLO layers in the model and their ability to better comprehend the whole image, and because its fast performance it has very few false positives. This model lacks performance when considering recall and F1 score, as shown in Table 6; this is problematic and indicates that the model does not detect all instances of true positive objects in an image, or it falsely classifies detected objects as a background. In this area, RT-DETR showed better performance, likely due to its global attention mechanism and its two-stage detection process. Also, these properties are likely to make RT-DETR better for detecting wheat ears with different sizes.
4. Discussion
Wheat yield prediction systems are crucial for ensuring food security and optimising agricultural practices. These systems leverage various data sources and machine learning techniques to forecast crop yields accurately and in a timely manner. This synthesis examines the effectiveness of different wheat yield prediction systems based on recent research findings.
The integration of advanced technologies, such as computer vision and artificial intelligence, is revolutionising the agricultural sector, particularly in the area of wheat yield prediction. Through the development of automated systems for tasks like wheat ear detection, this study has shown how UAVs, high-resolution cameras, and deep learning models can drastically improve efficiency, accuracy, and scalability compared to traditional manual methods. By utilising large datasets collected from diverse geographical locations and processing them using state-of-the-art AI models, such as Faster R-CNN, YOLOv8, and RT-DETR, significant strides were made in object detection and precision agriculture.
It can be observed from Table 6 that the YOLOv8 model achieves the highest precision, indicating that this model is the most effective for minimising false positives. However, its recall is considerably lower, suggesting the model misses more than a half of labelled wheat ears. The RT-DETR model has the highest recall, meaning it is more effective at identifying true positives but with slightly lower precision than YOLOv8.
The results show that there are strengths and weaknesses among the models used in the study. Another factor that is worth considering is that the dataset used included images from fields of various sizes, altitudes, and wheat species sown. This enables these models to be able to detect wheat ears in varied conditions. However, this approach emphasises the importance of a high-quality dataset as well as the size of the dataset.
The results achieved in this study demonstrate an improvement compared to those from two previously discussed studies [19,20], where the highest precision for wheat ear detection reached 82%. Unlike these prior works, which focused on datasets with limited variability in terms of wheat species, field conditions, and image quality, this study utilised a more diverse dataset that included images captured under varied conditions such as different field sizes, altitudes, and wheat species. This diversity enhanced the generalisability of the models, enabling them to perform well across a broader range of scenarios.
Future improvements should address the limitations observed in the current results, particularly the low recall of YOLOv8, which indicates missed detections due to dense or overgrown wheat ears. The Faster R-CNN model also showed overlapping bounding boxes, highlighting the challenges in accurate localisation even with high-quality images. Improvements could include fine-tuning hyperparameters, expanding and diversifying training datasets, and exploring advanced or hybrid model architectures. A variety of augmentation techniques are also commonly being used to improve model generalisation and robustness by generating more versatile training data. Post-processing methods to reduce overlapping bounding boxes and closed object detection modules could further increase accuracy. Incorporating feedback from field data into the training process would help develop a more robust and reliable detection system for wheat and other crops.
Given that the collected data span various climatic conditions and include wheat of different varieties and soil types, our future work will focus on examining how these factors influence the models. In this study, we concentrated on the general task of detecting wheat ears; however, we are particularly interested in investigating whether the models exhibit any bias towards specific wheat varieties or climatic conditions in which the wheat grows.
This research highlights that high-quality datasets combined with robust deep learning algorithms enable reliable models for crop monitoring. The integration of artificial intelligence automates labour-intensive tasks, facilitates timely decision-making, and improves yield forecasting.
5. Conclusions
The application of digital technologies, such as computer vision and artificial intelligence, represents a powerful tool in precision agriculture, particularly for crop detection and yield estimation. The performance of algorithms, with a precision of 0.87257 achieved with YOLOv8, a recall of 0.70811 with RT-DETR, and an F1 score of 0.69596, highlight the potential deep learning has when it comes to wheat ear detection. This study lays the groundwork for future research, not only for wheat production but also for other crops and agricultural products. These technologies can be used for precise fruit counting, plant species identification, crop growth and development monitoring, and pest and disease detection at early stages, reducing the need for chemical treatments and enhancing resource efficiency. Additionally, they have potential applications in assessing the quality of fruits and vegetables, optimising irrigation through soil moisture analysis, and estimating yields for various types of grains, fruits, vegetables, and industrial crops. In the future, such systems could be integrated into broader farm management platforms, providing farmers with personalised recommendations based on data collected from drones, satellites, and other IoT devices. This would enable not only resource optimisation and yield improvement but also represent a significant contribution to global food security through sustainable and competitive agricultural practices.
Author Contributions
Conceptualization, M.S.-D. and L.G.P.; methodology, M.S.-D. and Ž.G.; software, F.B., Ž.G., D.S. and I.M.; validation, F.B., N.M., Ž.G. and O.M.; formal analysis, F.B. and N.M.; investigation, M.S.-D. and M.H.H.; resources, M.S.-D., F.B. and N.M.; data curation, M.S.-D., M.H.H., N.M. and F.B.; writing—original draft preparation, M.S.-D. and M.H.H.; writing—review and editing, M.S.-D. and L.S.; visualization, D.S. and I.M; supervision, L.G.P. and L.S.; project administration, M.S.-D.; funding acquisition, M.S.-D. All authors have read and agreed to the published version of the manuscript.
Funding
This research was funded by the United Nations Development Programme (UNDP) and Czech Development Agency (CzDA) through the European Union Support to Agriculture Competitiveness and Rural Development in Bosnia and Herzegovina (EU4AGRI) project. Grant number UNDPBIH-23-148-EU4A-VERLAB-S and “The APC was funded by the EU4AGRI project”. Project title: Research on the application of artificial intelligence for sustainable digital transformation and innovation in the agricultural sector in Bosnia and Herzegovina—AgroSmart, 2024.
Data Availability Statement
The raw data supporting the conclusions of this article will be made available by the authors on request.
Conflicts of Interest
The authors declare that they have no known competing financial interests or personal relationships that could have appeared to influence the work reported in this paper. The funders had no role in the design of the study; in the collection, analyses, or interpretation of data; in the writing of the manuscript; or in the decision to publish the results.
References
- Erenstein, O.; Jaleta, M.; Mottaleb, K.A.; Sonder, K.; Donovan, J.; Braun, H.J. Global Trends in Wheat Production, Consumption and Trade. In Wheat Improvement; Reynolds, M.P., Braun, H.J., Eds.; Springer: Cham, Switzerland, 2022. [Google Scholar] [CrossRef]
- Food and Agriculture Organization of the United Nations. Available online: https://www.fao.org/sustainable-development-goals-helpdesk/en (accessed on 23 July 2024).
- Saeed, K.; Lizhi, W. Crop Yield Prediction Using Deep Neural Networks. Front. Plant Sci. 2019, 10, 621. [Google Scholar] [CrossRef]
- Jones, E.J.; Bishop, T.F.; Malone, B.P.; Hulme, P.J.; Whelan, B.M.; Filippi, P. Identifying causes of crop yield variability with interpretive machine learning. Comput. Electron. Agric. 2022, 192, 106632. [Google Scholar] [CrossRef]
- Ma, J.; Wu, Y.; Liu, B.; Zhang, W.; Wang, B.; Chen, Z.; Wang, G.; Guo, A. Wheat Yield Prediction Using Unmanned Aerial Vehicle RGB-Imagery-Based Convolutional Neural Network and Limited Training Samples. Remote Sens. 2023, 15, 5444. [Google Scholar] [CrossRef]
- Grbović, Ž.; Panić, M.; Marko, O.; Brdar, S.; Crnojevic, V. Wheat Ear Detection in RGB and Thermal Images Using Deep Neural Networks. In Proceedings of the International Conference on Machine Learning and Data Mining, MLDM, New York, NY, USA, 13–18 July 2019. [Google Scholar]
- Karunathilake, E.M.B.M.; Le, A.T.; Heo, S.; Chung, Y.S.; Mansoor, S. The Path to Smart Farming: Innovations and Opportunities in Precision Agriculture. Agriculture 2023, 13, 1593. [Google Scholar] [CrossRef]
- Istiak, M.A.; Syeed, M.M.; Hossain, M.S.; Uddin, M.F.; Hasan, M.; Khan, R.H.; Azad, N.S. Adoption of Unmanned Aerial Vehicle (UAV) imagery in agricultural management: A systematic literature review. Ecol. Inform. 2023, 78, 102305. [Google Scholar] [CrossRef]
- Grbović, Ž.; Waqar, R.; Pajević, N.; Stefanović, D.; Filipović, V.; Panić, M. Closing the Gaps in Crop Management: UAV-Guided Approach for Detecting and Estimating Targeted Gaps Among Corn Plants. In Proceedings of the 8th Workshop on Computer Vision in Plant Phenotyping and Agriculture, Paris, France, 2–6 October 2023. [Google Scholar]
- Enciso, J.; Avila, C.A.; Jung, J.; Elsayed-Farag, S.; Chang, A.; Yeom, J.; Landivar, J.; Maeda, M.; Chavez, J.C. Validation of Agro-nomic UAV and Field Measurements for Tomato Varieties. Comput. Electron. Agric. 2019, 158, 278–283. [Google Scholar] [CrossRef]
- Bouguettaya, A.; Zarzour, H.; Kechida, A.; Taberkit, A.M. A survey on deep learning-based identification of plant and crop diseases from UAV-based aerial images. Clust. Comput. 2023, 26, 1297–1317. [Google Scholar] [CrossRef] [PubMed]
- Casella, V.; Franzini, M.; Gorrini, M.E. Crop marks detection through optical and multispectral imagery acquired by UAV. In Proceedings of the 2018 Metrology for Archaeology and Cultural Heritage (MetroArchaeo), Cassino, Italy, 22–24 October 2018; pp. 173–177. [Google Scholar] [CrossRef]
- Surekha, P.; Venu, N.; Shetty, A.N.; Sachan, O. An Automatic Drone to Survey Orchards Using Image Processing and Solar Energy. In Proceedings of the IEEE 17th India Council International Conference (INDICON), New Delhi, India, 10–13 December 2020; pp. 1–7. [Google Scholar] [CrossRef]
- Brewer, K.; Clulow, A.; Sibanda, M.; Gokool, S.; Odindi, J.; Mutanga, O.; Naiken, V.; Chimonyo, V.G.P.; Mabhaudhi, T. Estimation of Maize Foliar Temperature and Stomatal Conductance as Indicators of Water Stress Based on Optical and Thermal Imagery Acquired Using an Unmanned Aerial Vehicle (UAV) Platform. Drones 2022, 6, 169. [Google Scholar] [CrossRef]
- Foreign Investment Promotion Agency of Bosnia and Herzegovina. Available online: http://www.fipa.gov.ba/atraktivni_sektori/poljoprivreda/default.aspx?langTag=en-US (accessed on 2 September 2024).
- The Parliament of the Federation of Bosnia and Herzegovina. Strategija Razvoja FBiH 2021-2027_bos. Available online: https://parlamentfbih.gov.ba (accessed on 23 July 2024).
- World Bank. Available online: https://documents1.worldbank.org/curated/en/598961648043356204/pdf/Bosnia-and-Herzegovina-Agriculture-Resilience-and-Competitiveness-Project.pdf?_gl=1*awky93*_gcl_au*MTMyMDM2Nzk1OS4xNzIwNjkzMDE0 (accessed on 23 July 2024).
- Liu, Y.; Ma, X.; Shu, L.; Hancke, G.P.; Abu-Mahfouz, A.M. From Industry 4.0 to Agriculture 4.0: Current Status, Enabling Technologies, and Research Challenges. IEEE Trans. Ind. Inform. 2021, 17, 4322–4334. [Google Scholar] [CrossRef]
- Zhou, C.; Liang, D.; Yang, X.; Yang, H.; Yue, J.; Yang, G. Wheat ears counting in field conditions based on multi-feature optimization and TWSVM. Front. Plant Sci. 2018, 9, 1024. [Google Scholar] [CrossRef] [PubMed]
- Haq SI, U.; Tahir, M.N.; Lan, Y. Weed detection in wheat crops using image analysis and artificial intelligence (AI). Appl. Sci. 2023, 13, 8840. [Google Scholar] [CrossRef]
- Girshick, R. Fast R-CNN. In Proceedings of the IEEE International Conference on Computer Vision, Santiago, Chile, 7–13 December 2015; pp. 1440–1448. [Google Scholar]
- Zhao, Y.; Lv, W.; Xu, S.; Wei, J.; Wang, G.; Dang, Q.; Chen, J. Detrs Beat YOLOs on Real-Time Object Detection. In Proceedings of the IEEE/CVF Conference on Computer Vision and Pattern Recognition, Seattle, WA, USA, 16–22 June 2024; pp. 16965–16974. [Google Scholar]
- Jocher, G.; Chaurasia, A.; Qiu, J. Ultralytics YOLO (Version 8.0.0). 2023. Available online: https://github.com/ultralytics/ultralytics (accessed on 14 August 2024).
- Waqar, R.; Grbović, Ž.; Khan, M.; Pajević, N.; Stefanović, D.; Filipović, V.; Djuric, N. End-to-End Deep Learning Models for Gap Identification in Maize Fields. In Proceedings of the IEEE/CVF Conference on Computer Vision and Pattern Recognition, Seattle, WA, USA, 17–18 June 2024; pp. 5403–5412. [Google Scholar]
- Čuljak, B.; Pajević, N.; Filipović, V.; Stefanović, D.; Grbović, Z.; Djuric, N.; Panić, M. Exploration of Data Augmentation Techniques for Bush Detection in Blueberry Orchards. In Proceedings of the IEEE/CVF Conference on Computer Vision and Pattern Recognition, Seattle, WA, USA, 17–18 June 2024; pp. 5674–5683. [Google Scholar]
- Lee, I.; Kim, D.; Wee, D.; Lee, S. An Efficient Human Instance-Guided Framework for Video Action Recognition. Sensors 2021, 21, 8309. [Google Scholar] [CrossRef] [PubMed]
- Maity, M.; Banerjee, S.; Chaudhuri, S.S. Faster R-CNN and YOLO Based Vehicle Detection: A Survey. In Proceedings of the 2021 5th International Conference on Computing Methodologies and Communication (ICCMC 2021), Erode, India, 8–10 April 2021. [Google Scholar]
- Wang, C.Y.; Liao HY, M.; Wu, Y.H.; Chen, P.Y.; Hsieh, J.W.; Yeh, I.H. CSPNet: A new backbone that can enhance learning capability of CNN. In Proceedings of the IEEE/CVF Conference on Computer Vision and Pattern Recognition Workshops, Seattle, WA, USA, 14–19 June 2020; pp. 390–391. [Google Scholar]
- Lin, T.Y.; Dollár, P.; Girshick, R.; He, K.; Hariharan, B.; Belongie, S. Feature Pyramid Networks for Object Detection. In Proceedings of the IEEE Conference on Computer Vision and Pattern Recognition, Honolulu, HI, USA, 21–26 July 2017; pp. 2117–2125. [Google Scholar]
- Liu, S.; Qi, L.; Qin, H.; Shi, J.; Jia, J. Path Aggregation Network for Instance Segmentation. In Proceedings of the IEEE Conference on Computer Vision and Pattern Recognition, Salt Lake City, UT, USA, 18–23 June 2018; pp. 8759–8768. [Google Scholar]
- Dosovitskiy, A. An image is worth 16x16 words: Transformers for image recognition at scale. arXiv 2020, arXiv:2010.11929. [Google Scholar]
- Kong, Y.; Shang, X.; Jia, S. Drone-DETR: Efficient Small Object Detection for Remote Sensing Image Using Enhanced RT-DETR Model. Sensors 2024, 24, 5496. [Google Scholar] [CrossRef] [PubMed]
Disclaimer/Publisher’s Note: The statements, opinions and data contained in all publications are solely those of the individual author(s) and contributor(s) and not of MDPI and/or the editor(s). MDPI and/or the editor(s) disclaim responsibility for any injury to people or property resulting from any ideas, methods, instructions or products referred to in the content. |
© 2024 by the authors. Licensee MDPI, Basel, Switzerland. This article is an open access article distributed under the terms and conditions of the Creative Commons Attribution (CC BY) license (https://creativecommons.org/licenses/by/4.0/).