Article

Detection and Early Warning of Duponchelia fovealis Zeller (Lepidoptera: Crambidae) Using an Automatic Monitoring System

by
Edgar Rodríguez-Vázquez
1,
Agustín Hernández-Juárez
1,
Audberto Reyes-Rosas
2,
Carlos Patricio Illescas-Riquelme
3,* and
Francisco Marcelo Lara-Viveros
2,*
1
Departamento de Parasitología, Universidad Autónoma Agraria Antonio Narro, Calzada Antonio Narro 1923, Buenavista, Saltillo 25315, Coahuila, Mexico
2
Centro de Investigación en Química Aplicada, Departamento de Biociencias y Agrotecnología, Enrique Reyna H. 140, San José de los Cerritos, Saltillo 25294, Coahuila, Mexico
3
CONAHCYT/Centro de Investigación en Química Aplicada, Departamento de Biociencias y Agrotecnología, Enrique Reyna H. 140, San José de los Cerritos, Saltillo 25294, Coahuila, Mexico
*
Authors to whom correspondence should be addressed.
AgriEngineering 2024, 6(4), 3785-3798; https://doi.org/10.3390/agriengineering6040216
Submission received: 21 August 2024 / Revised: 27 September 2024 / Accepted: 8 October 2024 / Published: 18 October 2024

Abstract

:
In traditional pest monitoring, specimens are manually inspected, identified, and counted. These techniques can lead to poor data quality and hinder effective pest management decisions due to operational and economic limitations. This study aimed to develop an automatic detection and early warning system using the European Pepper Moth, Duponchelia fovealis (Lepidoptera: Crambidae), as a study model. A prototype water trap equipped with an infrared digital camera controlled using a microprocessor served as the attraction and capture device. Images captured by the system in the laboratory were processed to detect objects. Subsequently, these objects were labeled, and size and shape features were extracted. A machine learning model was then trained to identify the number of insects present in the trap. The model achieved 99% accuracy in identifying target insects during validation with 30% of the data. Finally, the prototype with the trained model was deployed in the field for result confirmation.

1. Introduction

Intensive agricultural systems are frequently affected by insect pests. These organisms can directly reduce the crop yield, compromise its quality, or hinder the movement and marketing of agricultural products due to their presence [1]. Insect pest monitoring is a crucial technique for implementing an effective pest management program [2]. This practice allows for the acquisition of qualitative and/or quantitative data on specific organisms, the determination of their geographical distribution, an evaluation of control measure efficacy, and broadly, the identification of parameters for predicting pest outbreaks before they cause significant production losses [3,4].
Common insect pest monitoring methods include direct observation on the host plant, sweep net sampling, tapping of plant structures, and the periodic inspection of traps emitting specific attractants (e.g., colors, shapes, semiochemicals, light) [5,6,7]. These methods require dedicated, trained personnel for their implementation, leading to time and cost constraints, particularly in extensive crop fields. Additionally, potential errors in judgment and delays in pest status information acquisition can occur due to human error during field worker inspections [8,9,10]. Consequently, timely and appropriate pest management application becomes challenging.
To address limitations associated with traditional monitoring, computer-assisted vision technologies were developed for the automatic detection and identification of pest insects in trap images captured using digital cameras [11,12]. While some studies have shown the potential of digital image processing algorithms for automated pest insect counting [13,14], several algorithms were designed for images acquired under controlled conditions [6,15]. These techniques have drawbacks such as the requirement for manual trap review and the inability to analyze the temporal-environmental data obtainable from a real-time monitoring system.
Advancements in miniaturized sensor, equipment, and processing technology have led to cost-effective implementation of these practices. Such equipment enables real-time monitoring through internet connectivity, providing data that facilitates informed decision-making [16,17,18]. Research by Liu et al. [15] and Solis-Sánchez et al. [19] suggests the feasibility of using automatic counting algorithms for pest population monitoring to achieve early and efficient outbreak prevention. This study presents a novel automated model for the field-based detection, counting, and early warning of pest moths. The model utilizes a system integrating a microprocessor and a digital camera coupled to a water trap.
The European Pepper Moth (EPM) Duponchelia fovealis Zeller (Lepidoptera: Crambidae), a polyphagous invasive species native to the Mediterranean and economically relevant in strawberry plantations (Fragaria × ananassa Duchesne ex Rozier) [20], was selected as the study model. Visual inspection for this moth is challenging due to its larval soil habitat and adult daytime concealment within surrounding vegetation. Pheromone-baited traps, however, serve as an efficient and selective tool for EPM attraction and capture. Consequently, the implementation of this technology will equip users with the necessary information for the timely deployment of management strategies upon initial capture, facilitated by the system’s application.

2. Materials and Methods

2.1. Biological Material

Males of the EPM, were utilized as the study model, sourced from different locations based on the research phase. For details on sex characteristics and differences, refer to Rodríguez-Vázquez et al. [20]. During the laboratory phase, specimens were acquired from the mass rearing of D. fovealis established at the Entomology Laboratory of the Institute of Agricultural and Forestry Research at Universidad Michoacana de San Nicolás de Hidalgo, Morelia, Michoacán, Mexico, under the supervision of Dr. Samuel Pineda Guillermo.
Field collection utilized the pheromonal lure Phero-Df (Squid Biological and Pheromones©) to attract wild specimens from a commercial strawberry plantation employing a macrotunnel system in Cantarranas, Irapuato, Guanajuato, Mexico (coordinates: 20°31′57″ N 101°26′04″ W, altitude: 1702 masl).

2.2. Trap Design

A standard-design water trap was constructed for pest moth capture. The trap consisted of a rectangular bucket with a lid (UNLINE.mx, Monterrey, Nuevo León, Mexico) measuring 21.59 cm in width, 25.08 cm in length, and 33.33 cm in height, with a capacity of 15.14 L. Three 15 × 15 cm windows were created in the bucket on three sides, 10 cm from the base of the container (Figure 1a). These openings facilitate moth entry into the trap.
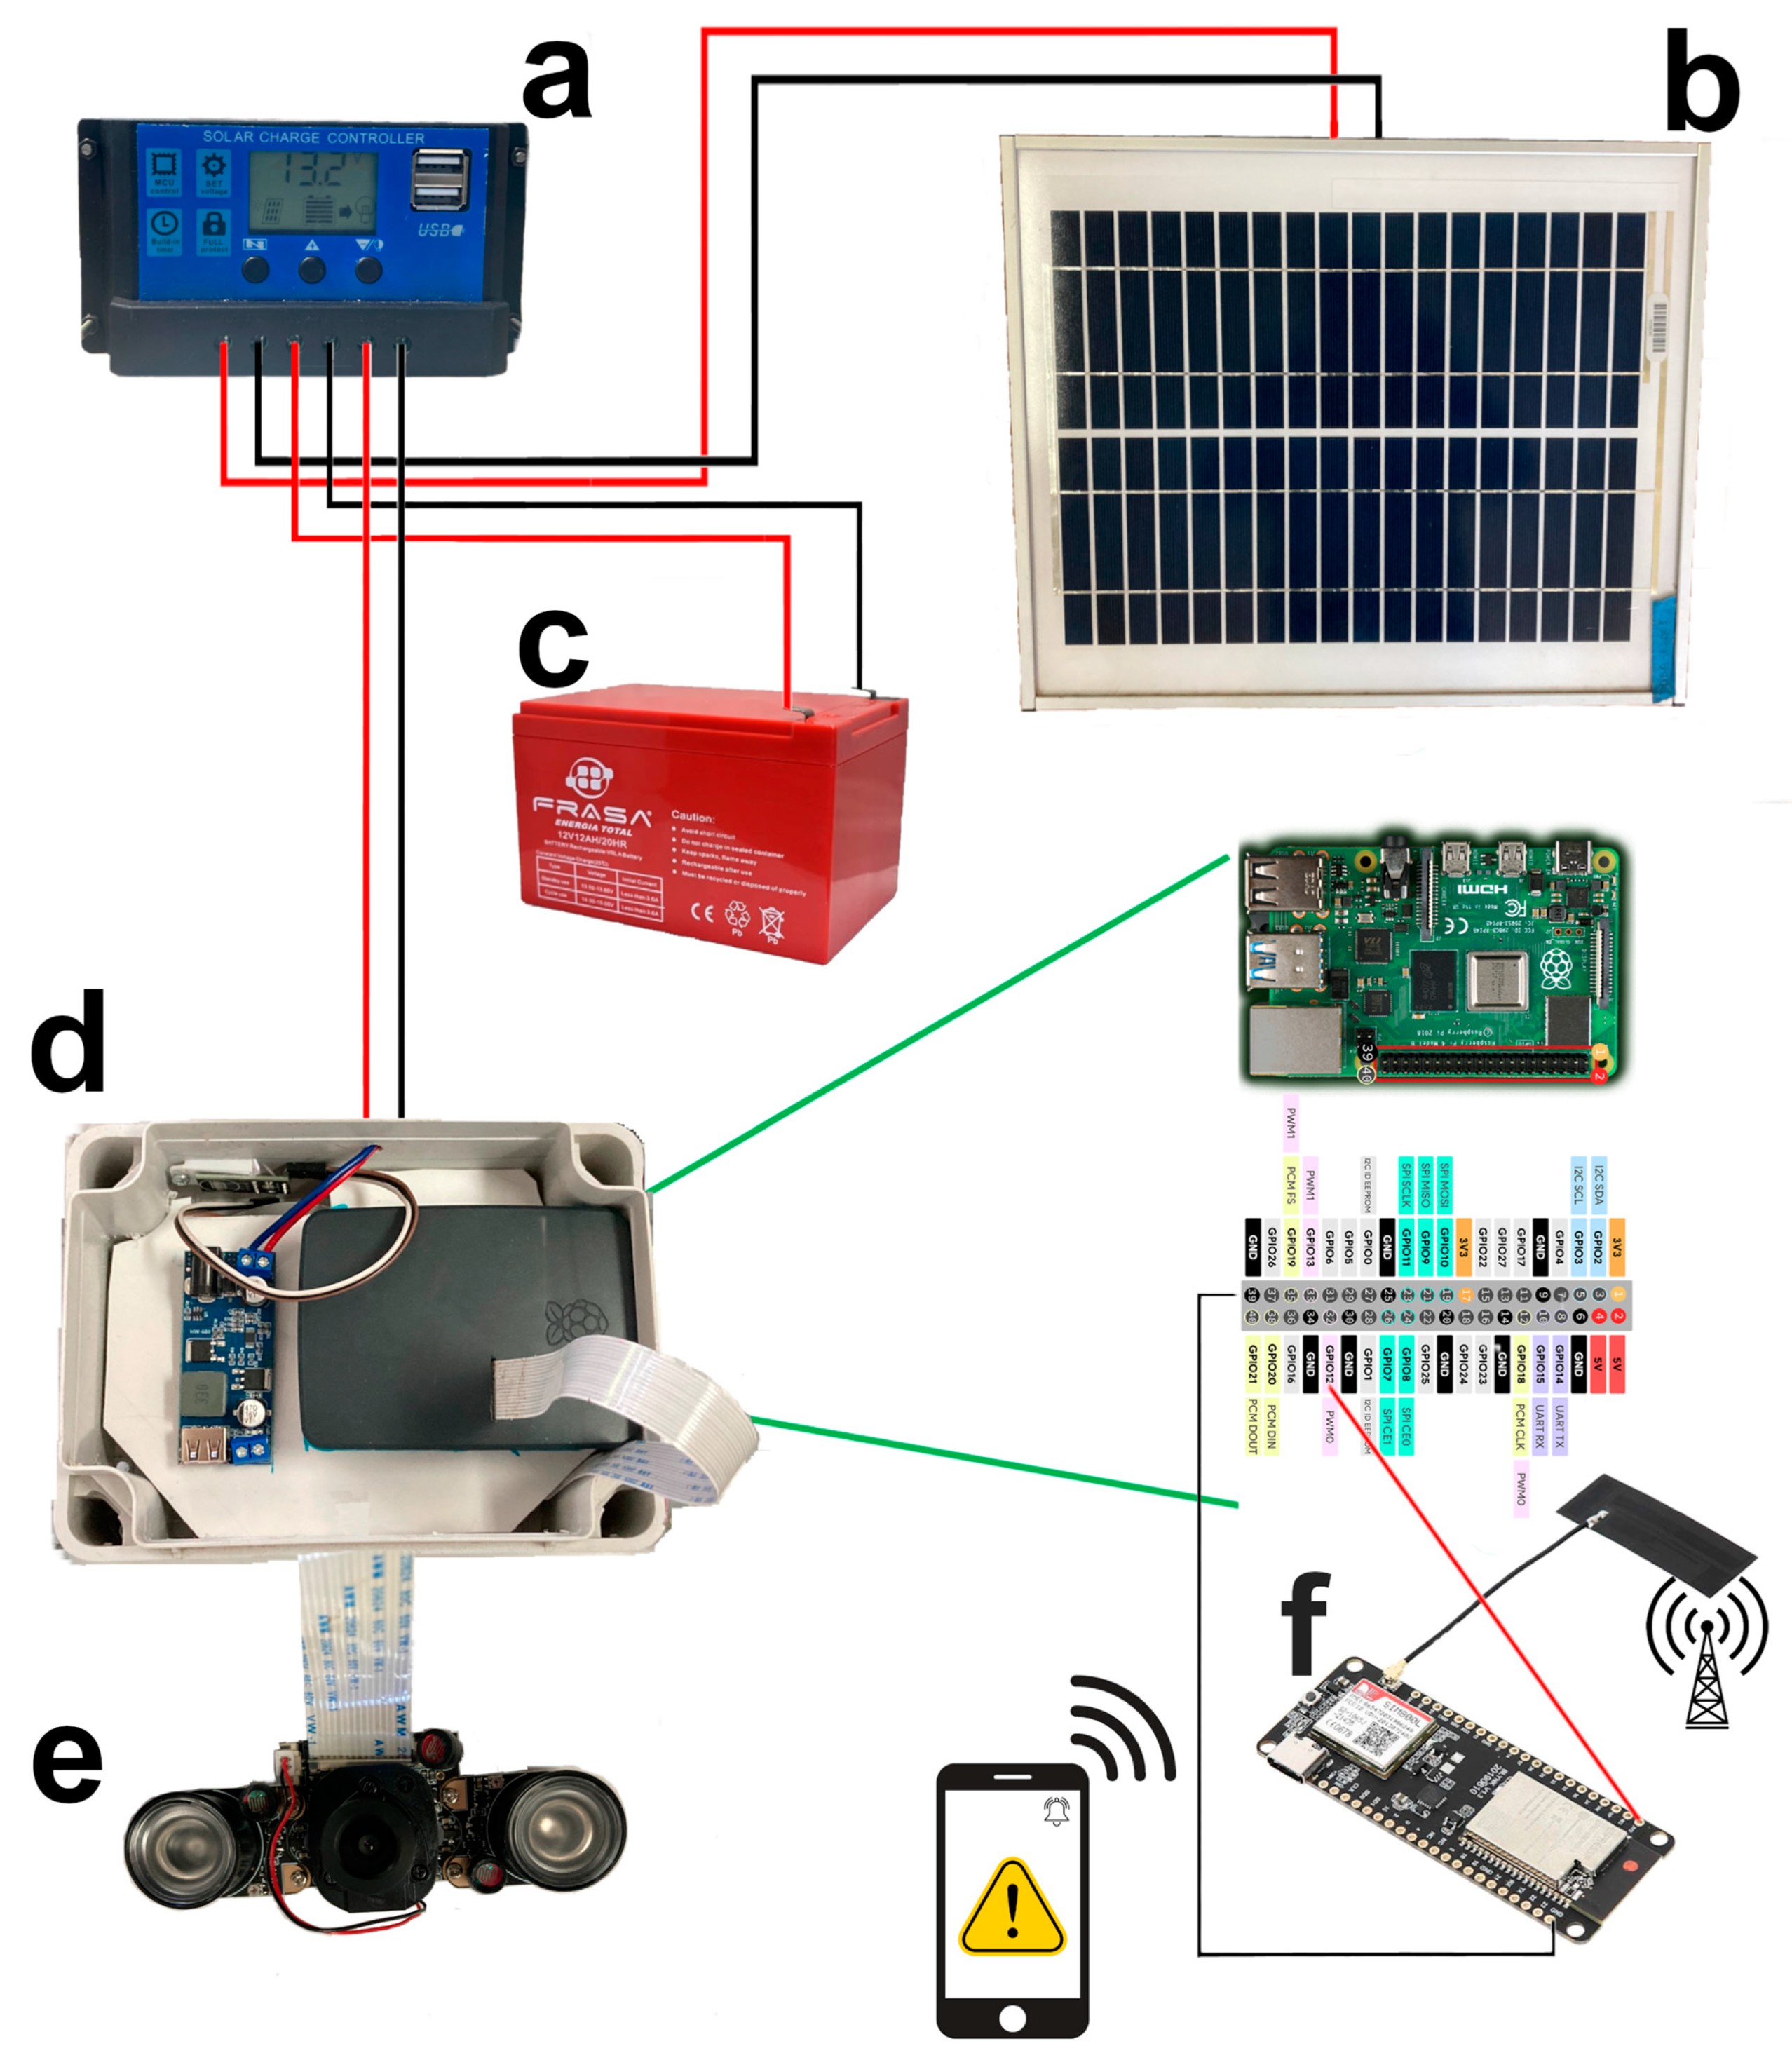
A fixed, watertight box was secured to the trap lid and partitioned into two sections. The lower section housed a camera module adapted for Raspberry Pi B 3/2 with automatic night vision, capturing a wide view of the bucket bottom (Figure 1b,c). This infrared (IR) camera was connected to a Raspberry Pi 4B© (Raspberry Pi foundation, Cambridge, UK) controller using a 25 cm flat cable. The upper section housed the Raspberry Pi 4B© controller and a 9~36 V to 5 V voltage step-down module (Figure 2d). To protect the controller, a transparent acrylic cover with side ventilation holes was assembled on the bucket lid, enclosing the fixed waterproof box.
For field trials, the system was augmented with an ESP32 microcontroller linked to a SIM800H GSM/GPRS module (Figure 2f), enabling subscriber identity module (SIM) card integration and SMS communication to designated mobile phone numbers. The camera and Raspberry Pi 4B© controller were powered by a 100 A charge controller (AIYUNDI®, China) and a non-standard 12 V, 12 Ah rechargeable lead-acid battery (FRASA®, São Paulo, Brazil) connected to a 20 W solar panel with an 18 V output (Figure 2a–c).

2.3. Laboratory Image Acquisition

The water trap, previously coupled with the camera and microprocessor unit, was utilized for image capture. Three liters of water containing 0.5 mL of TWEEN 20 (AZUMEX, Puebla, Mexico) was added to the bucket interior to retain moths. The prototype camera captured images at predetermined intervals, which were subsequently stored on the Raspberry Pi 4B controller.
Live D. fovealis males from the breeding colony were individually introduced into the trap, simulating field captures. This process was repeated for groups of up to ten individuals. A total of 500 digital images were obtained, depicting D. fovealis males in various natural positions within the trap.

2.4. Image Processing and Training of the Machine Learning Model

To enhance the dataset and augment the available images for training the machine learning model, image processing techniques were employed. The images acquired in the laboratory were processed utilizing the Open CV library of Python v3.3. Each image was subjected to rotation at angles of 22.5, 45, 67.5, 90, 112.5, 135, 157.5, 180, 202.5, 225, 247.5, 270, 292.5, 315, and 337.5 degrees, employing image data augmentation methods based on rotation techniques [21]. This approach, under laboratory conditions, enabled the generation of multiple images within the dataset, effectively increasing the image count available for training the machine learning model utilized in this study.
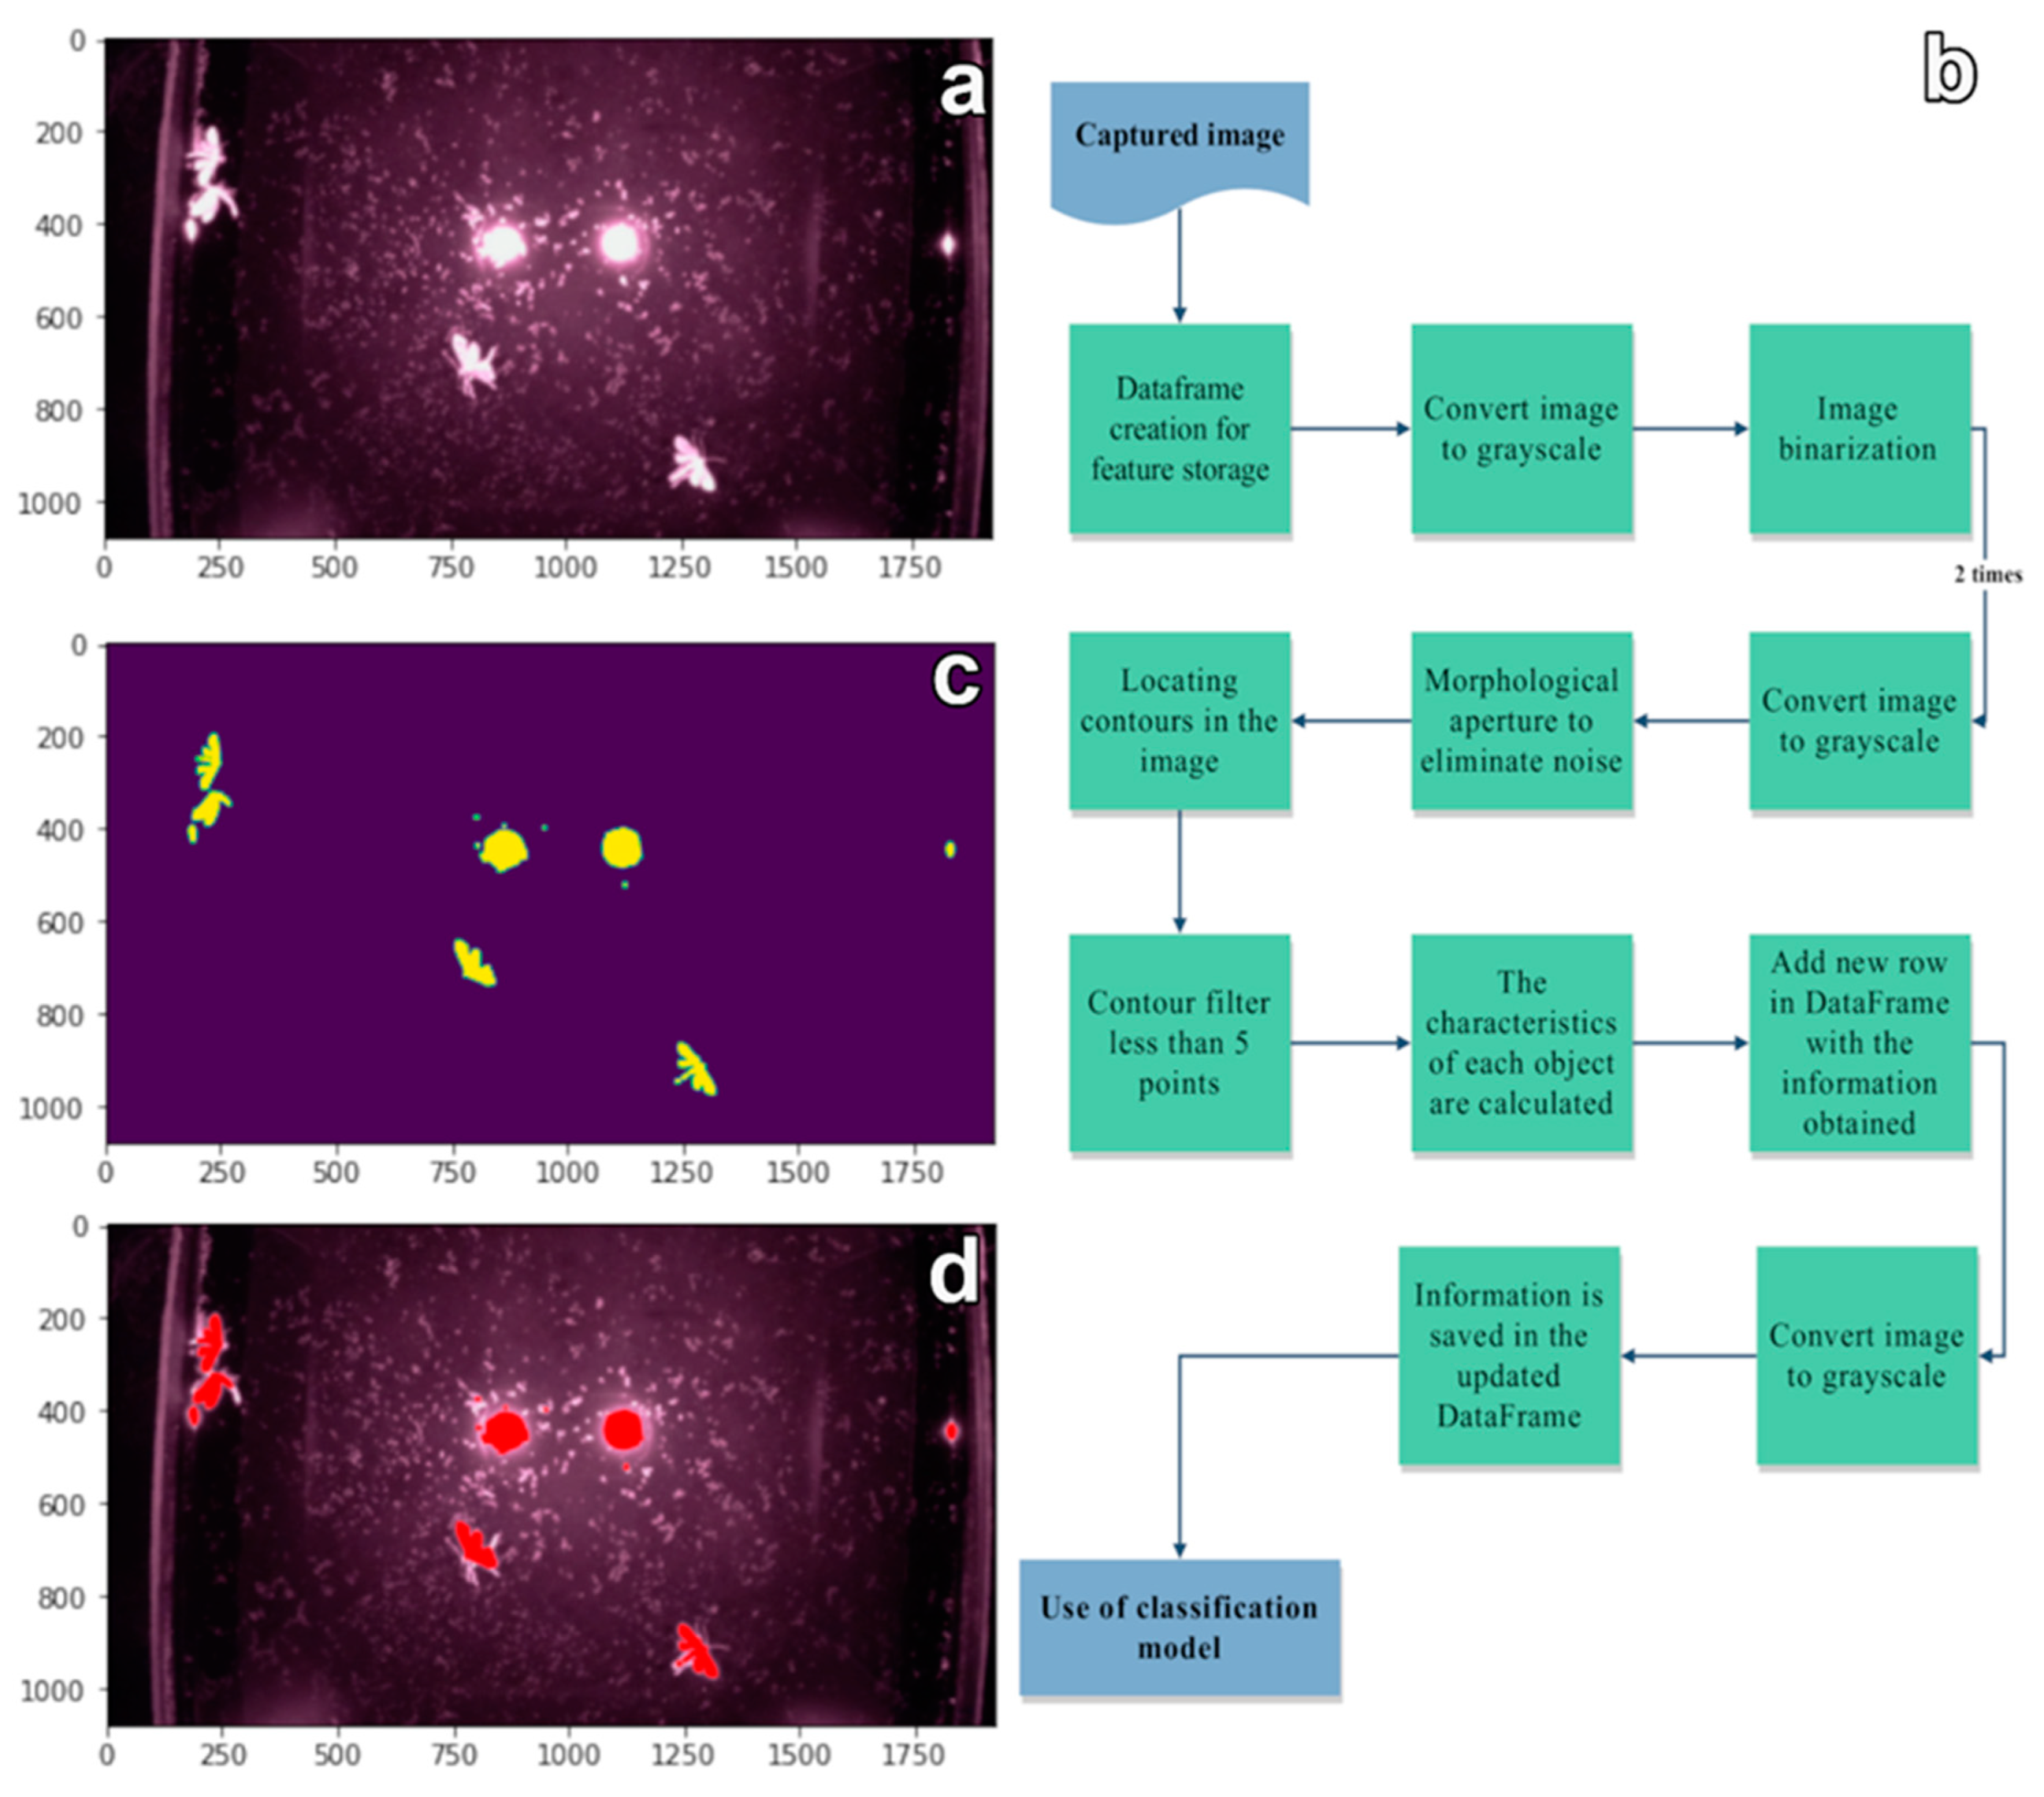
Subsequently, image segmentation techniques (Figure 3) were applied to each image to isolate D. fovealis from background objects. Following successful insect identification, morphometric features of each individual within the images were extracted. These features included area, perimeter, major and minor axis lengths, eccentricity, fitted ellipse parameters, centroids, and contour moments. The same procedure was employed to capture morphometric data for objects unidentified as D. fovealis objects. All extracted object features were then stored in a text file for subsequent use as training data.

2.5. Training and Validation of the D. fovealis Detection Model

To classify objects within the images, two distinct classes were established: insects and non-insects. Subsequently, a decision tree algorithm was implemented for object classification. Hyperparameter optimization was performed to identify the parameters that most significantly influenced model accuracy. The optimized hyperparameters included tree depth and the minimum number of samples per node. The resulting model, designated "Antormelo," was trained using 70% of the available data, while the remaining 30% was reserved for validation purposes. Model evaluation was based on three metrics: accuracy, Gini impurity, and decrease in Sahannon entropy (information gain).
Accuracy % = TP + TN TP + TN + FP + FN × 100 %
where: TP = D. fovealis, TN = other objects, FP = false positive and FN = false negative.
Gini = 1 i = 1 n   ( p i 2 )
here: n = number of classes in the node and pi = proportion of samples belonging to the node class.
Gain A = H S H ( S A )  
where: H(S) = entropy of data before division and H(S∣A) = conditional entropy after dividing it using attribute A.
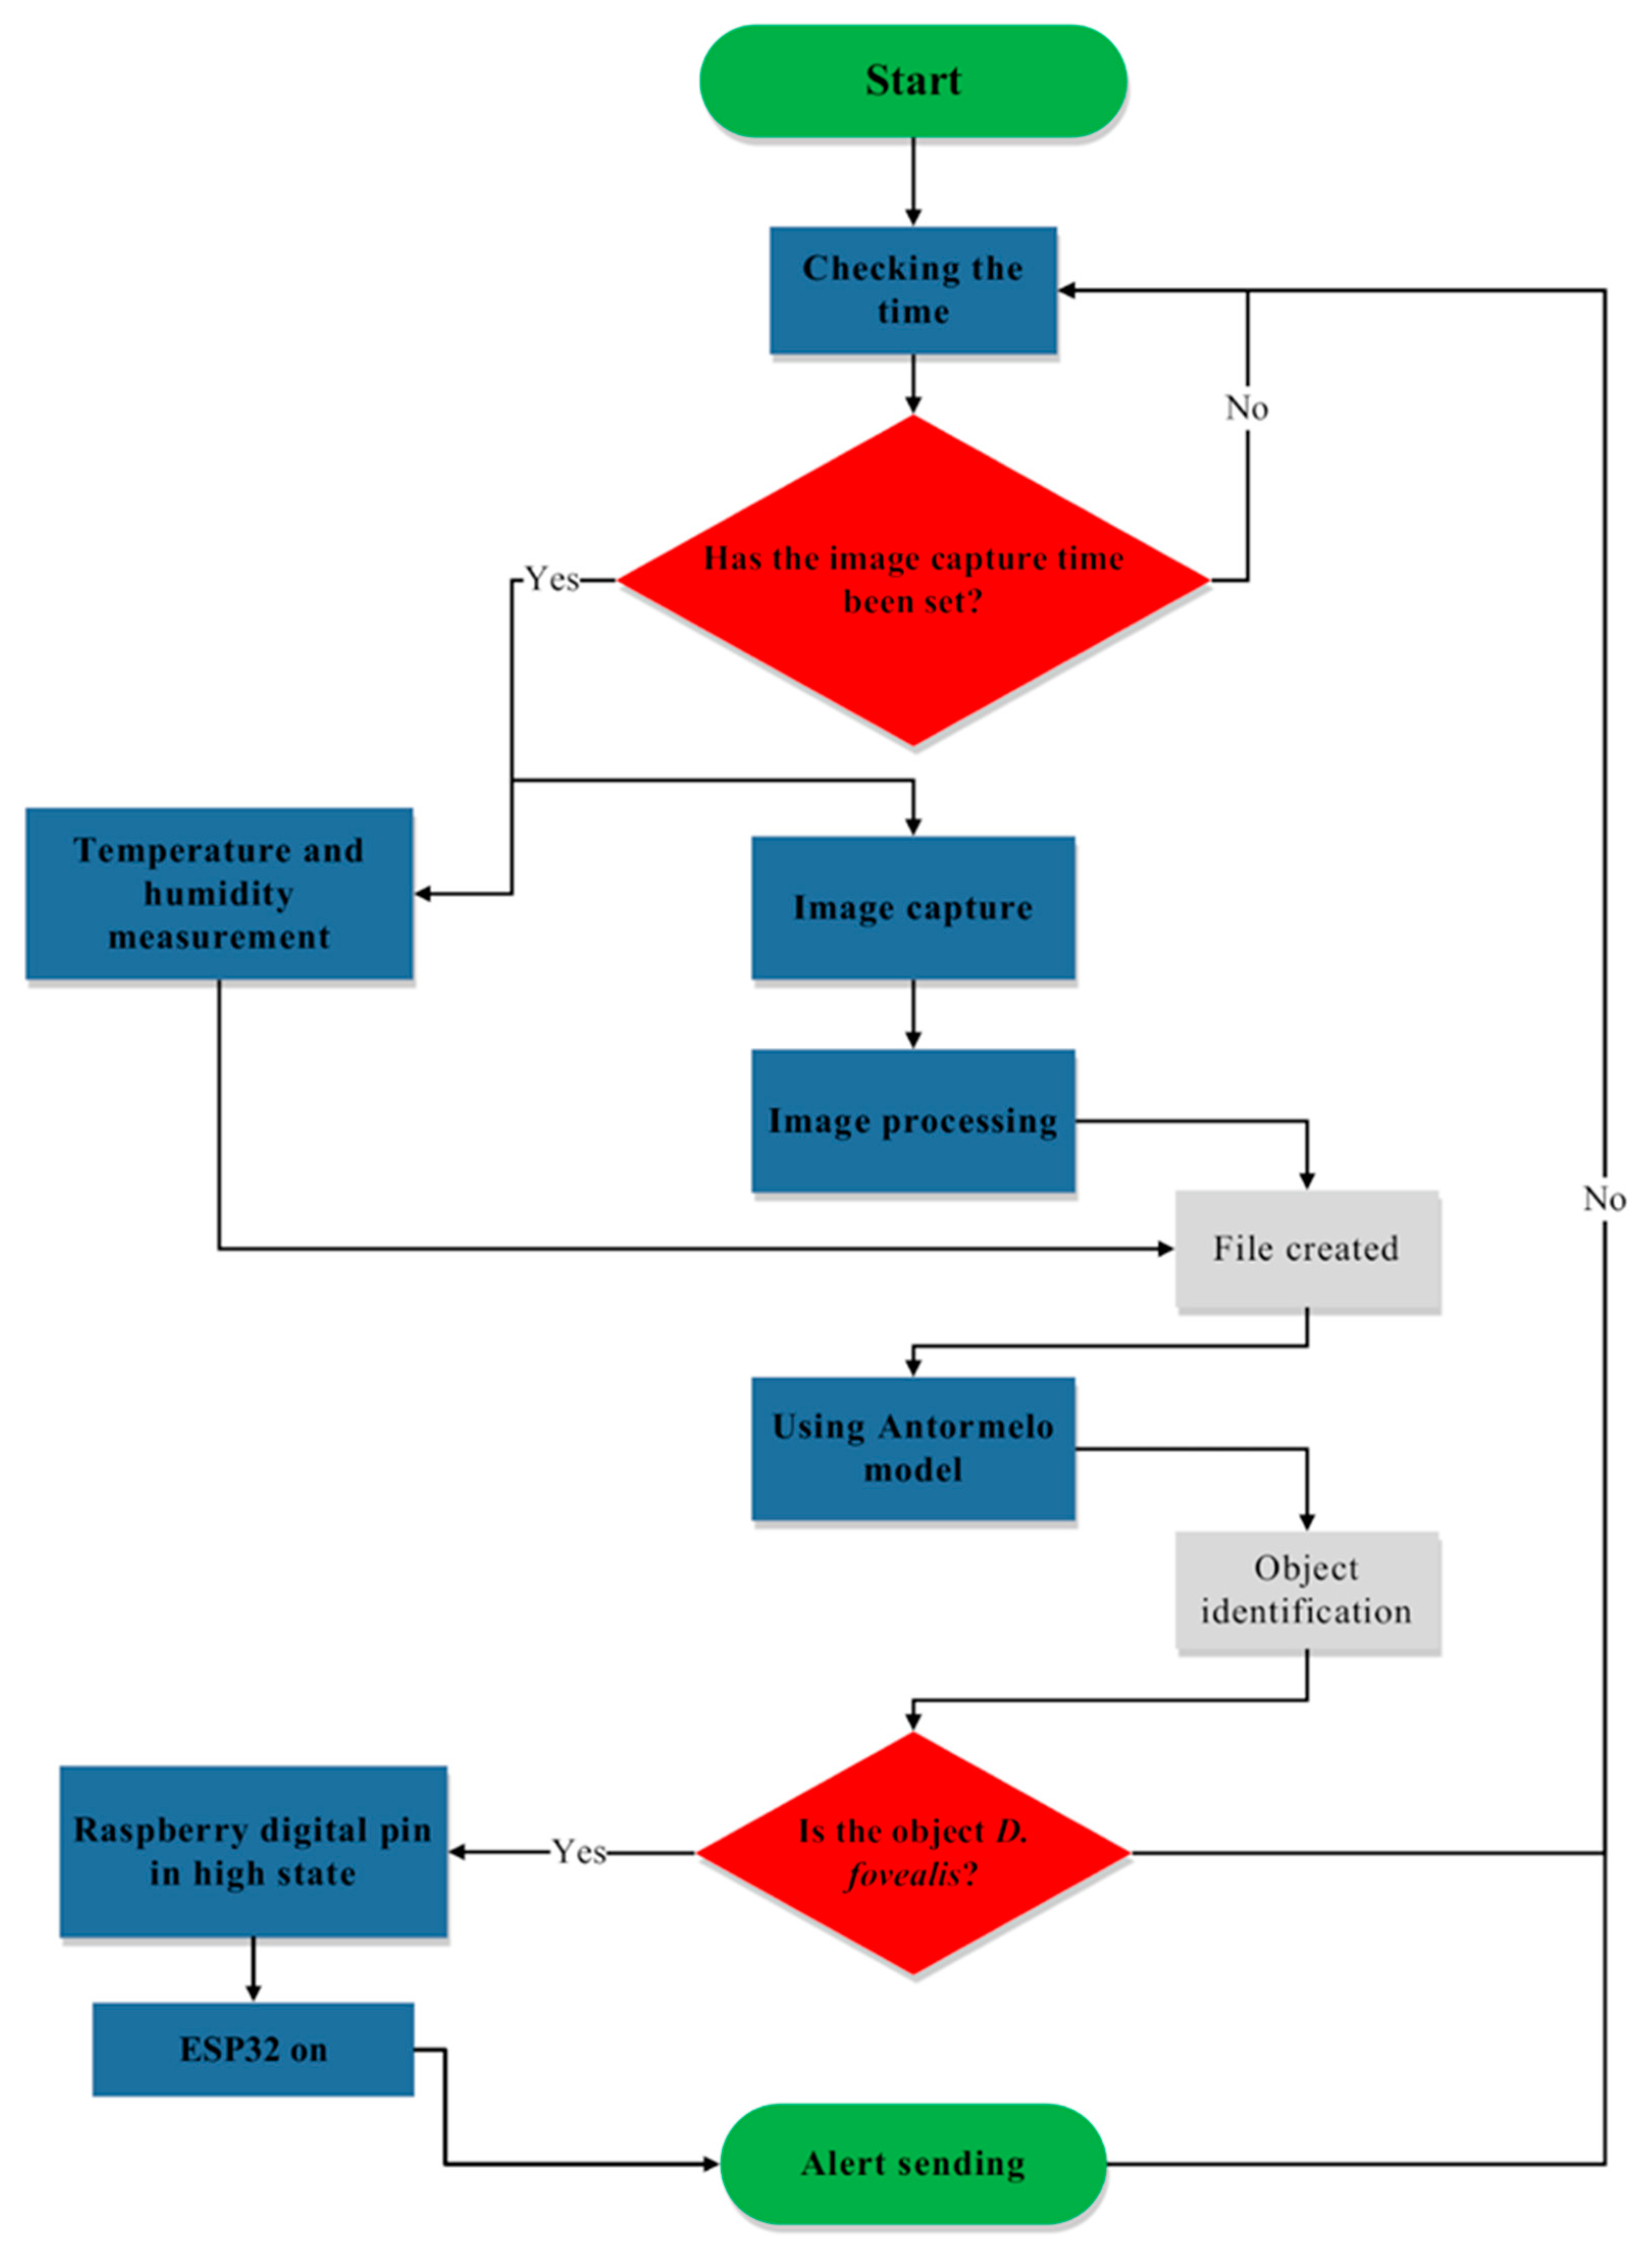
Upon successful validation of the Antormelo model, an algorithm was developed and implemented on the Raspberry Pi 4B© controller. This algorithm triggered the camera to capture images of the trap’s immobilization area at 60-min intervals (Figure 4).

2.6. Design of the Trap Operation Control Algorithm and Field Tests

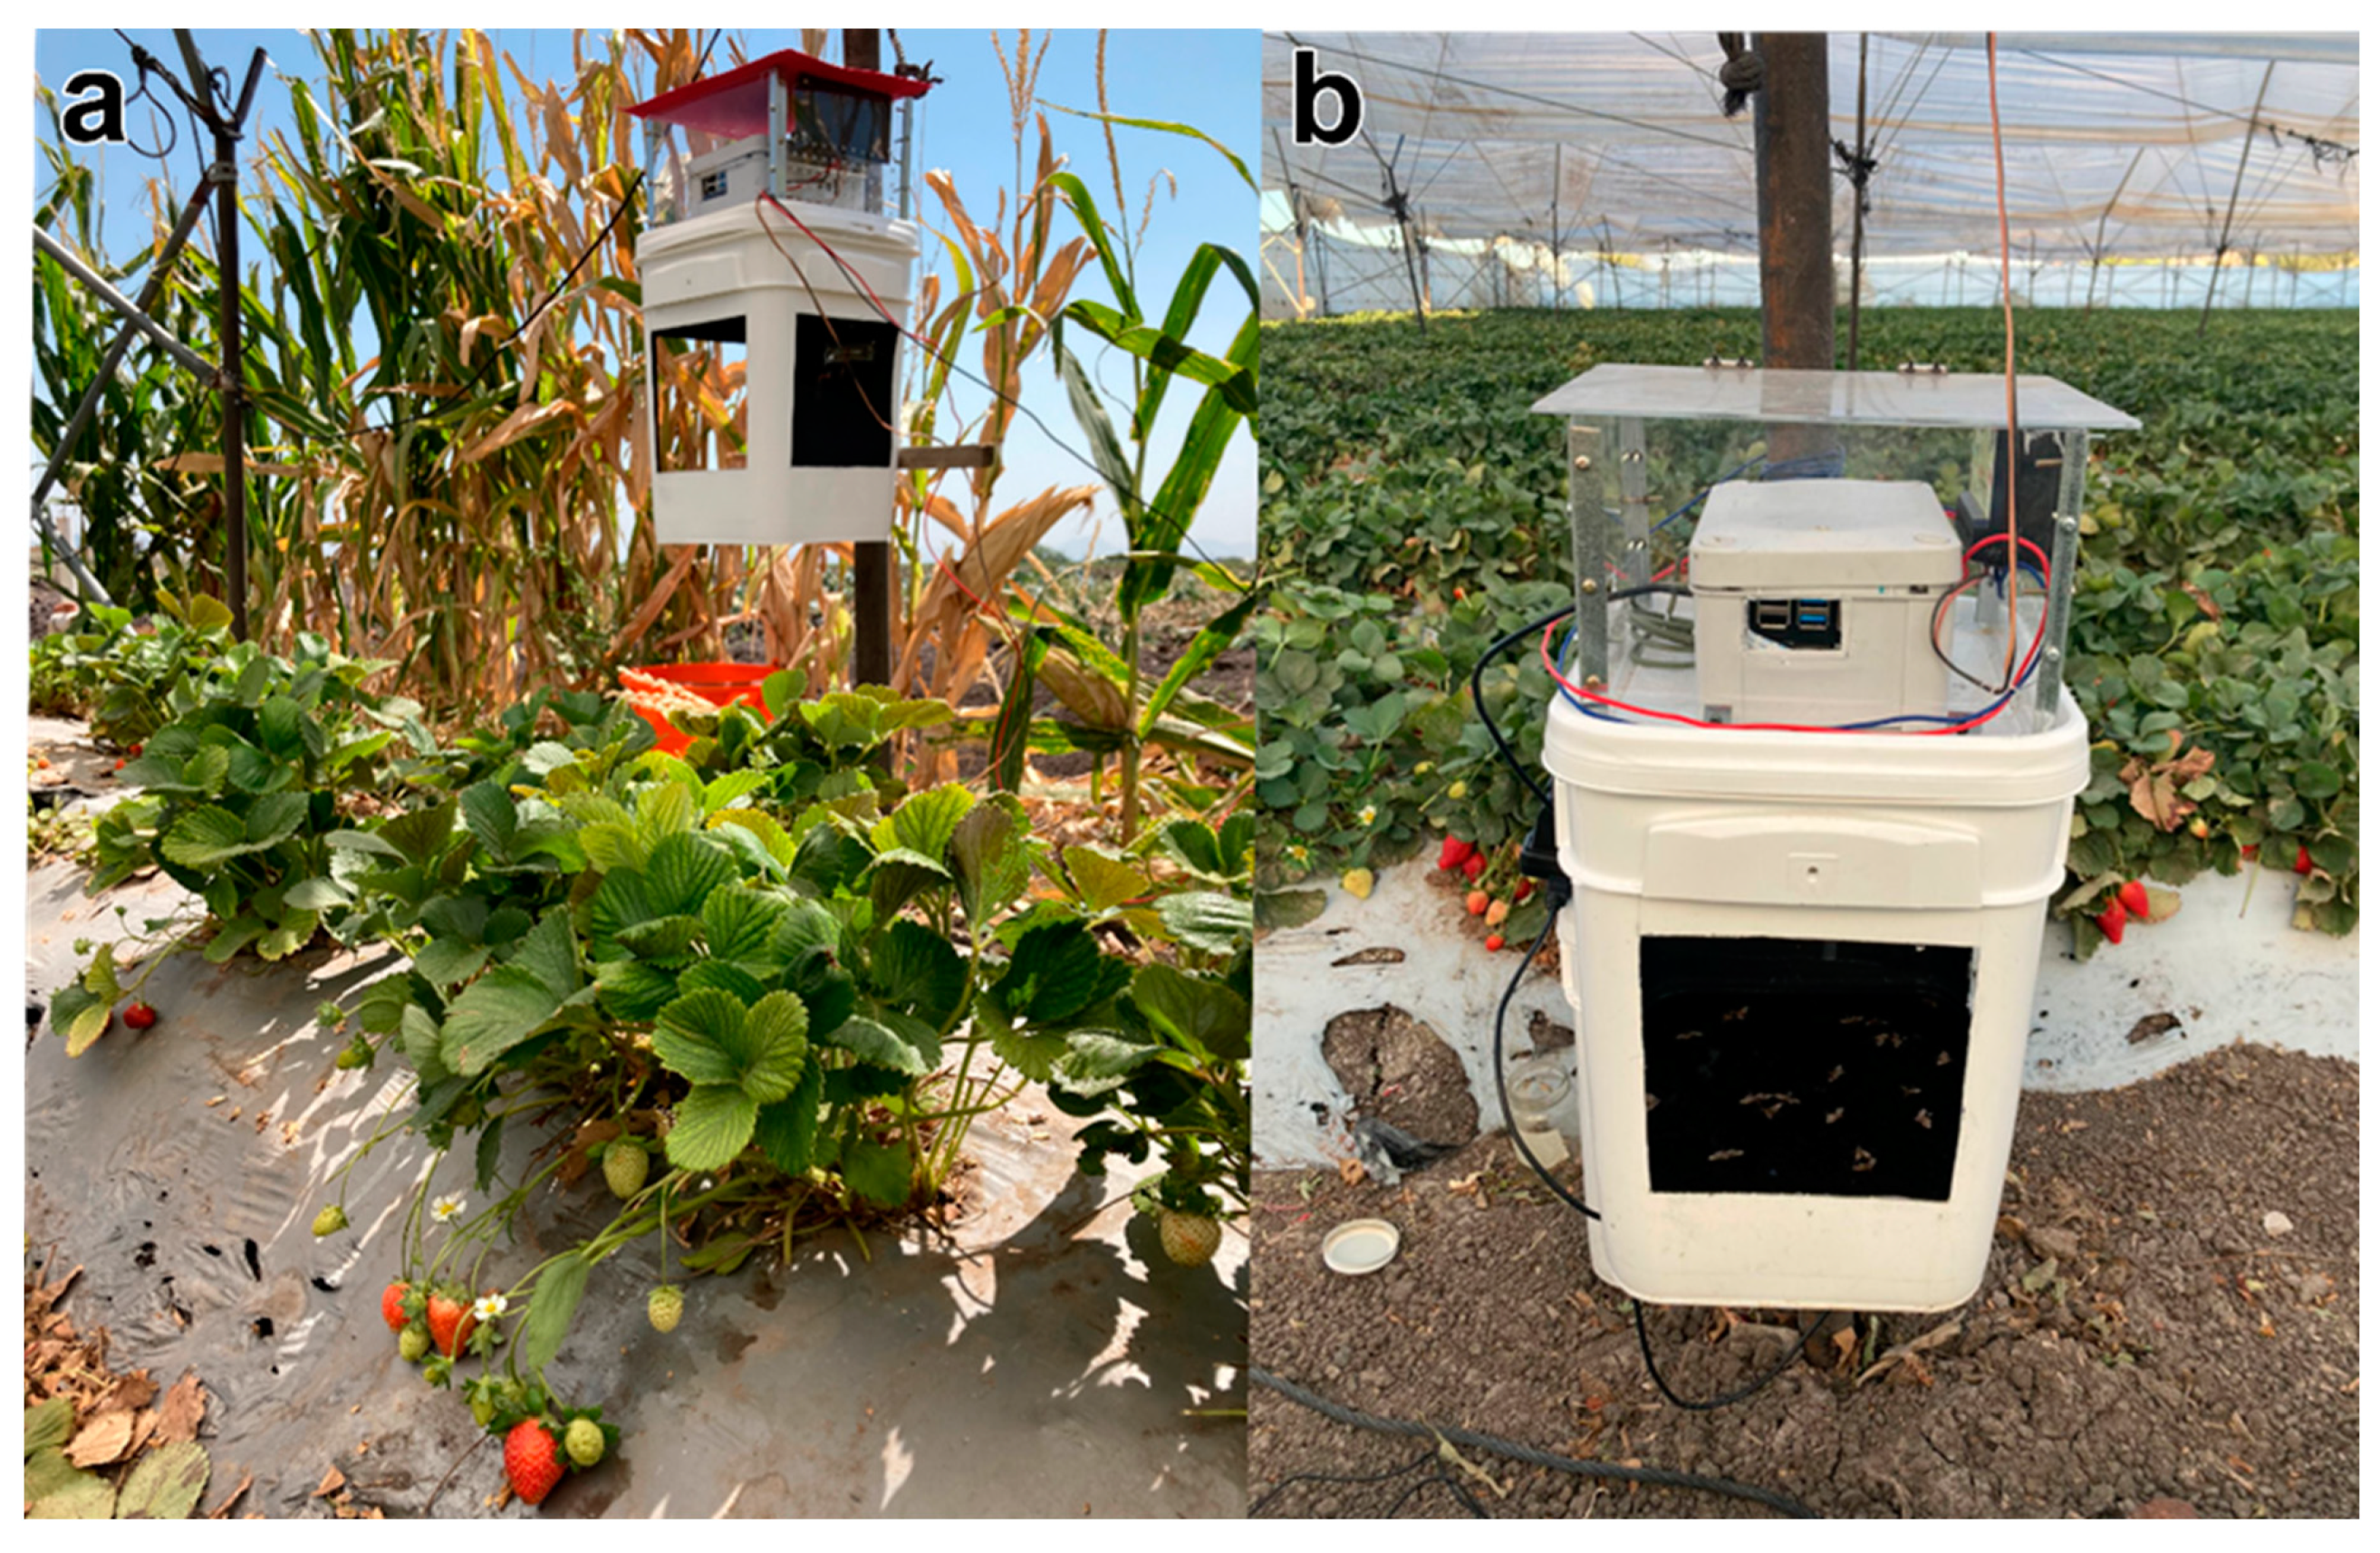
The prototype was installed within a previously identified strawberry plantation (Figure 5a). The trap and panel were affixed to the supports of the macrotunnel. The trap was filled with water supplemented with 1 mL of TWEEN 20. Subsequently, a synthetic sex pheromone lure was deployed within the trap, secured to a rubber septum fixed 5 cm above the water level. The system was activated on 2 March, 2024 at 2:00 PM and remained operational under field conditions for three days, capturing a total of 75 images. Upon image capture by the trap-mounted camera, the model detecting between one and ten insects triggered a designated digital pin on the Raspberry Pi 4B©. This activation signaled the ESP32, which subsequently transmitted an alert message to a designated phone number. To validate these results, manual insect counts were conducted throughout the testing period (Figure 5b) and the data recorded.

3. Results and Discussion

3.1. Insect Detection Model

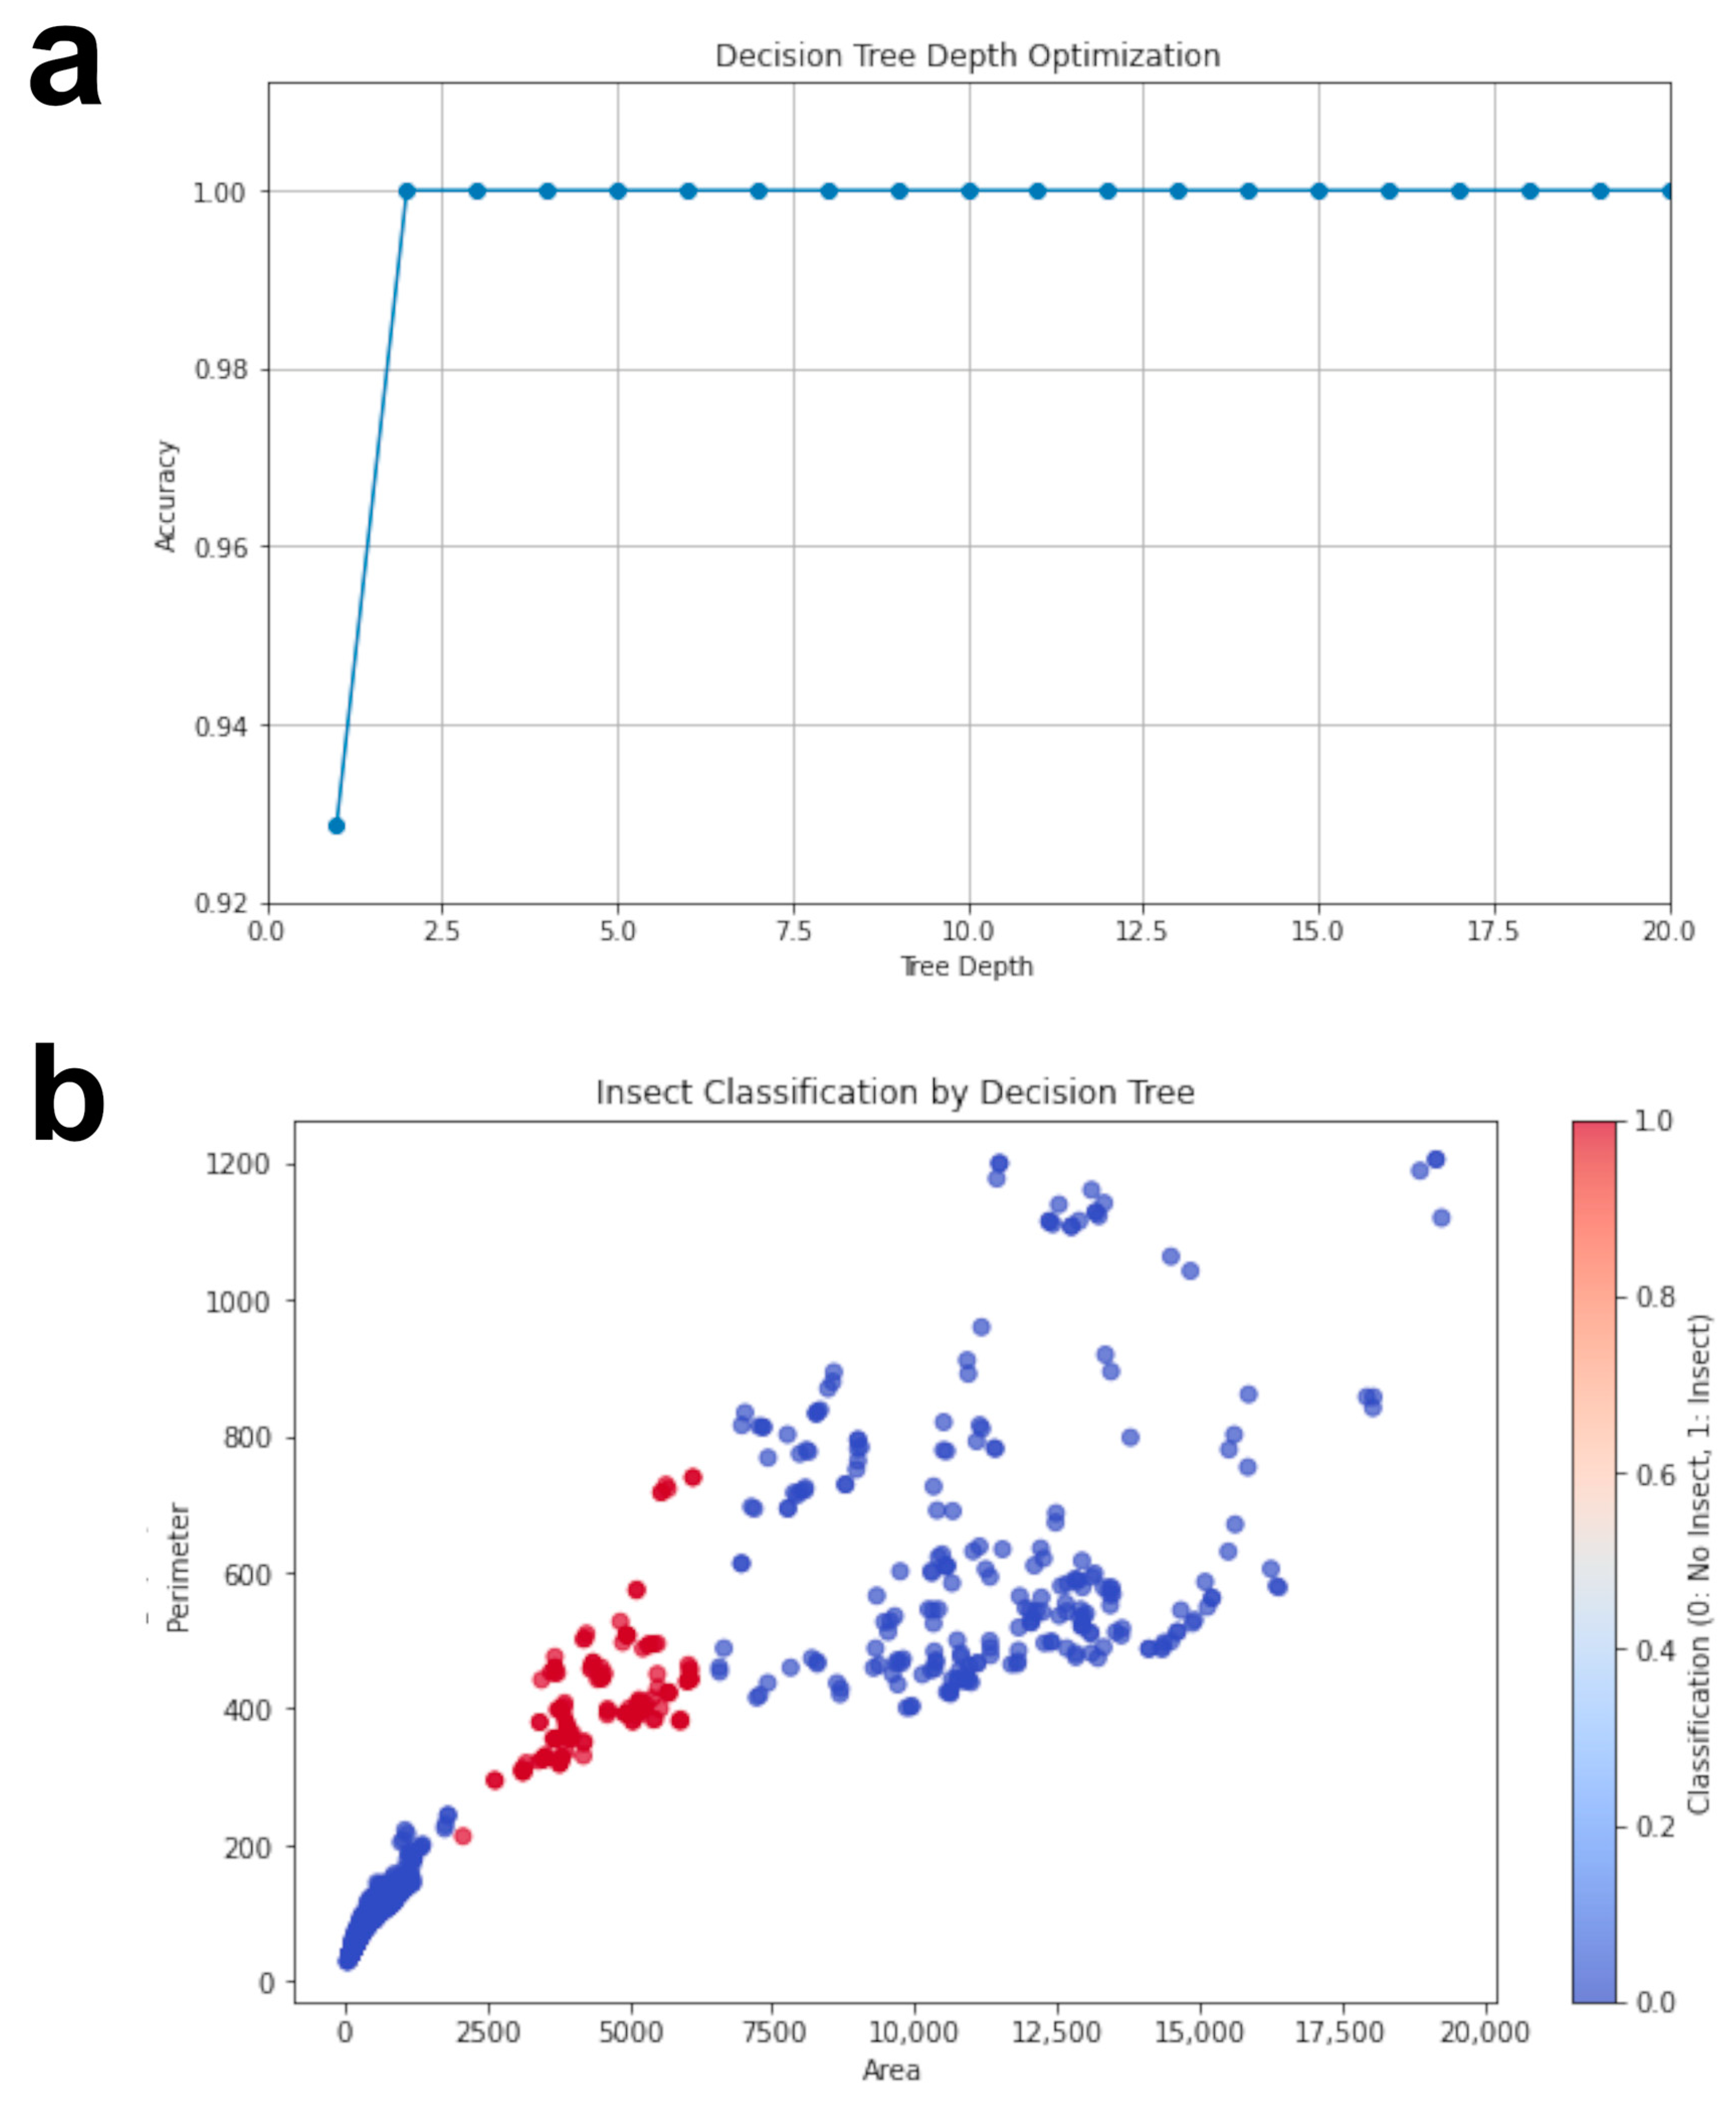
The hyperparameter that yielded the highest accuracy was tree depth (Figure 6a), with the Gini index employed as the class separation criterion. Villano [22] advocated for this division criterion as an individual measure of inequality in grouped data and a precise class indicator when developing classification methods. This preference stems from the Gini index’s ability to distinguish between two distributions with identical entropy measures [23], as it is more sensitive to disparities in the class composition of a dataset.
Tangirala [24] proposed that each node in a decision tree model aims to identify the attribute that best divides the dataset into pure subsets within that node. The Gini index determines the purity of a specific class after dividing it based on a particular attribute. In general terms, the Gini index quantifies the inequality among the values in the dataset. Within the classification model, this index enables the measurement of node impurity, which is a numerical measure of the homogeneity of the data set evaluated within each node.
An evaluation of the hyperparameter tree depth revealed an optimal value of 2 (Figure 6b). Additionally, the area of objects within the trap images emerged as the most effective input variable for classification (Figure 6b). Insect classifications were typically associated with an area between 2000 and 6300 pixels and a perimeter between 300 and 760 pixels, as determined from the infrared camera’s positioning. Bertsimas and Dunn [25] highlight the importance of selecting an optimal depth point to avoid overfitting in such models. When constructing decision trees, class imbalance is a common issue, necessitating pruning to reduce the number of classes and prevent overfitting [26]. A key advantage of this model is its compactness (optimal point 2), eliminating the need for pruning techniques.
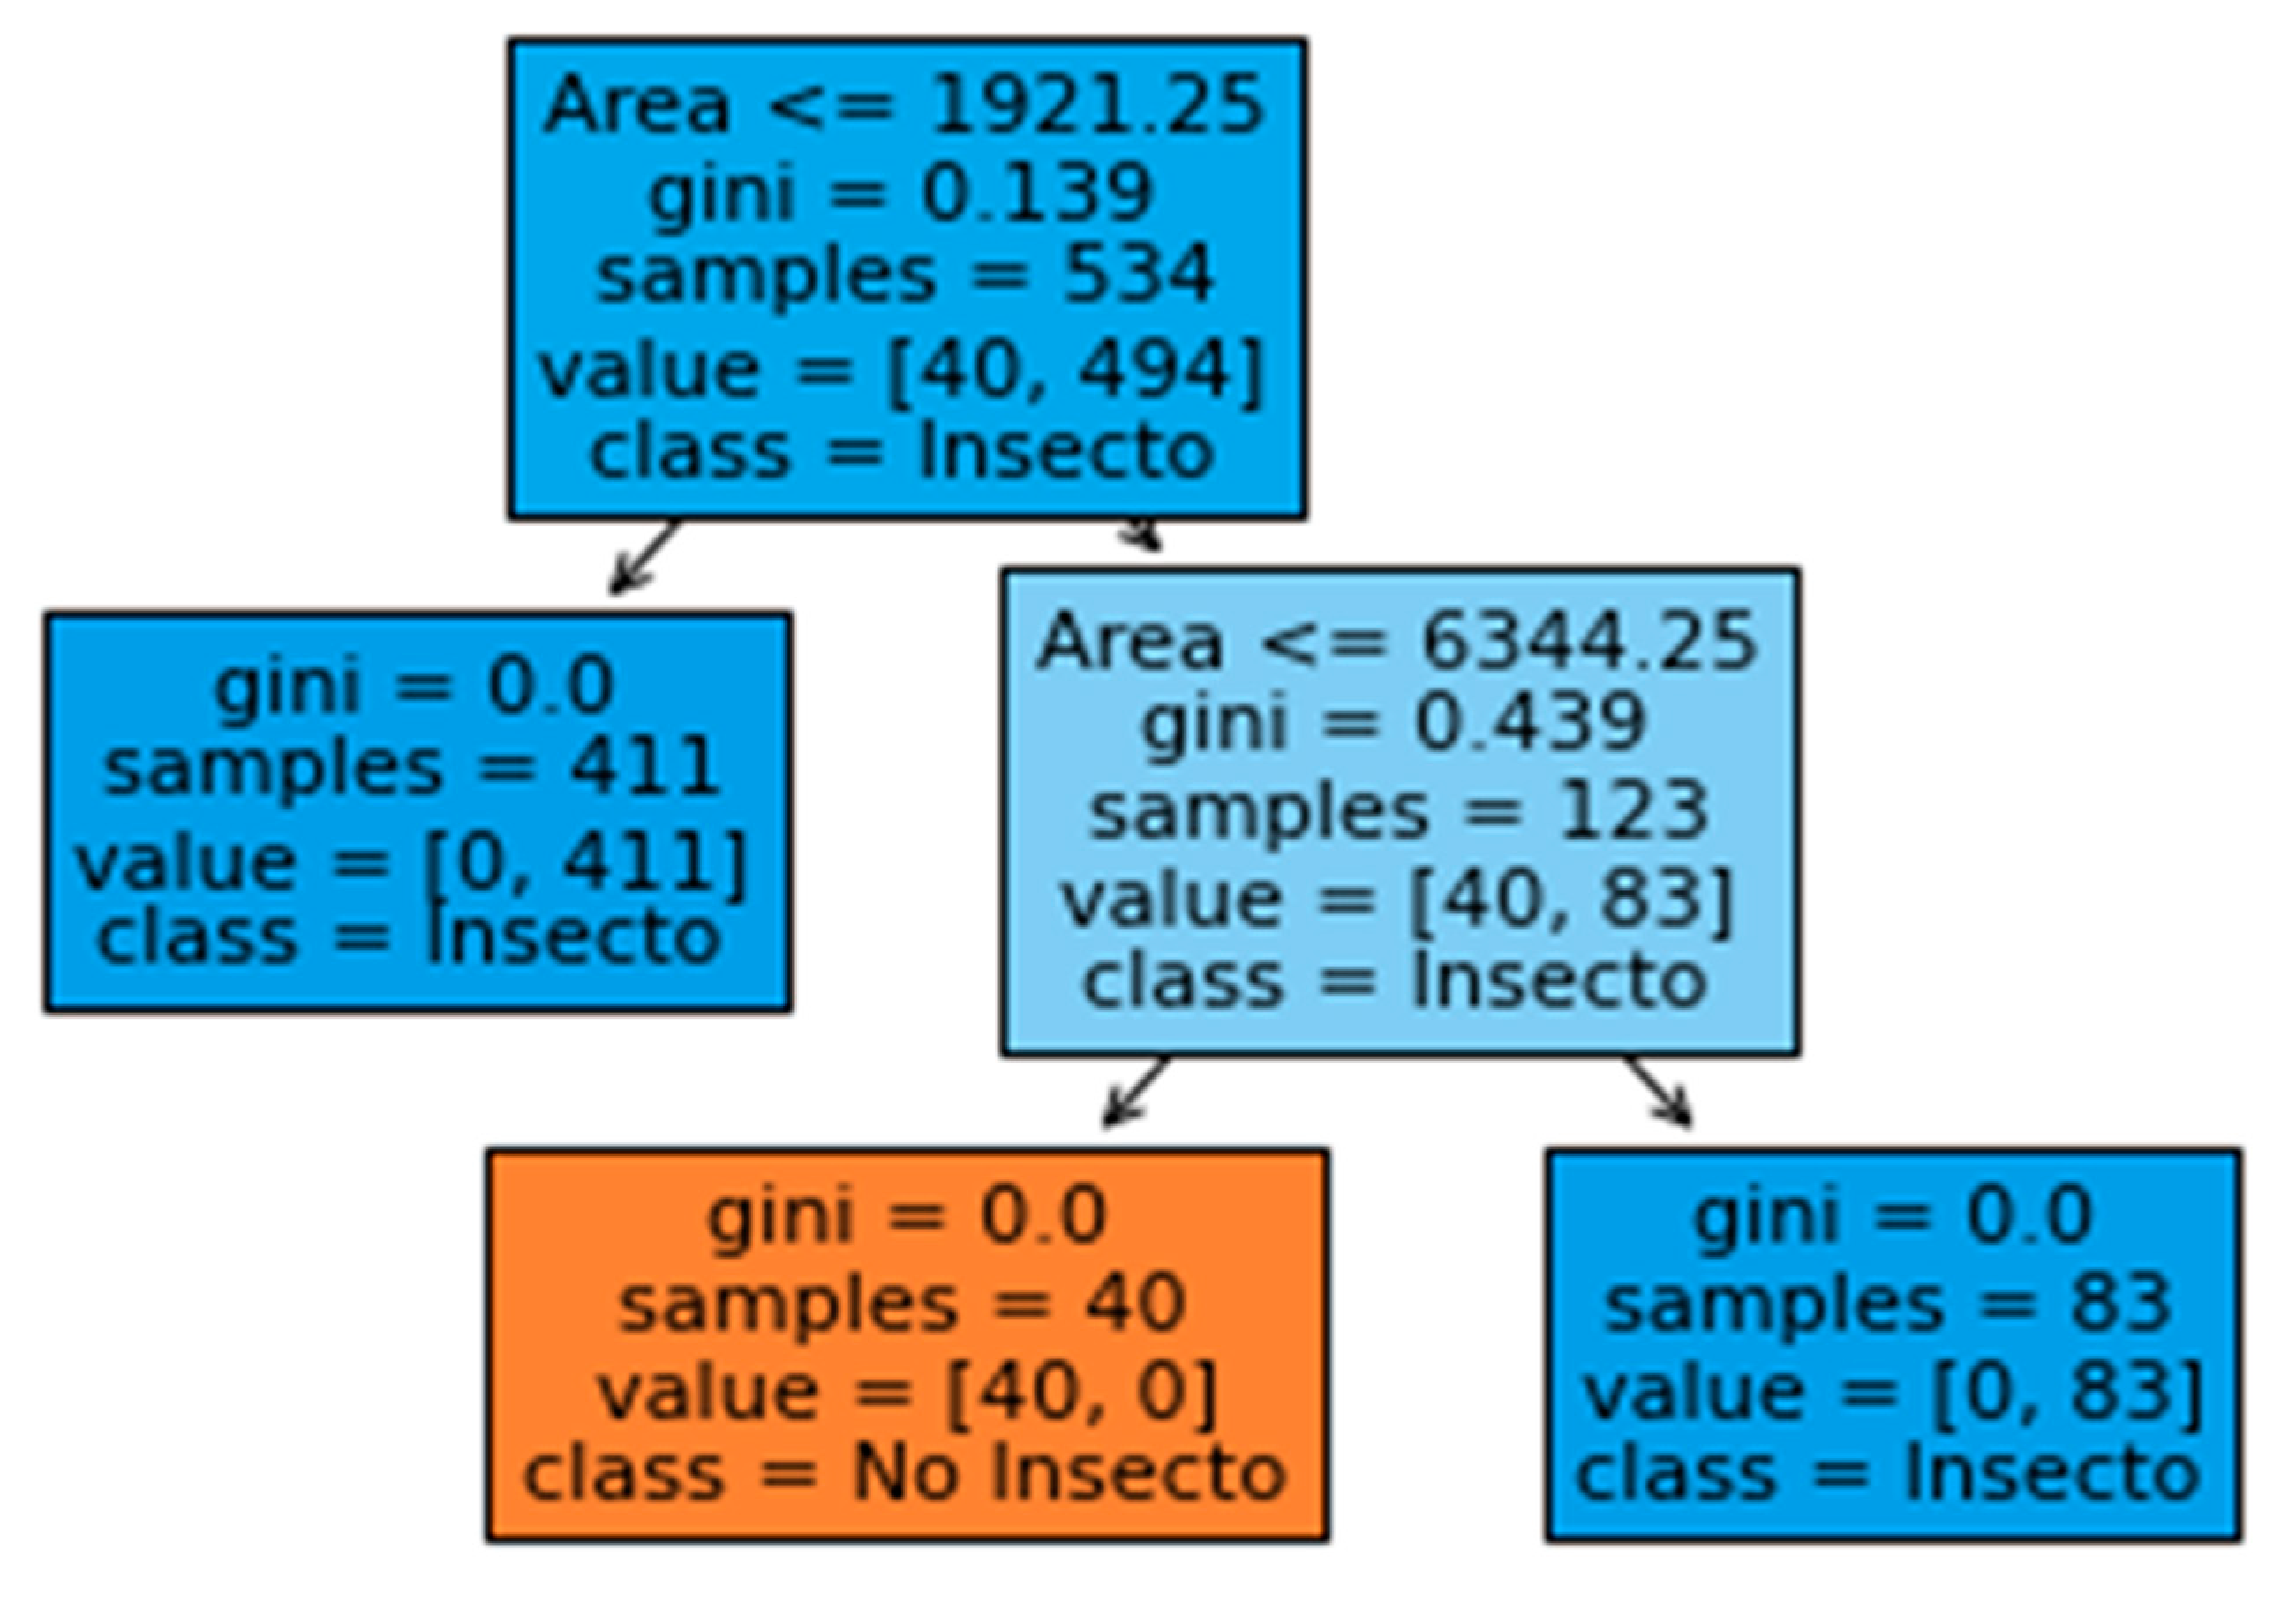
Within the present work, the area of objects (≤1921.25 pixels) present in the image correctly classified 411 of the 534 objects. The second decision node of the tree, employing an area value ≤ 6344.25 pixels as a classification criterion, enabled the classification of the remaining 83 objects (Figure 7). Our findings align with those of Günlük et al. [27], who demonstrated that decision trees require only a subset of characteristics as input information during decision-making. In this model, only the area characteristic was utilized for insect classification. The implemented detection algorithm achieved a 99% accuracy in classifying the target insect located at the bottom of the retention system in our prototype.
Xie et al. [28] emphasize that the key to robust classification lies in the selection of effective features for insect recognition at the class level. They achieved an accuracy of 70.5% by applying their model to the identification of 24 insect species. In contrast, Yasmin et al. [29] successfully obtained an accuracy of 84% for lepidopteran identification using geometric features and an artificial neural network model. Building on these efforts, Xia et al. [30] proposed an insect monitoring system using a deep learning algorithm based on a multi-layer convolutional neural network for multi-class insect classification, achieving an accuracy of 89.22% with their model. Albanese et al. [31] developed a method for detecting codling moths using an integrated electronic system based on a convolutional neural network model, in which they achieved an accuracy of 80.6%. Sütő [10] implemented a system for monitoring and counting the codling moth (Cydia pomonella) using a model of pre-trained deep classifiers—including convolutional and pooling layers—where he achieved an 82% accuracy in identifying the target insect. Finally, Kargar et al. [32] developed an image monitoring system to report the presence of the brown marmorated stink bug (Halyomorpha halys). Their proposed system utilizes deep neural networks, achieving a 90% accuracy in identifying this insect.
We can observe that the Antormelo model, compared to the aforementioned models, provides a higher classification accuracy due to its simplicity and high level of reliability. Its "white-box" nature allows for the identification of the variables that have the most significant influence on identifying the target insect, thereby enhancing interpretability and trust in the model’s decisions.
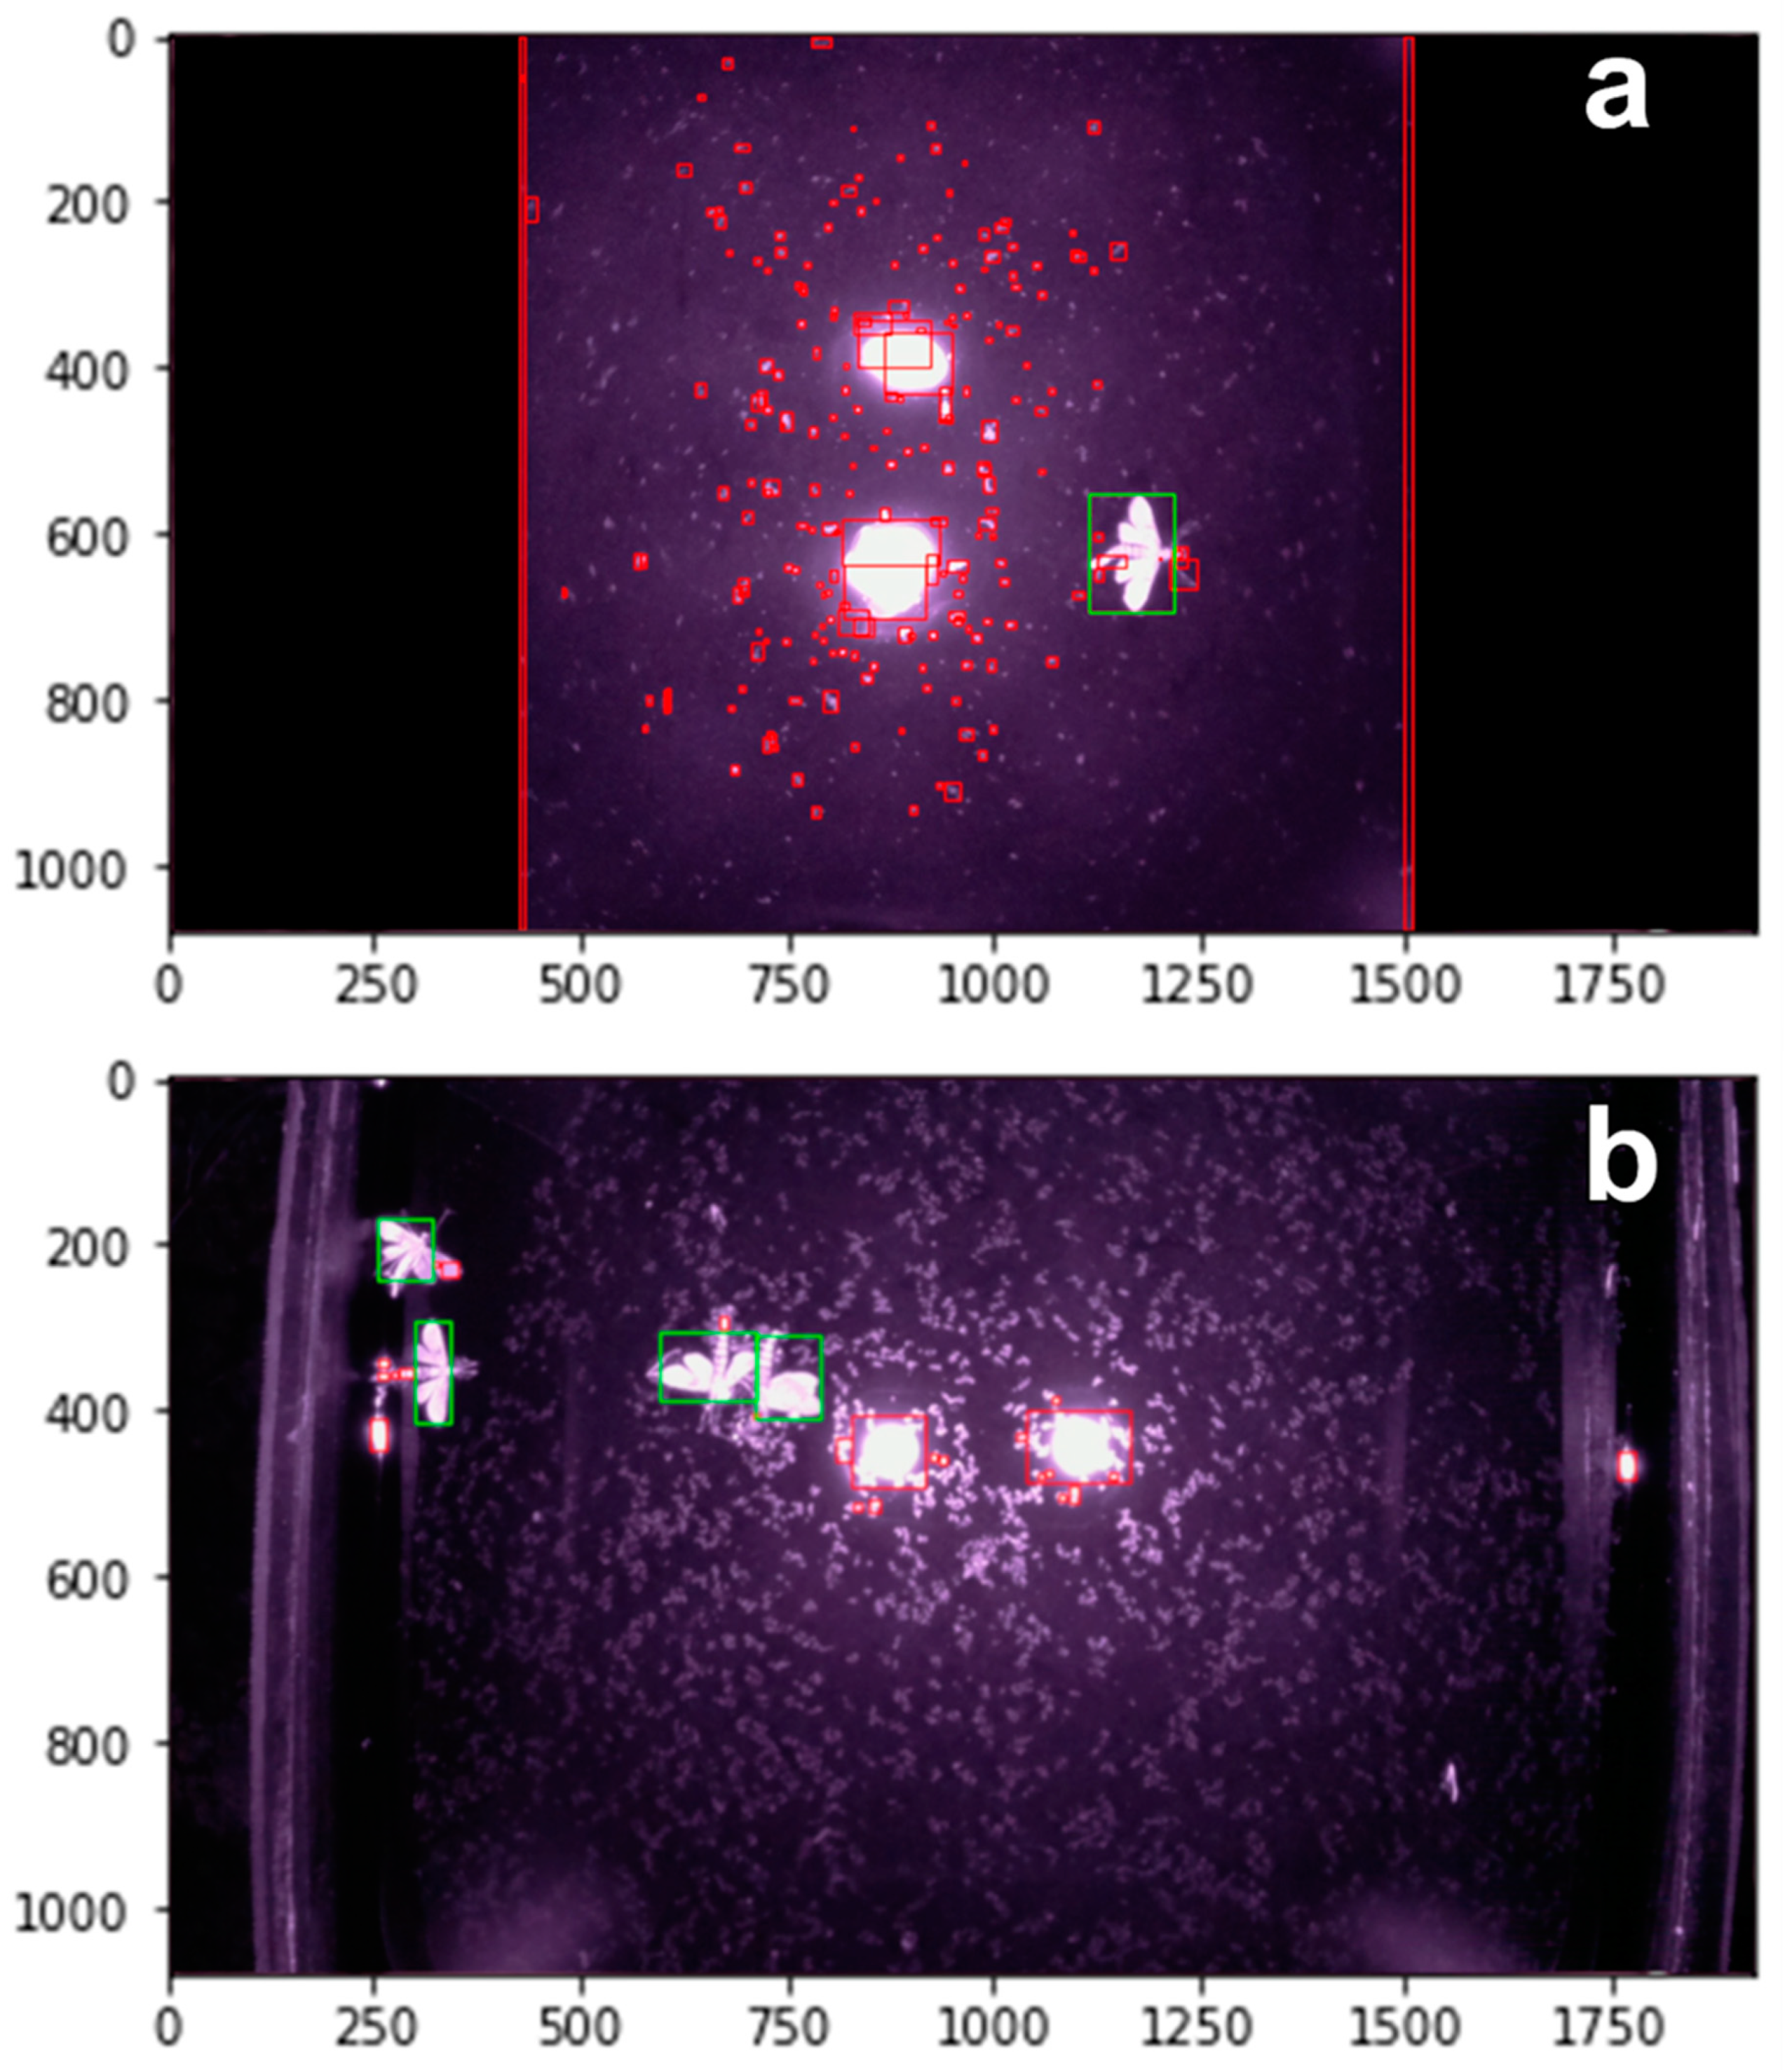
Validation images were processed through the Antormelo classification model. The model’s classification function outputs a data frame containing object classifications and their corresponding feature values. A visual representation of the model’s classification results was also generated (Figure 8). This figure depicts the regions classified as insects by the model, enclosed within bounding boxes. Green boxes identify objects classified as "insect," while red boxes indicate objects not belonging to this category. Figure 8a reveals a high number of detections by the program, primarily consisting of very small objects within the image. This translates to increased processing time for model classification. Consequently, these objects were filtered to generate tables containing objects with a lower probability of insect classification. This filtering process aimed to retain only the most promising objects based on the model’s evaluated features (Figure 8b).

3.2. Field Operation and Testing

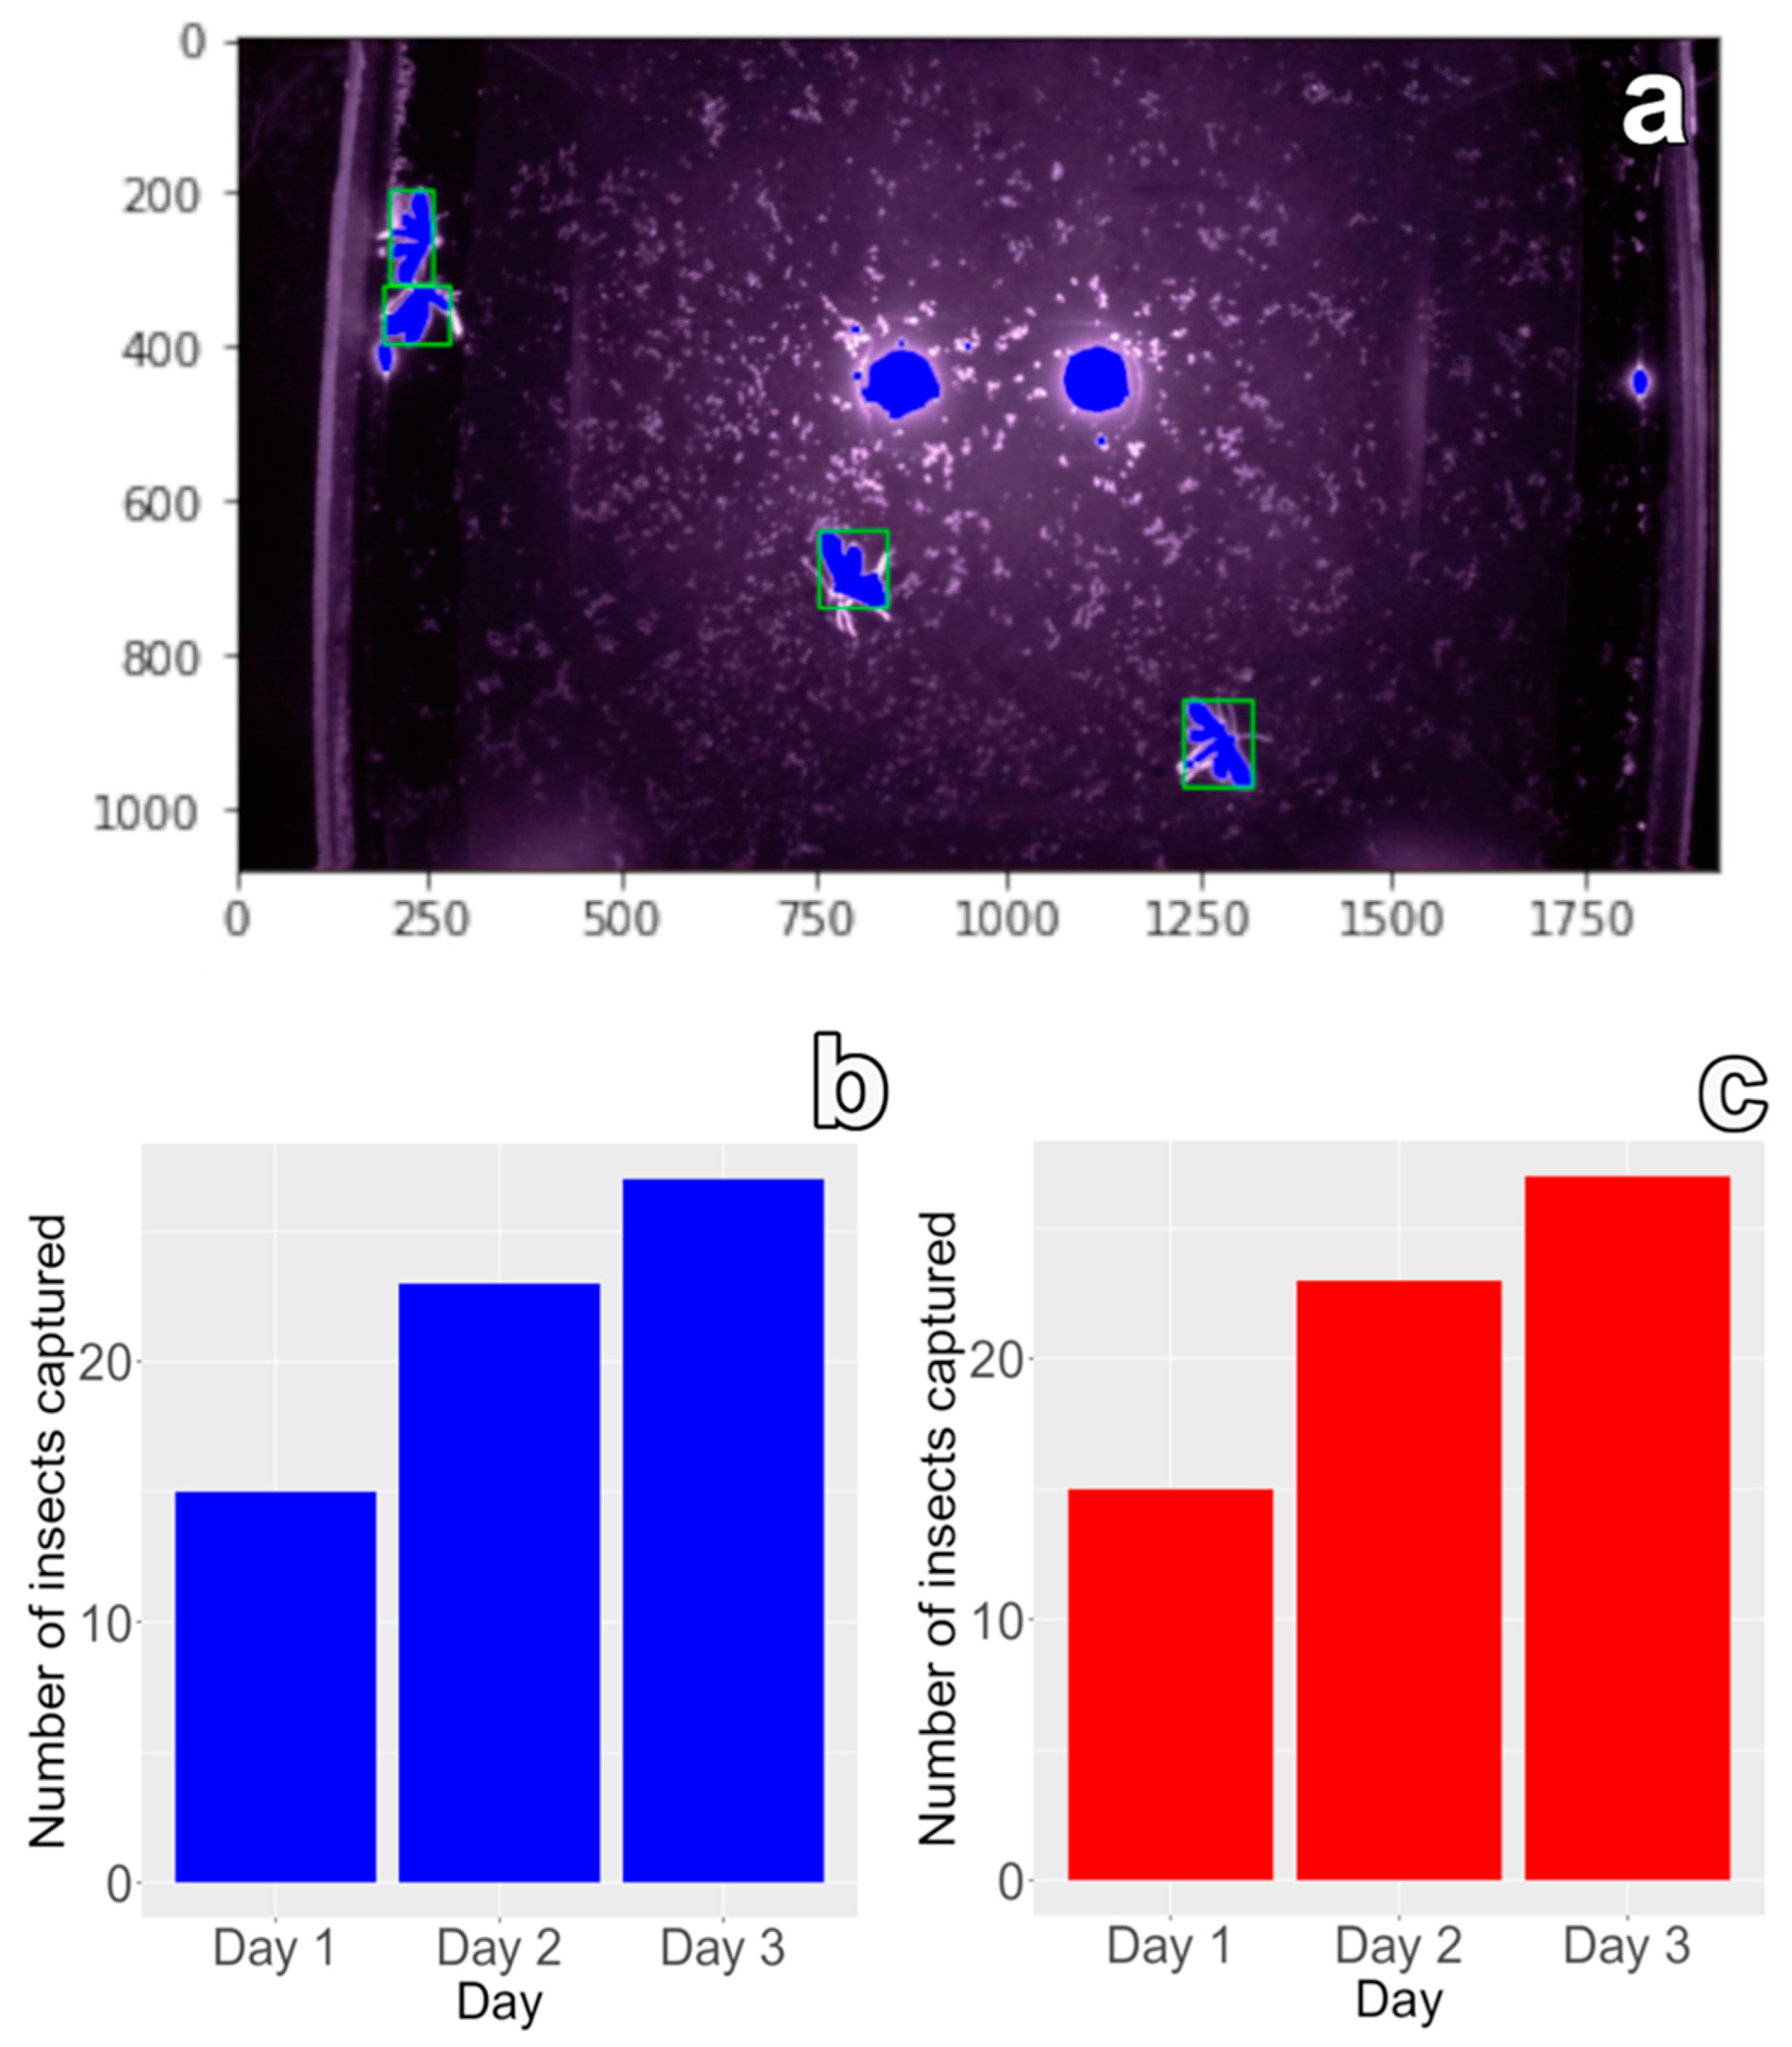
Upon deployment of the trap in the field, the Antormelo model enabled the classification of objects present in the successfully captured images. The model’s efficacy is visually demonstrated in Figure 9a, where objects identified as insects are delineated within bounding boxes. The number of insects detected by the model corresponded to the number of specimens captured by the trap during its deployment period (Figure 9b) and manual insect count to validate these results (Figure 9c).
The developed system demonstrates the capability for accurate field-based identification and quantification of D. fovealis within strawberry plantations. Notably, the model prioritizes processing speed by eliminating the need for image resizing, thus streamlining analysis. Upon image capture, the model performs insect identification and classification instantaneously. Kasinathan et al. [21] reported an average processing time of 14.5 min for pest detection systems in their work, highlighting the necessity of image resizing to achieve faster analysis. Conversely, the model implemented in this study achieved an image analysis time of only 1.25 s.
The verification of alert issuance activity was achieved through data recording as described previously. The absence of false alarms and the timely identification of target specimens were confirmed, demonstrating the effectiveness of the synthetic sex pheromone in creating a highly specific capture system. This characteristic aligns with the findings of Rigakis et al. [33], who attributed the reduced probability of false alarms to the pheromone’s specificity. The high accuracy observed is likely due to the high specificity of the pheromone, as evidenced by the lack of requirement for additional classes to differentiate target insects from other objects within the trap. Consequently, this model exhibits high precision with the chosen features, effectively determining the presence of the target insect from captured images.
Enhancing the efficiency and accuracy of pest insect monitoring remains a critical challenge. The integration of traditional monitoring systems employing synthetic sex pheromones with image analysis techniques has been demonstrated to provide more efficient pest insect monitoring, as supported by the findings of Preti et al. [34] and Flórián et al. [35]. This is exemplified by the high selectivity of objects achieved by the designed system, which stems from the synergistic effect of its components, resulting in high accuracy values with a computationally lightweight model (0.002068 MB).
A comparison of these results with existing studies reveals that the proposed model exhibits superior processing speed. Nanni et al. [36] reported a computational requirement of 2.4 GB for classifying one hundred images from the Deng (SMALL), IP102 large, and Xie2 (D0) pest datasets. Based on these findings, system optimization is anticipated, as a relatively powerful processor was employed in this research phase. Nevertheless, the results demonstrate the potential for utilizing a more cost-effective processor in future applications.

4. Conclusions

The present study focuses on the automated monitoring of EPM, a pest of significant economic importance in strawberry plantations. The developed system enables pest count estimation based on recorded captures detecting the first individual or exceeding a predetermined capture threshold. The proposed automatic trap generates alerts and leverages the high specificity of synthetic sex pheromones to prevent non-target insect interference and facilitate image processing, ensuring precise information acquisition. Validation testing of the D. fovealis automatic counting algorithm yielded high accuracy.
Due to its simple structure and efficient data processing, the developed model is easy to implement and operate. It doesn’t require complex computations or extensive resources, making it suitable for deployment on low-power devices such as inexpensive microcontrollers, basic embedded systems, or other hardware with limited processing power and memory.

Author Contributions

Conceptualization, E.R.-V., A.R.-R. and F.M.L.-V.; methodology, E.R.-V. and F.M.L.-V.; software, F.M.L.-V. and E.R.-V.; validation, F.M.L.-V., A.R.-R. and E.R.-V.; formal analysis, E.R.-V.; investigation, C.P.I.-R., A.H.-J. and E.R.-V.; resources, C.P.I.-R. and A.H.-J.; data curation, F.M.L.-V., A.R.-R. and E.R.-V.; writing—original draft preparation, E.R.-V. and F.M.L.-V.; writing—review and editing, C.P.I.-R., F.M.L.-V., A.H.-J. and A.R.-R.; visualization, A.R.-R. and C.P.I.-R.; supervision, F.M.L.-V., C.P.I.-R. and A.H.-J.; project administration, E.R.-V., C.P.I.-R. and A.H.-J.; funding acquisition, C.P.I.-R. and A.H.-J. All authors have read and agreed to the published version of the manuscript.

Funding

This research received no external funding.

Data Availability Statement

The data supporting the conclusions of this article will be made available by the authors on request.

Acknowledgments

We are grateful to the Consejo Nacional de Humanidades Ciencias y Tecnologías (CONAHCYT), for the doctoral scholarship awarded to the first author. To the Centro de Investigación en Química Aplicada for financing through internal project 6706 and to the Universidad Autónoma Agraria Antonio Narro for financing through project 436. We would like to thank Samuel Pineda-Guillermo and Luis Jesús Palma-Castillo for providing specimens of D. fovealis and Juan Soria Morales for his support in locating sites for the experiments.

Conflicts of Interest

The authors declare no conflicts of interest.

References

  1. Li, D.; Song, Z.; Quan, C.; Xu, X.; Liu, C. Recent advances in image fusion technology in agriculture. Comput. Electron. Agric. 2021, 191, 106491. [Google Scholar] [CrossRef]
  2. Rustia, D.J.A.; Lin, C.E.; Chung, J.Y.; Zhuang, Y.J.; Hsu, J.C.; Lin, T.T. Application of an image and environmental sensor network for automated greenhouse insect pest monitoring. J. Asia Pac. Entomol. 2020, 23, 17–28. [Google Scholar] [CrossRef]
  3. Barrera, J.F.; Montoya, P.; Rojas, J. Bases para la Aplicación De Sistemas De Trampas Y Atrayentes En Manejo Integrado De Plagas. In Simposio de Trampas y Atrayentes en Detección, Monitoreo y Control de Plagas de Importancia Económica; Barrera, J.F., Montoya, P., Eds.; Sociedad Mexicana de Entomología y el Colegio de la Frontera Sur: Manzanillo, Colima, Mexico, 2006; pp. 1–16. Available online: https://www.researchgate.net/publication/237736490 (accessed on 13 March 2024).
  4. Dent, D.; Binks, R.H. Insect Pest Management; CABI Digital Library: Iver, UK, 2020; pp. 12–38. [Google Scholar]
  5. Yen, A.L.; Madge, D.G.; Berry, N.A.; Yen, J.D.L. Evaluating the effectiveness of five sampling methods for detection of the tomato potato psyllid, Bactericera cockerelli (Šulc) (Hemiptera: Psylloidea: Triozidae). Aust. J. Entomol. 2013, 52, 168–174. [Google Scholar] [CrossRef]
  6. Espinoza, K.; Valera, D.L.; Torres, J.A.; López, A.; Molina-Aiz, F.D. Combination of image processing and artificial neural networks as a novel approach for the identification of Bemisia tabaci and Frankliniella occidentalis on sticky traps in greenhouse agriculture. Comput. Electron. Agric. 2016, 127, 495–505. [Google Scholar] [CrossRef]
  7. Rustia, D.J.A.; Lin, T.T. An IoT-based wireless imaging and sensor node system for remote greenhouse pest monitoring. Chem. Eng. Trans. 2017, 58, 601–606. [Google Scholar] [CrossRef]
  8. Bashir, M.; Alvi, A.M.; Naz, H. Effectiveness of sticky traps in monitoring of insects. J. Agric. Food Environ. Sci. 2014, 1, 1–2. [Google Scholar]
  9. Devi, M.S.; Roy, K. Comparable study on different coloured sticky traps for catching of onion thrips, Thrips tabaci Lindeman. J. Entomol. Zool. Stud. 2017, 5, 669–671. [Google Scholar]
  10. Sütő, J. Embedded system-based sticky paper trap with deep learning-based insect-counting algorithm. Electronics 2021, 10, 1754. [Google Scholar] [CrossRef]
  11. Zhong, Y.; Gao, J.; Lei, Q.; Zhou, Y. A vision-based counting and recognition system for flying insects in intelligent agriculture. Sensors 2018, 18, 1489. [Google Scholar] [CrossRef]
  12. Tian, H.; Wang, T.; Liu, Y.; Qiao, X.; Li, Y. Computer vision technology in agricultural automation—A review. Inf. Process. Agric. China Agric. Univ. 2020, 7, 1–19. [Google Scholar] [CrossRef]
  13. Barbedo, J.G.A. Detecting and Classifying Pests in Crops Using Proximal Images and Machine Learning: A Review. AI 2020, 1, 312–328. [Google Scholar] [CrossRef]
  14. Qiao, M.; Lim, J.; Ji, C.W.; Chung, B.K.; Kim, H.Y.; Uhm, K.B.; Myung, C.S.; Cho, J.; Chon, T.S. Density estimation of Bemisia tabaci (Hemiptera: Aleyrodidae) in a greenhouse using sticky traps in conjunction with an image processing system. J. Asia-Pac. Entomol. 2008, 11, 25–29. [Google Scholar] [CrossRef]
  15. Liu, H.; Lee, S.H.; Chahl, J.S. A review of recent sensing technologies to detect invertebrates on crops. Precis. Agric. 2017, 18, 635–666. [Google Scholar] [CrossRef]
  16. Farooq, M.S.; Riaz, S.; Abid, A.; Umer, T.; Zikria, Y.B. Role of IoT technology in agriculture: A systematic literature review. Electronics 2020, 9, 319. [Google Scholar] [CrossRef]
  17. Lima, M.C.F.; Leandro, M.E.D.d.A.; Valero, C.; Coronel, L.C.P.; Bazzo, C.O.G. Automatic detection and monitoring of insect pests: A review. Agriculture 2020, 10, 161. [Google Scholar] [CrossRef]
  18. Čirjak, D.; Miklečić, I.; Lemić, D.; Kos, T.; Živković, I.P. Automatic Pest Monitoring Systems in Apple Production under Changing Climatic Conditions. Horticulturae 2022, 8, 520. [Google Scholar] [CrossRef]
  19. Solis-Sánchez, L.O.; Castañeda-Miranda, R.; García-Escalante, J.J.; Torres-Pacheco, I.; Guevara-González, R.G.; Castañeda-Miranda, C.L.; Alaniz-Lumbreras, P.D. Scale invariant feature approach for insect monitoring. Comput. Electron. Agric. 2011, 75, 92–99. [Google Scholar] [CrossRef]
  20. Rodríguez-Vázquez, E.; Pineda-Guillermo, S.; Hernández-Juárez, A.; Tejeda-Reyes, M.A.; López-Bautista, E.; Illescas-Riquelme, C.P. Sexual dimorphism, diagnosis and damage caused by Duponchelia fovealis (Lepidoptera: Crambidae). Rev. Soc. Entomol. Argent. 2023, 82, 13–20. [Google Scholar] [CrossRef]
  21. Kasinathan, T.; Singaraju, D.; Uyyala, S.R. Insect classification and detection in field crops using modern machine learning techniques. Inf. Process. Agric. 2021, 8, 446–457. [Google Scholar] [CrossRef]
  22. Villano, F.; Mauro, G.M.; Pedace, A. A Review on Machine/Deep Learning Techniques Applied to Building Energy Simu-lation, Optimization and Management. Thermo 2024, 4, 100–139. [Google Scholar] [CrossRef]
  23. Daniya, T.; Geetha, M.; Kumar, K.S. Classification and Regression Trees with Gini Index. Adv. Math. Sci. J. 2020, 9, 8237–8247. [Google Scholar] [CrossRef]
  24. Tangirala, S. Evaluating the Impact of GINI Index and Information Gain on Classification Using Decision Tree Classifier Algorithm. Int. J. Adv. Comput. Sci. Appl. 2020, 11, 612–619. [Google Scholar] [CrossRef]
  25. Bertsimas, D.; Dunn, J. Optimal Classification Trees. Mach Learn. 2017, 106, 1039–1082. [Google Scholar] [CrossRef]
  26. Miao, J.; Zhu, W. Precision–Recall Curve (PRC) Classification Trees. Evol. Intell. 2022, 15, 1545–1569. [Google Scholar] [CrossRef]
  27. Günlük, O.; Kalagnanam, J.; Li, M.; Menickelly, M.; Scheinberg, K. Optimal Decision Trees for Categorical Data via Integer Programming. J. Glob. Optim. 2021, 81, 233–260. [Google Scholar] [CrossRef]
  28. Xie, C.; Wang, R.; Zhang, J.; Chen, P.; Dong, W.; Li, R.; Chen, T.; Chen, H. Multi-Level Learning Features for Automatic Classification of Field Crop Pests. Comput. Electron. Agric. 2018, 152, 233–241. [Google Scholar] [CrossRef]
  29. Yasmin, R.; Das, A.; Rozario, L.J.; Islam, M.E. Butterfly Detection and Classification Techniques: A Review. Intell. Syst. Appl. 2023, 18. [Google Scholar] [CrossRef]
  30. Xia, D.; Chen, P.; Wang, B.; Zhang, J.; Xie, C. Insect Detection and Classification Based on an Improved Convolutional Neural Network. Sensors 2018, 18, 4169. [Google Scholar] [CrossRef]
  31. Albanese, A.; d’Acunto, D.; Brunelli, D. Pest Detection for Precision Agriculture Based on IoT Machine Learning. Conference on Applications in Electronics Pervading Industry, Environment and Society; Springer: Berlin/Heidelberg, Germany, 2019; pp. 65–72. [Google Scholar] [CrossRef]
  32. Kargar, A.; Zorbas, D.; Tedesco, S.; Gaffney, M.; O’flynn, B. Detecting Halyomorpha Halys Using a Low-Power Edge-Based Monitoring System. Comput. Electron. Agric. 2024, 221, 108935. [Google Scholar] [CrossRef]
  33. Rigakis, I.I.; Varikou, K.N.; Nikolakakis, A.E.; Skarakis, Z.D.; Tatlas, N.A.; Potamitis, I.G. The E-Funnel Trap: Automatic Monitoring of Lepidoptera; a Case Study of Tomato Leaf Miner. Comput. Electron. Agric. 2021, 185. [Google Scholar] [CrossRef]
  34. Preti, M.; Verheggen, F.; Angeli, S. Insect Pest Monitoring with Camera-Equipped Traps: Strengths and Limitations. J. Pest. Sci. 2021, 94, 203–217. [Google Scholar] [CrossRef]
  35. Flórián, N.; Jósvai, J.K.; Tóth, Z.; Gergócs, V.; Sipőcz, L.; Tóth, M.; Dombos, M. Automatic Detection of Moths (Lepidoptera) with a Funnel Trap Prototype. Insects 2023, 14, 381. [Google Scholar] [CrossRef]
  36. Nanni, L.; Manfè, A.; Maguolo, G.; Lumini, A.; Brahnam, S. High Performing Ensemble of Convolutional Neural Networks for Insect Pest Image Detection. Ecol. Inform. 2022, 67, 101515. [Google Scholar] [CrossRef]
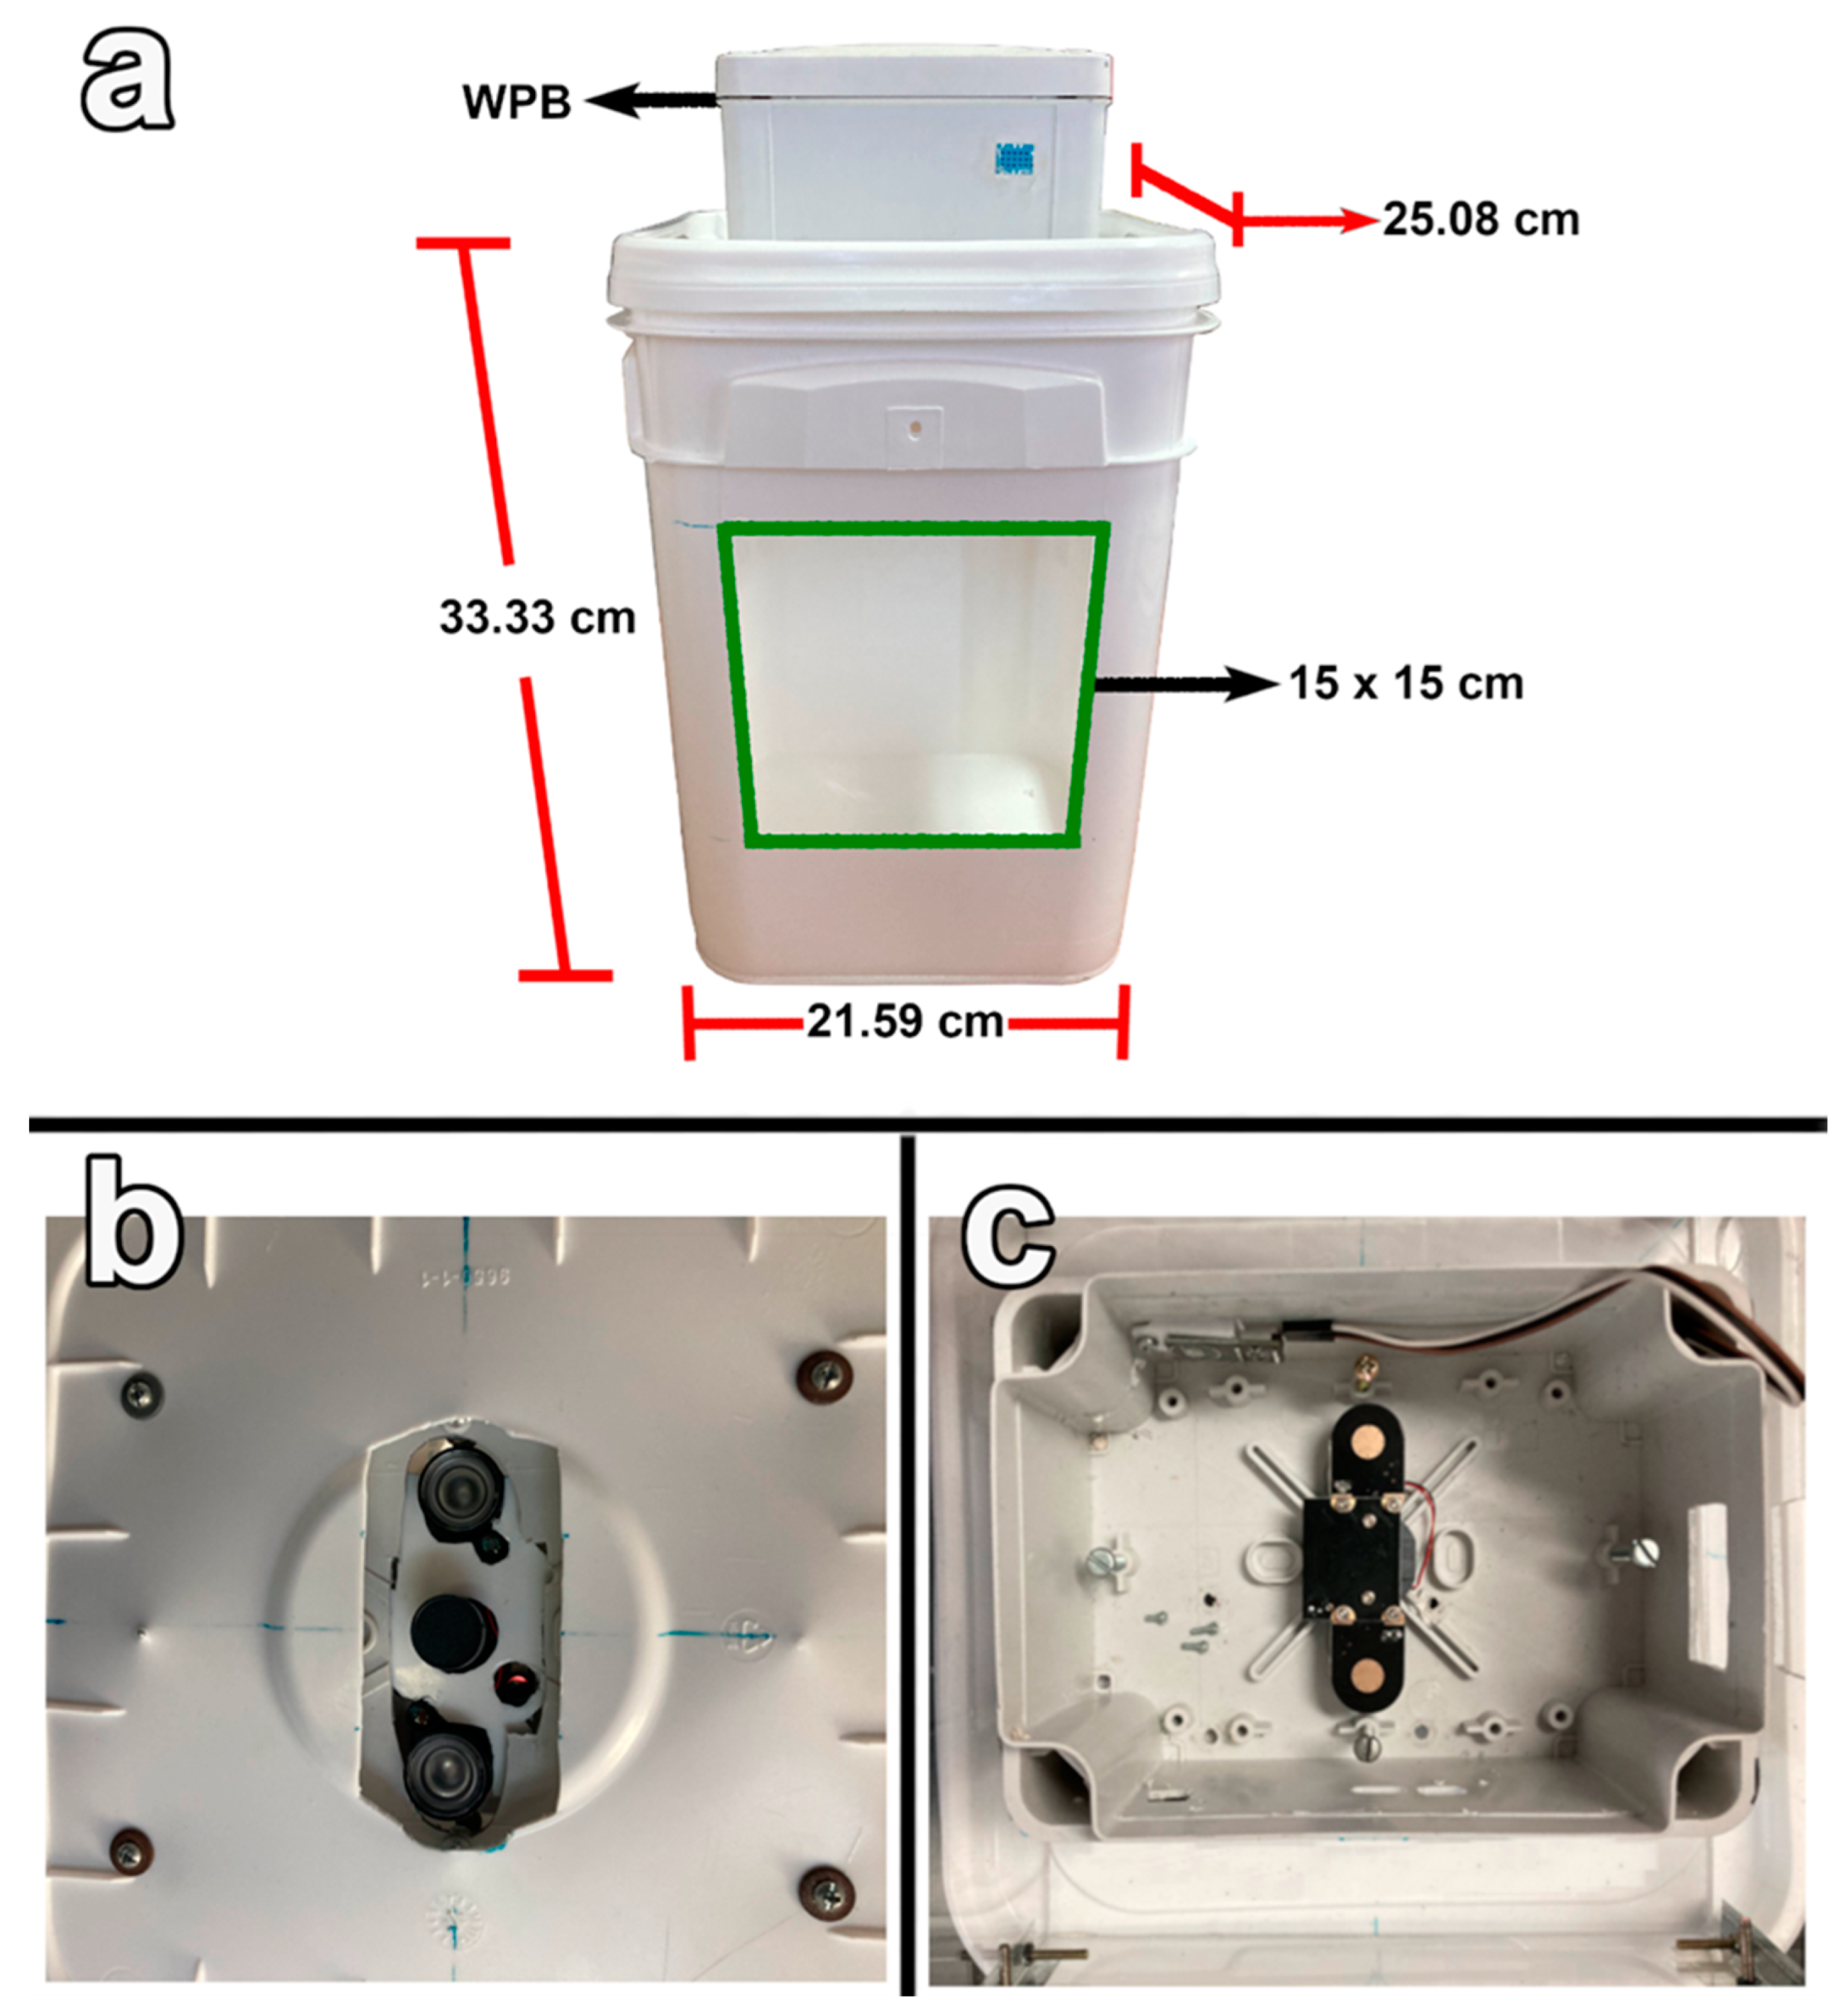
Figure 1. Trap body design and placement of the infrared (IR) camera module. (a) Dimensions of the trap body and location of the watertight box (WPB). The green box indicates the opening for accessing the study model insect, (b) arrangement of the IR camera within the waterproof box affixed to the trap body, providing a view of the bucket bottom, and (c) positioning of the IR camera within the lower section of the waterproof box.
Agriengineering 06 00216 g001
Figure 2. Schematic diagram of the electronic components comprising the prototype. (a) Controller power supply, (b) solar panel, (c) non-standard rechargeable lead-acid battery, (d) raspberry Pi 4B© controller, (e) infrared (IR) camera module, and (f) ESP32 microcontroller.
Agriengineering 06 00216 g002
Figure 3. Image processing steps by the prototype. (a) Original infrared (IR) image captured using the utilized software. (b) flowchart depicting the image processing pipeline, (c) binarization of the grayscale image to eliminate background noise, and (d) contour detection and extraction in the binarized image to quantify characteristics of identified objects.
Agriengineering 06 00216 g003
Figure 4. Flowchart of trap operation.
Agriengineering 06 00216 g004
Figure 5. System installation for field testing. (a) Trap installation within the strawberry plantation; and (b) functional inspections and screenshots of the prototype during field establishment.
Agriengineering 06 00216 g005
Figure 6. Optimization of the hyperparameter and input variable of the Antormelo model. (a) Optimizing decision tree model depth shows how model performance varies as a function of the maximum depth of the tree; (b) classification of objects based on the characteristics established by the decision tree model implemented in the created system.
Agriengineering 06 00216 g006
Figure 7. Incorporation of a decision tree model for D. fovealis detection.
Agriengineering 06 00216 g007
Figure 8. Detection of EPM. Within the green square the objects identified as “Insect” are shown, while in the red box the objects belonging to the “Non-insect” class are classified. (a) The image is displayed with the indicated identification and objects with various sizes are detected, expanding the established range; (b) identification of the insect and application of filter to reduce objects of no interest.
Agriengineering 06 00216 g008
Figure 9. (a) Field selectivity of the model in identifying D. fovealis; (b) daily insect counts monitored using the developed system; (c) captures of EPM recorded through manual counting.
Agriengineering 06 00216 g009
Disclaimer/Publisher’s Note: The statements, opinions and data contained in all publications are solely those of the individual author(s) and contributor(s) and not of MDPI and/or the editor(s). MDPI and/or the editor(s) disclaim responsibility for any injury to people or property resulting from any ideas, methods, instructions or products referred to in the content.