Abstract
During the industrial pecan shelling process, kernels are often damaged. To address this problem, a study is conducted to experimentally determine improved impactor geometries for end-to-end pecan cracking. Four impactors of varying internal angles (from 30° to 52.5°, in increments of 7.5°) are tested. After cracking, the pecans are passed through an image analysis software designed to detect and measure cracks in their shells. These measurements help classify each pecan into one of four categories: under crack, standard crack, ideal crack, or over crack. Cracked and ideally cracked pecans are preferred for their processability, so the impactor geometries are then evaluated based on their ability to maximize these crack types across the widest impact energy range. For the four impactors tested, the 30° impactor is found to more consistently produce preferred cracks in a larger energy range relative to the other impactors.
1. Introduction
Pecans (Carya illinoinensis) are one of the most valuable tree nut crops native to North America [1]. Tree nuts are the edible kernels inside the seeds of trees [2]. Pecans are primarily cultivated in the United States and Mexico and are valued for their flavor, health benefits, and use in baked goods [3,4,5]. In the United States alone, pecan production averaged 267 million pounds (roughly USD 459 million worth) of in-shell pecans per year from 2018 to 2022 [6]. Pecans are composed of a kernel surrounded by packing material and encased in a hard shell. It is common practice to crack the outer shell and separate it from the kernel before sale to increase the price per pound [7].
In industrial processing, the pecan is impacted to crack the shell so it can be later removed [8]. A common method for mechanized pecan cracking involves orienting a single pecan on its end and striking it with an impacting die. This is known as end-to-end cracking [9]. The main objective during cracking is to apply enough force to thoroughly crack the outer shell without damaging the enclosed kernel. After the pecans are cracked, they are fed through a mechanized sheller to separate the shells from the kernels.
A typical pecan sheller consists of a rotating bar with smaller protruding rods (often called a “beater bar”), which is encased inside carefully spaced rotating rings [9]. The beater bar hits the cracked pecans to remove the shells. The spacing between each ring is tuned so that kernels can drop through the spaces while unshelled pecans remain in the sheller. Through this shelling process, the pecan kernels are often broken or otherwise damaged [7]. Kernel damage is undesirable as intact kernels have an increased value per pound compared to pieces or meal [7].
Previous research has studied the mechanical properties of various tree nuts to better prevent kernel damage during cracking and shelling. Braga et al. [10] studied rupture energy for macadamia nuts as a function of moisture content, nut size, and loading orientation. Olaniyan et al. [11] studied the effect of temperature, loading orientation, and moisture on the rupture force of shea nuts. This work also defined toughness and firmness values for shea nuts by quasi-statically loading the nuts. Koyuncu et al. [12] conducted a similar study that analyzed the rupture energy of walnuts as a function of shell thickness, geometric mean diameter, and loading angle. Man et al. [13] validated a continuous damage theory by measuring the probability of breakage on walnuts. The damage theory was then used to determine the upper and lower bounds on the fracture energy of large subsets of walnuts.
For pecans, Kabas et al. [14] determined engineering properties such as strength and friction coefficient, toughness, and firmness as a function of the moisture of the kernel and the orientation of loading. They found that circumferentially loaded dry pecans had the lowest rupture energy; however, dry kernels are brittle and susceptible to damage during cracking [15]. In addition, most pecan processing equipment uses end-to-end cracking [16]. Celik et al. [17] created a material model for pecan shells and pecan packing material, which was then implemented in a dynamics package in a commercial finite element analysis software.
Another approach to research in industrial tree nut processing involves the experimental observation of the cracking and shelling processes of different tree nuts. Forbus et al. [7], Okunola et al. [18], Olaoya et al. [19], Oluwole et al. [20], and Prussia et al. [21] conducted experiments analyzing cracking efficiency with respect to moisture content of different tree nuts. Though controlling moisture aids in industrial tree nut processing, the issue of kernel damage persists. Okunola et al. [18], Olaoye et al. [19], and Oluwole et al. [20] conducted larger-scale experiments using industrial tree nut processing equipment. In these studies, various settings of the cracking equipment are changed, and the cracking efficiencies are compared for each setting.
In this paper, the problem of kernel damage during cracking is addressed by comparing the efficacy of different impactor geometries. The nuts are cracked across a range of energy levels for each impactor geometry, and the resulting cracks are separated into four categories. These categories are selected based on how easily the shell can be removed from the kernel. The cracks are categorized with the help of a software program that can detect and measure cracks in pecans. An optimal energy range is determined for each impactor geometry. The impactor geometries are then evaluated based on their ability to maximize preferred crack types across the widest possible impact energy range.
2. Materials and Methods
This study is designed to consider end-to-end pecan cracking. The impactor geometries were varied by changing their internal angle, as represented in Figure 1 by the angle . The impactors were manufactured from steel, which is consistent with industrial impactors. A total of four impactors were designed with internal angles varying from 30.0° to 52.5° with incremental steps of 7.5°. The center of the impactor was drilled out to allow for the proper seating of the pecan in the impactor.
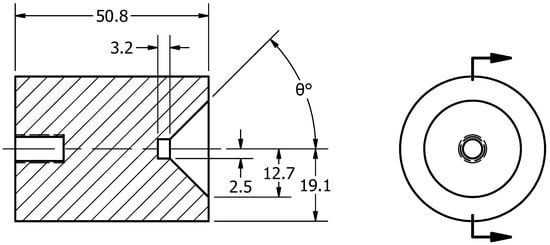
Figure 1.
Dimensioned schematic (mm) of pecan impactor with specified impactor angle, θ°.
The different impactor geometries contact different portions of the pecans as they rest inside the impactor. For example, the lowest angle impactor () contacts the pecan closest to its middle while the largest angle impactor () contacts the pecan closest to its end. Pecans were cracked at a range of energy levels, and the crack types were measured and recorded. Once an energy threshold was reached such that every impact resulted in kernel damage, the experiment was terminated.
2.1. Pecan Processing and Conditioning
For this research, pecans of the McMillan cultivar were obtained from a farm in Athens, Georgia (USA). McMillan pecans are of average quality and have thick shells with a high level of production and good pest resistance [22]. The thick shell makes them ideal for a pecan cracking study, as thicker shelled pecans require more energy for rupture [2]. Fresh pecans were used for this research from the harvest seasons of 2022 and 2023. The pecans used in this study had an average diameter of 22.3 (mm) and length of 36.6 (mm) as determined from a sample of the nuts. Once harvested, the pecans were dried to a moisture level of approximately 4% and stored in a freezer to preserve their freshness and prevent the onset of rancidity [5]. Before testing, the pecans were removed from the freezer in batches ranging from 150 to 300. The pecans were conditioned with a hot water bath to a kernel moisture of approximately 8%. This relatively high moisture level made the kernels more ductile and less susceptible to damage during cracking and shelling [2].
A preliminary study was conducted to investigate the pecan conditioning time and its effect on the moisture of the kernel. Groups of five pecans were conditioned in a hot water bath at 100 °C for 5 to 70 min and the moisture content of the kernels was determined. The moisture content was measured by drying the kernels at 100 °C until they reached a constant weight. Any weight loss was reported as percent moisture [23]. The conditioning of pecans in hot water for 70 min was found to result in a moisture content within the range of 7.5–9.3%. The average weight of each pecan in the set was 7.1 (g) before conditioning and 7.8 (g) after conditioning.
2.2. Drop Weight Rig Design
The cracking force was controlled using the drop weight rig shown in Figure 2a. A pecan was placed between two static impactors and a falling weight of known mass (nominally 1.5 kg) was raised and dropped on the impactors, as shown in Figure 2b. The rig consisted of a 45.5 × 45.5 × 5.0 (cm3) aluminum base with a 1.2 (m) clear PVC pipe mounted 11 cm above the base. The PVC pipe acts as a guide for the drop weight. Affixed to the PVC pipe was a measuring tape to measure the height of the weight before it was dropped. A string tied to an eye bolt at the top of the weight was used to raise it to the desired height. A pulley was mounted on the top of the PVC pipe to guide the string. To contain the shattered pecan shells, an acrylic shield surrounded the area where the pecans were cracked.
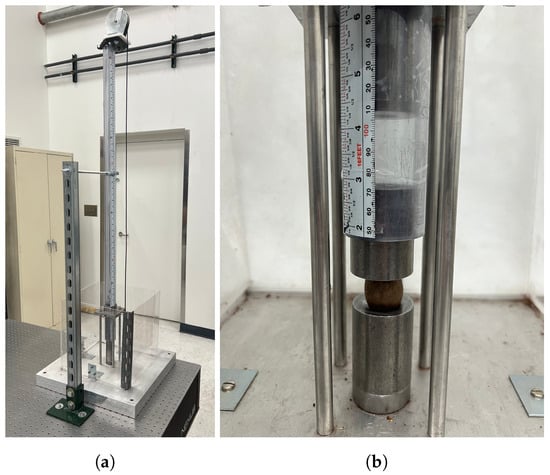
Figure 2.
Experimental cracking equipment used in this study: (a) cracking drop weight rig and (b) placement of pecan in the rig.
During data collection, underdeveloped and diseased pecans were discarded, and a pecan was re-cracked in its place. Since the pecans were placed upright on the impactors, dust from the shells would collect in the impactors and be periodically cleaned to ensure that the pecans fully seat in the bottom impactor. In the case of the 30° impactor, nuts were occasionally forced into an impactor and became stuck after impact. Smaller pecans would get stuck more often, which implies that impactors should be sized down to avoid this problem. Should the 30° impactor be used in an industrial setting, impactors may need to be sized according to the size of the pecans being cracked.
2.3. Experimental Parameters
The four different impactor geometries tested are shown in Figure 3. The gravitational potential energy () was computed for each drop height and used as the measure of impactor energy. Here, E is the impact energy, m is the mass of the drop weight, g is the gravitational constant (9.81 m/s2), and h is the height of the drop. The energy range from 1.6 to 14.9 J is divided into 35 equally spaced bins. For each of the 35 bins, 20 impact energies were randomly sampled to be used as test points. The corresponding height of the drop weight was calculated for each test point, and a pecan was impacted at each drop height.
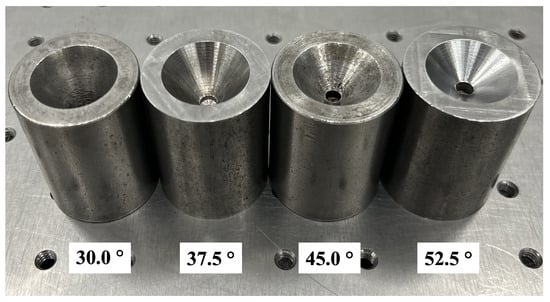
Figure 3.
The four impactor geometries considered for pecan cracking.
To verify that impactor potential energy is an appropriate metric with which to study cracking trends, a sub-experiment was conducted. In this sub-experiment, the drop weight and drop heights were varied while maintaining the same potential energy. Drop weights with masses of 1.0, 1.5, and 2.0 kg were considered. Throughout the sub-experiment, the industry standard 45° impactor was used [24].
2.4. Experimental Cracker Evaluation
After cracking, each pecan was classified according to the extent of its cracks. The four classifications are: under crack, standard crack, ideal crack, and over crack. Representative photos of pecans falling into each of these categories are shown in Figure 4. These categories are defined on the basis of how easily the shell can be removed. For cracks in which the shell remains mostly intact, shell removal is difficult, and these pecans are deemed to be under cracked. Conversely, cracks with visibly damaged kernels are said to be over cracked. Pecan cracks with easily removable shells and undamaged kernels are classified as standard or ideal cracks. Ideal cracks are differentiated from standard cracks by the entire circumference of the pecan being cracked so that the shell practically falls away and the kernels can be easily removed.
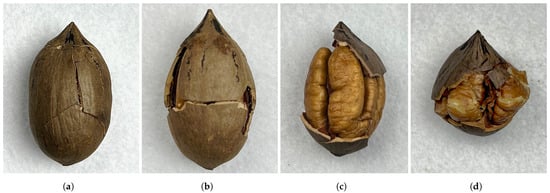
Figure 4.
Pecan cracks that represent each of the four crack categories: (a) under crack, (b) standard crack, (c) ideal crack, and (d) over crack.
Separating the upper and lower halves of the pecan shell was found to be the easiest way to remove the kernels without damaging them. A cracked pecan is labeled as under cracked as shown in Figure 4a if the crack present extends less than 40% around the circumference of the pecan. This category also includes pecans that do not have visible cracks after being impacted. The 40% threshold is used because it is observed that if more than half of the circumference is intact, separating the top portion of the shell from the bottom is more difficult and requires more force than if more than half the circumference of the pecan is cracked. For standard cracks, as seen in Figure 4b, a circumferential crack extends across more than 40% but less than 100% of the circumference of the pecan.
For ideally cracked pecans like the one shown in Figure 4c, the entire circumference of the pecan shell is cracked, making two distinct halves of the pecan shell that can be easily pulled apart. Finally, Figure 4d shows an over cracked pecan where the kernel is damaged. For each individual pecan tested, categorization was first performed by visual inspection, which identifies ideally cracked and over cracked pecans. To distinguish the under cracked pecans from standard cracked pecans, an image analysis software package was used, which is described presently.
2.5. Crack Detection
Classification into the under cracked or standard crack categories was accomplished using a detection, measurement, and classification (DCM) software (version 1.0) developed by the authors for pecan cracking studies. The DCM software processes videos of rotating pecans to detect cracks, generate measurements for those cracks, and classify each crack according to those measurements. The videos used for the software were created using the setup shown in Figure 5. This setup involved placing each cracked pecan between two rollers, driving the rollers with an 18 W motor, and capturing four-second videos of the rotating pecan from above. Each video was labeled according to the pecan’s energy bin and stored for post-processing. The DCM software struggled to detect thin cracks that do not penetrate the entire shell. Therefore, the cracks detected in this study were assumed to result in complete separation of the shell.
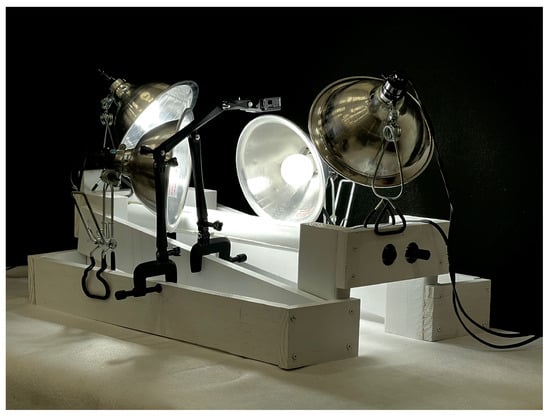
Figure 5.
Setup used to capture video of rotating pecans for crack detection software.
The DCM software was used to import the video and identify the pecan boundaries. These boundaries were used to calculate the diameter, circumference, and height of the pecan. The software is able to take a decomposed video frame as shown in Figure 6a and detect cracks in the pecan shell. The software correlates these detected cracks between each frame to generate an accurate representation of each crack in the shell as shown in Figure 6b. The software then uses these representations to measure the length, width, and surface area of the crack.
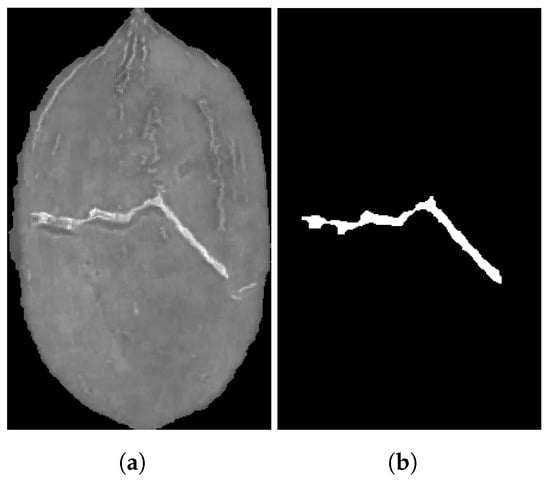
Figure 6.
Crack detected in pecan shell using the DCM software: (a) decomposed image of a pecan used in analysis and (b) binary representation of the crack.
The DCM software was used to distinguish between under cracks and standard cracks by dividing the length of the crack in the circumferential direction by the circumference of the pecan at the location of the crack. If this ratio is greater than or equal to 40%, the crack is classified as a standard crack, provided the crack midpoint is located within the middle 50% of the length of the pecan. If the length ratio is less than 40% or the midpoint of the crack is outside the middle 50% of the pecan, the crack is classified as under cracked.
3. Results and Discussion
Table 1 shows the results for each of the four impactor geometries. A total of seven energy ranges are displayed, each of which contains five energy bins. In the lowest energy range, as the impactor angle increases, the number of under cracked pecans decreases. Following this trend, the 52.5° impactor is the first to over crack 100% of the pecans with respect to energy, while the 30.0° is the last to over crack 100% of the pecans. This implies that on average, the lower the impactor angle, the more energy is required for cracking.

Table 1.
Percentage of each crack type reported in seven energy ranges for each impactor geometry.
Intuitively, the lower energy ranges produce more under cracked pecans. Additionally, as the energy level increases, more pecan kernels are damaged. For processability, standard and ideal cracks are preferred, while under cracked and over cracked pecans are not. Thus, the data in Table 1 are presented to easily observe the number of standard and ideal cracks produced for each impactor geometry. An important metric is the energy level that maximizes the number of standard and ideal cracks. However, since the energy level in industrial pecan cracking equipment can only be crudely adjusted, a perhaps more important metric is the extent of the energy range over which a high percentage of standard and ideal cracks are produced. Larger energy ranges are preferable since they would necessitate less fine-tuning of the pecan cracking equipment.
3.1. Impactor Geometry Comparison
The percentage of standard and ideal cracks produced by each of the four impactors are shown versus impactor energy in Figure 7. These results show that as the angle of the impactor increases, the optimal energy level for cracking decreases monotonically. Regarding the extent of the energy range over which a high percentage of standard and ideal cracks is produced, Figure 8 illustrates these ranges for each impactor geometry. The whiskers of the plot indicate the energy level beyond which zero standard or ideal cracks are produced. Below the left whisker, all pecans are classified as under cracked, and above the right whisker, all pecans are classified as over cracked. The width of each box indicates the energy range in which the majority (over 50%) of preferred cracks (standard and ideal) are produced. The vertical line inside each box indicates the energy level that produced the highest percentage of preferred cracks. The 30.0° impactor has the largest energy range of the four impactors. Similar to the trend observed in optimal energy level, the optimal energy range decreases as the impactor angle increases.
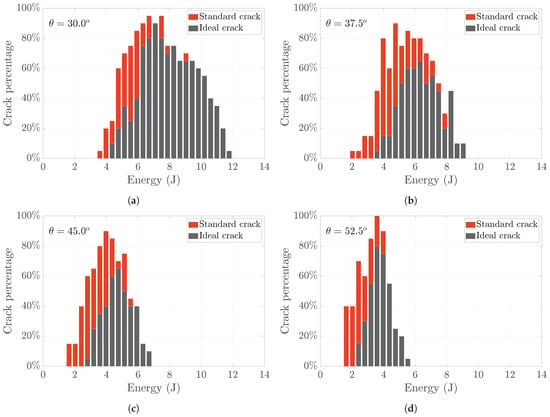
Figure 7.
Percentage of standard and ideal cracks produced with each set of (a) 30.0° impactors, (b) 37.5° impactors, (c) 45.0° impactors, and (d) 52.5° impactors.
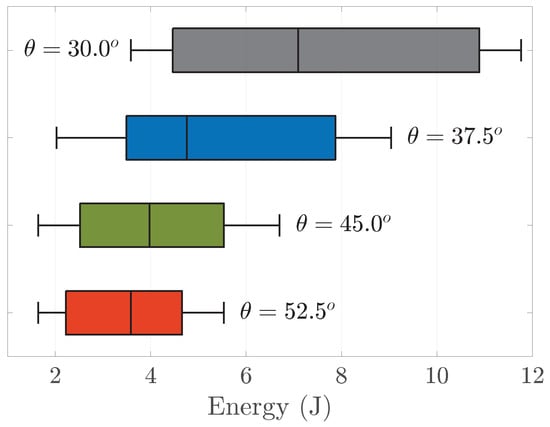
Figure 8.
Energy ranges that produce more than 50% of the preferred (standard and ideal) crack types.
Figure 9 shows trends in optimal cracking energy and the energy range for optimal cracking (i.e., the box widths in Figure 8) with respect to the impactor internal angle. The similarity in these trends indicates that the energy range for optimal cracking is directly proportional to the optimal energy level. For example, if an impactor geometry requires a large amount of energy to sufficiently crack the nut, then there is a large range of target energy surrounding the optimal energy level. Further, it is observed that for small internal angles, changes in internal angle cause larger changes in target cracking energy and range, relative to impactors with larger internal angles.
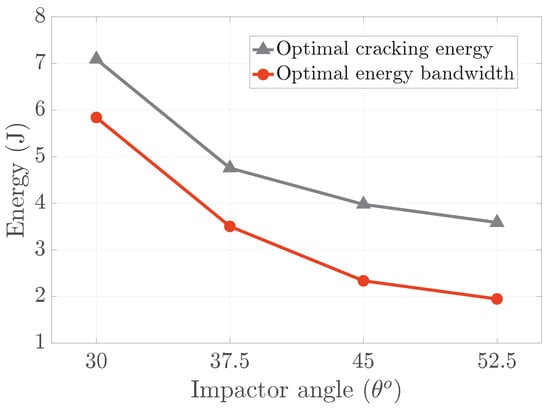
Figure 9.
Optimal crack energy and 50% energy range versus impactor internal angle.
3.2. Impact Energy Analysis
To verify that impactor potential energy is an appropriate metric with which to study cracking trends, a sub-experiment is conducted in which impact energy is kept constant while varying the drop height and mass. Three drop weights are considered: 1.0 kg, 1.5 kg, and 2.0 kg. With constant energy, smaller drop weights will impact the pecan at a higher velocity since they are dropped from a greater height. The 45° impactor is used throughout the sub-experiment and the results are shown in Figure 10a–c. The results are presented as histograms showing the percentages of standard and ideal cracks obtained in each energy bin. The optimal energy range for each drop height and mass configuration are shown in Figure 10d. The relative similarity of the optimal energy ranges suggest that cracking trends are well captured by the single metric of impactor energy.
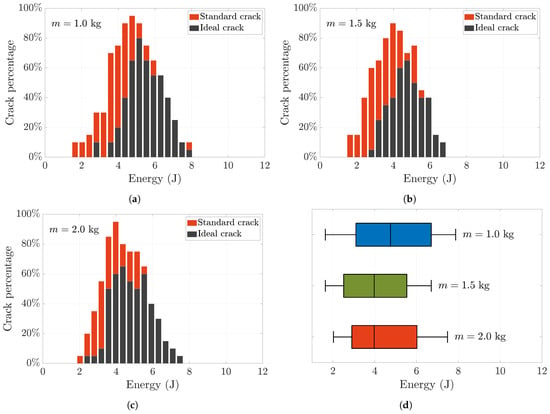
Figure 10.
Percentage of standard and ideal cracks produced with a drop weight of mass (a) 1 kg, (b) 1.5 kg, or (c) 2 kg used to dropped on the impactors and (d) 50% energy ranges for each mass.
3.3. Crack Length Measurements
Figure 11 shows the average circumferential crack length at each energy bin for each impactor. The circumferential crack length is reported as the percentage of the circumference of the pecan. For standard and under cracked pecans, these ratios are calculated using the DCM software. For both ideal and over cracked pecans, the circumferential crack length is assigned a value of 100%. Uncracked pecans were assigned a circumferential crack length of 0%. Each curve ends at the energy level at which all the cracks produced are over cracked.
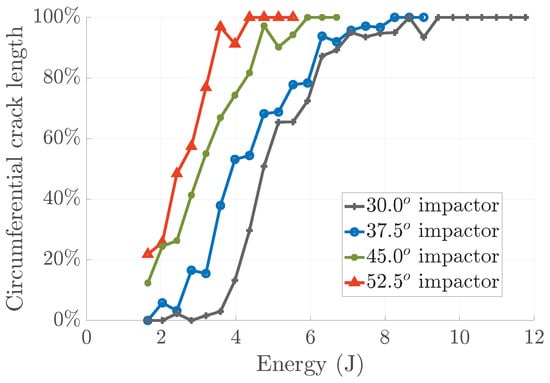
Figure 11.
Percentage of pecan circumference cracked averaged at every energy level for each impactor geometry.
As the impactor angle decreases, the required energy to produce the same circumferential crack length increases. An average circumferential crack length of 50% occurs at 4.73 J for the 30.0° impactor, 3.90 J for the 37.5° impactor, 3.06 J for the 45.0° impactor, and 2.49 J for the 52.5° impactor. This trend in crack lengths is the same as the one observed with crack distributions in Figure 7—for impactors with smaller internal angles, more energy is required to produce the same cracks. The curves in Figure 11 have similar ranges of energy that produce circumferential crack lengths below 80%. However, the impactors with smaller internal angles have a wider range of energy in which circumferential crack lengths between 80% and 100% are produced. It appears that impactors with smaller internal angles are less likely to over crack the pecan at higher energy ranges.
Overall, impactors with smaller internal angles are less sensitive to changes in energy. It is hypothesized that these small-angle impactors would be advantageous in industrial cracking machines since they are more accommodating to variations in nut geometry, moisture level, and material properties.
4. Conclusions
In this study, nut cracking experiments are conducted to compare different pecan impactor geometries. The pecans are conditioned to a kernel moisture level of approximately 8%, placed between two end-to-end impactors, and cracked with an impulsive force delivered by a falling weight. The four internal angles of the pecan impactors considered are 30.0°, 37.5°, 45.0°, and 52.5°. The resulting crack types are categorized into four types: under crack, standard crack, ideal crack, and over crack, based on how easily the shell can be removed without damaging the kernel. The distribution of crack type and crack length is observed as a function of impact energy for each pecan impactor.
When comparing impactor geometries, it is found that 30.0° performed optimally producing a total of 255 standard and ideal cracks. It outperformed the 37.5° impactor which produced 183 standard and ideal cracks, the 45.0° impactor which produced 141 standard and ideal cracks, and the 52.5° impactor which produced 118 standard and ideal cracks.
Based on its ability to produce a high percentage of preferred crack types across a relatively large energy range, the 30.0° impactor appears to be best suited for industrial end-to-end cracking. Currently, 45.0° impactors are the industry standard [24]. Since the 30.0° impactor can produce a high percentage of ideal cracks where the shell simply falls away from the kernel, it is recommended that processors implement a sorting stage to separate and secure intact and shelled kernels before sending the remaining nuts to a sheller.
Author Contributions
M.W.J.: conceptualization, methodology, visualization, resources, software, formal analysis, investigation, validation, data curation, writing—original draft. C.M.L.: conceptualization, methodology, visualization, software, formal analysis, investigation, data curation, writing—original draft. L.E.M. investigation, validation, writing—review and editing. R.B.D.: conceptualization, methodology, visualization, writing—review and editing, supervision, project administration, funding acquisition. All authors have read and agreed to the published version of the manuscript.
Funding
This research was funded by the United States Department of Agriculture under grant number 6042-21220-014-00-D.
Data Availability Statement
The original contributions presented in the study are included in the article.
Acknowledgments
The authors acknowledge Dani Agramonte for their assistance in conceptualization and design of the experimental setup.
Conflicts of Interest
The authors declare no conflicts of interest. The funders had no role in the design of the study; in the collection, analyses, or interpretation of data; in the writing of the manuscript; or in the decision to publish the results.
References
- Conner, P.J.; Worley, R.E. Performance of 15 Pecan Cultivars and Selections over 20 Years in Southern Georgia. HortTechnology 2002, 12, 274–281. [Google Scholar] [CrossRef]
- Woodroof, J.G. Tree Nuts: Production, Processing, Products; AVI Publishing Company: Clark, CO, USA, 1979. [Google Scholar]
- Ferrara, G.; Lombardini, L.; Mazzeo, A.; Bruno, G.L. Evaluation of Pecan [Carya illinoinensis (Wangenh.) K. Koch] Cultivars for Possible Cultivation for Both Fruit and Truffle Production in the Puglia Region, Southeastern Italy. Horticulturae 2023, 9, 261. [Google Scholar] [CrossRef]
- Atanasov, A.G.; Sabharanjak, S.M.; Zengin, G.; Mollica, A.; Szostak, A.; Simirgiotis, M.; Huminiecki, L.; Horbanczuk, O.K.; Nabavi, S.M.; Mocan, A. Pecan nuts: A review of reported bioactivities and health effects. Trends Food Sci. Technol. 2018, 71, 246–257. [Google Scholar] [CrossRef]
- Heaton, E.K.; Shewfelt, A.L.; Badenhop, A.L.; Beuchat, L.R. Pecan: Handling, storage, processing and utilization. Res. Bull. Ga. Exp. Stn. (USA) 1977, 28–67. [Google Scholar]
- USDA. Quick Stats; USDA: Sandersville, GA, USA, 2023. [Google Scholar]
- Forbus, W.R.; Senter, S.D.; Wilson, R.L. Physical Properties of Pecans Relating to Shelling Efficency. J. Food Sci. 1983, 48, 800–803. [Google Scholar] [CrossRef]
- Goff, W.D.; McVay, J.R.; Gazaway, W.S. Pecan Production in the Southeast: A Guide for Growers; University of Georgia Extension: Athens, GA, USA, 1989; pp. 97–111. [Google Scholar]
- Santerre, C.R. Pecan Technology; Chapman & Hall, Inc.: London, UK, 1994. [Google Scholar]
- Braga, G.C.; Couto, S.M.; Hara, T.; Neto, J.T.P.A. Mechanical Behaviour of Macadamia Nut under Compression Loading. J. Agric. Eng. Res. 1999, 72, 239–245. [Google Scholar] [CrossRef]
- Olaniyan, A.M.; Oje, K. Some aspects of the mechanical properties of shea nut. Biosyst. Eng. 2002, 84, 413–420. [Google Scholar] [CrossRef]
- Koyuncu, M.A.; Ekinci, K.; Savran, E. Cracking Characterstics of Walnut. Biosyst. Eng. 2004, 87, 305–311. [Google Scholar] [CrossRef]
- Man, X.; Li, L.; Zeng, Y.; Tang, Y.; Yang, J.; Fan, X.; Zhang, Y.; Zhang, H.; Su, G.; Wang, J. Mechanical impact characteristics of hollow shell granule based on continuous damage theory. Powder Technol. 2023, 429, 118946. [Google Scholar] [CrossRef]
- Kabas, O.; Vladut, V. Determination of Some Engineering Properties of Pecan (Carya illinoinensis) for New Design of Cracking System. Erwerbs-Obstbau 2015, 58, 31–39. [Google Scholar] [CrossRef]
- Forbus, W.R.; Smith, R.E. Pecan Conditioning Methods for Increased Shelling Efficiency. Trans. ASAE 1971, 14, 596–599. [Google Scholar] [CrossRef]
- Woodroof, J.G.; Heaton, E.K. Pecans for Processing; Georgia Agricultural Experiment Stations: Griffin, GA, USA, 1961. [Google Scholar]
- Celik, H.K.; Caglayan, N.; Rennie, A.E.W. Nonlinear FEM based high-speed shell shattering simulation for shelled edible agricultural products: Pecan fruit shattering. J. Food Process. Eng. 2017, 40, e12520. [Google Scholar] [CrossRef]
- Okunola, O.I.; Olukunle, O.J.; Adetola, O.A.A.; Akinfiresoye, W. The comparative analysis of a developed swing beater and conventional beater of a palm nut cracking machine. Turk. J. Agric.—Food Sci. Technol. 2023, 11, 1298–1303. [Google Scholar] [CrossRef]
- Olaoye, J.O.; Adekanye, T.A. Properties influencing cracking and separation of palm nuts in a mechanical cracker cum sparator. Croat. J. Food Sci. Technol. 2018, 10, 42–50. [Google Scholar] [CrossRef]
- Oluwole, F.A.; Aviara, N.A.; Haque, M.A. Development and performance tests of a sheanut cracker. J. Food Eng. 2004, 65, 117–123. [Google Scholar] [CrossRef]
- Prussia, S.E.; Verma, B.V.; Blum, W.M. Shattering Pecan Shells with High-Speed Projectiles. Trans. ASAE 1985, 30, 425–489. [Google Scholar] [CrossRef]
- Conner, P.J. UGA variety test update: ‘McMillan’ shows promise for low-input plantings. Pecan Grow. 2013, XXV, 40–44. [Google Scholar]
- Horwitz, W. Official Methods of Analysis of the Association of Official Analytical Chemists; Association of Official Analytical Chemists: Washington, DC, USA, 1980; Volume 13, p. 435. [Google Scholar]
- Savage, B.W.; Savage, S.W.; Ingle, R.D. Nut Cracking Apparatus. U.S. Patent 8,215,233 B2, 10 July 1012. [Google Scholar]
Disclaimer/Publisher’s Note: The statements, opinions and data contained in all publications are solely those of the individual author(s) and contributor(s) and not of MDPI and/or the editor(s). MDPI and/or the editor(s) disclaim responsibility for any injury to people or property resulting from any ideas, methods, instructions or products referred to in the content. |
© 2024 by the authors. Licensee MDPI, Basel, Switzerland. This article is an open access article distributed under the terms and conditions of the Creative Commons Attribution (CC BY) license (https://creativecommons.org/licenses/by/4.0/).