Abstract
Remotely piloted aircraft (RPAs) have been increasingly used for crop protection in coffee plantations. However, the applications can result in low spray deposition on leaves and higher product losses between rows compared to ground airblast sprayers. This study aimed to evaluate the spray deposition on the coffee canopy and potential losses to the soil during application with an RPA and an airblast sprayer at varying spray volumes. The experiment comprised four spray treatments: RPA at 10 L ha−1 and 20 L ha−1, and airblast sprayer at 200 L ha−1 and 300 L ha−1. Leaf deposition was quantified by measuring a tracer on leaves from the lower and upper parts of the coffee canopy using spectrophotometry. Spray losses to the soil were measured by analyzing tracer residues on Petri dishes positioned within the inter-rows and beneath the coffee canopy. Statistical process control was used to analyze spray deposition quality in the study area. Ground-based airblast spraying resulted in the highest overall canopy deposition, while RPA spraying led to greater losses within the inter-rows. No significant difference was observed in spray runoff beneath the canopy between ground-based and aerial applications. Leaf deposition exhibited random variability across all application methods. Therefore, application stability, control, and spray quality standards were maintained.
1. Introduction
Coffee cultivation underpins the global economy, providing livelihoods for millions of farmers and generating billions in revenue. Brazil is the worldwide leader in coffee production and exporting. Coffee production in Brazil encompasses 2 million hectares with approximately 265 thousand farms [1]. However, this vital crop faces challenges due to its susceptibility to various pests and diseases that can devastate yields [2]. The significant diseases are coffee berry disease (Colletotrichum Kahawae), coffee leaf rust (Hemileia vastatrix), and coffee wilt disease (Gibberella xylarioides (Fusarium xylarioides)). The significant pests are the coffee berry borer Hypothenemus hampei Ferrari (Coleoptera: Curculionidae), the coffee leaf miner Leucoptera coffeella Guérin (Lepidoptera: Lyonetiidae), and the antestia bug Antestiopsis orbitalis Westwood (Hemiptera: Pentatomidae) [3]. Therefore, the application of crop protection products during cultivation is crucial for preventing yield reductions and ensuring product quality [4].
The technology used for application is critical because coffee crops present unique challenges for depositing active ingredients on their targets [5]. Dense canopies, with their high leaf area index, often planted on sloped terrain, hinder ground equipment from reaching the interior foliage with sprayed droplets [6].
Airblast sprayers are currently the most used equipment for coffee crop protection, and they were developed to reduce labor costs, decreasing the necessary operators from two to one, and, furthermore, the airflow of this equipment directs the sprayed droplets in the direction of the target, improving their penetration and consequent deposition [7]. However, this type of equipment faces significant challenges in operating in mountainous and irregularly shaped areas [8], which are common in coffee farming.
Remotely piloted aircraft (RPAs) offer a recent advancement in crop protection technology. However, their application characteristics differ significantly from those of traditional airblast sprayers used by coffee growers. Lower application volumes employed by RPAs (8–20 L ha−1) compared to the higher volumes used by ground sprayers (200–1500 L ha−1) can affect leaf coverage [9]. One often overlooked aspect is that airblast sprayers, like those used for other perennial crops, direct the spray solution toward the plant canopy. In contrast, RPAs apply the solution across the entire field, potentially leading to wasted product between rows. This issue may be further exacerbated by the increasing spraying width of drones with enhanced operational capacity, as a single pass can cover multiple rows, potentially causing even greater losses between rows.
Despite these challenges, studies have shown promise for using RPAs in coffee phytosanitary control. Vitória et al. [5] demonstrated the effectiveness of fungicide application with RPAs for controlling fungal diseases in mountain coffee plantations. Additionally, Souza et al. [6] also emphasized the potential of using RPAs for spraying in mountainous coffee plantations.
Therefore, the objective of this study was to evaluate the deposition of spray solution on the coffee canopy and potential losses to the soil caused by spraying with an RPA and airblast sprayer at different spray volumes.
2. Materials and Methods
This study was conducted at the Coffee Production Sector of the Federal University of Uberlândia in Uberlândia, MG, Brazil (18°58′52″ S latitude, 48°12′24″ W longitude, and 912 m altitude) (Figure 1). According to Köppen’s classification, the region experiences a tropical wet and dry climate (Aw) with hot, humid summers and cold, dry winters. Average monthly air temperature ranges from 20.9 to 23.1 °C, with annual average rainfall between 1500 and 1600 mm [10]. The area has a gently undulating terrain.
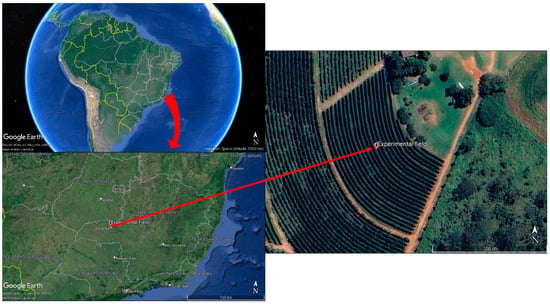
Figure 1.
The location of the experimental area (Google Earth Pro modified by authors) [11].
The experiment comprised four treatments (Table 1) and eight replications, using a completely randomized design.

Table 1.
Description of the treatments applied in this study.
The RPA used was an AGRAS MG-1P octocopter (DJI, China) equipped with a 10 L spray tank, four spray nozzles, and eight motors (Figure 2). All treatments employed a four-meter swath width, a working height of 1.5 m above the coffee canopy, and a forward speed of 12.2 km h⁻¹. Two spray volumes were evaluated (10 L ha−1 and 20 L ha−1). The RPA utilized XR 11001 flat fan spray nozzles (Teejet, Glendale Heights, IL, USA) designed to produce very fine to fine droplets in accordance with the operating pressure (factory-installed). The flight path of the RPA was perpendicular to the planting rows.
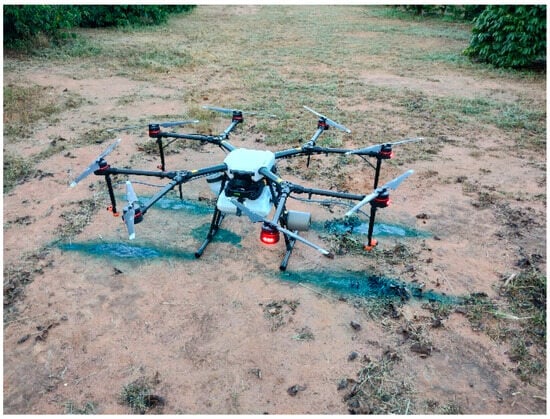
Figure 2.
RPA used in the experiments.
The airblast sprayer used was an Arbo360 (Montana, São José dos Pinhais, PR, Brazil), equipped with a 300 L tank, a spray pump (working at 40 L min⁻¹), a manual section control, and a fan with a 615 mm diameter, and nine fixed-angle blades. The equipment had six nozzle holders on each of the two sides, fitted with yellow ATR hollow cone spray nozzles (Albuz, Évreux, Eure, France) made of ceramic. These nozzles feature an 80° spray angle and produce a very fine droplet spectrum according to the manufacturer. The sprayer was pulled by a New Holland T4 4 × 2 tractor with auxiliary front-wheel drive and 62.5 kW power (Figure 3).
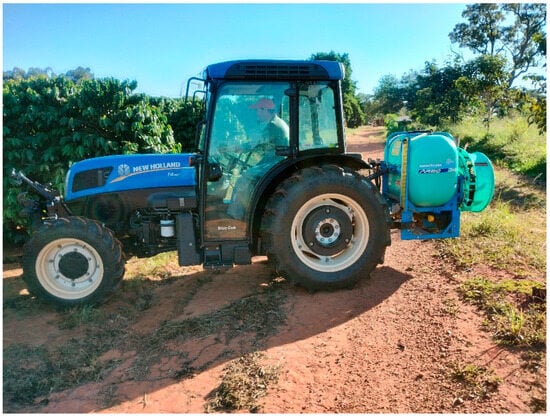
Figure 3.
Airblast sprayer and tractor used for ground-based application.
Two airblast sprayer application volumes were tested (200 L ha−1 and 300 L ha−1), with corresponding pressures of 400 kPa and 800 kPa, respectively. A power take-off (PTO) speed of 2000 rpm and a forward speed of 6.6 km ha−1 were used.
Spray deposition on the coffee canopy and potential losses to the soil were evaluated in an area planted with the Topázio coffee cultivar. The plants had an average height of 2.3 m and an average canopy diameter of 1.8 m. The between-row and within-row spacings were 3.5 m and 0.6 m, respectively (Figure 4).
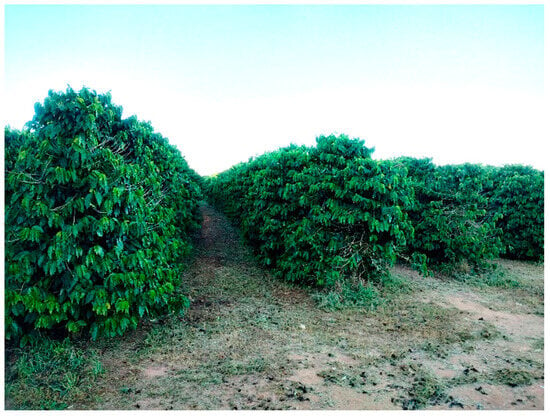
Figure 4.
Coffee cultivation area used for spray deposition and loss studies.
The experimental plots were rectangular, measuring 50 m in length and 30 m in width. Each plot had a usable area of 44 m by 24 m, with the remaining three meters on each side serving as a border.
Spray deposition was assessed by detecting a tracer, Brilliant Blue food dye (FD&C Blue No. 1), applied at a fixed dose of 500 g ha−1 in the spray solution. The lower and upper parts of the coffee canopy were analyzed separately. The tracer was detectable by absorbance in a spectrophotometer at 630 nm using 3.5 mL glass cuvettes with a 10 mm optical path and a tungsten–halogen lamp [12].
After spraying, 10 plants per replicate were randomly selected. One leaf each from the upper and lower parts of each plant was sampled, placed in plastic bags and stored in thermally and light-insulated containers for transport to the laboratory.
In the laboratory, 100 mL of distilled water was added to each bag containing leaves. The bags were sealed and stirred for 15 min at 120 rpm in a TE-240 pendulum stirrer (Tecnal, Piracicaba, SP, Brazil) to extract the tracer, transferring the liquid to plastic cups. The cups were stored in a refrigerated, light-insulated location for 24 h before absorbance spectrophotometer readings.
Utilizing a calibration curve derived from standard tracer solutions, absorbance data were converted to tracer concentration (μg L⁻¹). The mass of dye retained on the leaves was then calculated based on the initial spray solution concentration and the sample dilution volume [12]. Finally, the total dye deposit was divided by the leaf area (measured with a Licor LI 3100C leaf area meter) to obtain the amount of tracer per unit leaf area (μg cm−2).
To assess spray losses to the soil, a Petri dish (14.4 cm2) was placed in the center of each inter-row and another beneath the coffee canopy overhang, 0.45 m from the trunk (Figure 5). These dishes collected spray deposits separately. In the laboratory, 30 mL of distilled water was added to each dish and stirred, with the absorbance being read in the spectrophotometer to determine the amount of tracer per unit area (μg cm⁻²) on the Petri dishes.
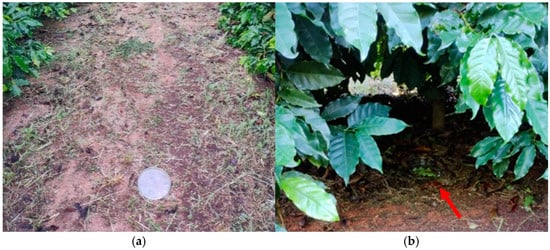
Figure 5.
Placement of the Petri dishes used for assessing spray losses to the soil: (a) center of the inter-row; (b) beneath the coffee canopy.
Weather conditions during the applications were favorable, with temperature ranging from 23 to 26 °C, relative humidity from 66% to 68%, and average wind speed from 1.3 to 1.8 km h⁻¹. These conditions can be considered quite favorable for a good pesticide application [13]. Thus, it is expected that they did not significantly influence the results.
For statistical analysis, the assumptions of the linear model were tested using the Shapiro–Wilk (W) test for residual normality, the Levene (L) test for variance homogeneity, and the Durbin–Watson (DW) test for residual independence. When assumptions were met, an analysis of variance (ANOVA) was performed for a completely randomized design (the experimental units were assigned randomly to different treatment groups) with eight replications, followed by the Snedecor F-test at a significance level of 0.05, to determine if there were significant differences in the mean outcomes among groups. It does this by comparing the variation within each group (due to random variation and experimental error) to the variation between the groups (which can be attributed to the effects of the treatments). Treatment means with significant F-values (p < 0.05) were separated using Tukey’s HSD test at p < 0.05. However, if assumptions were not met, data transformations were applied. If transformations did not achieve normality, non-parametric statistics with the Kruskal–Wallis test, followed by Dunn’s test for multiple comparisons at a significance level of 0.05, were employed.
Additionally, to evaluate whether the spray deposition on coffee leaves was within acceptable variability, control charts were built as part of the statistical process control (SPC) tools used to monitor process quality [14]. Individual control charts were built using individual measurements from each treatment, and moving range charts were used for variability between two consecutive measurements, following the methods described by Montgomery [15].
All statistical analyses were carried out using R software version 4.4.0 [16], and control charts were created with Minitab® software version 16.2 [17].
3. Results and Discussion
Table 2 presents the results of spray deposition on the upper coffee canopy. Applications using the airblast sprayer achieved the highest deposition values. Notably, spray volume within each application method did not significantly affect deposition. This suggests that the application method, rather than the total volume applied, has a greater influence on deposition evaluation based on mass per unit area.

Table 2.
Average deposition (μg cm−2) of tracer on the upper canopy of coffee plants by ground-based and aerial (RPA) applications under different spray volumes.
Airblast sprayers excel at delivering solutions to the coffee plant canopy. The proximity of the release point to the leaves (usually less than one meter) combined with a directed airflow from the fan ensures greater deposition of the tracer, especially in the upper part of plants.
Vitória et al. [5] evaluated fungicide application using a remotely piloted aircraft (RPA) at 5, 10, and 15 L ha−1 and a pneumatic sprayer at 400 L ha−1 in mountain coffee plantations. These authors found that ground-based application had significantly higher fungicide deposition than aerial application in all plant thirds. They suggested that further studies are needed to investigate issues related to droplet distribution uniformity and penetration using RPAs to optimize fungicide application in mountain coffee areas.
Biglia et al. [18] compared applications in vineyards using an RPA and an airblast sprayer. Similar to the present study, they observed higher deposition with ground-based equipment. The canopy near the spray and airflow sources improved the spray deposition.
Table 3 details the spray deposition in the lower zone of the coffee canopy. Due to unequal variances, a Kruskal–Wallis test followed by Dunn’s multiple comparison test was employed. Similar to the upper canopy, airblast applications achieved the highest deposition. However, no significant difference was observed between the airblast application at 300 L ha−1 and the RPA application.

Table 3.
Average deposition (μg cm-²) of tracer on the lower canopy of coffee plants by ground-based and aerial (RPA) applications under different spray volumes.
Consistent with the upper canopy results, the spray volume used in each application method did not significantly impact deposition in the lower zone. This finding aligns with Cavalaris et al. [19], who reported no notable difference in defoliant efficacy on cotton when using RPA at 10 L ha−1 compared to 16 L ha−1. Their results suggest that using lower spray volumes could enhance operational efficiency. However, increasing spray volumes generally leads to better coverages and droplet densities, as shown by Shan et al. [20]. This is particularly crucial for contact-action products that require thorough coverage for effectiveness. The need for effective and uniform spray deposition is particularly critical when applying contact-acting pesticides compared to products that also possess systemic action [21].
Table 4 shows the spray losses to the soil in the coffee inter-rows. RPA application resulted in significantly higher losses compared to ground-based application. This is likely because, unlike the targeted approach of ground sprayers, RPAs distribute the solution over the entire area, causing some spray to land on the exposed soil between the coffee rows, as indicated by the Petri dishes.

Table 4.
Average deposition (μg cm−2) of tracer on the soil in the middle of coffee inter-rows by ground-based and aerial (RPA) applications under different spray volumes.
Our experiment used 3.5 m spacing between plant rows and an estimated canopy diameter of 1.8 m, resulting in a 1.7 m exposed area susceptible to RPA spray. With a constant application rate (amount of tracer per area) for both aerial and ground-based methods, some product inevitably landed between the rows, contributing to overall losses. According to Biglia et al. [18], the comparison between the two spray application techniques in vineyards suggests that the RPA spray system, even in the best adjustment conditions, was characterized by a spray application efficiency that was lower than the one obtained by the airblast sprayer in terms of canopy spray deposition and ground losses.
One potential solution is to fly the RPA directly over the plant rows. However, given the typical working width of over four meters for current aircraft at operational flight heights, and the trend towards even larger equipment, product loss between rows would likely persist.
Interestingly, soil losses beneath the coffee canopy did not significantly differ between treatments (Table 5). Although higher spray volumes usually lead to greater runoff, the volumes used in this study (200 and 300 L ha−1) are within the standard range for coffee (200–1500 L ha−1, depending on the target pest/disease) according to Zampiroli et al. [9]. This suggests minimal runoff occurred due to the moderate volumes employed. Notably, while cultivar biometrics are crucial for optimizing spray applications, research on ideal spray volumes for coffee crops remains limited.

Table 5.
Average deposition (μg cm−2) of tracer on the soil beneath coffee canopy overhang by ground-based and aerial (RPA) applications under different spray volumes.
Visual observations revealed high variability in leaf and branch distribution within the lower canopy, especially near the soil. This variation in foliage density likely contributed to increased data variability and may have masked statistically significant differences between means, despite a trend suggesting lower soil runoff with RPA treatments.
Figure 6 shows the control charts for spray deposition in the upper coffee canopy. Leaf deposition was used as an indicator of spray operation quality and evaluated with statistical process control (SPC). All points fall within the control limits for both individual values and ranges, indicating a controlled process with random variations due to natural factors.
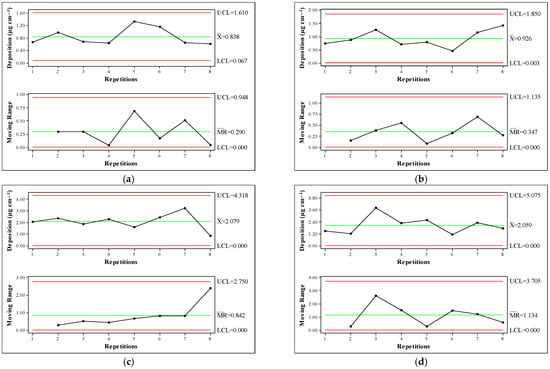
Figure 6.
Control charts for deposition (μg cm−2) of tracer on leaves of the upper coffee canopy by ground-based and aerial (RPA) applications under different spray volumes. (a) RPA (10 L ha−1); (b) RPA (20 L ha−1); (c) airblast sprayer (200 L ha−1); (d) airblast sprayer (300 L ha−1). UCL: upper control limit; : treatment average; LCL: lower control limit; (): moving averages.
Fluctuations in deposition are normal, but they should stay within acceptable limits. SPC helps assess the extent of these variations and statistically determine if the process is ‘in control’ [22]. High variability can lead to over- or under-application of the product. Process analysis based on control charts allows for intervention and adjustments to optimize performance [23].
Similarly, Figure 7 depicts control charts for deposition in the lower canopy, with all points within control limits, indicating a statistically controlled process. This confirms low variability, suggesting superior quality from a statistical standpoint and potentially stronger data reliability, as observed in studies using such methods [22].
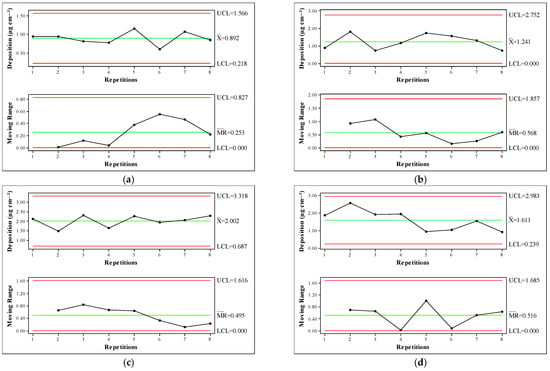
Figure 7.
Control charts for deposition (μg cm−2) of tracer on leaves of the upper coffee canopy by ground-based and aerial (RPA) applications under different spray volumes. (a) RPA (10 L ha−1); (b) RPA (20 L ha−1); (c) airblast sprayer (200 L ha−1); (d) airblast sprayer (300 L ha−1). UCL: upper control limit; : treatment average; LCL: lower control limit; : moving averages.
Suguisawa et al. [24] demonstrated the effectiveness of SPC in characterizing variability and analyzing operation quality for tractor-based herbicide spraying in wheat. Yet, similar studies on spraying are limited. Soela et al. [25] concluded that RPA spraying provides statistically superior quality in terms of leaf deposition on coffee plants. Likewise, Silva et al. [22] found that when using an airblast sprayer for coffee, control charts did not detect non-random patterns based on nozzle type or spray volume, indicating good application quality.
4. Conclusions
Ground-based application using an airblast sprayer achieved better spray deposition throughout the coffee canopy compared to the remotely piloted aircraft (RPA). The spray volume used in each application method did not have a significant impact on deposition.
The use of RPA across the entire area led to increased spray losses between coffee rows.
There was no significant difference in spray runoff to the soil beneath the coffee canopy between ground-based and aerial treatments.
Regarding spray deposition on leaves, all applications exhibited random variability, which did not impact the process. This outcome suggests that stability, control, and quality standards were maintained from a statistical perspective.
Future research could focus on using an RPA to apply treatments directly above the planting lines, ensuring the spray targets the plant canopy. The results of this study are valid only for flight paths perpendicular to the rows of plants, with full-area application.
Author Contributions
Conceptualization, J.P.A.R.d.C.; methodology, J.P.A.R.d.C., L.d.L.L., C.O.R.A. and C.B.d.A.; formal analysis, J.P.A.R.d.C., L.d.L.L. and C.O.R.A.; writing—original draft preparation, J.P.A.R.d.C.; writing—review and editing, L.d.L.L. and C.B.d.A.; supervision, J.P.A.R.d.C. All authors have read and agreed to the published version of the manuscript.
Funding
This research was partially funded by Fundação de Amparo à Pesquisa do Estado de Minas Gerais—Brazil (FAPEMIG)—APQ-00856-23, and Conselho Nacional de Desenvolvimento Científico e Tecnológico—Brazil (CNPq)—311371/2021-3.
Data Availability Statement
The original contributions presented in the study are included in the article; further inquiries can be directed to the corresponding authors.
Conflicts of Interest
The authors declare no conflicts of interest.
References
- Censo Agropecuário 2017. Available online: https://censoagro2017.ibge.gov.br/resultados-censo-agro-2017.html (accessed on 5 July 2024).
- Esgario, J.G.; de Castro, P.B.; Tassis, L.M.; Krohling, R.A. An app to assist farmers in the identification of diseases and pests of coffee leaves using deep learning. Inf. Process. Agric. 2022, 9, 38–47. [Google Scholar] [CrossRef]
- Harelimana, A.; Rukazambuga, D.; Hance, T. Pests and diseases regulation in coffee agroecosystems by management systems and resistance in changing climate conditions: A review. J. Plant Dis. Prot. 2022, 129, 1041–1052. [Google Scholar] [CrossRef]
- Dhananjayan, V.; Jayakumar, S.; Ravichandran, B. Conventional methods of pesticide application in agricultural field and fate of the pesticides in the environment and human health. In Controlled Release of Pesticides for Sustainable Agriculture; Rakhimol, K.R., Thomas, S., Volova, T., Jayachandran, K., Eds.; Springer: Berlin/Heidelberg, Germany, 2020; pp. 1–39. [Google Scholar]
- Vitória, E.L.D.; Krohling, C.A.; Borges, F.R.P.; Ribeiro, L.F.O.; Ribeiro, M.E.A.; Chen, P.; Lan, Y.; Wang, S.; Moraes, H.M.F.; Furtado Júnior, M.R. Efficiency of fungicide application an using an unmanned aerial vehicle and pneumatic sprayer for control of hemileia vastatrix and cercospora coffeicola in mountain coffee crops. Agronomy 2023, 13, 340. [Google Scholar] [CrossRef]
- Souza, F.G.; Portes, M.F.; Silva, M.V.; Teixeira, M.M.; Furtado Júnior, M.R. Impact of sprayer drone flight height on droplet spectrum in mountainous coffee plantation. Rev. Bras. Eng. Agric. E Ambient 2022, 26, 901–906. [Google Scholar] [CrossRef]
- Lasmar, O.; Ferreira, M.; Da, C.; Decaro Junior, S.T.; Fouquet, G. Efficiency of reduced volume spraying aimed to control the Leucoptera coffeella (Lepidoptera: Lyonetiidae). Biosci. J. 2016, 32, 1165–1174. [Google Scholar] [CrossRef]
- Guo, S.; Chen, C.; Du, G.; Yu, F.; Yao, W.; Yubin, L. Evaluating the use of unmanned aerial vehicles for spray applications in mountain Nanguo pear orchards. Pest Manag. Sci. 2024, 80, 3590–3602. [Google Scholar] [CrossRef] [PubMed]
- Zampiroli, R.; Alvarenga, C.B.; Parenti, M.V.; Cunha, J.P.A.R.; Celoto, F.J.; Rinaldi, P.C.N.; Sasaki, R. Spray technology for deposition of droplets on coffee leaves and fruits. Pesq. Agropec. Trop. 2021, 51, 66806. [Google Scholar] [CrossRef]
- Rodrigues, E.A.S.; Lima, S.C. Associação entre a incidência do levantamento de índice rápido de Aedes aegypti (Liraa) e as condições climáticas em Uberlândia, Minas Gerais, Brasil, entre 2014 a 2016. Caminhos de Geogr. 2019, 20, 251–263. [Google Scholar] [CrossRef]
- Google Earth Pro. Available online: https://www.google.com/earth/versions/ (accessed on 5 July 2024).
- Palladini, L.A.; Raetano, C.G.; Velini, E.D. Choice of tracers for the evaluation of spray deposits. Sci. Agric. 2005, 62, 440–445. [Google Scholar] [CrossRef]
- Baio, F.H.R.; Antuniassi, U.R.; Castilho, B.R.; Teodoro, P.E.; Silva, E.E. Factors affecting aerial spray drift in the Brazilian Cerrado. PLoS ONE 2019, 14, e0212289. [Google Scholar] [CrossRef] [PubMed]
- Oliveira, T.C.T.; Silva, A.C.G.C.; Santos, P.V.S. Aplicação do Controle Estatístico de Processo: Estudo aplicado em fabricante de chapas de gesso Drywall. Rev. Engen. Pesq. Aplic. 2023, 8, 59–66. [Google Scholar] [CrossRef]
- Montgomery, D.C. Introdução ao Controle Estatístico da Qualidade, 7th ed.; LTC: Rio de Janeiro, Brazil, 2017; p. 555. [Google Scholar]
- R Core Team. The R Foundation for Statistical Computing Platform 2020; R Foundation for Statistical Computing: Vienna, Austria, 2020; Available online: https://www.r-project.org (accessed on 23 March 2024).
- Minitab, Inc. Minitab Statistical Software™, Release 16.2.2; Minitab, Inc.: State College, PA, USA, 2010. [Google Scholar]
- Biglia, A.; Grella, M.; Bloise, N.; Comba, L.; Mozzanini, E.; Sopegno, A.; Pittarello, M.; Dicembrini, E.; Alcatrão, L.E.; Guglieri, G.; et al. UAV-spray application in vineyards: Flight modes and spray system adjustment effects on canopy deposit, coverage, and off-target losses. Sci. Total Environ. 2022, 845, 157292. [Google Scholar] [CrossRef] [PubMed]
- Cavalaris, C.; Karamoutis, C.; Markinos, A. Efficacy of cotton harvest aids applications with unmanned aerial vehicles (UAV) and ground-based field sprayers—A case study comparison. Smart Agric. Technol. 2022, 2, 100047. [Google Scholar] [CrossRef]
- Shan, C.F.; Wang, G.B.; Wang, H.H.; Xie, Y.J.; Wang, H.Z.; Wang, S.L.; Chen, S.; Lan, Y. Effects of droplet size and spray volume parameters on droplet deposition of wheat herbicide application by using UAV. Int. J. Agric. Biol. Eng. 2021, 14, 74–81. [Google Scholar] [CrossRef]
- Lesnik, M.; Pintar, C.; Lobnik, A.; Kolar, M. Comparison of the effectiveness of standard and drift-reducing nozzles for control of some pests of apple. Crop Prot. 2005, 24, 93–100. [Google Scholar] [CrossRef]
- Silva, J.E.R.; Cunha, J.P.A.R.; Siqueira, Q.N.S. Controle estatístico de processo em pulverização hidropneumática na cultura do café. Coffee Sci. 2016, 11, 11–21. [Google Scholar]
- Langner, M.; Zhou, B.; Priese, F.; Wolf, B. Statistical investigation of rotary fluidized bed agglomeration process with tangential spray and in-line particle size measurement for PAT process control. Processes 2023, 11, 1066. [Google Scholar] [CrossRef]
- Suguisawa, J.M.; Franco, F.N.; Silva, S.S.S.; Filho, A.P. Qualidade da aplicação de herbicida em lavoura de trigo. Eng. Agríc. 2007, 27, 41–47. [Google Scholar] [CrossRef][Green Version]
- Soela, D.M.; Vitória, E.L.; Oliveira, R.F.; Crause, D.H.; Freitas, I.L.J.; Locatelli, T. Controle estatístico de processo em pulverização usando veículo aéreo não tripulado na cultura do café conilon. Bras. J. Produc. Eng. 2020, 6, 52–63. [Google Scholar]
Disclaimer/Publisher’s Note: The statements, opinions and data contained in all publications are solely those of the individual author(s) and contributor(s) and not of MDPI and/or the editor(s). MDPI and/or the editor(s) disclaim responsibility for any injury to people or property resulting from any ideas, methods, instructions or products referred to in the content. |
© 2024 by the authors. Licensee MDPI, Basel, Switzerland. This article is an open access article distributed under the terms and conditions of the Creative Commons Attribution (CC BY) license (https://creativecommons.org/licenses/by/4.0/).