Article

Antioxidant Capacity in Two Different Cultivars of Ripe and Unripe Peaches Utilizing the Cloud-Point Extraction Method

by
Ioannis Giovanoudis
1,2,
Vassilis Athanasiadis
1,
Theodoros Chatzimitakos
1,
Dimitrios Kalompatsios
1,
Martha Mantiniotou
1,
Eleni Bozinou
1,
Olga Gortzi
2,
George D. Nanos
2 and
Stavros I. Lalas
1,*
1
Department of Food Science and Nutrition, University of Thessaly, Terma N. Temponera Street, 43100 Karditsa, Greece
2
Department of Agriculture Crop Production and Rural Environment, School of Agricultural Sciences, University of Thessaly, 38446 Volos, Greece
*
Author to whom correspondence should be addressed.
AgriEngineering 2023, 5(4), 2139-2154; https://doi.org/10.3390/agriengineering5040131
Submission received: 28 September 2023 / Revised: 30 October 2023 / Accepted: 7 November 2023 / Published: 8 November 2023

Abstract

:
In this study, the objective was to ascertain the optimal extraction method for the recovery of polyphenols from two peach cultivars, namely ‘Andross’ and ‘Everts’, at unripe and ripe stages. Two extraction techniques were explored: conventional extraction and cloud-point extraction (CPE), utilizing various solvents, including water, ethanol, 60% ethanol, and the surfactant Tween 80. Moreover, the conditions of CPE (such as pH, ionic strength, surfactant concentration, etc.) were optimized. To elucidate the antioxidant activity of the extracts, the total polyphenol content (TPC), the ferric-reducing antioxidant power (FRAP) assay, and the DPPH antiradical scavenging were measured. Our findings indicate that CPE is a superior method for polyphenol recovery. Unripe fruits had more antioxidants than ripe ones. Unripe ‘Andross’ fruit has a TPC of 1465.32 mg gallic acid equivalents per kilogram (mg GAE/kg). FRAP and DPPH levels were 7.33 and 5.12 mmol ascorbic acid equivalents (AAE/kg), respectively. With a TPC of 1714.53 mg GAE/kg, the unripe fruit from the ‘Everts’ cultivar has even more antioxidant capacity. Additionally, its FRAP and DPPH values were increased at 8.57 and 6.08 mmol AAE/kg, respectively. These findings underscore the efficacy of CPE as a preferred method for polyphenol extraction while also highlighting the enhanced antioxidant potential of unripe peaches, particularly in the ‘Everts’ cultivar.

1. Introduction

Prunus persica, commonly known as peach, is classified as a member of the Rosaceae family and is cultivated in many regions across the globe. The fruit is classified as a stone fruit in botanical terms [1]. Presently, it is approximated that there exist about 400 varieties worldwide [2,3]. Peach fruits grow from perennial trees rather than annual crops [4]. The economic importance of peach cultivation is particularly pronounced in the Mediterranean region [5]. These fruits are immediately consumable after harvesting and do not require further ripening. Furthermore, their optimal picking time can be determined through straightforward visual analysis associated with alterations in skin color [4,6]. Both fresh fruit and value-added processed products, such as juices, jellies, and/or canned fruit, are popular among consumers [7].
The phytochemical composition of P. persica fruits is significantly impacted by the cultivar and genotype, rootstock, climatic conditions, geographic conditions, agronomic processes, weather conditions, the maturity stage during harvest, and storage conditions [8,9]. Peaches are composed of various essential compounds, including minerals, carbohydrates, dietary fiber, organic acids, and vitamins [10]. The multiple chemical compounds contained have a vital role in numerous significant biochemical processes within the human body [11]. The dietary fiber found in peaches is a useful component present in both the peel and pulp. This fiber has been shown to have a positive impact on gastrointestinal health [10]. Additionally, peaches contain numerous antioxidants, such as vitamins A, B complex, and C, carotenoids [9,12,13], phenolic acids, flavonoids, and anthocyanins [14]. Several polyphenols have been identified in their composition, including catechin, neochlorogenic and chlorogenic acids, epicatechin, as well as derivatives of cyanidin and quercetin [15]. Nevertheless, significant variations in content can be observed among different varieties [10]. Previous studies have demonstrated that phenolic compounds found in peaches exhibit various health benefits, including antioxidant activity [16,17,18], anti-allergic and anti-inflammatory properties [9,19], antibacterial activity [1,20], antiproliferative activity [21], as well as chemopreventive and anticancer properties [22,23,24]. In addition, it has benefits for cardiovascular, ophthalmological, dental health, and anti-diabetic properties [25].
The growing demand for stone fruits is driven by their high potential for medicinal benefits. However, concerns have been raised among some consumers regarding issues associated with the processing of these fruits [26]. There is a lack of information available regarding the potential utilization of unripe peach fruit. This aspect can exhibit a wide range of physicochemical properties that are significant for promoting health advantages [26]. Furthermore, the utilization of bioactive compounds derived from unripe young fruits has been extensively employed in the fields of food preservation and functional additives [27]. Hence, it is imperative to elucidate the chemical composition of peaches exhibiting diverse physicochemical properties and assess their in vitro antioxidant capacities using a range of methodologies. The optimal utilization of unripe fruit holds considerable importance in the development of food products. That promotes human health and enhances their economic value [27]. The parameters in question exhibit significant variation across different cultivars [26].
Several novel methodologies, including micellar extraction, dispersive liquid–liquid extraction, aqueous two-phase extraction, and cloud-point extraction (CPE), have been developed [28,29]. Nevertheless, it is important to acknowledge that liquid–liquid extraction techniques come with certain limitations. These limitations encompass the formation of emulsions, the utilization of organic solvents, and the generation of pollutants. All of the above are noteworthy drawbacks despite the potential advantages they may offer. These factors contribute to the arduousness, high expenses, and lack of ecological sustainability of the process [30]. Hence, there exists a significant motivation to explore and develop technologies aimed at the retrieval and repurposing of nutrients from food waste [31]. The application of CPE represents a viable and environmentally conscious method for extracting bioactive compounds obtained from botanical origins [32]. This extraction method exhibits promising prospects for implementation across diverse sectors, including pharmaceuticals and the food industry. The CPE method is an economically efficient and uncomplicated technique for extracting bioactive compounds from liquid matrices by employing surfactants [33]. In summary, the experimental protocol leads to the CPE method. This procedure is a single extraction method that has the potential to be replicated in order to increase the efficiency of recovering bioactive compounds [34]. The utilization of surfactants that meet food-grade standards enables the extraction of specific compounds, thereby facilitating their direct integration into food items. Micelles are generated when the concentration of molecules in aqueous solutions reaches a critical threshold. These micelles exist in a state of dynamic equilibrium with the monomers present in the surrounding bulk aqueous solution [35]. The process of separation can be achieved by associating hydrophilic and hydrophobic molecules with these structures via dipole–dipole interactions and hydrogen bonding. The successful isolation of bioactive compounds has been achieved through the utilization of various surfactants, including Triton X-114, Triton X-100, and Span 80 [34].
There is a limited amount of research available on the process of polyphenol extraction from peach cultivars utilizing CPE based on the latest information. There remains a lack of specific inquiries that center on the extraction of polyphenols from peaches. The purpose of this study was to investigate the viability of CPE, with the use of a non-toxic, food-grade surfactant (Tween 80), for the extraction of polyphenols from peach fruits. The study focused on the examination of two different peach cultivars, specifically ‘Andross’ and ‘Everts’, at two distinct stages of ripening, unripe and ripe. The primary goal of this investigation was to discover the ripening stage and cultivar that exhibits the greatest antioxidant capacity. The assessment involved the evaluation of various parameters, including the pH value, concentrations of solvent/surfactant, as well as multiple steps of CPE. The investigation also encompassed the evaluation of the total polyphenol content (TPC), ferric-reducing antioxidant power (FRAP), and antiradical activity (DPPH) of the polyphenols extracted from both peach cultivars and their respective stages of ripeness.

2. Materials and Methods

2.1. Chemicals, Reagents, and Materials

Gallic acid, Folin–Ciocalteu reagent, and anhydrous sodium carbonate were purchased from Penta (Prague, Czech Republic). Hydrochloric acid, sodium hydroxide pellets, methanol, ethanol, iron chloride (hexahydrate), L-ascorbic acid, 2,4,6-tris(2-pyridyl)-s-triazine (TPTZ), and DPPH (1,1-diphenyl-2-picrylhydrazyl) were all bought from Sigma-Aldrich (Steinheim, Germany). Tween 80 was purchased from Panreac (Barcelona, Spain). Sodium chloride was bought from Carlo Erba (Milano, Italy). Citric acid anhydrous was from Merck (Darmstadt, Germany). Deionized water was produced using a deionizing column in order to carry out the experiments.
The samples were harvested from two commercial peach orchards dedicated to canning, focusing on two different unripe cultivars along with their ripe counterparts: ‘Andross’ as a mid-season variety and ‘Everts’ as a late-season variety. The orchards were situated in Pella, a region in the northern part of Greece. Additionally, trees of both varieties were cultivated in accordance with the specific horticultural practices observed in the local area. Both cultivars of peaches were planted within the same field, utilizing an identical cultivation system. Based on the cultivation methodology employed in the orchard, the process involved the selective removal of unripe fruit approximately 4 weeks after the blossoming stage, while ripe fruits were harvested at the point of physiological maturity. Five trees and eight fruits from each tree were chosen at random. In addition, the angle at which the fruit faces the sun was investigated. The coded names of the peach cultivars, along with their ripeness, are: ‘Andross unripe’ (AU), ‘Andross ripe’ (AR), ‘Everts unripe’ (EU), and ‘Everts ripe’ (ER).

2.2. Determination of Physicochemical Parameters

The measurement of fruit weight was conducted utilizing an electronic analytical digital scale balance (Kern PLS 3100-2F (Kern & Sohn GmbH, Balingen, Germany)). The quantification of water was assessed, as previously published [36], by drying the sample at 105 °C for 24 h. The physicochemical properties of peach fruits, such as pH, titratable acidity, and soluble solids, were assessed. The peaches were washed, chopped, depitted, and blended. The pH values were measured in the following pulp using a pH meter (XS Instruments, PC 60 VioLab with XS 201T DHS digital electrode, Carpi, Modena, Italy). Then, the pulp underwent filtration, and the resulting supernatant was used for the quantification of total soluble solids (TSS) content and titratable acidity (TA). Centrifugation was employed at 4500× g for 10 min to initially separate the solid components within the peach pulp. The TA of both ripe and unripe peach juice was determined through a classic titration method, wherein the results were expressed as % w/w of malic acid. The determination involved the dilution of 2 mL of supernatant with 20 mL of deionized water and subsequently titrating it to a pH of 8.1 using 0.1 M NaOH through acid–base titration [27]. The TSS, measured in Brix, was determined using a refractometer (Quartz/Digital Abbe refractometer, Medline Scientific Limited, Oxon, UK).

2.3. Colorimetry Analysis

A colorimeter (Lovibond CAM-System 500, The Tintometer Ltd., Amesbury, UK) was used to determine the exact color of the fruit. The results were recorded as the psychometric index L* (lightness) and the two-color coordinates a* (redness) and b* (yellowness). Three measurements were taken and averaged from different locations on each sample.

2.4. CPE Procedure

Peach pulp was combined with water in a solid-to-liquid ratio of 1:1 and left at room temperature (25 °C) for 1 h. Peach juice was centrifuged for 20 min at 4500× g using a Remi Neya 16R (Remi Elektrotechnik Ltd., Palghar, India) to separate the solids. Before being processed with CPE, solid-free peach juice was acidified with 0.6 M citric acid [37].
The CPE method employed in this study was adapted from a previously published study [38] with some modifications. Briefly, peach juice (50 mL) was combined with sodium chloride (6% w/v) and Tween 80 surfactant (5% w/v), which were found to be the most optimum conditions (vide infra). A magnetic stirrer (Heidolph MR Hei-Standard, Schwabach, Germany) was used to maintain a steady temperature in the mixture while it was heated and stirred. Each sample was stirred at 800 rpm for 20 min at 45 °C. The surfactant phase was viscous, whereas the mixture was centrifuged for 5 min at 3500× g before being decanted (first extraction step). The quantities of both surfactant and water were determined after centrifugation. The water phase was then disposed of, and the procedure described above was carried out again (second extraction step) to increase polyphenol recovery. All recovery values represent the mean of three independent extraction experiments conducted under the same conditions as the initial CPE experiment.
The objective of the experiments was to optimize the CPE key parameters, pH, ionic strength, and surfactant concentration. The investigation initially focused on determining the optimum pH value for the extraction of polyphenols. The pH value was adjusted with citric acid or sodium hydroxide at a range of 2.50–6.50 and was verified with a digital pH meter (XS Instruments, PC 60 VioLab with XS 201T DHS digital electrode, Carpi, Modena, Italy). After that, the optimal salt concentration (2–8% w/v) that enhanced polyphenol extraction via the salting-out effect was then determined using the optimal pH value. By selecting the optimum parameters in pH and salinity, the concentration of Tween 80 surfactant was finally tested for further antioxidant assays.

2.5. Conventional Extraction Procedure

For the extraction, a previously described process [39] was followed, with some alterations. One gram of peach pulp was put into a glass beaker, where it was combined with 20 mL of the extraction solvent (water or ethanol, or 60% ethanol). The extraction was carried out by stirring at 800 rpm for 20 min at 45 °C.

2.6. Polyphenol Recovery

The recovery of polyphenols was calculated using a polyphenol mass balance. The evaluation of surfactant recovery was performed using a previously established method [38] and the Equation (1) below:
Recovery   % = C s   · V s C 0 · V 0   ×   100 = C 0 · V 0 C w   · V w C 0   · V 0   ×   100
where Cs is the polyphenol concentration in the surfactant phase volume Vs, C0 is the polyphenol concentration in the initial sample volume V0 (10 mL), and Cw is the polyphenol concentration in the water phase volume Vw.
Using the Folin–Ciocalteu method, the average concentration of each phase was calculated (vide infra) and was expressed as mg GAE/kg of fresh weight (fw).

2.7. Quantification of Total Polyphenol Content

A modified Folin–Ciocalteu method [39] was used to photometrically calculate total polyphenol content (TPC). After mixing 100 μL of the sample extract with 100 μL of the Folin–Ciocalteu reagent and shaking for 2 min, 800 μL of 5% sodium carbonate solution was then added. After 20 min of incubation at 40 °C in the absence of light, the absorbance of the solution was measured at 750 nm using a Shimadzu spectrophotometer (UV-1700, Shimadzu Europa GmbH, Duisburg, Germany). The results were reported as mg GAE/kg of fw.

2.8. Ferric-Reducing Antioxidant Power (FRAP) Assay

The FRAP investigation employed a technique that had been previously described by Shehata et al. [40]. A total of 50 μL of the sample was combined with 50 μL of FeCl3 solution (4 mM in 0.05 M HCl) within an Eppendorf tube. The resulting mixture was then subjected to an incubation period of 30 min at 37 °C. Subsequently, 900 μL of TPTZ solution (1 mM in 0.05 M HCl) was added, and the absorbance at 620 nm was measured after 5 min. The ferric-reducing power (PR) was determined using a calibration curve that was constructed using ascorbic acid (CAA) in 0.05 M HCl, with concentrations ranging from 0.05 to 0.5 mmol/L. The PR was quantified as mmol of ascorbic acid equivalents (AAE) per kilogram of fw, as determined by the following Equation (2):
P R   ( mmol   AAE / kg   fw ) = C AA   ×   V w
where V (in L) is the total volume of the extraction medium and w (in kg) is the initial fresh weight of the sample.

2.9. Evaluation of Antiradical Activity (DPPH Assay)

A modified DPPH method, as previously established by Shehata et al. [40], was used to evaluate the polyphenols recovered from the surfactant phase following CPE treatment for their antiradical activity (AAR). In short, a total volume of 4 mL of the sample was combined with 1 mL of a 0.1 mM DPPH solution in methanol. The mixture was homogenized and subsequently incubated for 30 min at room temperature in the absence of light. The absorbance was measured at 517 nm. In addition, a control sample consisting of a DPPH solution and methanol in place of the sample was employed, and the absorbance was instantly tracked. The percentage of scavenging was determined by the following Equation (3):
%   Scavenging = A control A sample A control   ×   100
variables Acontrol and Asample represent the absorbances of the control and sample, respectively.
Antiradical activity (AAR) was obtained as mmol ascorbic acid equivalents (AAE) per kg of fw using a calibration curve for ascorbic acid and the following Equation (4):
A AR   ( mmol   AAE / kg   fw ) = C AA   ×   V w
where V (in L) is the volume of the extraction medium, and w (in kg) is the initial fresh weight of the sample.

2.10. Statistical Analysis

Each analysis was conducted thrice. The results were reported as the average values of three repeated measurements, along with the standard deviation. The Kruskal–Wallis test was employed to examine statistically significant differences, following the application of the Kolmogorov–Smirnov test to assess the data. Statistical significance was determined at a significance level of p < 0.05. Principal Component Analysis (PCA) and Multivariate Correlation Analysis (MCA) were carried out utilizing JMP® Pro 16 software (SAS, Cary, NC, USA).

3. Results and Discussion

3.1. Physicochemical Parameters of Peach Cultivars

Prior to the development and optimization of the extraction procedure, a comprehensive analysis of the physicochemical parameters of the peach samples was conducted. The results are presented in Table 1. As anticipated, unripe fruits exhibited reduced water content and weight, whereas ripe fruits demonstrated a notable increase in weight and water content, where the ‘Andross’ fruits weighed 220.50% more and the ‘Everts’ 146.07% more, and their water content was 16.54% and 17.69% higher, respectively. The TA measured as % w/w malic acid, varied between 0.28 and 0.81, the TSS between 6.12 and 12.61, and the pH values between 3.65 and 4.27. There are no statistically significant differences (p > 0.05) between the two cultivars, except for the pH values of the ripe fruits. The TSS/TA ratio was employed in the evaluation of the Sweetness Index, yielding a range of values between 8.46 and 8.65 for the unripe fruits and 38.35 and 38.64 for the ripe fruits, which suggests a relatively diminished level of sweetness when the fruits are unripe, but they have an elevated sweetness level when ripen, in both cultivars. The TA/TSS ratio was employed in the calculation of the Astringency Index, resulting in values of 0.12 when it comes to the unripe fruits and 0.03 when the ripe fruits were measured in both cultivars. In general, a high acidity level in peaches indicates ripeness, as measured by the acidic pH of the fruits of both cultivars and their low sweetness level prior to harvesting. These values are in accordance with the findings presented in a previous study [39]. Table 1 also reports the color parameters of the peaches. In the ‘Andross’ cultivar, the L*, a*, and b* values were 16.43, 299.06, and 50.87% higher, respectively, in the ripe fruit. However, in the ‘Everts’ cultivar, L* and a* were 17.29% and 306.85% higher in the ripe fruit, but b* was 70.23% lower. Carotenoids are responsible for the vibrant color of peach fruit, but their concentration and pattern of distribution differ between varieties, as well as between the peel and the flesh of the fruit [41,42,43]. Furthermore, it exhibits a positive correlation with various quality parameters of peaches and nectarines, thereby serving as a significant determinant in the opinion of the consumer for the fruit quality [43].

3.2. Optimization of the Extraction Procedure
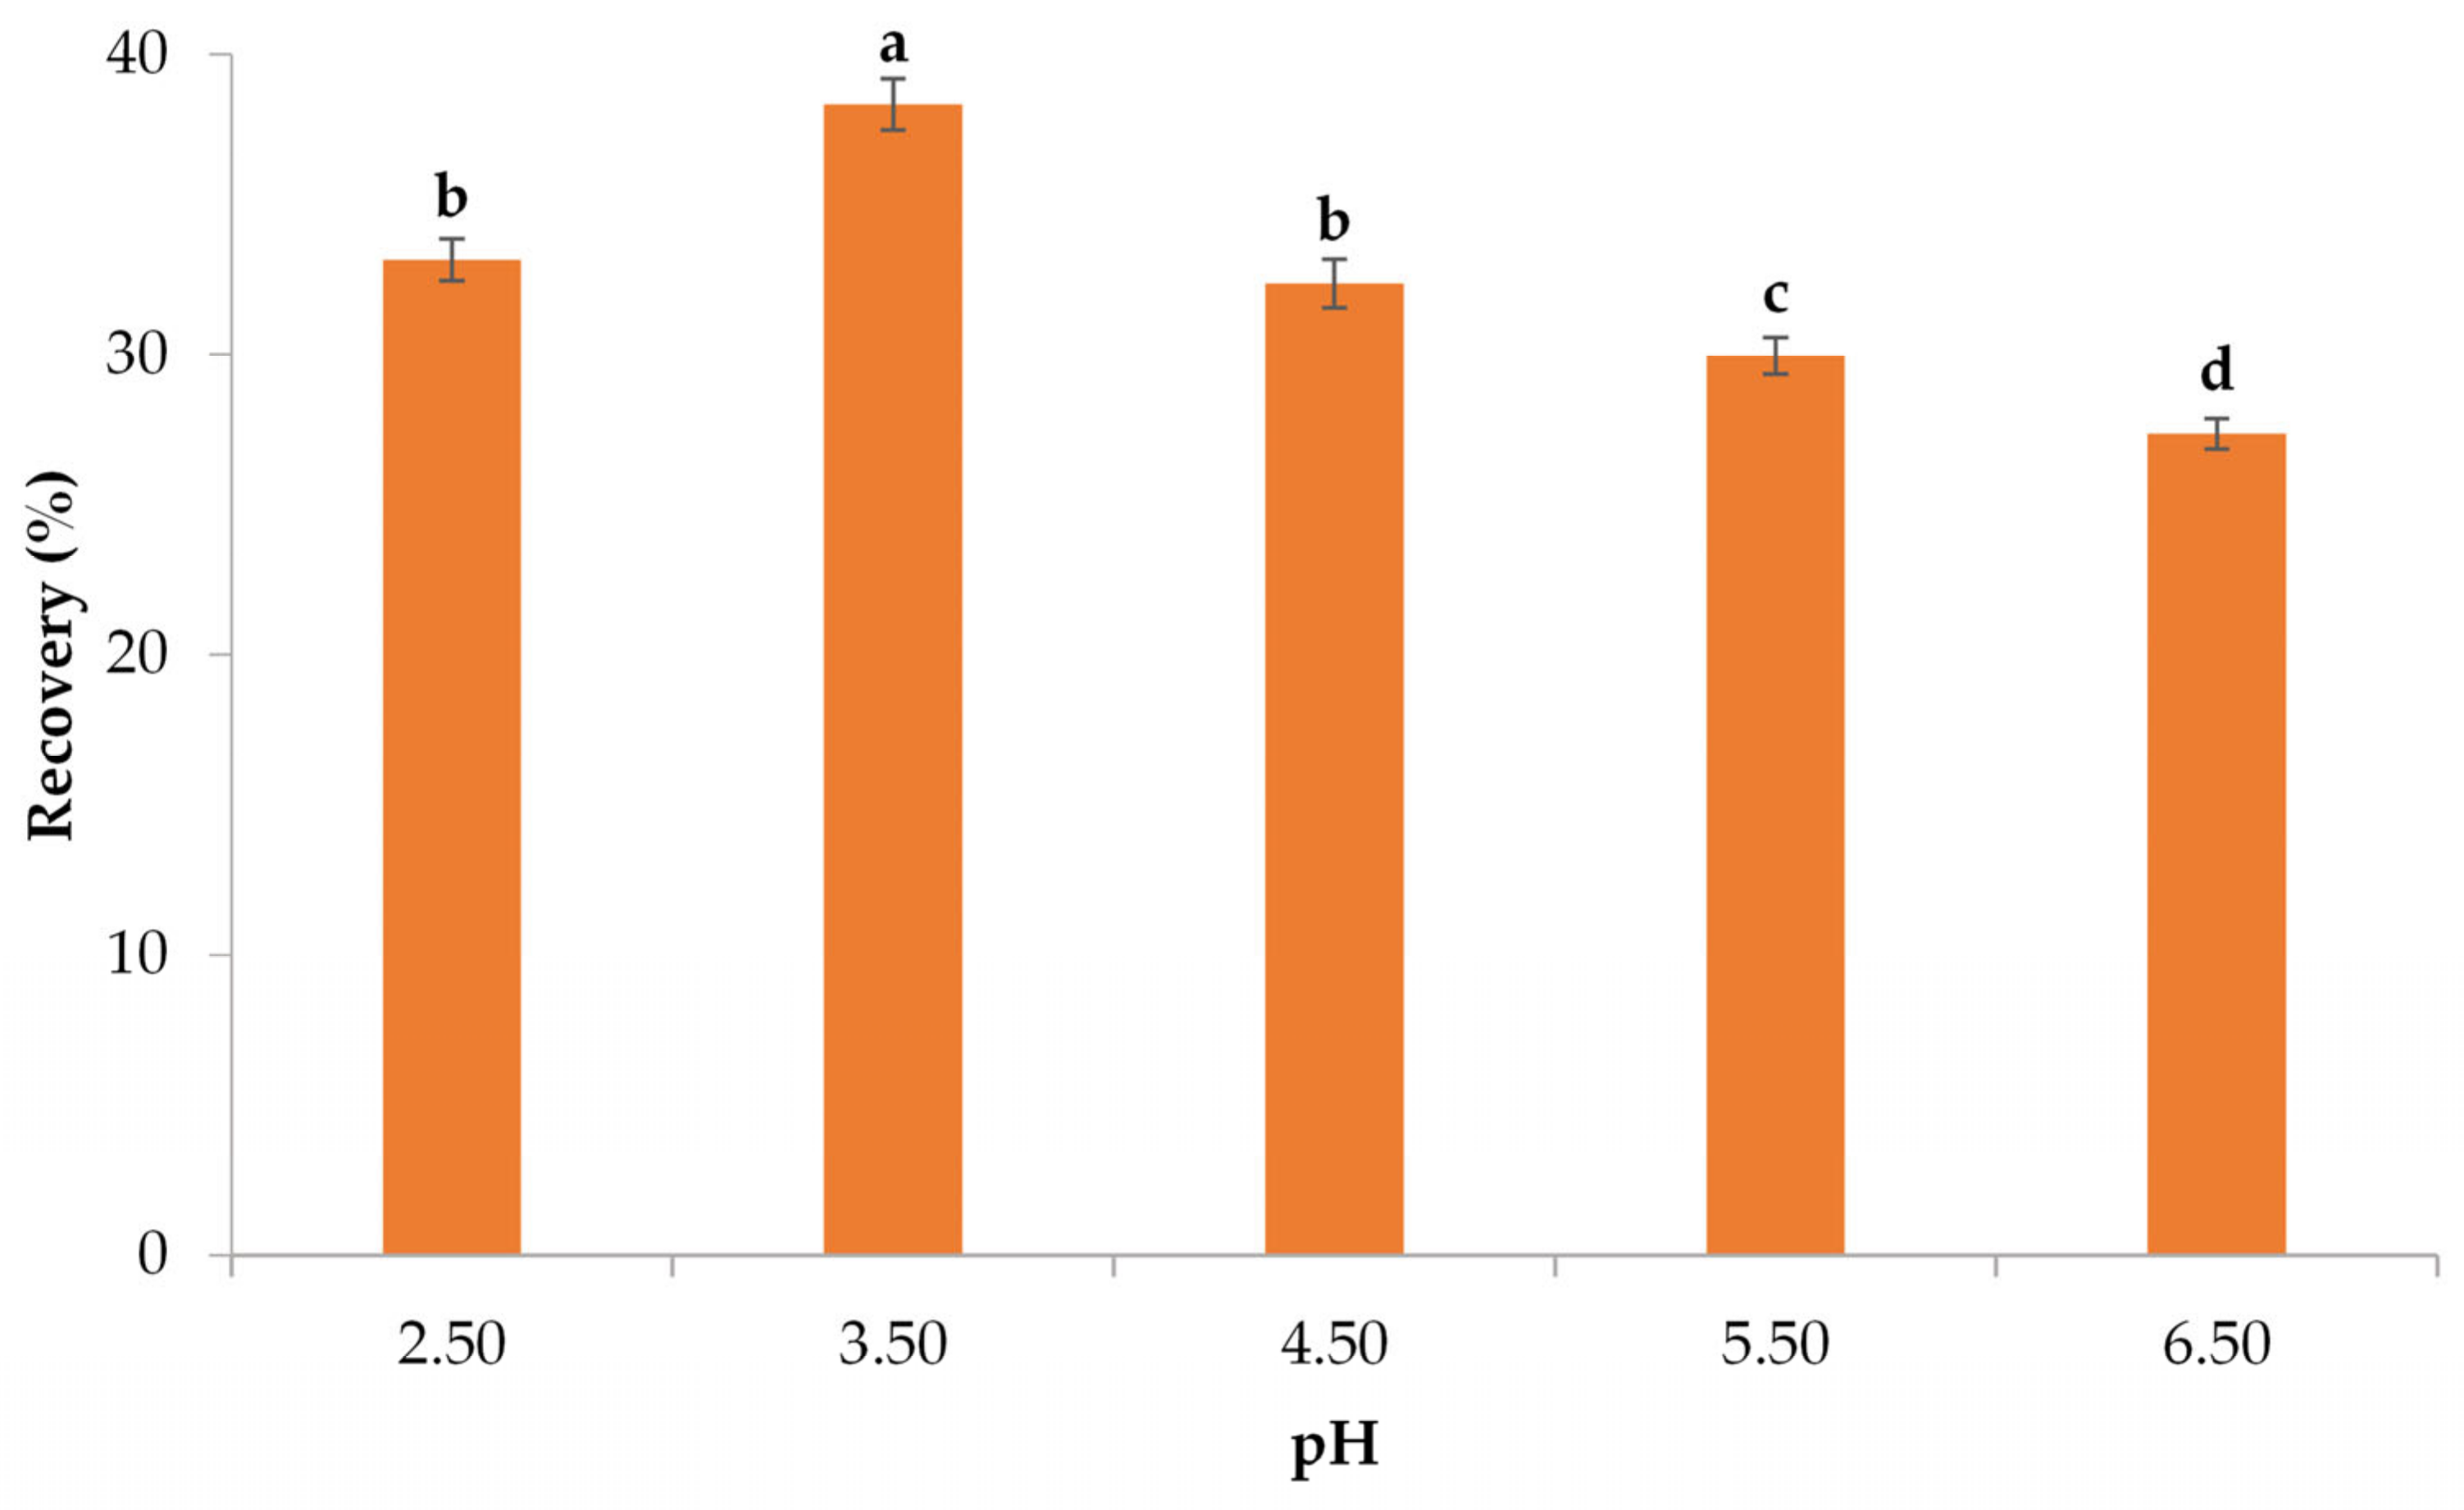
The key parameters affecting the CPE process were optimized to maximize the recovery of polyphenols from the peach samples. To achieve this, the impact of pH and sodium chloride concentration were initially investigated. Heating must be supplied for the CPE to be performed. Heating helps the mixture reach its cloud point temperature, resulting in the formation of micelles, which encapsulate the bioactive compounds [34]. Nevertheless, extensive heating may harm the extracted compounds, so caution is required. Therefore, all the experiments were conducted at a cloud-point temperature of 45 °C in accordance with a previous study [35]. As an aspect of optimizing compound recovery, the use of Tween 80 was examined in three distinct concentrations (2, 5, and 10% w/v). Tween 80 was used at the lowest concentration (2% w/v) for the first three experiments.

3.2.1. Impact of pH

The pH of the sample has a pivotal impact on the recovery of bioactive compounds. Reducing the solubility of the analyte in the aqueous phase through pH optimization may provide enhanced recovery of the analyte. Thus, an investigation was conducted to examine the impact of various pH levels on the recovery of polyphenols. The findings are illustrated in Figure 1. The extraction of polyphenols is significantly influenced by the value of pH. The optimal recovery was observed when the pH was precisely adjusted to a value of 3.50. A statistically significant decrease in the extraction recovery of 15.36% was observed when the pH was adjusted to 2.50 (p < 0.05). Similarly, when the pH value was raised from 3.50 to 4.50, there was a reduction of 18.21% in the recovery of polyphenols. Furthermore, as the pH was further increased, there was a subsequent decline in the retrieval of polyphenols (27.67% for a pH value of 5.5 and 39.78% for a pH value of 6.50). The findings are consistent with prior studies [36,44], which indicate that the optimal pH range for polyphenol extraction through CPE is between 2.50 and 3.50. Especially in the study conducted by Katsoyannos et al. [36], it was proved that Tween 80 results in the maximum recovery of polyphenols in this pH range.

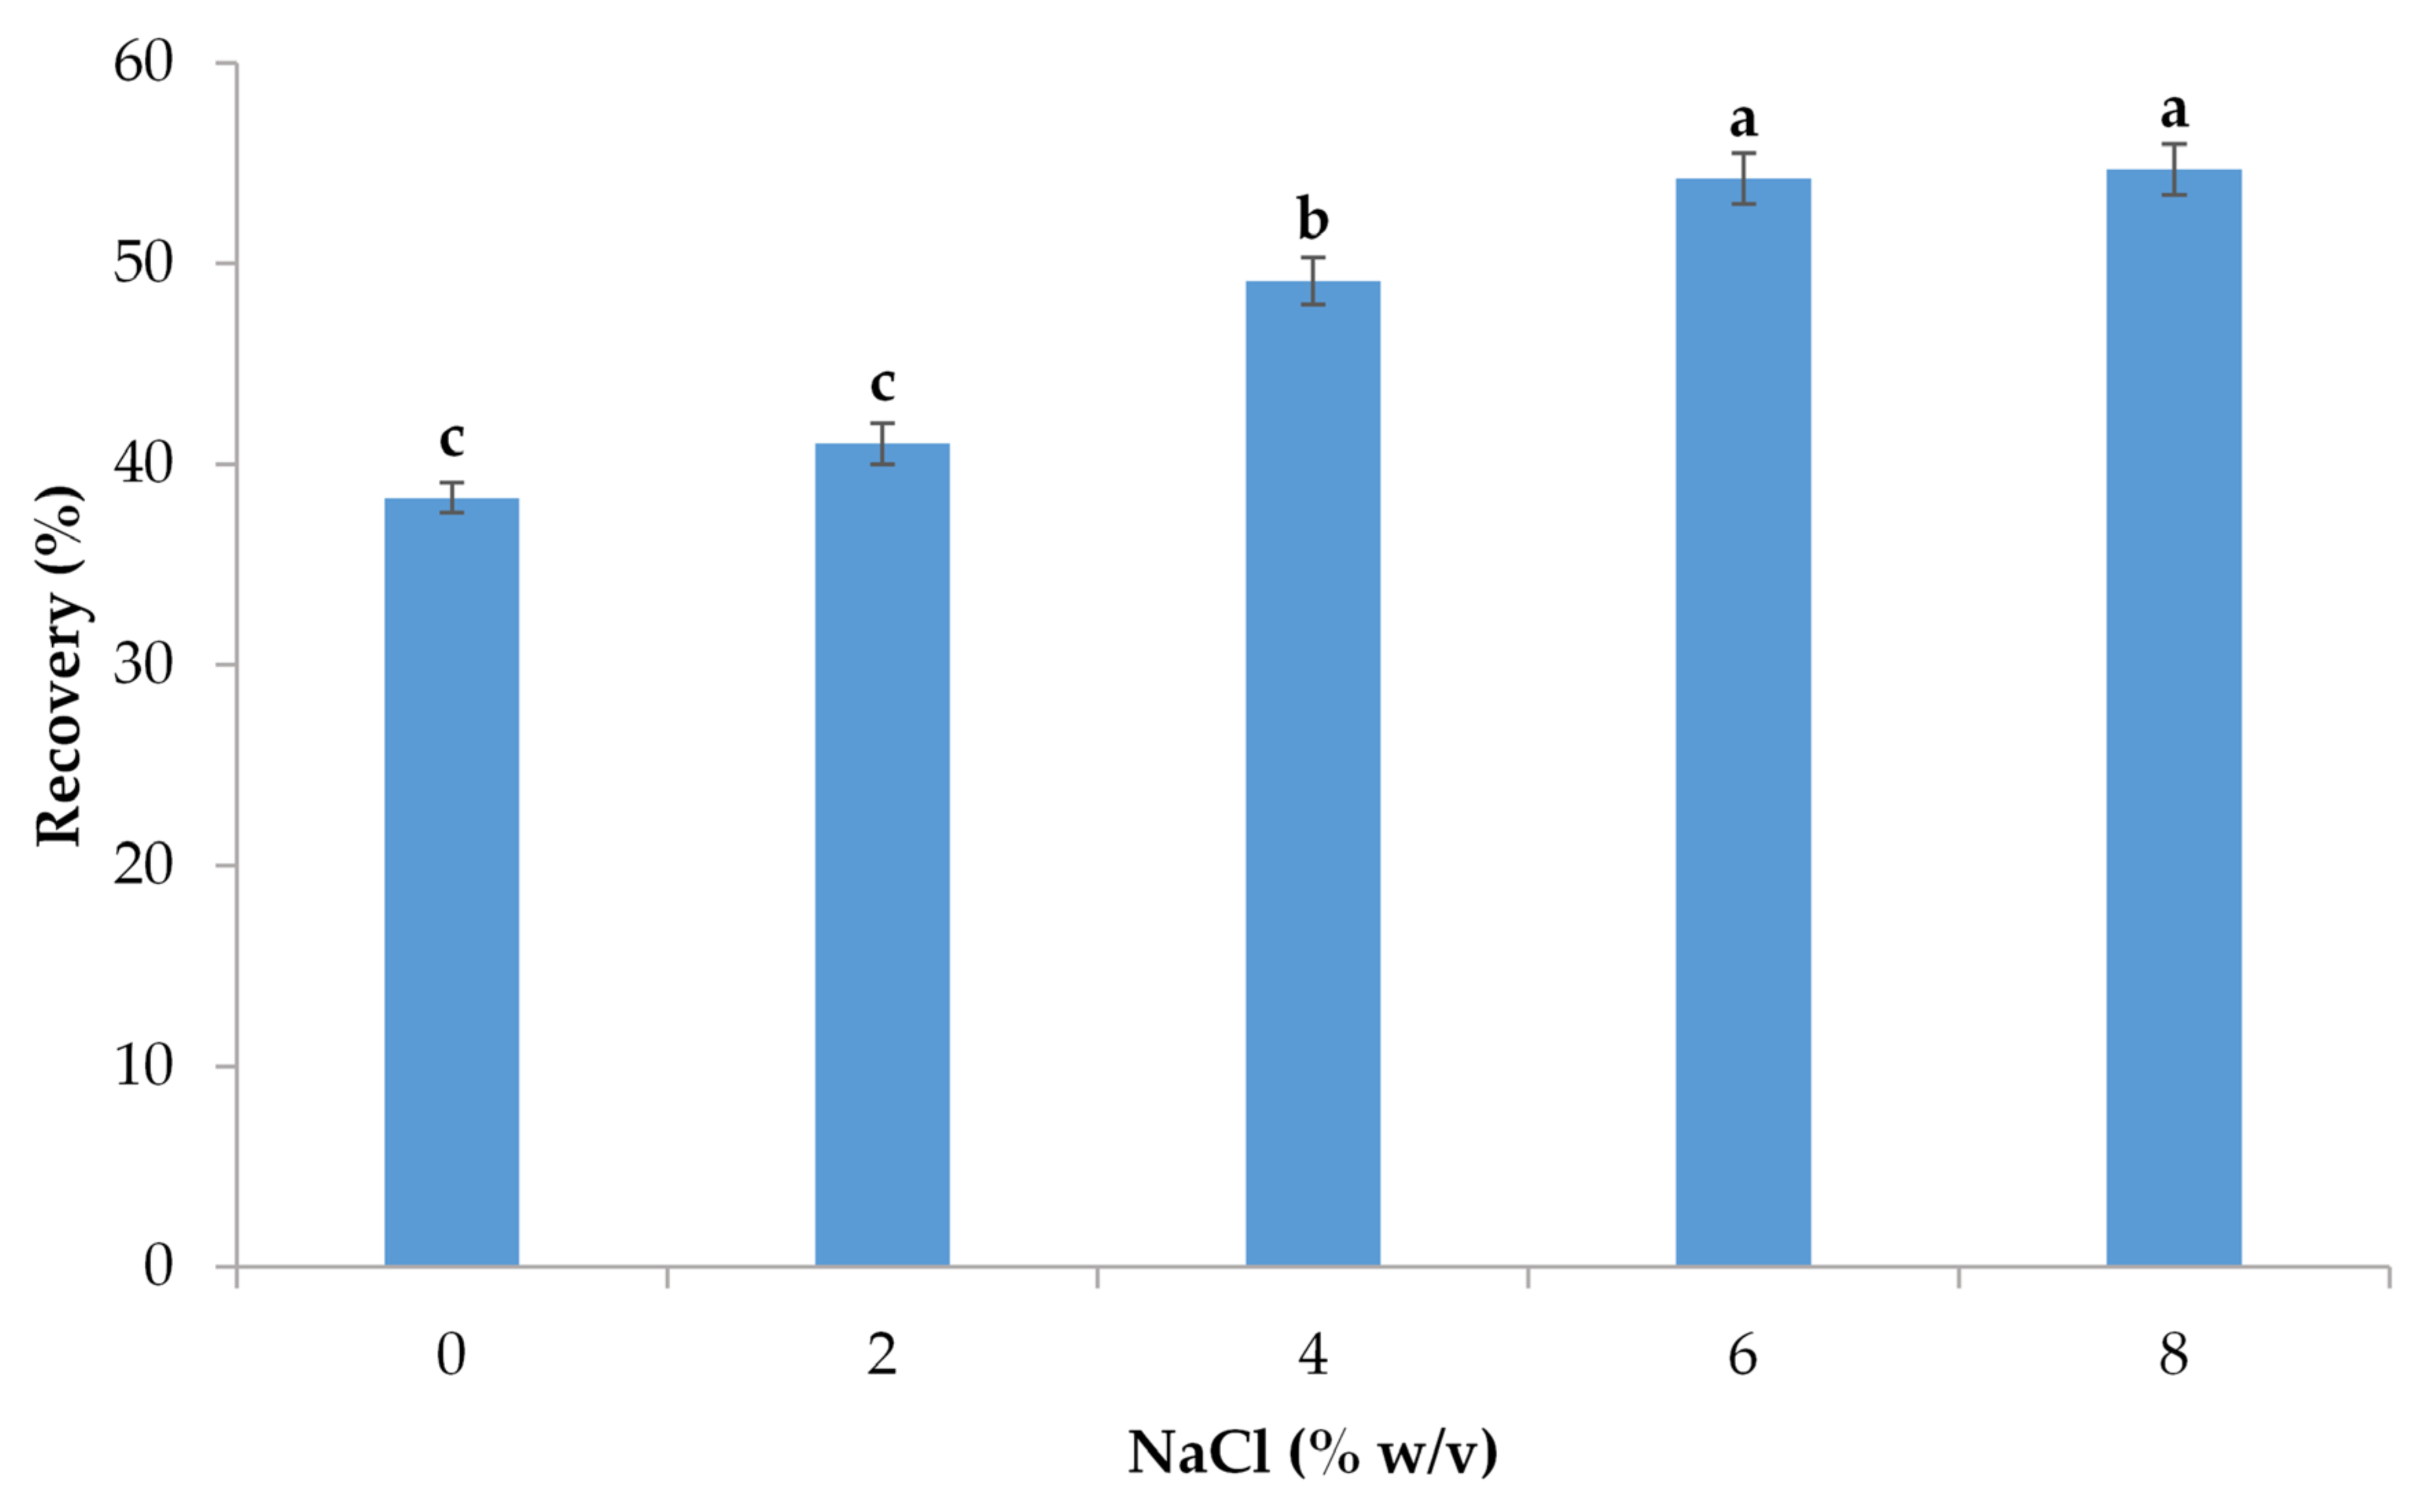
3.2.2. Impact of Ionic Strength

The influence of ionic strength on the efficacy of organic compound extraction is widely known. To promote the phase separation, sodium chloride was applied to the samples to increase the density of the aqueous phase. This salt also reduces the temperature at which clouds can be formed through the ionic strength [45]. The solubility of organic compounds is reduced when the ionic strength of the solution is increased, a process known as the salting-out effect. Consequently, this effect assists the extraction process [46]. Furthermore, salt has been proven to enhance the extraction process by reducing the cloud-point temperature and facilitating phase separation, in addition to its salting-out effect [47,48]. Therefore, an evaluation of the impact of sodium chloride on the recovery of polyphenols was conducted. The outcomes are depicted in Figure 2. The observed pattern indicates a positive correlation between the concentration of sodium chloride and the recovery of polyphenols. The highest level of recovery, amounting to 54.71%, was achieved through the addition of a solution of sodium chloride with a concentration of 8% w/v. However, statistically non-significant differences were observed with 8 and 6% w/v. To reduce salt usage on a potential industrial scale, the experiments were conducted using a concentration of 6% w/v. Hence, the observed improvements in extraction percentages cannot be solely identified as the salting out phenomenon but rather as a synergistic interaction of the factors mentioned above. The optimization phase produced positive results, which was consistent with previous studies [36,44].

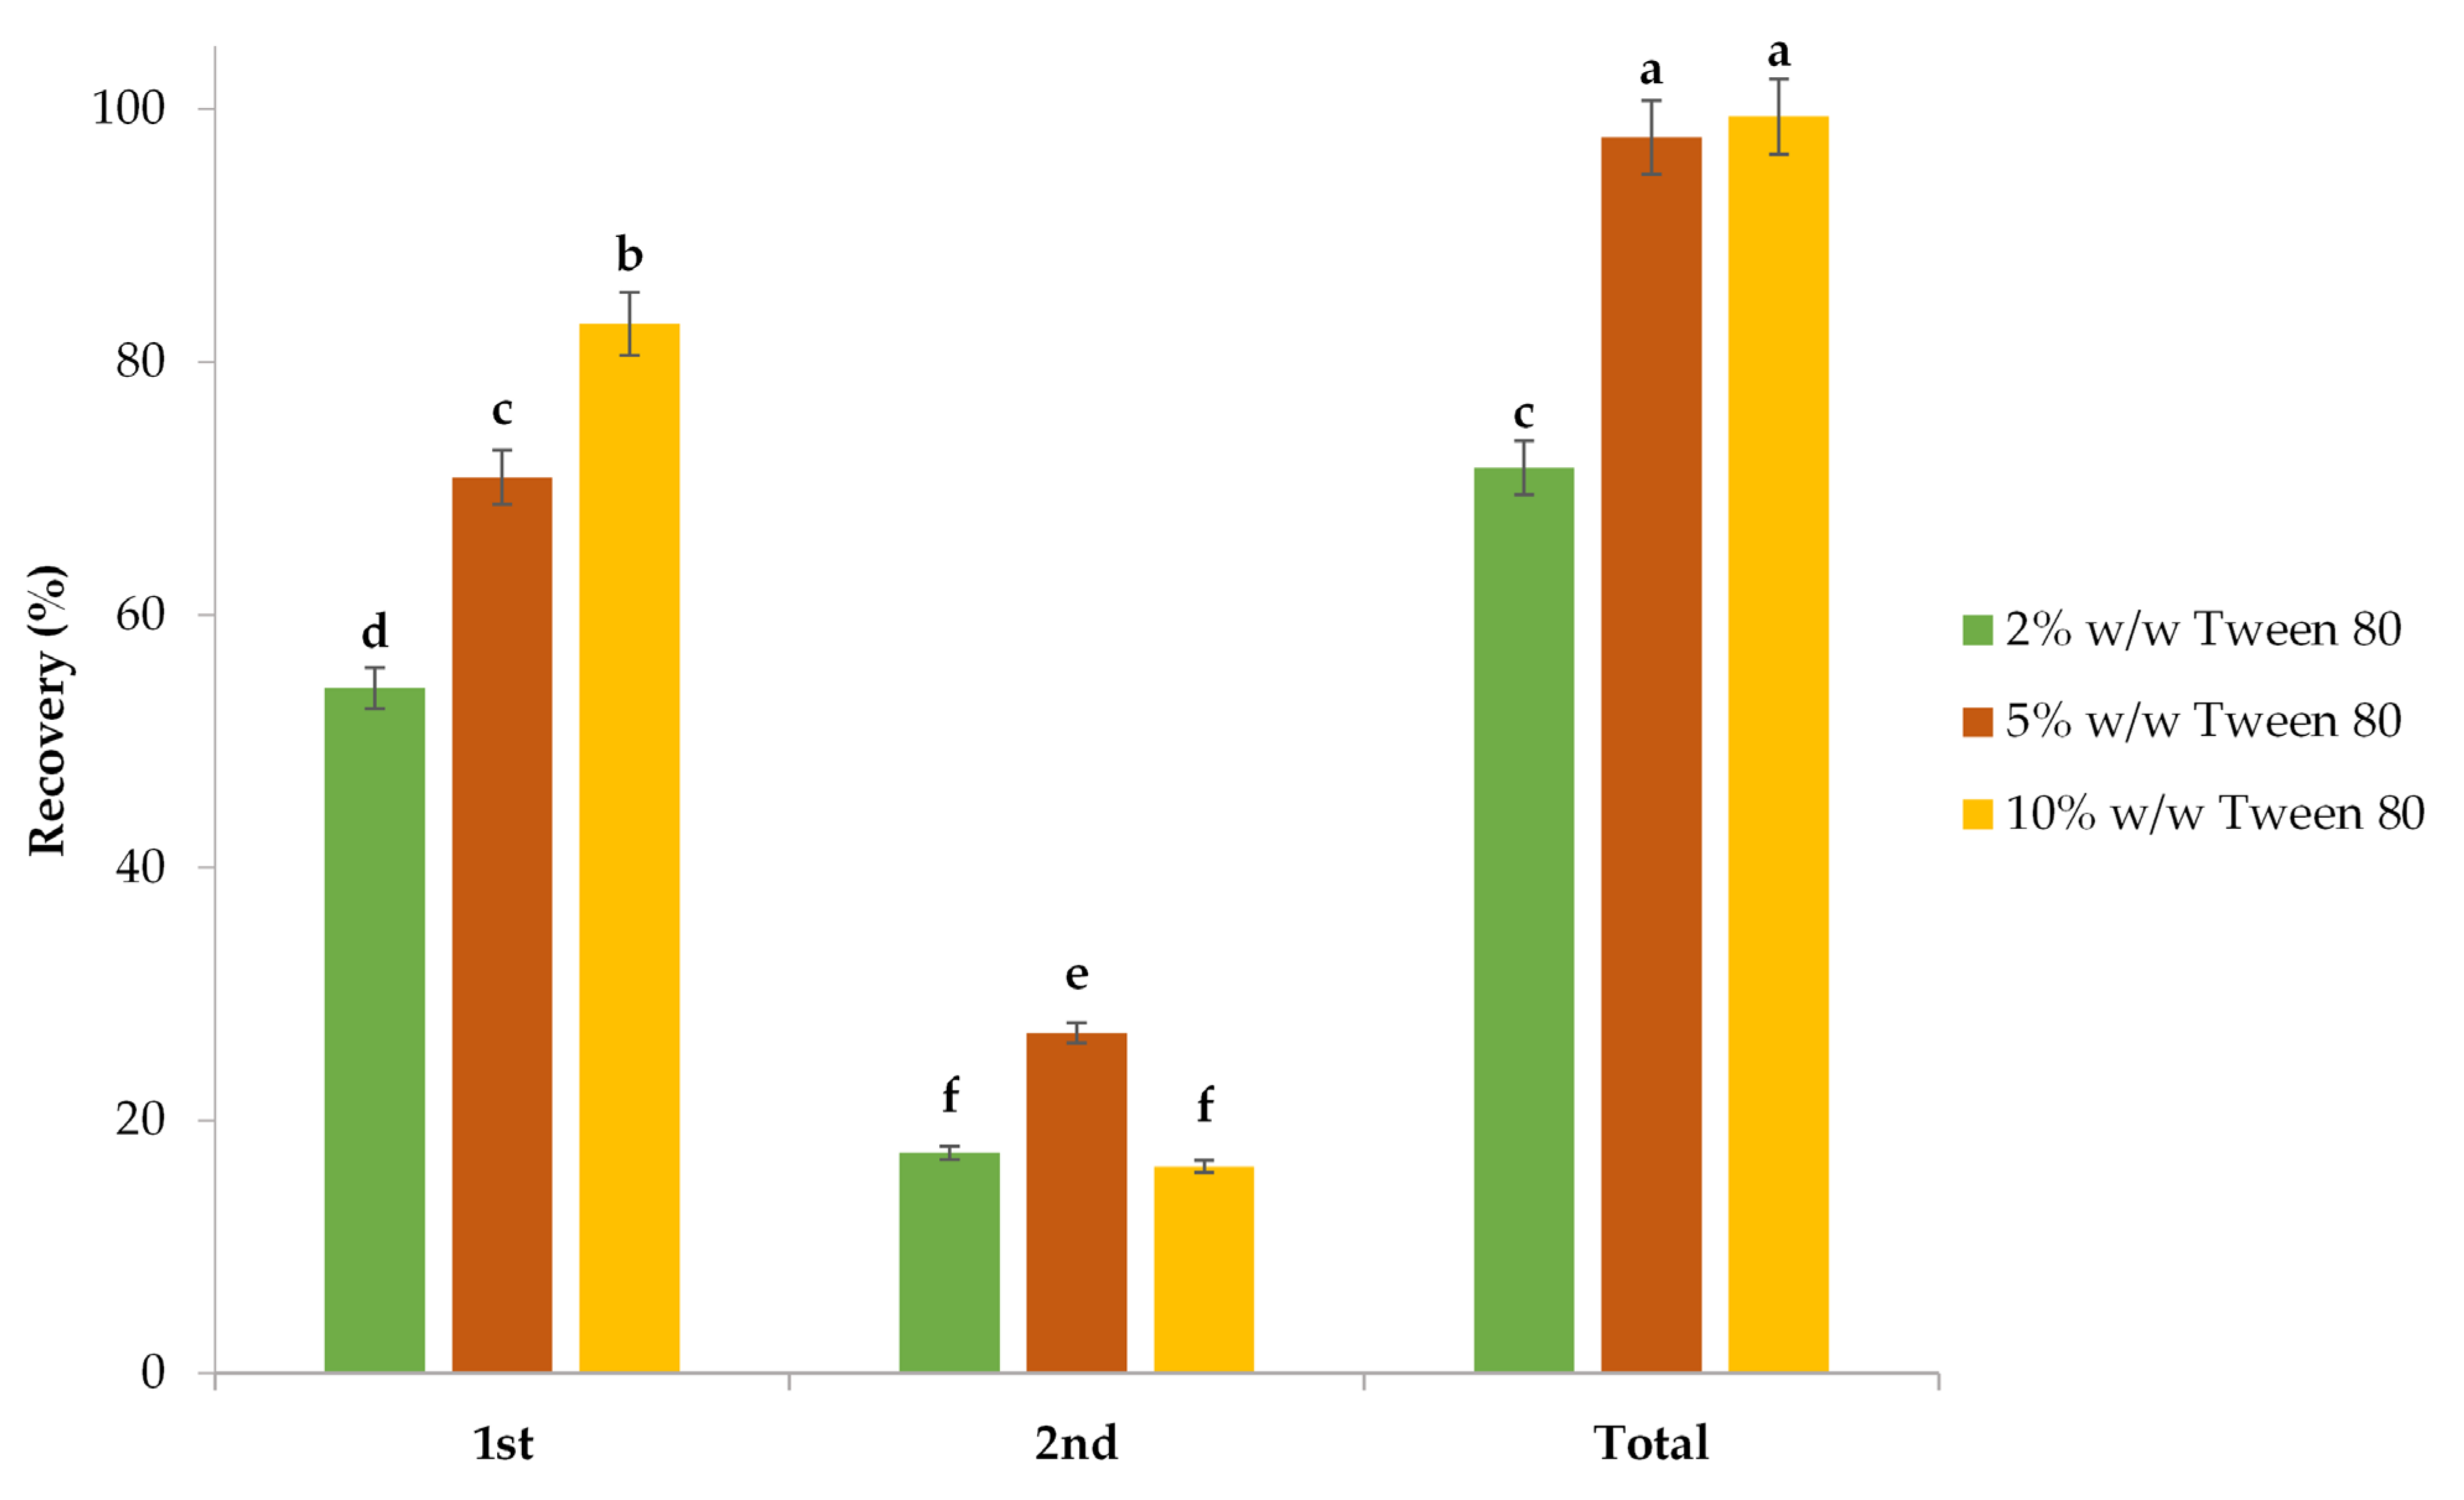
3.2.3. Impact of Surfactant Concentration and Extraction Frequency

Polysorbate 80, commonly referred to as Tween 80, is classified as a non-ionic surfactant belonging to the polysorbate group. Tween 80 is a liquid soluble in water. It is frequently utilized in various industries, including the food and pharmaceutical sectors, for its ability to solubilize, emulsify, and stabilize other compounds. It is obtained from naturally occurring substances such as sorbitol, ethylene oxide, and oleic acid. Tween 80 is acknowledged for its capacity to improve the solubility and bioavailability of pharmaceuticals with low solubility, as well as its emulsification characteristics in food items [49]. The examination of the surfactant concentration and the number of extractions necessary for polyphenol extraction were the final two parameters investigated. The preconcentration factor appears to decrease when a high amount of surfactant is used, which reduces the extraction efficiency. The concentrations of Tween 80 that were examined in this study were 2, 5, and 10%. Preliminary experiments showed that higher concentrations of the surfactant were not necessary, which is beneficial for the developed procedure. The results of this research are represented in Figure 3.
The initial step of extraction employing Tween 80 at concentrations of 2, 5, and 10% w/v yielded extraction recoveries of 54.24, 70.92, and 83.01%, respectively. Statistically significant differences (p < 0.05) were observed in each extraction step. The optimal method for achieving a polyphenol recovery rate of 83% involved the utilization of 10% Tween 80 twice. However, the utilization of excessive amounts of surfactant leads to an increased cost of the process. Consequently, the most cost-effective method implied the application of 5% Tween 80 twice, resulting in a polyphenol recovery rate of 97.82%. The same conclusion was reached in our previous study [35], where CPE was applied for the recovery of polyphenols from two waste streams from peach canneries using Tween 80. The most profitable conditions, which yielded 98% polyphenol recovery, were found to be a two-step CPE with 5% Tween 80 at 65 °C, pH was set at 3.50, and the sodium chloride concentration was 3% w/v. Our results are also in line with Alibade et al. [50], who noticed that an increased concentration of surfactant results in a higher recovery of polyphenols from winery wastes. Therefore, due to the previously discussed observations, the optimal concentration of surfactant turns out to be 5%, which yields a polyphenol recovery rate of 87.41%.

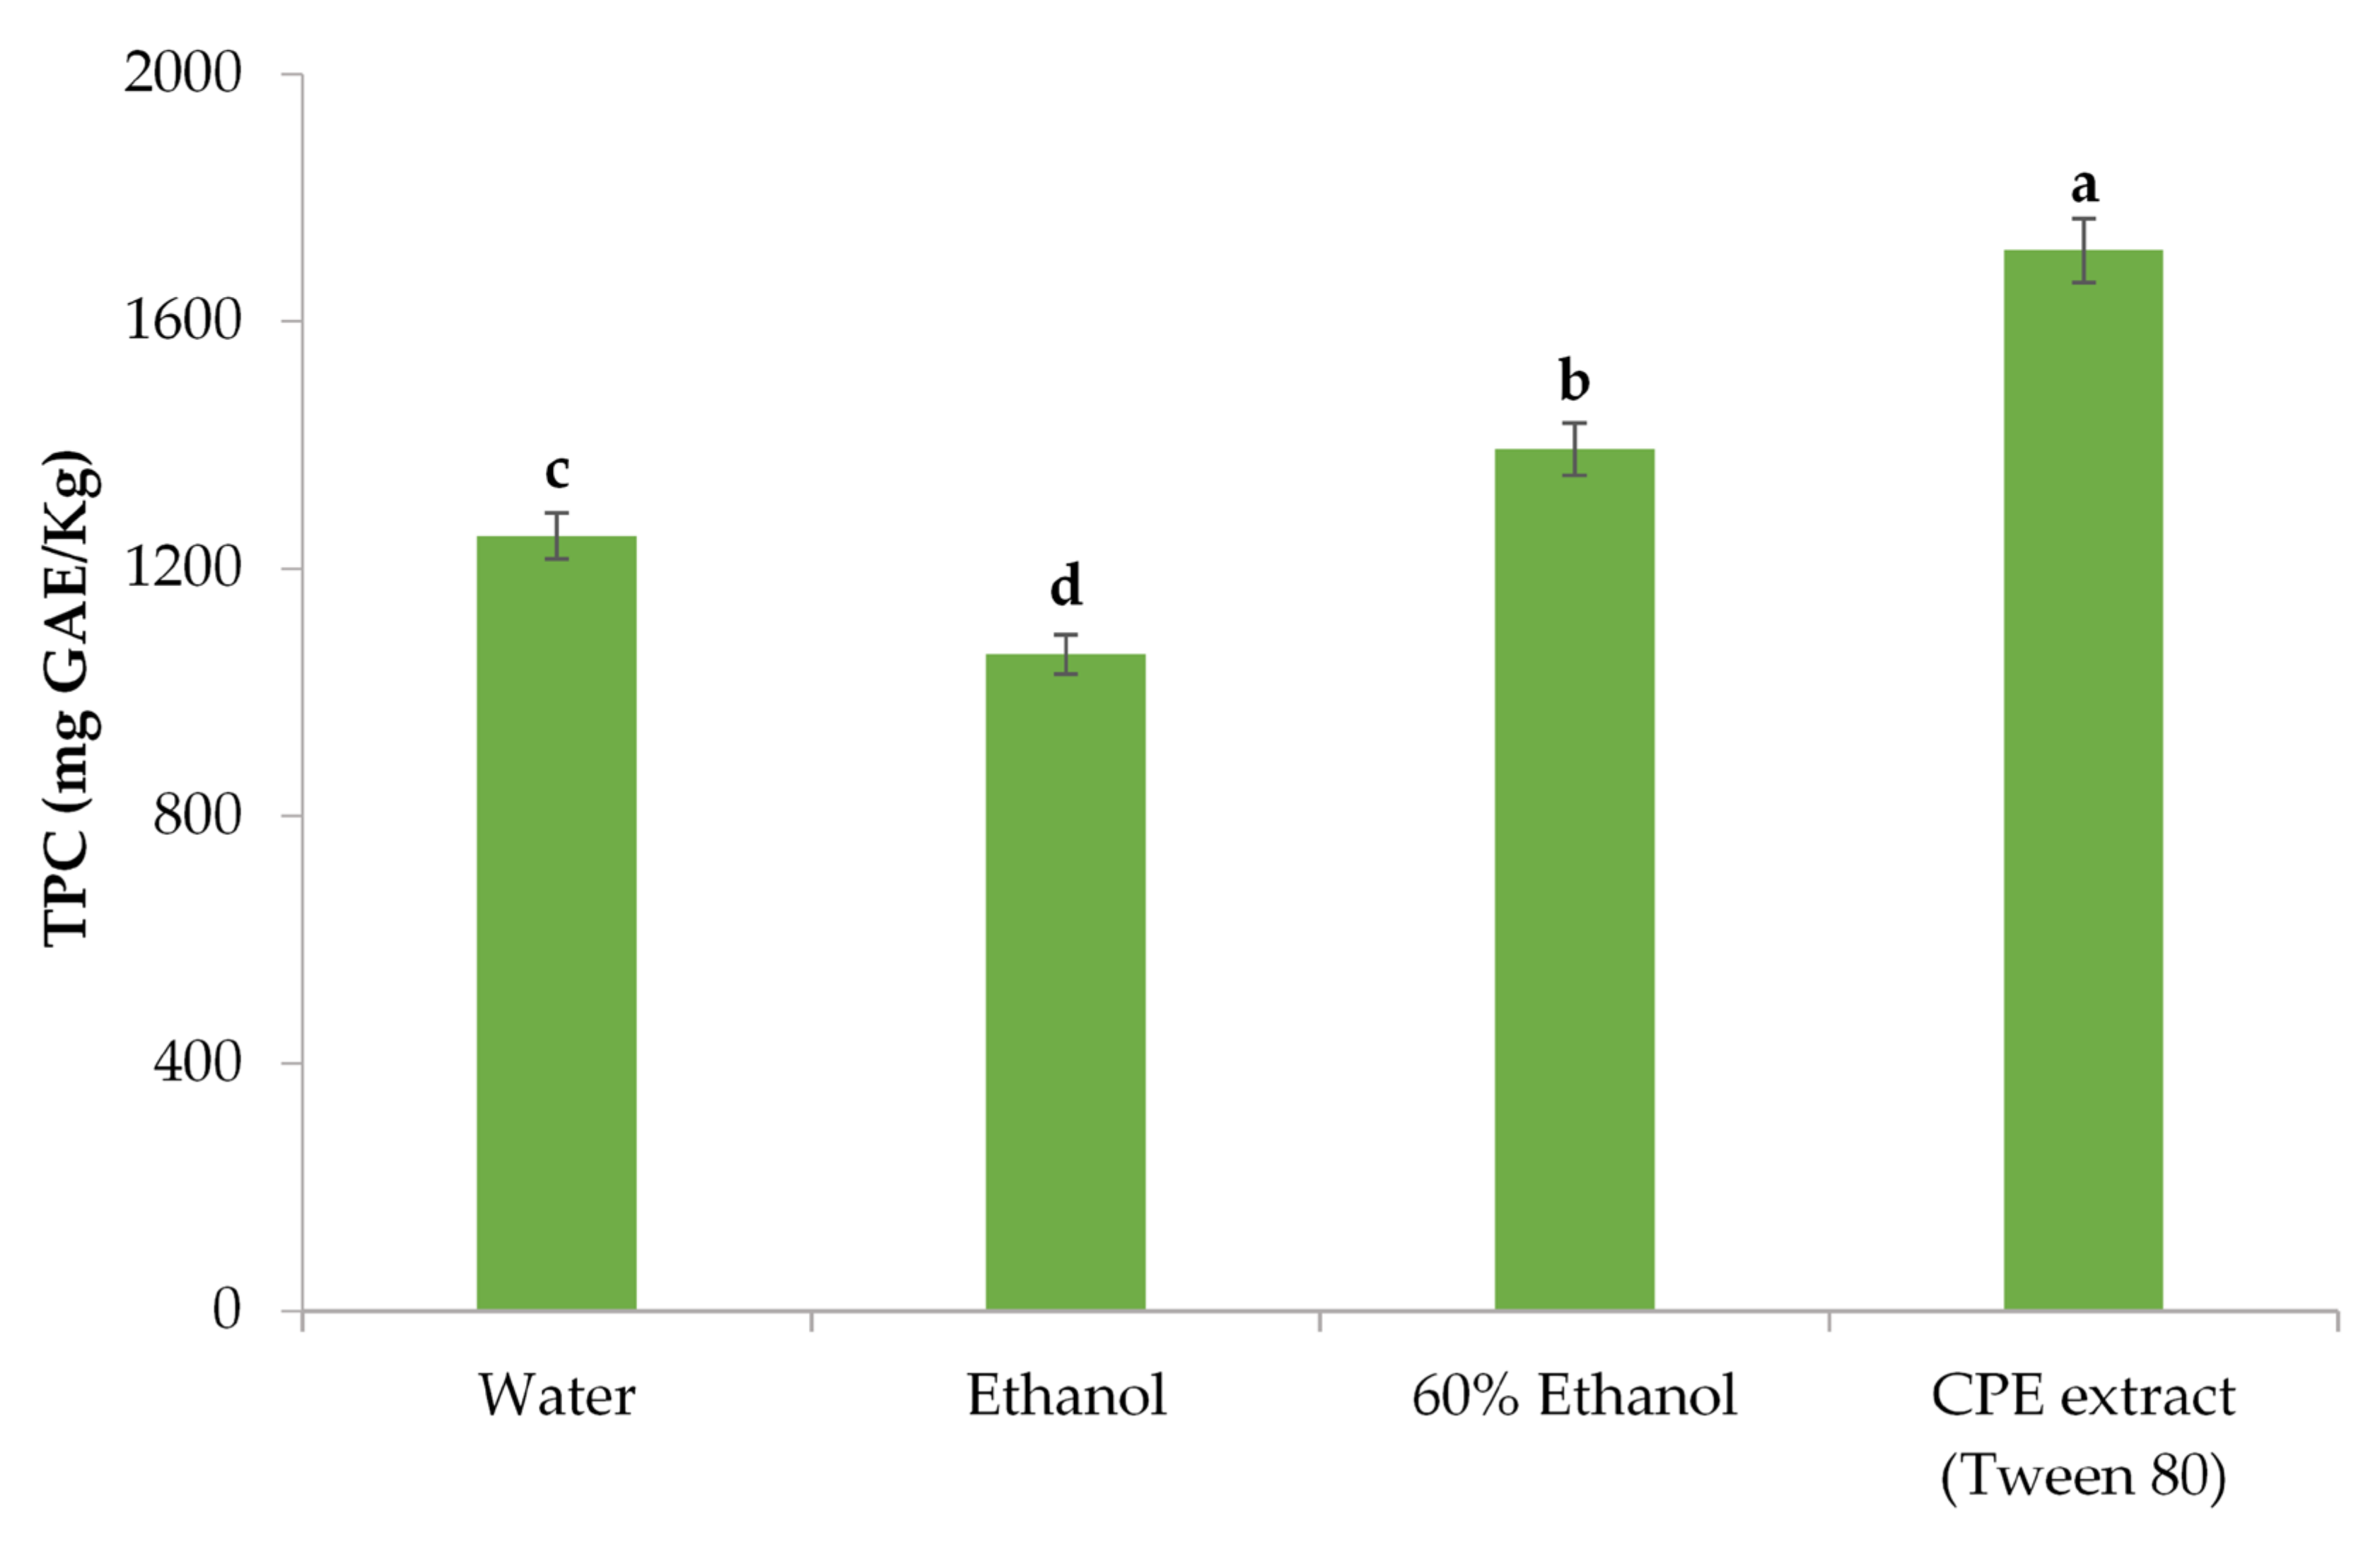
3.2.4. Impact of the Extraction Solvent

The impact of the solvent on the recovery of bioactive compounds holds major importance. In the current study, the potential solvents used included water, ethanol, 60% ethanol, and the surfactant Tween 80, which was implemented in CPE. According to the data presented in Figure 4, the CPE process shows the highest TPC recovery, in the amount of 1714.53 mg GAE/kg fw. This amount is 36.89%, 61.50%, and 20.06% higher than with water, ethanol, and 60% ethanol extractions, respectively. The selection of CPE as the most efficient method for polyphenol recovery can likely be attributed to the capacity of the surfactant to form micelles under appropriate conditions [33,51]. Surfactants are recognized for their ability to enhance permeability by influencing tight junctions through interactions between surfactant head groups and lipid bilayers. Additionally, they may also alter hydrogen bonding and ionic forces. The ability of a surfactant molecule to distribute itself between lipid and protein domains is attributed to its structural characteristics, specifically its possession of both lipophilic and hydrophilic properties. Consequently, the permeability is enhanced through the disruption of the cell membrane. Tween 80 molecule carries a polyoxyethylene part and an intermediate hydrocarbon chain, which provides it with optimal enhancement capacity. This is attributed to a harmonious combination of hydrophilic and lipophilic domains, resulting in an intermediate hydrophilic-lipophilic balance value [49,52]. This statement is enhanced by comparing our results to those of Di Vaio et al. [53], who determined the TPC of peach and nectarine cultivars via common extraction, using methanol and water solution in a ratio of 7:3 as solvent. The TPC they recovered was 679 mg/kg for the peach extracts and 409–497 mg/kg for the nectarine cultivars.

3.3. Antioxidant Activity of Extracted Polyphenols

The success of extracting compounds from a sample is reflected in the ability of the isolated compounds in terms of their inherent characteristics. Therefore, it was imperative to figure out the antioxidant activity of the extracted polyphenols. In Table 2, the results of the TPC, FRAP, and DPPH radical scavenging measurements are illustrated. The findings of this study unambiguously show that unripe fruits exhibit greater antioxidant activity in comparison to ripe fruits, which is in line with previous research conducted in this field [26,27,54]. More specifically, for the AU cultivar, the TPC is 110.31% higher than in AR, the PR value is 121.76% higher, and the AAR value was 119.74% higher than in AR. In the EU cultivar, the TPC is 127.63% higher than the ER, the PR is 127.93% higher, and the AAR value is 139.37% higher than the ER. The EU cultivar seems to hold a stronger antioxidant activity, as it possesses higher TPC, FRAP, and DPPH values than the AU one, and their values exhibit a statistically significant difference (p < 0.05). On the contrary, the AU and EU cultivars have no statistically significant difference (p > 0.05) in their TPC, FRAP, and DPPH values. Comparing the findings with other studies, CPE seems to be the most favorable extraction method, especially from the unripe fruits. More specifically, Petruccelli et al. [43] determined a range of TPC values from 321 to 1116 mg GAE/kg fw in ten different yellow-flesh peach cultivars using a simple extraction with ethanol/acidified water solvent 7/3 v/v. These values are 353.58% to 31.27% lower than the TPC found in the AU and 433.96% to 56.63% lower than the TPC in the EU. Guo et al. [27] also determined a TPC range from 340.1 to 820.3 mg GAE/kg in peach and nectarines, 78.63–330.85% lower than AU and 108.97–403.97% lower than EU. Our results are also in line with Liu et al. [55], who determined the TPC values in six peach cultivars, ranging from 560 to 3180 mg GAE/kg fw. As for the DPPH radical scavenging, Gil et al. [56] determined the AAR values in white and yellow-fleshed peaches, and the values ranged from 1.07 to 6.76 mmol AAE/kg. These values are 8.43–585.04% lower than AU and 26.77–700.93% lower than EU. The same research team measured the DPPH values, and they found a range of 0.35–1.80 mmol AAE/kg in peaches and 0.83–5.71 mmol AAE/kg in nectarines, which are close to our findings.

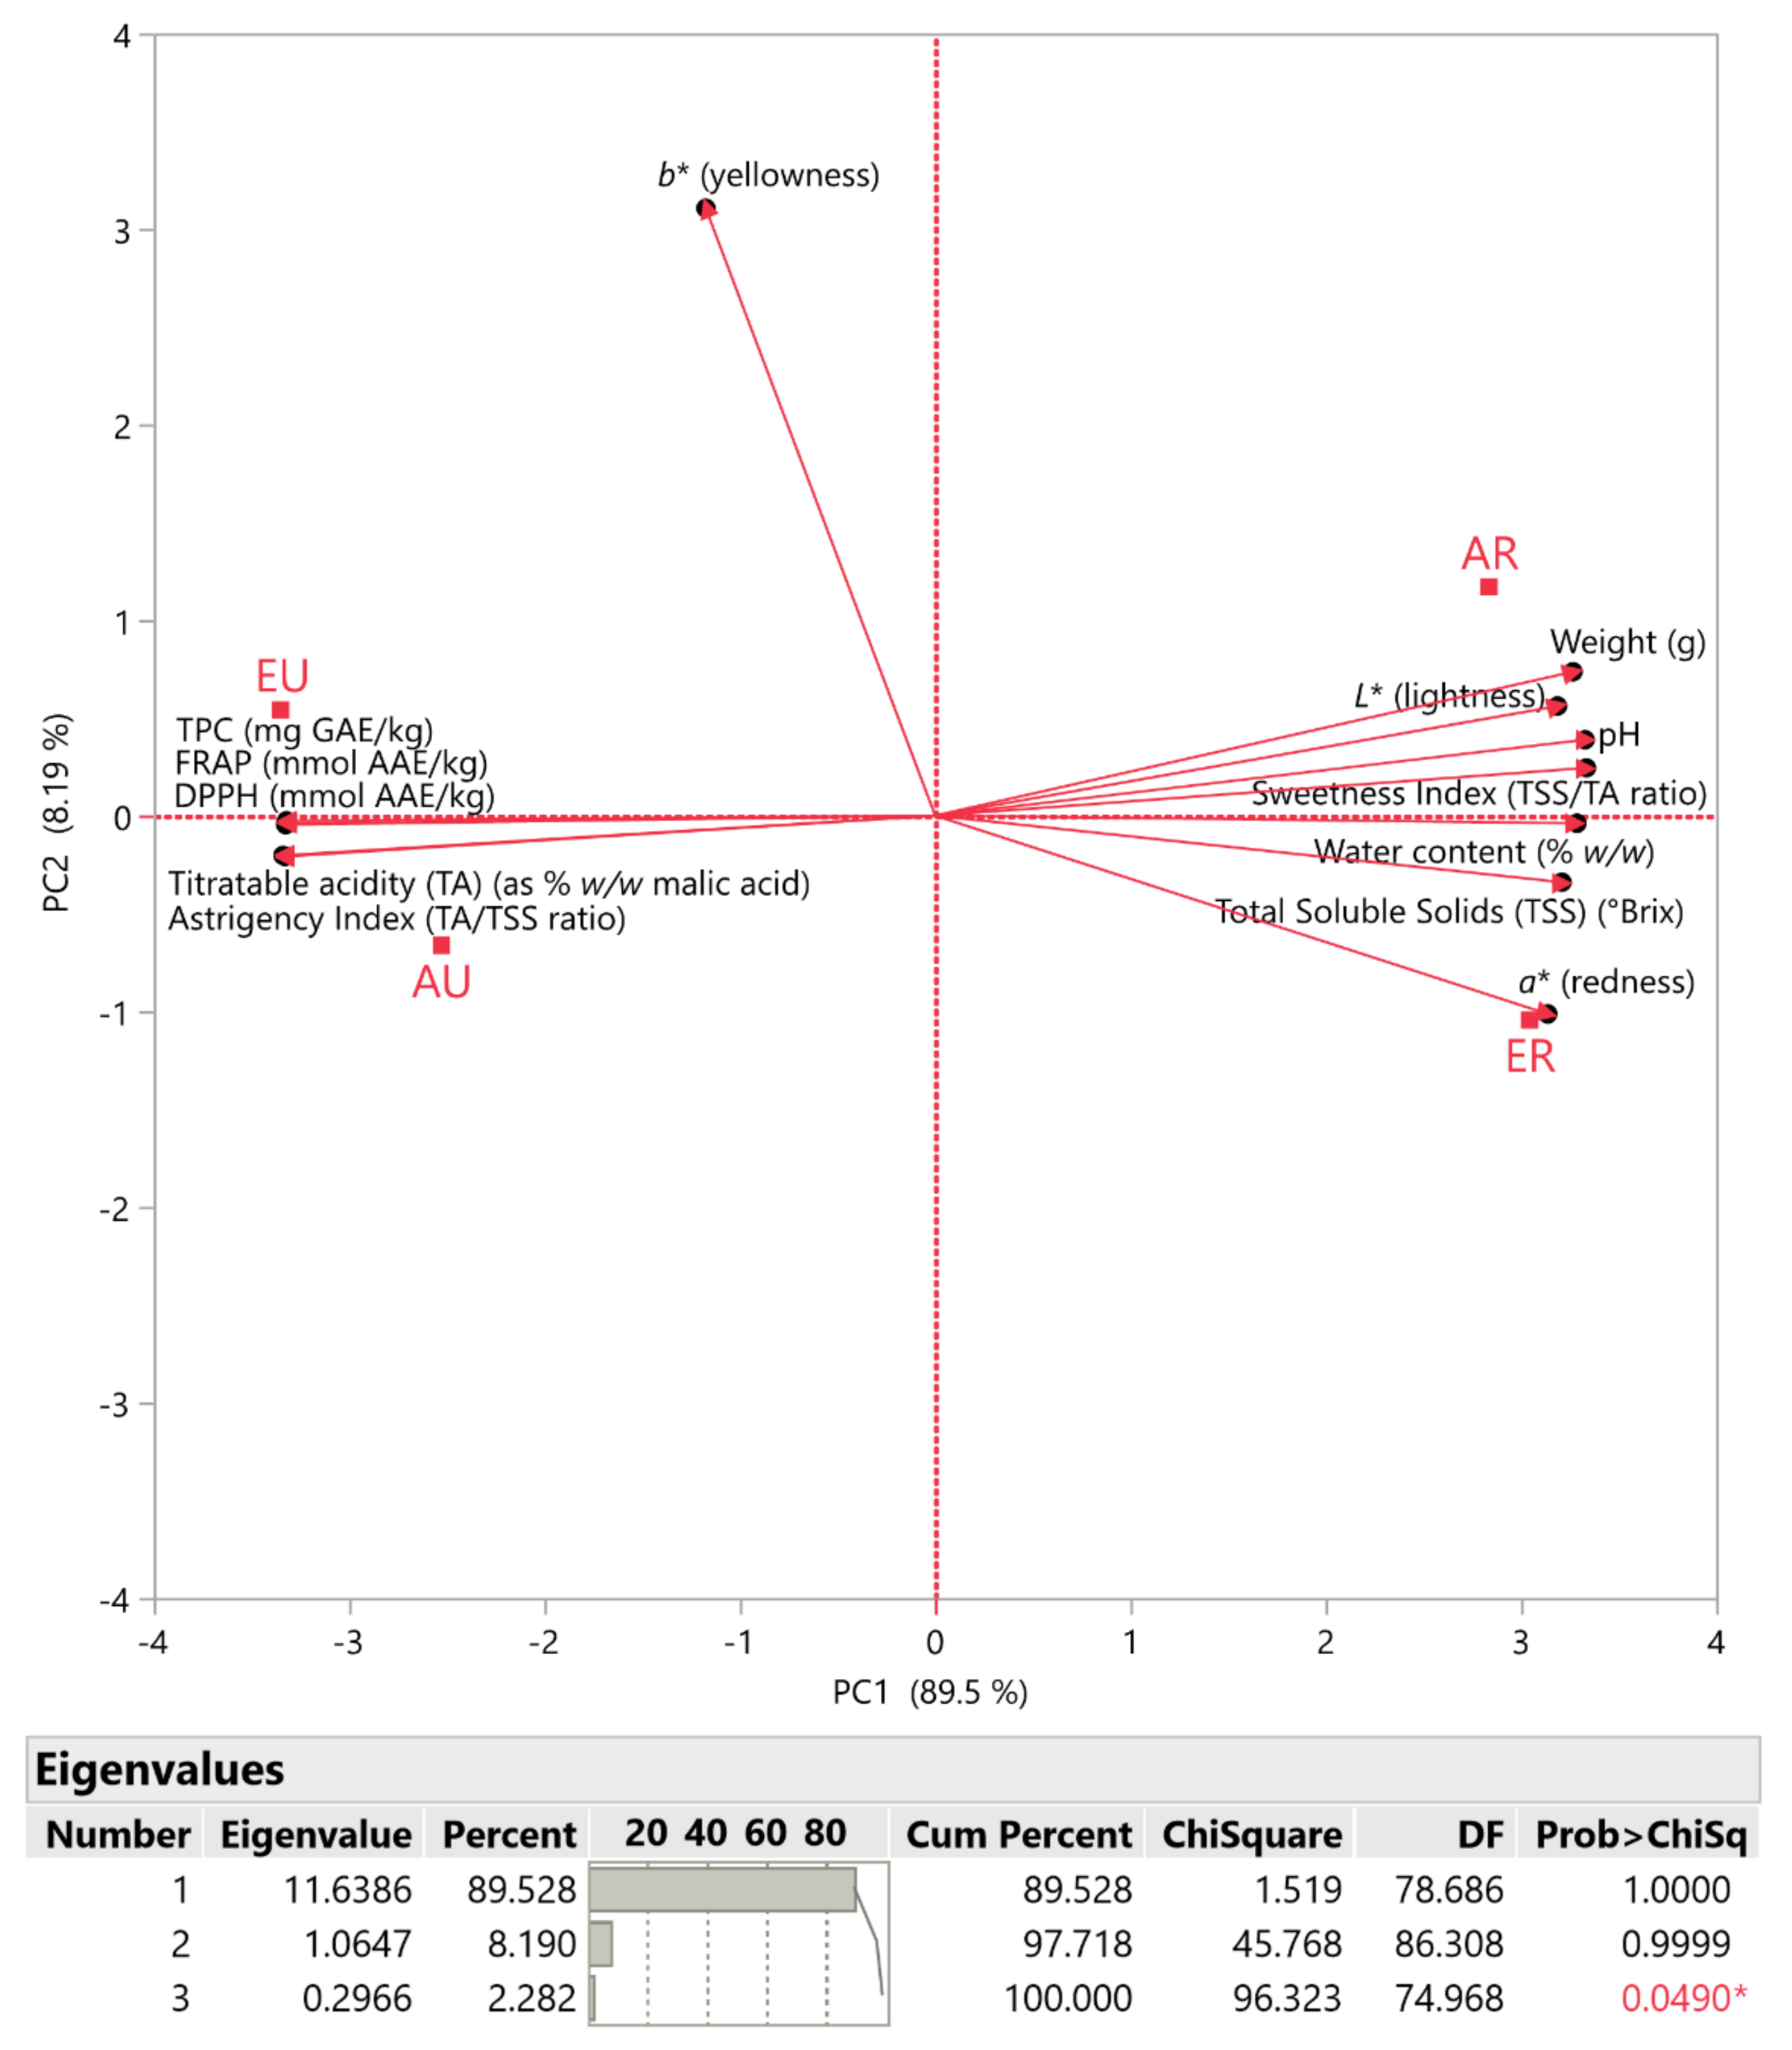
3.4. Principal Component Analysis (PCA)

PCA was used to improve information extraction from variables and to perform a more thorough examination of the data. Using Tween 80, it was intended to see if there was a correlation between the physicochemical characteristics of the peach samples and their TPC, FRAP assay, and DPPH radical scavenging activity. Figure 5 shows the identification of two principal components that together accounted for 97.7% of the variance based on their eigenvalues being greater than 1. PC1 accounted for 89.5% of the variance, whereas PC2 accounted for 8.19% of the variance, respectively. The results showed that there was either a positive or negative correlation between the parameters. Parameters such as weight, L*, pH, sweetness index, water content, total soluble solids, and a* had positive correlations with PC1. On the contrary, a negative correlation between PC1 and titratable acidity, astringency index, b*, TPC, and the antioxidant assays (FRAP and DPPH) was observed. Correspondingly, a positive correlation of PC2 with b*, weight, L*, pH, and sweetness index was noticed. In addition, it should be noted that TPC and antioxidant assays not only had a negative correlation with pH value, water content, and total soluble solids but also with L* and a* values. This was attributed to the biochemical changes in the fruit over time. As the fruit ripens and the water and total soluble solids content increases, the concentration of polyphenols decreases. Finally, a finding of equal interest is related to the positioning of unripe peach samples (EU, AU), irrespective of their cultivar. Sample AU showed proximity to the parameter of astringency index, whereas sample EU was near the parameters of TPC and antioxidant assay, meaning their strong correlation with each, which was previously confirmed. Samples AR and ER were positioned far from the TPC and antioxidant assay parameters, meaning their negative correlation correspondingly. Moreover, these samples have been positioned close to the weight, sweetness index, and water content parameters due to their positive correlation with each parameter.

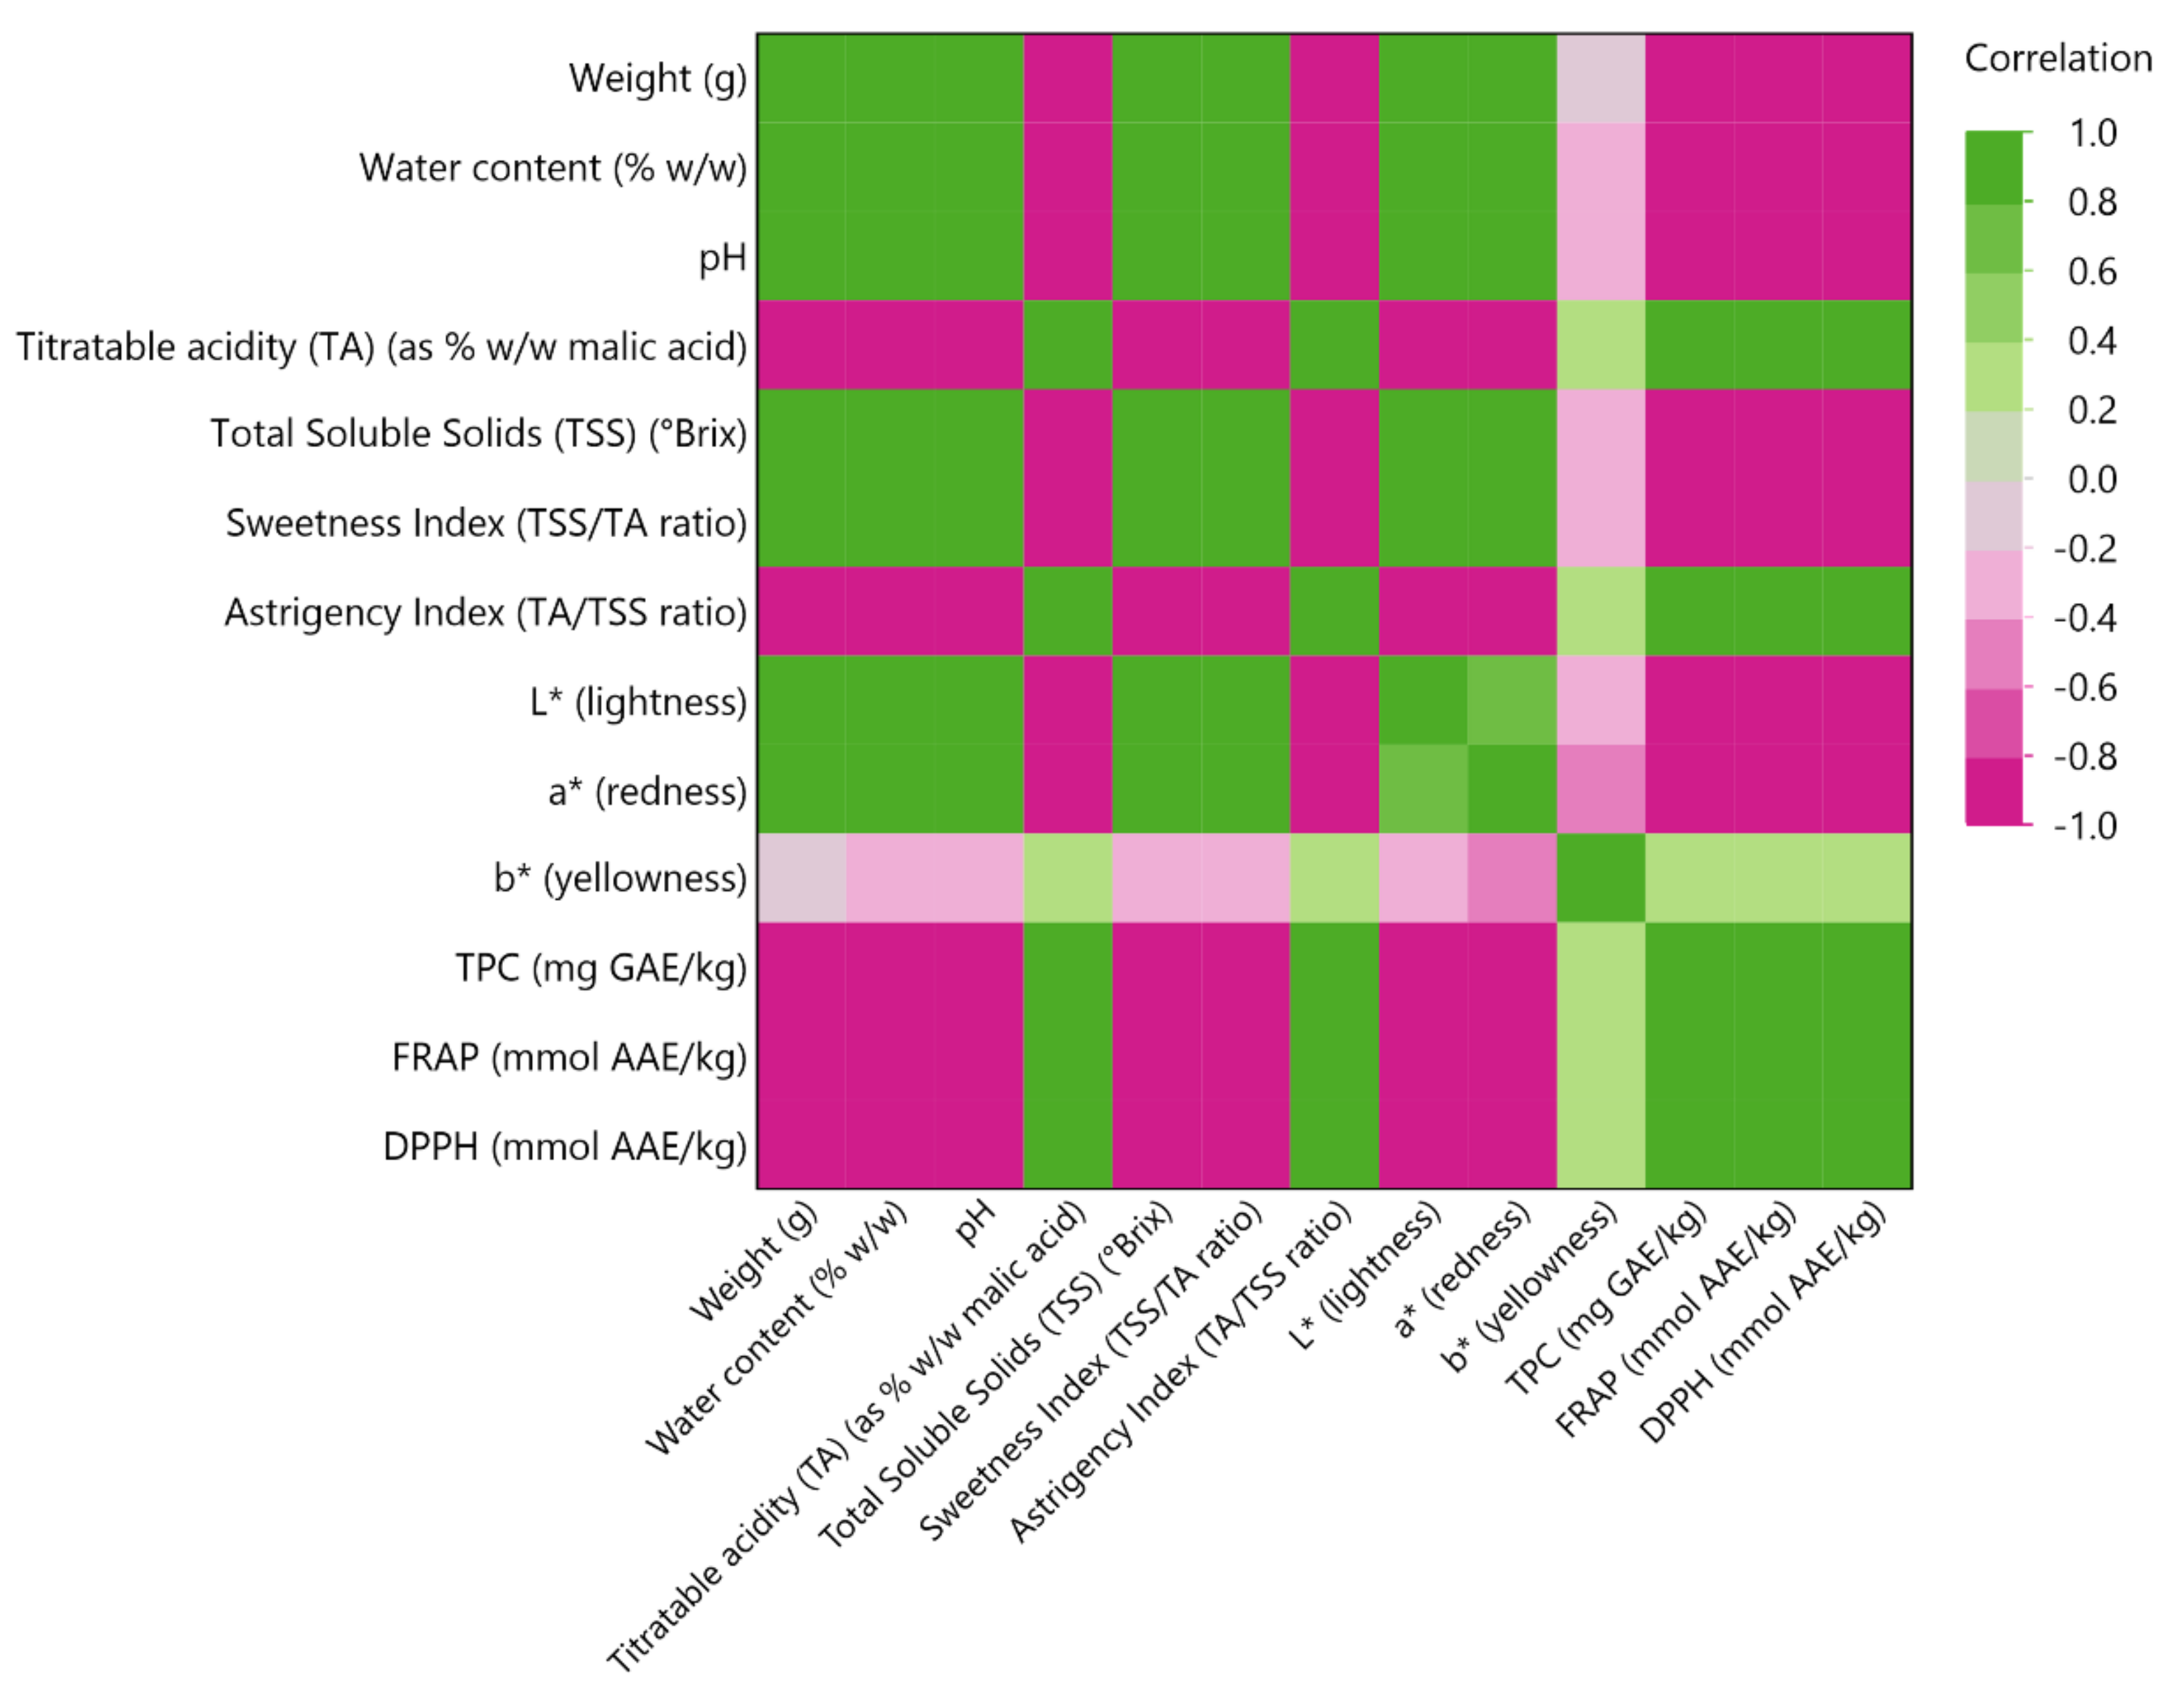
3.5. Multivariate Correlation Analysis (MCA)

In order to provide greater clarity on a correlation between the variables under investigation, MCA was also performed. This graph enables the evaluation of the correlation between two parameters. The correlation values for the color scale in this color map range from −1 to 1. The strength of the positive correlation between the variables increases with the intensity of the green color. On the other hand, a more intense purple color indicates a high negative correlation between the variables. The results of this research are shown in Figure 6, which shows a strong positive association between TPC and the antioxidant assays FRAP and DPPH (0.9999), a result that is quite predictable because polyphenols have antioxidant activity. A result previously indicated by the PCA graph was related to the sweetness index, but it was not possible to evaluate the correlation. The sweetness index was shown to have a strong positive correlation (>0.988) with weight, water content, total soluble solids, and pH. It was also observed through MCA that TPC and antioxidant assays had strong negative correlations with sweetness index, total soluble solids, weight, water content, and pH values. This finding was also confirmed by previous results showing that unripe peaches had more polyphenols than ripe peaches. It was also observed that the b* parameter was positively correlated with titratable acidity, astringency index, TPC, and antioxidant assays, but in a weak manner. However, the strong negative correlation of TPC with two color parameters (L*, a*) remains of high interest.

4. Conclusions

This study utilized common extraction and CPE techniques to assess the antioxidant capacity of two distinct peach cultivars at two distinct stages of ripening. The optimal approach was determined to be a two-step CPE procedure, employing a 5% concentration of Tween 80 and 6% w/v sodium chloride (NaCl), with a pH of 2.5. The extraction procedure was conducted for a duration of 20 min at a temperature of 45 °C. The unripe fruits exhibited higher antioxidant activity than the ripe ones. The application of CPE using Tween 80 as a surfactant with low toxicity has been identified as an efficient, uncomplicated, and cost-effective approach for extracting polyphenols from unripe peaches. The polyphenols that have been recovered possess the potential to be employed as natural antioxidants in food items. The proposed procedure exhibits several advantages over commonly employed methods, including the low toxicity of the surfactant, minimal consumption requirements, and the simplicity of the extraction process. These factors contribute to a high polyphenol recovery. Generally, the suggested method can be employed for the convenient and financially viable extraction of polyphenols from peaches, thereby offering a potential alternative to currently employed techniques that exhibit inferior environmental sustainability or require greater laborious efforts. These recovered polyphenols could be used directly in foods as natural antioxidants. Thus, the results of this study possess the capacity to influence the manufacturing of environmentally friendly and organic food additives. This study may inspire the application of the same technique to other fruits, including apricots, nectarines, bananas, tangerines, and others. In general, CPE is a flexible and cost-effective method that could be applicable to several fruits.

Author Contributions

Conceptualization, I.G. and S.I.L.; methodology, V.A. and T.C.; software, V.A.; validation, I.G. and V.A.; formal analysis, I.G., V.A., E.B. and T.C.; investigation, I.G. and V.A.; resources, S.I.L.; data curation, I.G. and V.A.; writing—original draft preparation, I.G., V.A., T.C., D.K. and M.M.; writing—review and editing, I.G., V.A., T.C., D.K., M.M., E.B., O.G., G.D.N. and S.I.L.; visualization, V.A.; supervision, O.G., G.D.N. and S.I.L.; project administration, S.I.L. All authors have read and agreed to the published version of the manuscript.

Funding

This research received no external funding.

Data Availability Statement

Data are contained within the article.

Acknowledgments

The authors would like to thank the Agricultural Cooperative of Pella (Kallipoli, Pella, Greece) for donating fresh peach fruits in collaboration with local farmers.

Conflicts of Interest

The authors declare no conflict of interest.

References

  1. Gedük, A.Ş.; Atsız, S. LC-MS/MS Phenolic Composition of Peach (Prunus persica (L.) Batsch) Extracts and an Evaluation of Their Antidiabetic, Antioxidant and Antibacterial Activities. S. Afr. J. Bot. 2022, 147, 636–645. [Google Scholar] [CrossRef]
  2. Rudke, C.R.M.; Zielinski, A.A.F.; Ferreira, S.R.S. From Biorefinery to Food Product Design: Peach (Prunus persica) By-Products Deserve Attention. Food Bioprocess Technol. 2023, 16, 1197–1215. [Google Scholar] [CrossRef]
  3. Li, Y.; Wang, L. Genetic Resources, Breeding Programs in China, and Gene Mining of Peach: A Review. Hortic. Plant J. 2020, 6, 205–215. [Google Scholar] [CrossRef]
  4. Mannino, G.; Ricciardi, M.; Gatti, N.; Serio, G.; Vigliante, I.; Contartese, V.; Gentile, C.; Bertea, C.M. Changes in the Phytochemical Profile and Antioxidant Properties of Prunus persica Fruits after the Application of a Commercial Biostimulant Based on Seaweed and Yeast Extract. Int. J. Mol. Sci. 2022, 23, 15911. [Google Scholar] [CrossRef] [PubMed]
  5. Manganaris, G.A.; Minas, I.; Cirilli, M.; Torres, R.; Bassi, D.; Costa, G. Peach for the Future: A Specialty Crop Revisited. Sci. Hortic. 2022, 305, 111390. [Google Scholar] [CrossRef]
  6. Anthony, B.M.; Minas, I.S. Redefining the Impact of Preharvest Factors on Peach Fruit Quality Development and Metabolism: A Review. Sci. Hortic. 2022, 297, 110919. [Google Scholar] [CrossRef]
  7. Veerappan, K.; Natarajan, S.; Chung, H.; Park, J. Molecular Insights of Fruit Quality Traits in Peaches, Prunus persica. Plants 2021, 10, 2191. [Google Scholar] [CrossRef]
  8. Dabbou, S.; Maatallah, S.; Castagna, A.; Guizani, M.; Sghaeir, W.; Hajlaoui, H.; Ranieri, A. Carotenoids, Phenolic Profile, Mineral Content and Antioxidant Properties in Flesh and Peel of Prunus persica Fruits during Two Maturation Stages. Plant Foods Hum. Nutr. 2017, 72, 103–110. [Google Scholar] [CrossRef] [PubMed]
  9. Bento, C.; Gonçalves, A.C.; Silva, B.; Silva, L.R. Peach (Prunus persica): Phytochemicals and Health Benefits. Food Rev. Int. 2022, 38, 1703–1734. [Google Scholar] [CrossRef]
  10. Mihaylova, D.; Popova, A.; Desseva, I.; Manolov, I.; Petkova, N.; Vrancheva, R.; Peltekov, A.; Slavov, A.; Zhivondov, A. Comprehensive Evaluation of Late Season Peach Varieties (Prunus persica L.): Fruit Nutritional Quality and Phytochemicals. Molecules 2021, 26, 2818. [Google Scholar] [CrossRef]
  11. Nowicka, P.; Wojdyło, A.; Laskowski, P. Principal Component Analysis (PCA) of Physicochemical Compounds’ Content in Different Cultivars of Peach Fruits, Including Qualification and Quantification of Sugars and Organic Acids by HPLC. Eur. Food Res. Technol. 2019, 245, 929–938. [Google Scholar] [CrossRef]
  12. Campbell, O.E.; Padilla-Zakour, O.I. Phenolic and Carotenoid Composition of Canned Peaches (Prunus Persica) and Apricots (Prunus Armeniaca) as Affected by Variety and Peeling. Food Res. Int. 2013, 54, 448–455. [Google Scholar] [CrossRef]
  13. Liu, H.; Cao, J.; Jiang, W. Evaluation and Comparison of Vitamin C, Phenolic Compounds, Antioxidant Properties and Metal Chelating Activity of Pulp and Peel from Selected Peach Cultivars. LWT—Food Sci. Technol. 2015, 63, 1042–1048. [Google Scholar] [CrossRef]
  14. Mihaylova, D.; Popova, A.; Desseva, I.; Petkova, N.; Stoyanova, M.; Vrancheva, R.; Slavov, A.; Slavchev, A.; Lante, A. Comparative Study of Early- and Mid-Ripening Peach (Prunus persica L.) Varieties: Biological Activity, Macro-, and Micro- Nutrient Profile. Foods 2021, 10, 164. [Google Scholar] [CrossRef]
  15. Jung, K.-M.; Kim, S.-Y.; Lee, G.-W.; Kim, I.-D.; Park, Y.-S.; Dhungana, S.K.; Kim, J.-H.; Shin, D.-H. Quality Characteristics and Antioxidant Activity of Unripe Peach (Prunus persica L. Batsch) Extracts with Distilled Water Coupled with Ultrasonication and Prethanol-A. Int. J. Fruit Sci. 2020, 20, S111–S122. [Google Scholar] [CrossRef]
  16. Mokrani, A.; Madani, K. Effect of Solvent, Time and Temperature on the Extraction of Phenolic Compounds and Antioxidant Capacity of Peach (Prunus persica L.) Fruit. Sep. Purif. Technol. 2016, 162, 68–76. [Google Scholar] [CrossRef]
  17. Gu, X.; Xue, L.; Lu, L.; Xiao, J.; Song, G.; Xie, M.; Zhang, H. Melatonin Enhances the Waterlogging Tolerance of Prunus persica by Modulating Antioxidant Metabolism and Anaerobic Respiration. J. Plant Growth Regul. 2021, 40, 2178–2190. [Google Scholar] [CrossRef]
  18. Wu, H.; Xu, Y.; Wang, H.; Miao, Y.; Li, C.; Zhao, R.; Shi, X.; Wang, B. Physicochemical Characteristics, Antioxidant Activities, and Aroma Compound Analysis of Seven Peach Cultivars (Prunus persica L. Batsch) in Shihezi, Xinjiang. Foods 2022, 11, 2944. [Google Scholar] [CrossRef] [PubMed]
  19. Kant, R.; Shukla, R.; Shukla, A. A Review on Peach (Prunus persica): An Asset of Medicinal Phytochemicals. Int. J. Res. Appl. Sci. Eng. Technol. 2018, 6, 2186–2200. [Google Scholar] [CrossRef]
  20. Patra, J.K.; Baek, K.-H. Green Synthesis of Silver Chloride Nanoparticles Using Prunus persica L. Outer Peel Extract and Investigation of Antibacterial, Anticandidal, Antioxidant Potential. Green Chem. Lett. Rev. 2016, 9, 132–142. [Google Scholar] [CrossRef]
  21. Wei, C.; Zhang, Y.; He, L.; Cheng, J.; Li, J.; Tao, W.; Mao, G.; Zhang, H.; Linhardt, R.J.; Ye, X.; et al. Structural Characterization and Anti-Proliferative Activities of Partially Degraded Polysaccharides from Peach Gum. Carbohydr. Polym. 2019, 203, 193–202. [Google Scholar] [CrossRef]
  22. Chojnacka, K.; Lewandowska, U. Chemopreventive Effects of Polyphenol-Rich Extracts against Cancer Invasiveness and Metastasis by Inhibition of Type IV Collagenases Expression and Activity. J. Funct. Foods 2018, 46, 295–311. [Google Scholar] [CrossRef]
  23. Canistro, D.; Vivarelli, F.; Cirillo, S.; Costa, G.; Andreotti, C.; Paolini, M. Comparison between in Toto Peach (Prunus persica L. Batsch) Supplementation and Its Polyphenolic Extract on Rat Liver Xenobiotic Metabolizing Enzymes. Food Chem. Toxicol. 2016, 97, 385–394. [Google Scholar] [CrossRef]
  24. Koyu, H.; Kazan, A.; Nalbantsoy, A.; Yalcin, H.T.; Yesil-Celiktas, O. Cytotoxic, Antimicrobial and Nitric Oxide Inhibitory Activities of Supercritical Carbon Dioxide Extracted Prunus persica Leaves. Mol. Biol. Rep. 2020, 47, 569–581. [Google Scholar] [CrossRef] [PubMed]
  25. Hussain, S.Z.; Naseer, B.; Qadri, T.; Fatima, T.; Bhat, T.A. Peach (Prunus persica)—Morphology, Taxonomy, Composition and Health Benefits. In Fruits Grown in Highland Regions of the Himalayas: Nutritional and Health Benefits; Hussain, S.Z., Naseer, B., Qadri, T., Fatima, T., Bhat, T.A., Eds.; Springer International Publishing: Cham, Switzerland, 2021; pp. 207–217. ISBN 978-3-030-75502-7. [Google Scholar]
  26. Kim, H.-R.; Kim, I.-D.; Dhungana, S.K.; Kim, M.-O.; Shin, D.-H. Comparative Assessment of Physicochemical Properties of Unripe Peach (Prunus persica) and Japanese Apricot (Prunus mume). Asian Pac. J. Trop. Biomed. 2014, 4, 97–103. [Google Scholar] [CrossRef]
  27. Guo, C.; Bi, J.; Li, X.; Lyu, J.; Zhou, M.; Wu, X. Antioxidant Profile of Thinned Young and Ripe Fruits of Chinese Peach and Nectarine Varieties. Int. J. Food Prop. 2020, 23, 1272–1286. [Google Scholar] [CrossRef]
  28. Peng, X.; Xu, H.; Yuan, X.; Leng, L.; Meng, Y. Mixed Reverse Micellar Extraction and Effect of Surfactant Chain Length on Extraction Efficiency. Sep. Purif. Technol. 2016, 160, 117–122. [Google Scholar] [CrossRef]
  29. Zhang, W.; Liu, X.; Fan, H.; Zhu, D.; Wu, X.; Huang, X.; Tang, J. Separation and Purification of Alkaloids from Sophora Flavescens Ait. by Focused Microwave-Assisted Aqueous Two-Phase Extraction Coupled with Reversed Micellar Extraction. Ind. Crops Prod. 2016, 86, 231–238. [Google Scholar] [CrossRef]
  30. Pereira, J.F.B.; Freire, M.G.; Coutinho, J.A.P. Aqueous Two-Phase Systems: Towards Novel and More Disruptive Applications. Fluid Phase Equilibria 2020, 505, 112341. [Google Scholar] [CrossRef]
  31. Xie, M.; Shon, H.K.; Gray, S.R.; Elimelech, M. Membrane-Based Processes for Wastewater Nutrient Recovery: Technology, Challenges, and Future Direction. Water Res. 2016, 89, 210–221. [Google Scholar] [CrossRef]
  32. Chen, Y.; Du, K.; Li, J.; Bai, Y.; An, M.; Tan, Z.; Chang, Y. A Green and Efficient Method for the Preconcentration and Determination of Gallic Acid, Bergenin, Quercitrin, and Embelin from Ardisia Japonica Using Nononic Surfactant Genapol X-080 as the Extraction Solvent. Int. J. Anal. Chem. 2018, 2018, 1707853. [Google Scholar] [CrossRef] [PubMed]
  33. Al-Saadi, M.R.; Al-Garawi, Z.S.; Thani, M.Z. Promising Technique, Cloud Point Extraction: Technology & Applications. J. Phys. Conf. Ser. 2021, 1853, 012064. [Google Scholar] [CrossRef]
  34. Arya, S.S.; Kaimal, A.M.; Chib, M.; Sonawane, S.K.; Show, P.L. Novel, Energy Efficient and Green Cloud Point Extraction: Technology and Applications in Food Processing. J. Food Sci. Technol. 2019, 56, 524–534. [Google Scholar] [CrossRef] [PubMed]
  35. Giovanoudis, I.; Athanasiadis, V.; Chatzimitakos, T.; Kalompatsios, D.; Bozinou, E.; Gortzi, O.; Nanos, G.D.; Lalas, S.I. Isolation of Polyphenols from Two Waste Streams of Clingstone Peach Canneries Utilizing the Cloud Point Extraction Method. Biomass 2023, 3, 291–305. [Google Scholar] [CrossRef]
  36. Katsoyannos, E.; Gortzi, O.; Chatzilazarou, A.; Athanasiadis, V.; Tsaknis, J.; Lalas, S. Evaluation of the Suitability of Low Hazard Surfactants for the Separation of Phenols and Carotenoids from Red-Flesh Orange Juice and Olive Mill Wastewater Using Cloud Point Extraction. J. Sep. Sci. 2012, 35, 2665–2670. [Google Scholar] [CrossRef]
  37. Santana, C.M.; Ferrera, Z.S.; Rodríguez, J.J.S. Use of Non-Ionic Surfactant Solutions for the Extraction and Preconcentration of Phenolic Compounds in Water Prior to Their HPLC-UV Detection. Analyst 2002, 127, 1031–1037. [Google Scholar] [CrossRef] [PubMed]
  38. Stamatopoulos, K.; Katsoyannos, E.; Chatzilazarou, A. Antioxidant Activity and Thermal Stability of Oleuropein and Related Phenolic Compounds of Olive Leaf Extract after Separation and Concentration by Salting-Out-Assisted Cloud Point Extraction. Antioxidants 2014, 3, 229–244. [Google Scholar] [CrossRef]
  39. Chatzimitakos, T.; Athanasiadis, V.; Kotsou, K.; Bozinou, E.; Lalas, S.I. Response Surface Optimization for the Enhancement of the Extraction of Bioactive Compounds from Citrus Limon Peel. Antioxidants 2023, 12, 1605. [Google Scholar] [CrossRef]
  40. Shehata, E.; Grigorakis, S.; Loupassaki, S.; Makris, D.P. Extraction Optimisation Using Water/Glycerol for the Efficient Recovery of Polyphenolic Antioxidants from Two Artemisia Species. Sep. Purif. Technol. 2015, 149, 462–469. [Google Scholar] [CrossRef]
  41. Zhao, B.; Sun, M.; Li, J.; Su, Z.; Cai, Z.; Shen, Z.; Ma, R.; Yan, J.; Yu, M. Carotenoid Profiling of Yellow-Flesh Peach Fruit. Foods 2022, 11, 1669. [Google Scholar] [CrossRef]
  42. Cirilli, M.; Bassi, D.; Ciacciulli, A. Sugars in Peach Fruit: A Breeding Perspective. Hortic. Res. 2016, 3, 15067. [Google Scholar] [CrossRef] [PubMed]
  43. Petruccelli, R.; Bonetti, A.; Ciaccheri, L.; Ieri, F.; Ganino, T.; Faraloni, C. Evaluation of the Fruit Quality and Phytochemical Compounds in Peach and Nectarine Cultivars. Plants 2023, 12, 1618. [Google Scholar] [CrossRef]
  44. Chatzilazarou, A. Application of Cloud Point Extraction with the Aid of Genapol X-080 in the Pre-Concentration of Lycopene and Total Carotenoids from Red Fleshed Orange. Ernähr.—Wiss. Prax. 2011, 35, 5–13. [Google Scholar]
  45. Sosa Ferrera, Z.; Padrón Sanz, C.; Mahugo Santana, C.; Santana Rodríguez, J.J. The Use of Micellar Systems in the Extraction and Pre-Concentration of Organic Pollutants in Environmental Samples. TrAC Trends Anal. Chem. 2004, 23, 469–479. [Google Scholar] [CrossRef]
  46. Chatzimitakos, T.G.; Stalikas, C.D. Melamine Sponge Decorated with Copper Sheets as a Material with Outstanding Properties for Microextraction of Sulfonamides Prior to Their Determination by High-Performance Liquid Chromatography. J. Chromatogr. A 2018, 1554, 28–36. [Google Scholar] [CrossRef]
  47. Santalad, A.; Burakham, R.; Srijaranai, S.; Srijaranai, S.; Deming, R.L. Role of Different Salts on Cloud-Point Extraction of Isoprocarb and Promecarb Insecticides Followed by High-Performance Liquid Chromatography. J. Chromatogr. Sci. 2012, 50, 523–530. [Google Scholar] [CrossRef] [PubMed]
  48. Mortada, W.I.; Hassanien, M.M.; El-Asmy, A.A. Cloud Point Extraction of Some Precious Metals Using Triton X-114 and a Thioamide Derivative with a Salting-out Effect. Egypt. J. Basic Appl. Sci. 2014, 1, 184–191. [Google Scholar] [CrossRef]
  49. Kaur, G.; Mehta, S.K. Developments of Polysorbate (Tween) Based Microemulsions: Preclinical Drug Delivery, Toxicity and Antimicrobial Applications. Int. J. Pharm. 2017, 529, 134–160. [Google Scholar] [CrossRef] [PubMed]
  50. Alibade, A.; Batra, G.; Bozinou, E.; Salakidou, C.; Lalas, S. Optimization of the Extraction of Antioxidants from Winery Wastes Using Cloud Point Extraction and a Surfactant of Natural Origin (Lecithin). Chem. Pap. 2020, 74, 4517–4524. [Google Scholar] [CrossRef]
  51. Chatzimitakos, T.; Athanasiadis, V.; Mantiniotou, M.; Kalompatsios, D.; Bozinou, E.; Giovanoudis, I.; Lalas, S.I. Exploring the Feasibility of Cloud-Point Extraction for Bioactive Compound Recovery from Food Byproducts: A Review. Biomass 2023, 3, 306–322. [Google Scholar] [CrossRef]
  52. Ristroph, K.D.; Prud’homme, R.K. Hydrophobic ion pairing: Encapsulating small molecules, peptides, and proteins into nanocarriers. Nanoscale Adv. 2019, 1, 4207–4237. [Google Scholar] [CrossRef]
  53. Di Vaio, C.; Graziani, G.; Marra, L.; Cascone, A.; Ritieni, A. Antioxidant Capacities, Carotenoids and Polyphenols Evaluation of Fresh and Refrigerated Peach and Nectarine Cultivars from Italy. Eur. Food Res. Technol. 2008, 227, 1225–1231. [Google Scholar] [CrossRef]
  54. Li, Y.; Li, L.; Zhang, X.; Mu, Q.; Tian, J.; Yan, J.; Guo, L.; Wang, Y.; Song, L.; Yu, X. Differences in Total Phenolics, Antioxidant Activity and Metabolic Characteristics in Peach Fruits at Different Stages of Ripening. LWT 2023, 178, 114586. [Google Scholar] [CrossRef]
  55. Liu, H.; Jiang, W.; Cao, J.; Li, Y. Changes in Extractable and Non-Extractable Polyphenols and Their Antioxidant Properties during Fruit On-Tree Ripening in Five Peach Cultivars. Hortic. Plant J. 2019, 5, 137–144. [Google Scholar] [CrossRef]
  56. Gil, M.I.; Tomás-Barberán, F.A.; Hess-Pierce, B.; Kader, A.A. Antioxidant Capacities, Phenolic Compounds, Carotenoids, and Vitamin C Contents of Nectarine, Peach, and Plum Cultivars from California. J. Agric. Food Chem. 2002, 50, 4976–4982. [Google Scholar] [CrossRef]
Figure 1. Impact of sample pH on the extraction of polyphenols from peach samples; Standard deviation of triplicate analyses is shown with error bars; Different letters (i.e., a–d) demote samples with statistically significant differences (p < 0.05).
Agriengineering 05 00131 g001
Figure 2. Impact of sodium chloride (NaCl) addition in several concentrations on the extraction of polyphenols from peach samples; Standard deviation of triplicate analyses is shown with error bars; Different letters (i.e., a–c) demote samples with statistically significant differences (p < 0.05).
Agriengineering 05 00131 g002
Figure 3. Percentage polyphenol recovery with Tween 80 on peach samples; Standard deviation of triplicate analyses is shown with error bars; Different letters (i.e., a–f) demote samples with statistically significant differences (p < 0.05).
Agriengineering 05 00131 g003
Figure 4. Impact of different solvents on the extraction of polyphenols from Everts unripe peach sample; Standard deviation of triplicate analyses is shown with error bars; Different letters (i.e., a–d) demote samples with statistically significant differences (p < 0.05).
Agriengineering 05 00131 g004
Figure 5. Principal component analysis (PCA) for the measured variables. The inset table includes the eigenvalues. Asterisks and colored values denote statistically significant values. Samples (AU: Andross unripe; AR: Andross ripe; EU: Everts unripe; ER: Everts ripe).
Agriengineering 05 00131 g005
Figure 6. Multivariate correlation analysis of measured variables.
Agriengineering 05 00131 g006
Table 1. Physicochemical characteristics of peach samples.
ParametersSamples
AUAREUER
Weight (g)121.62 ± 2.43 d389.33 ± 7.78 a138.31 ± 3.45 c340.35 ± 8.85 b
Water content (% w/w)75.82 ± 2.12 b88.36 ± 2.47 a77.12 ± 2.08 b90.77 ± 2.72 a
pH3.70 ± 0.02 c4.27 ± 0.01 a3.65 ± 0.02 d4.20 ± 0.01 b
Titratable acidity (TA) (as % w/w malic acid)0.71 ± 0.06 a0.28 ± 0.03 b0.81 ± 0.07 a0.33 ± 0.03 b
Total Soluble Solids (TSS) (°Brix)6.12 ± 0.18 c10.76 ± 0.32 b6.83 ± 0.21 c12.61 ± 0.38 a
Sweetness Index (TSS/TA ratio)8.65 ± 0.48 b38.64 ± 3.01 a8.46 ± 0.47 b38.35 ± 2.34 a
Astrigency Index (TA/TSS ratio)0.12 ± 0.01 a0.03 ± 0 b0.12 ± 0.01 a0.03 ± 0 b
L* (lightness)62.1 ± 0.1 c72.3 ± 0.2 a58.4 ± 0.1 d68.5 ± 0.2 b
a* (redness)−10.6 ± 0.1 c21.1 ± 0.1 b−14.6 ± 0.1 d30.2 ± 0.1 a
b* (yellowness)40.1 ± 0.1 c60.5 ± 0.1 b65.2 ± 0.1 a38.3 ± 0.1 d
Samples (AU: Andross unripe; AR: Andross ripe; EU: Everts unripe; ER: Everts ripe). The values of pH, TA, and SSC, along with L*, a*, and b* values, are expressed as means standard (n = 3), while the value of weight is measured ten times and expressed as means standard (n = 10). Significant differences at p < 0.05 are indicated by different letters (e.g., a–d) in the same row.
Table 2. Total polyphenol content (TPC), ferric reducing antioxidant power (FRAP) assay, and DPPH radical scavenging activity in unripe and ripe peach samples with Tween 80.
SamplesTPC
(mg GAE/kg)
FRAP
(mmol AAE/kg)
DPPH
(mmol AAE/kg)
AU1465.32 ± 42.49 b7.33 ± 0.16 b5.12 ± 0.15 b
AR696.74 ± 20.21 c3.47 ± 0.08 c2.33 ± 0.07 c
EU1714.53 ± 49.72 a8.57 ± 0.19 a6.08 ± 0.18 a
ER753.21 ± 21.84 c3.76 ± 0.08 c2.54 ± 0.08 c
Samples (AU: Andross unripe; AR: Andross ripe; EU: Everts unripe; ER: Everts ripe). Values are shown as the mean values (±SD) of triplicate analyses. Significant differences at p < 0.05 are indicated by different letters (e.g., a–c) in the same column.
Disclaimer/Publisher’s Note: The statements, opinions and data contained in all publications are solely those of the individual author(s) and contributor(s) and not of MDPI and/or the editor(s). MDPI and/or the editor(s) disclaim responsibility for any injury to people or property resulting from any ideas, methods, instructions or products referred to in the content.

