1. Introduction
The United States (US) is the largest turkey producer in the world, producing 210 million birds worth
$7.10 billion in 2022 [
1]. In the US, turkeys are produced for meat and are mostly raised in confinement. Light and heavy turkey hens are marketed at 14 and 18 weeks at average market weights of 6.6 and 8.7 kg, respectively, while tom turkeys are marketed at 20 weeks at 20.4 kg [
2]. However, market weights and ages vary with the integrator and geographical location.
Nearly all US broiler houses have tunnel ventilation, but most turkey houses are naturally ventilated due to economic reasons (J. Austin Baker, 17 July 2023, personal communication). Some US turkey houses are sidewall-ventilated. Few poultry houses are tunnel-ventilated in Brazil [
3], the second biggest turkey producer. In Europe, poultry houses mostly use sidewall ventilation [
4].
In natural ventilation, inside vs. outside temperature and pressure differences induce ventilation, which is aided by mixing fans. Mechanical ventilation is provided by fans and can be tunnel or sidewall (or cross) ventilation [
5]. In tunnel-ventilated houses, fresh air enters through large openings at one end and the stale air is exhausted by fans at the opposite end of the house. Large volumes of air traveling along the length of the house produce high airspeeds (≥3 m·s
−1), which cools the birds. Sidewall-ventilated houses have fans on the sidewall pushing fresh air or pulling exhaust air into or from the house, with the opposite screened wall serving as an outlet or inlet. Average airspeeds in sidewall-ventilated houses are <1 m·s
−1 [
4], much lower than tunnel-ventilated houses even with the same ventilation rate (m
3·min
−1·kg
−1). Lateral air movement across a much larger cross-sectional area results in a much lower airspeed vs. the tunnel house, where it moves longitudinally across a much smaller cross-sectional area.
In mechanically ventilated houses, as air temperature increases, the ventilation rate is increased to reduce bird heat stress. The resulting airspeed provides a wind chill that reduces heat stress. Here, wind chill is defined as the reduction in temperature experienced by the bird due to some known airspeed vs. still air but at the same air temperature. As air temperature approaches bird surface temperature, airspeed alone is inadequate and evaporative cooling is provided to mitigate heat stress. In tunnel houses, evaporative cooling is provided using cool cell pads and/or foggers (or misters), while only foggers (or misters) can be used in sidewall-ventilated or naturally ventilated houses. Aviagen recommends activating evaporative cooling when air temperature exceeds 29 °C but not below 27 °C when ambient relative humidity (RH) exceeds 80% [
6] to reduce the risk of wet litter that can increase ammonia levels and footpad concerns. However, in naturally ventilated houses, due to very low airspeeds, heat stress cannot be mitigated until evaporative cooling is activated. Hence, heat stress could start at much lower air temperatures in naturally ventilated houses vs. mechanically ventilated houses.
Heat stress, even at moderate temperatures, can adversely affect turkey welfare and performance. Turkeys ranging in age from 42 d to 140 d consumed more feed at 18 °C than at 28 °C. Average feed intake decreased by 2.3% per °C as temperature increased from 18 to 28 °C [
7]. In a 4-week study, when 4-week-old tom and hen turkeys were exposed to five temperatures (12, 18, 24, 28, 32 °C), feed intake decreased linearly with increasing temperature while weight gain peaked at 18 °C [
8]. Turkey breast meat yield declined even at temperatures in the range of 25 to 30 °C [
9]. Older turkeys are in the danger zone when temperature and RH exceed 29 °C and 50% RH, respectively [
10]. Hence, there is a need to assess the impact of low airspeed and moderate temperature conditions (prior to activation of foggers) on tom turkeys raised in naturally ventilated houses.
Modern turkeys are more susceptible to heat stress than the older genetic lines because they grow faster (higher metabolism) and are fed higher energy diets [
11]. A 20.4 kg tom turkey from 1992–1998 produced 170% more heat than a turkey of the same size from 1974–1977 [
12]. In the US, because modern turkeys are marketed at heavier weights, e.g., 14.4 kg in 2022 [
1] vs. 10.0 kg in 1992 [
13], they possess lesser surface area per unit mass and deeper cores that reduce their abilities to lose heat (vs. older turkeys), further increasing heat stress. Aviagen, a major turkey breeder, recommends a target air temperature of 12.8 °C for tom (male) turkeys 15 weeks or older [
6].
Hence, the overall objective of this study was to evaluate the impacts of low airspeeds on tom turkeys 13 to 20 weeks of age under moderate temperatures (<25 °C). The specific objectives are listed below.
Evaluate the short-term impact of four low airspeeds on heat stress experienced by tom turkeys housed in chambers at two different temperatures.
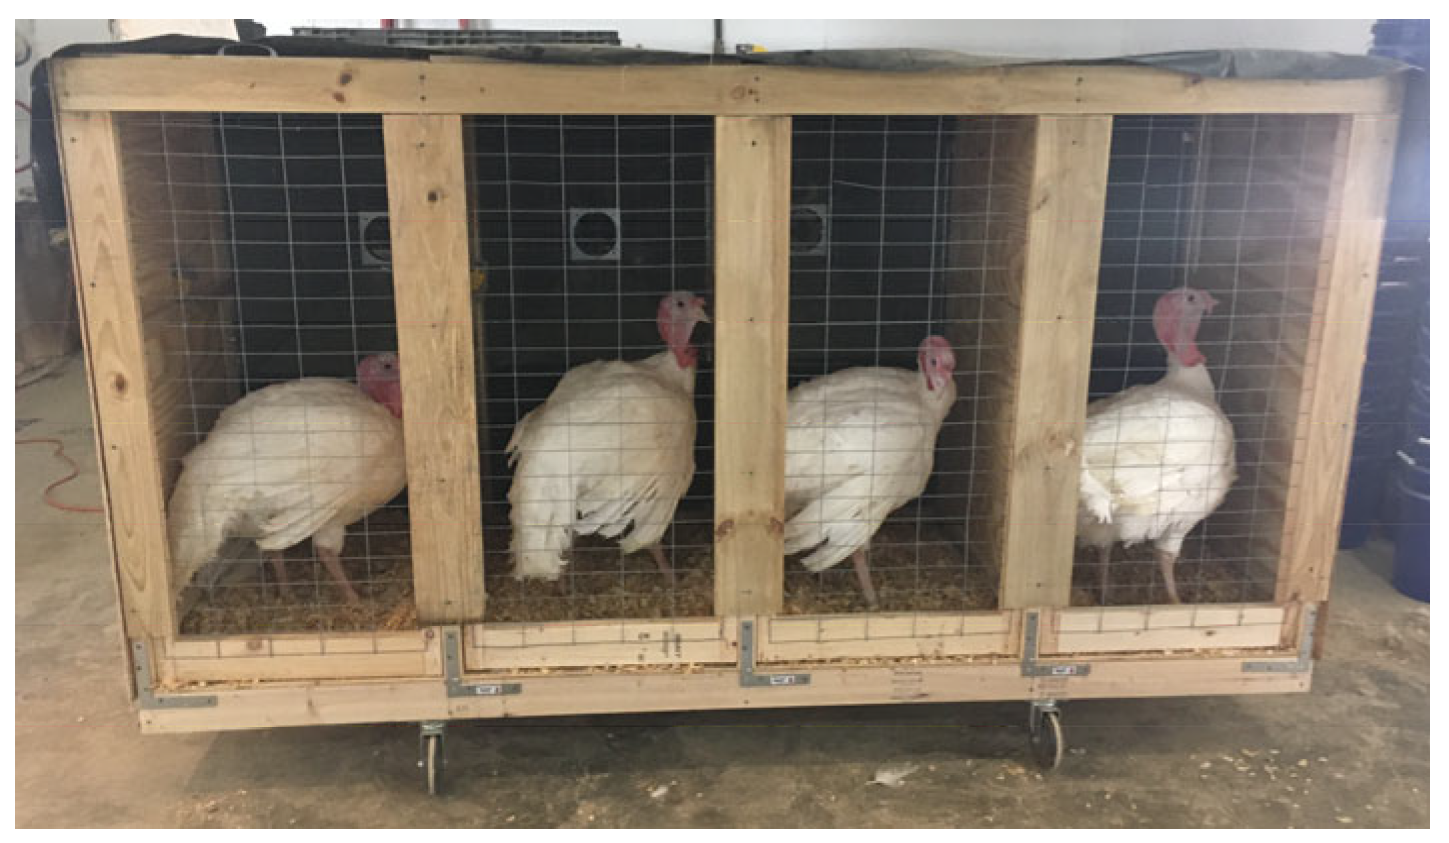
Evaluate the longer-term impact of four low airspeeds on heat stress and performance of tom turkeys housed in rooms.
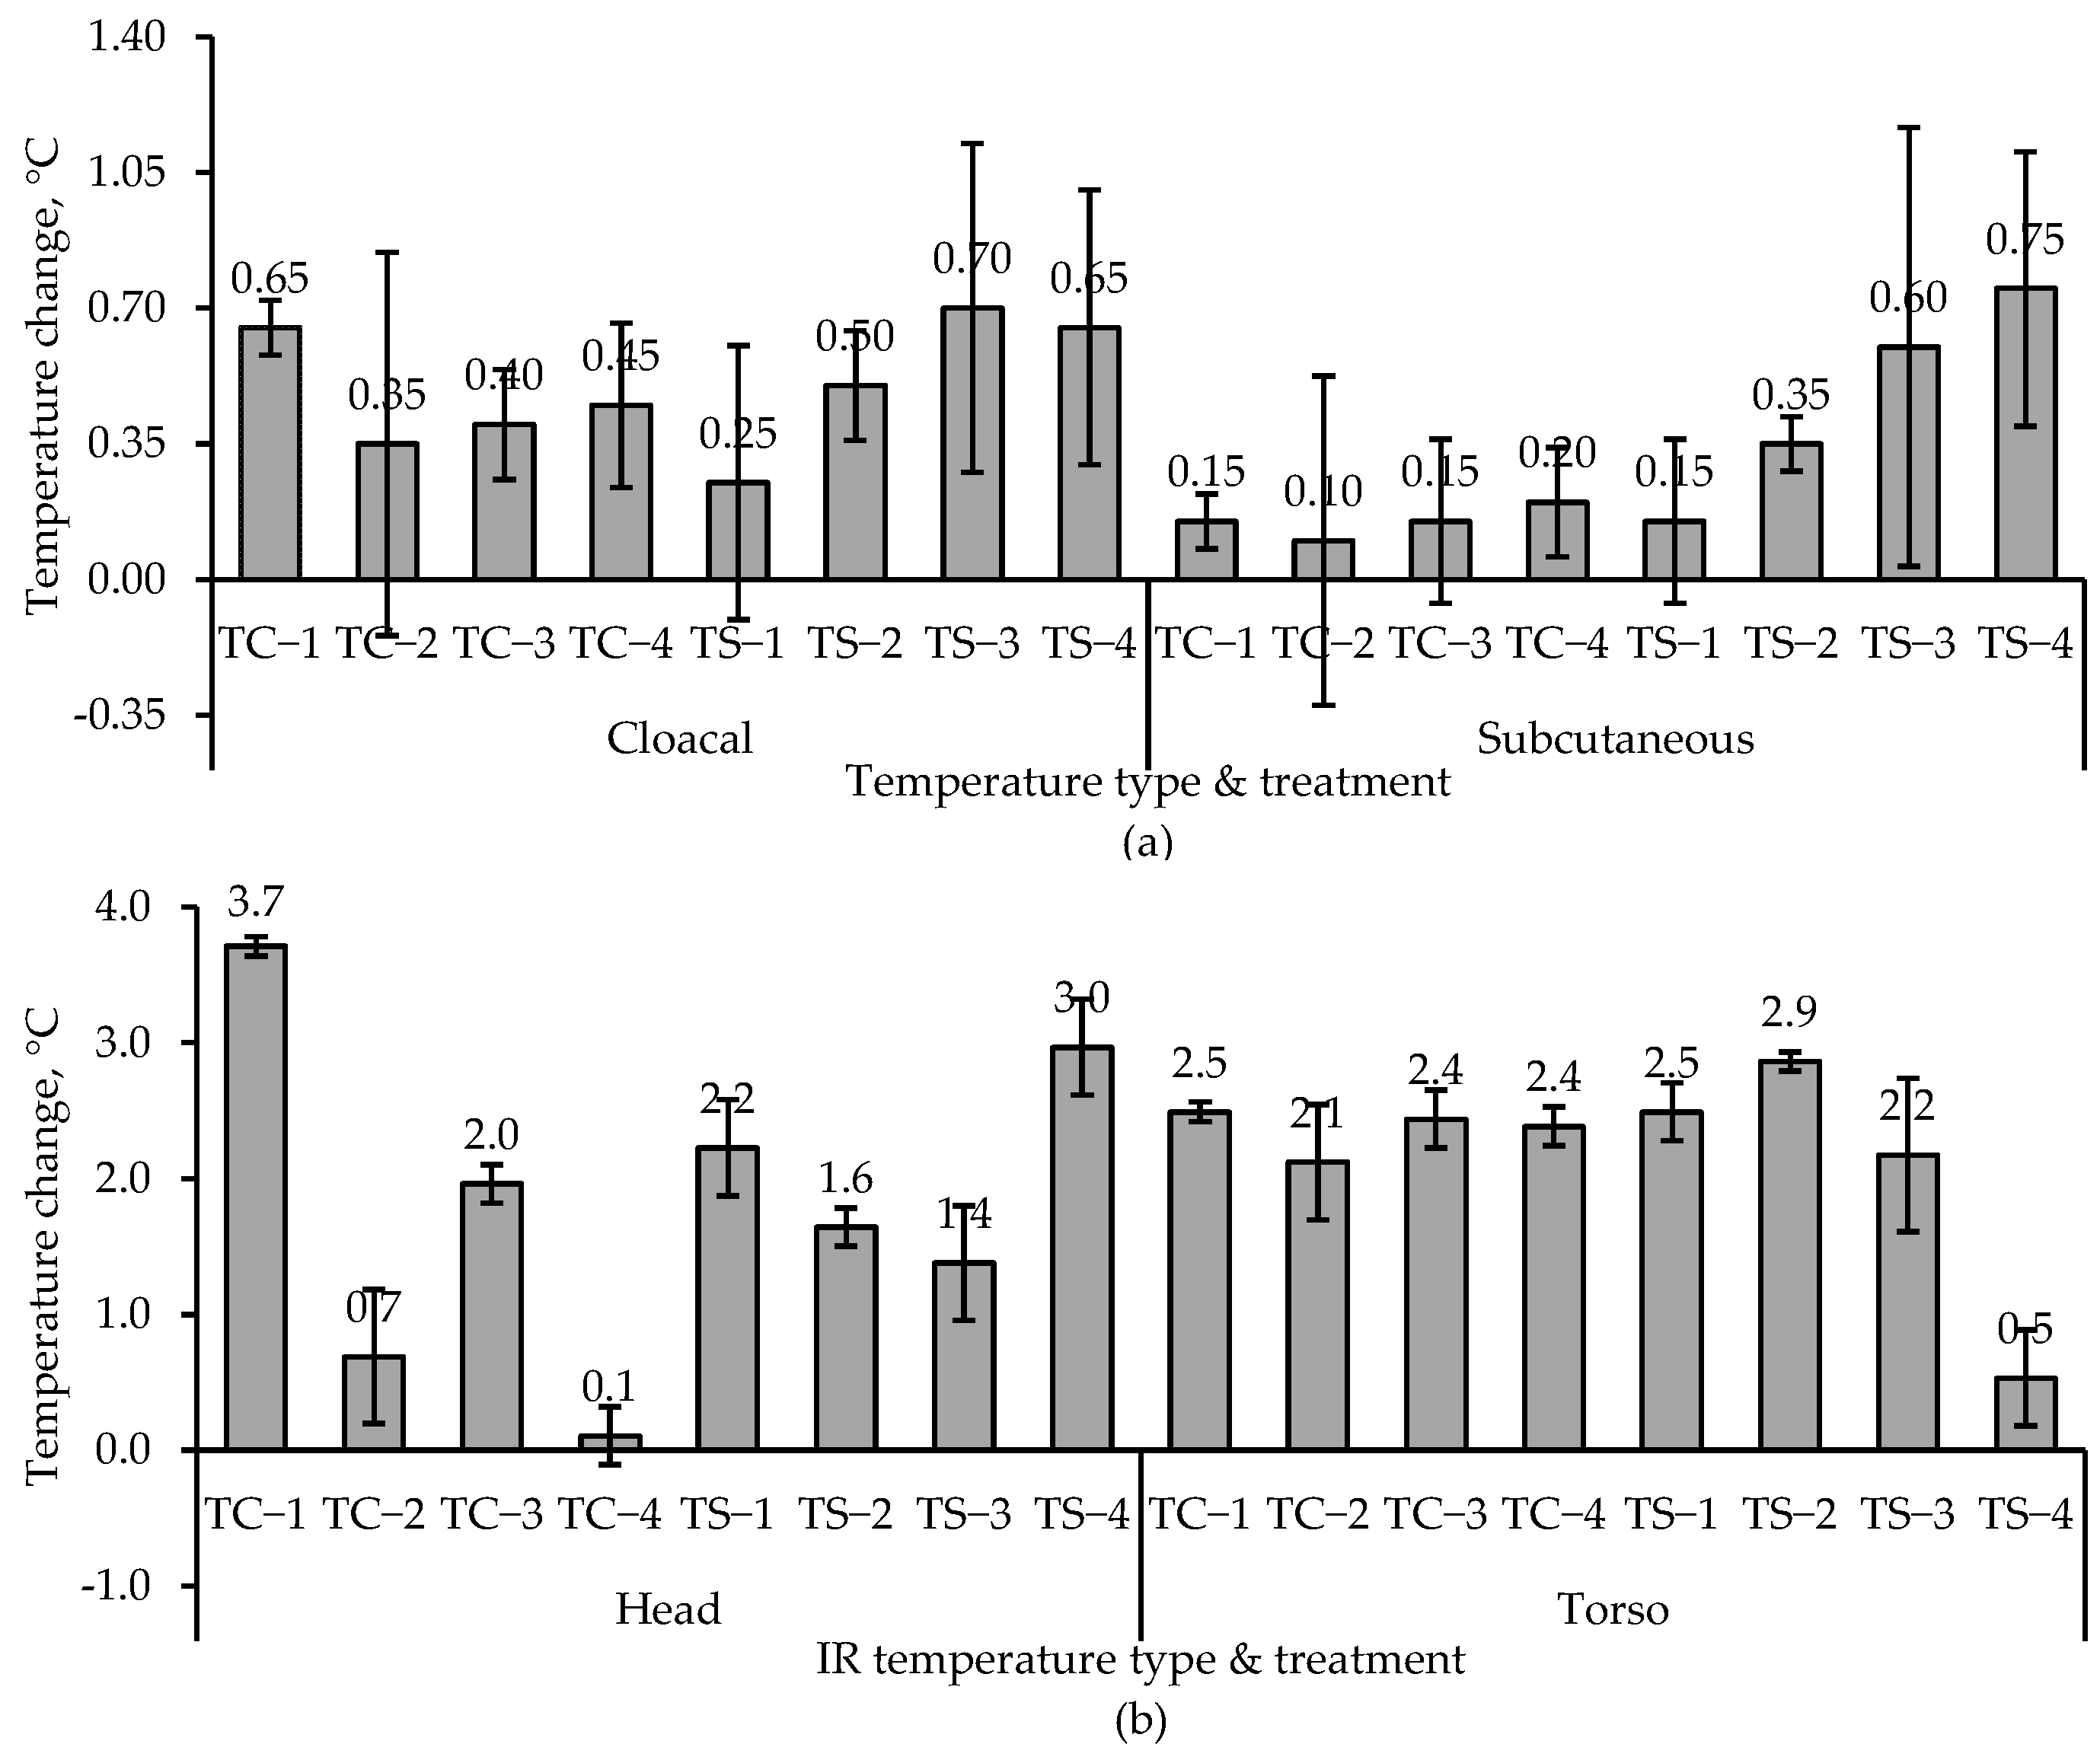
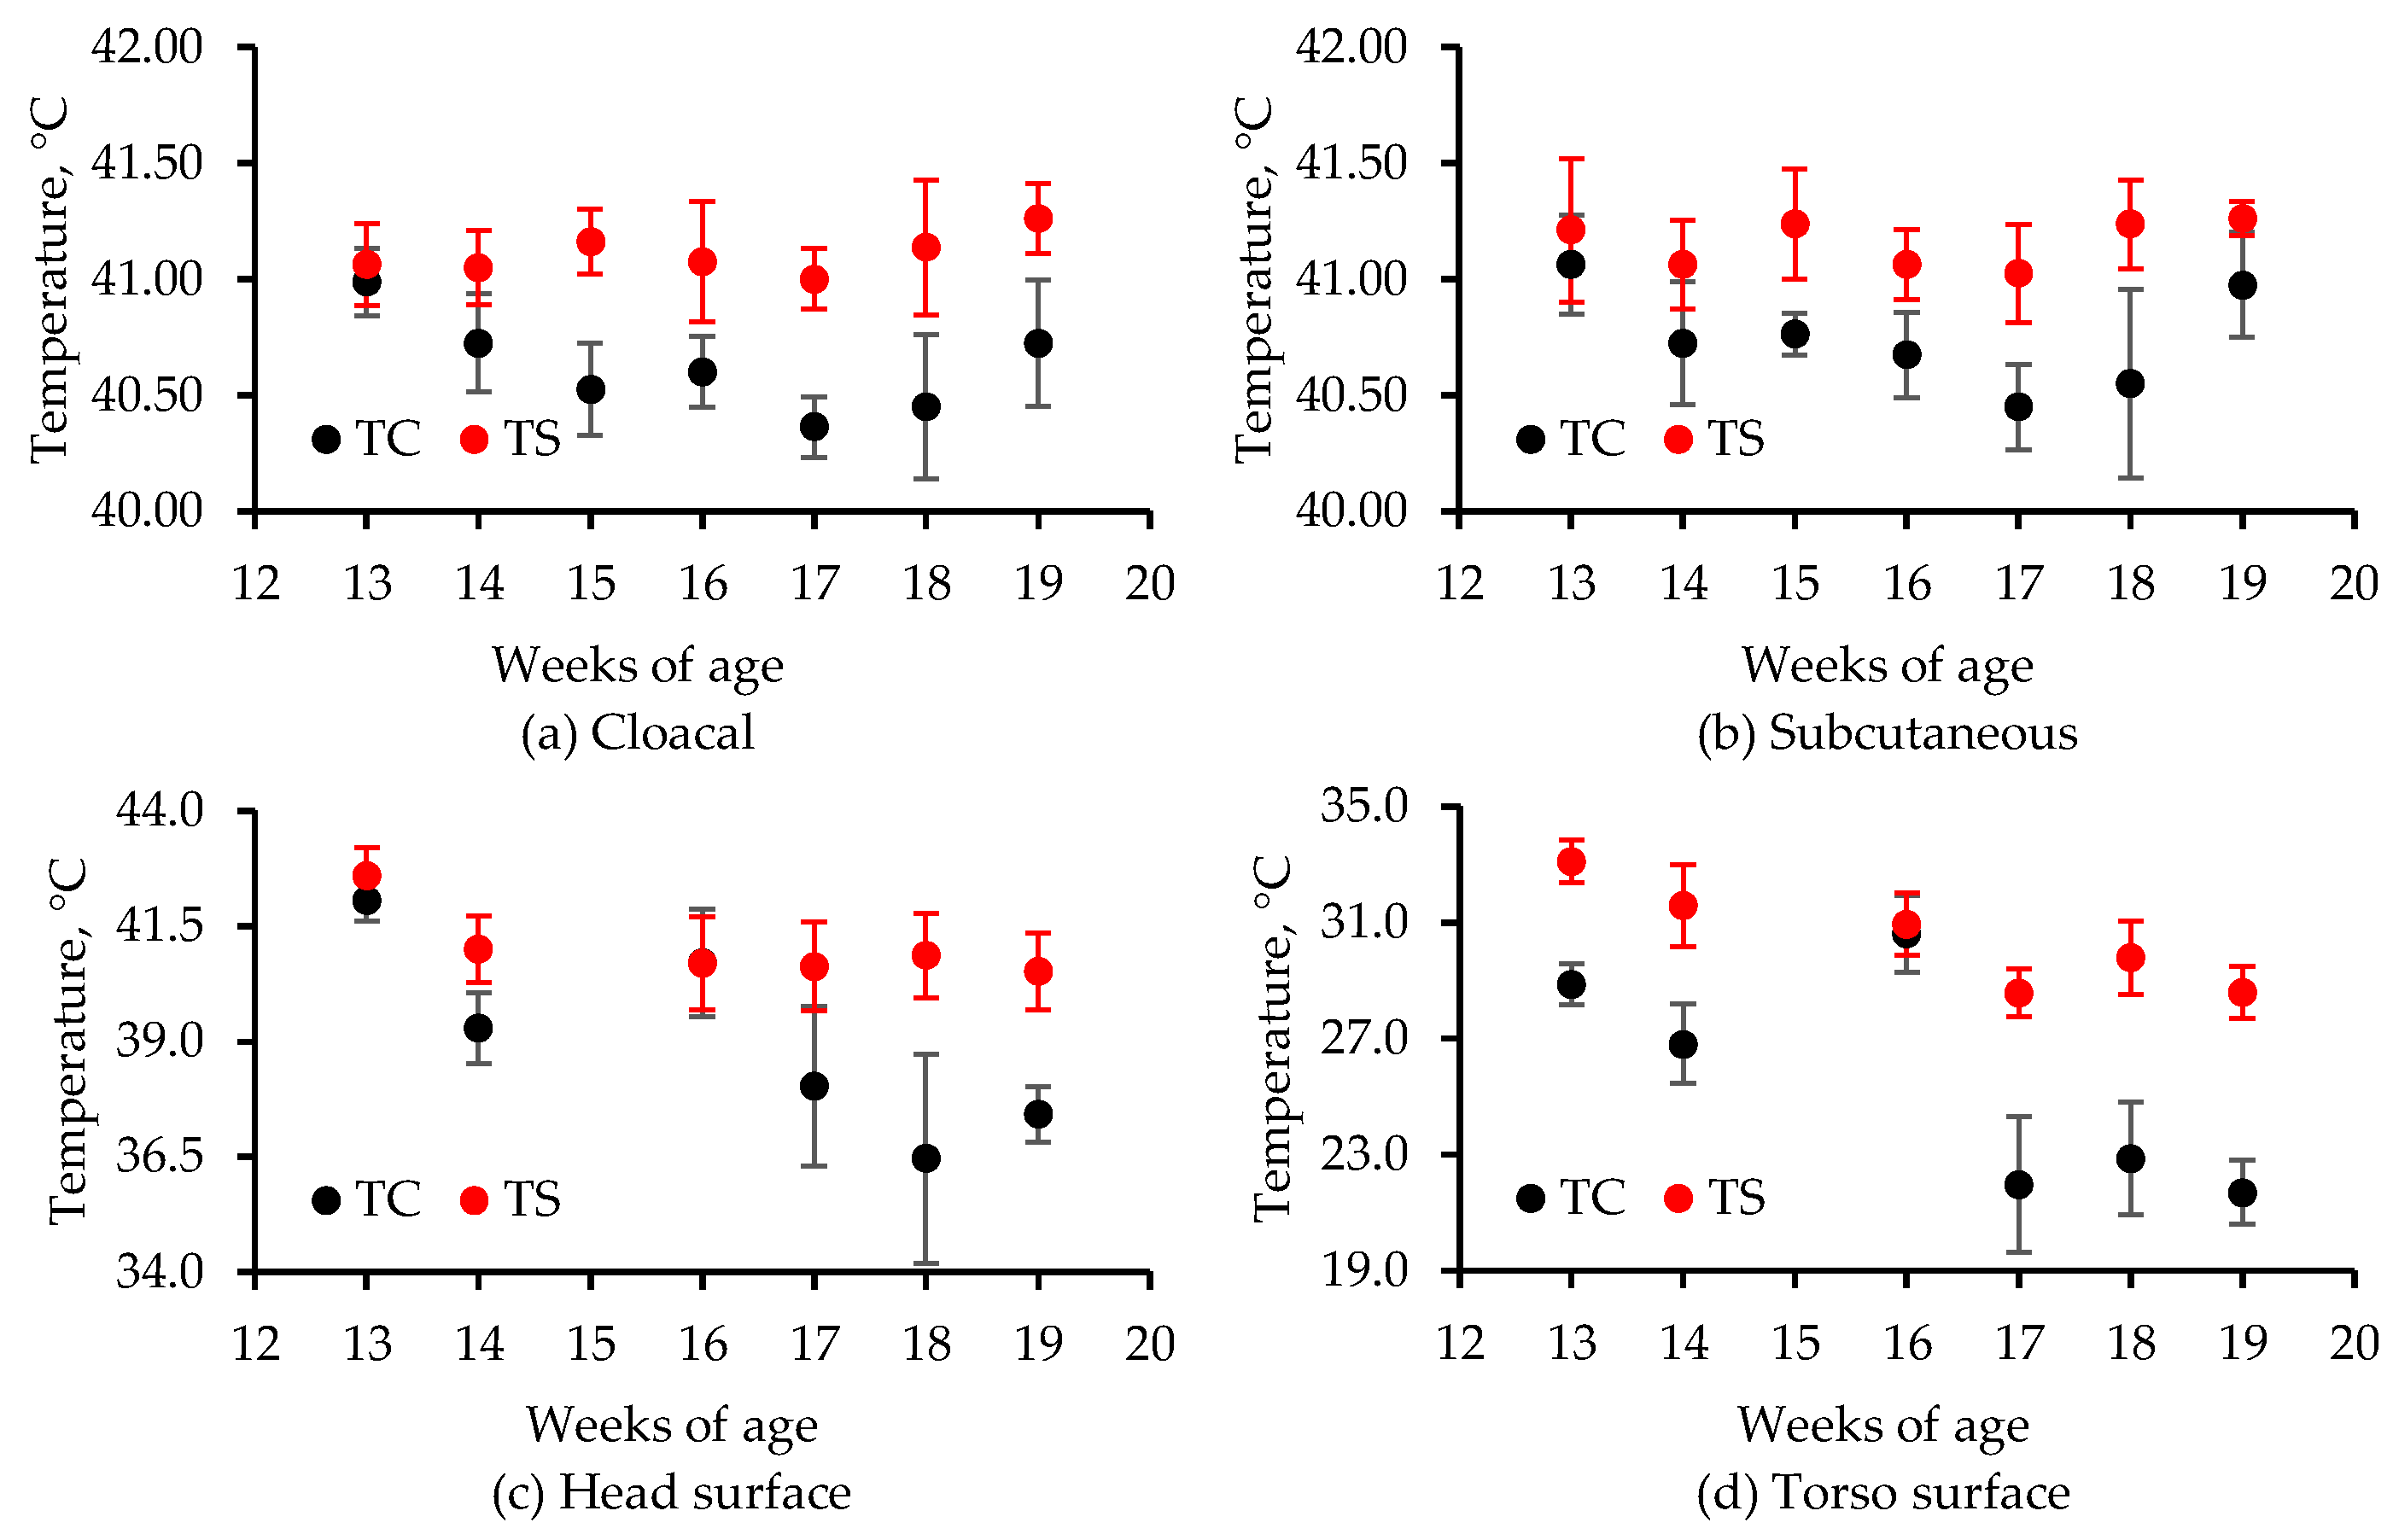
In the chamber study, heat stress was directly assessed with cloacal [
14] and implantable [
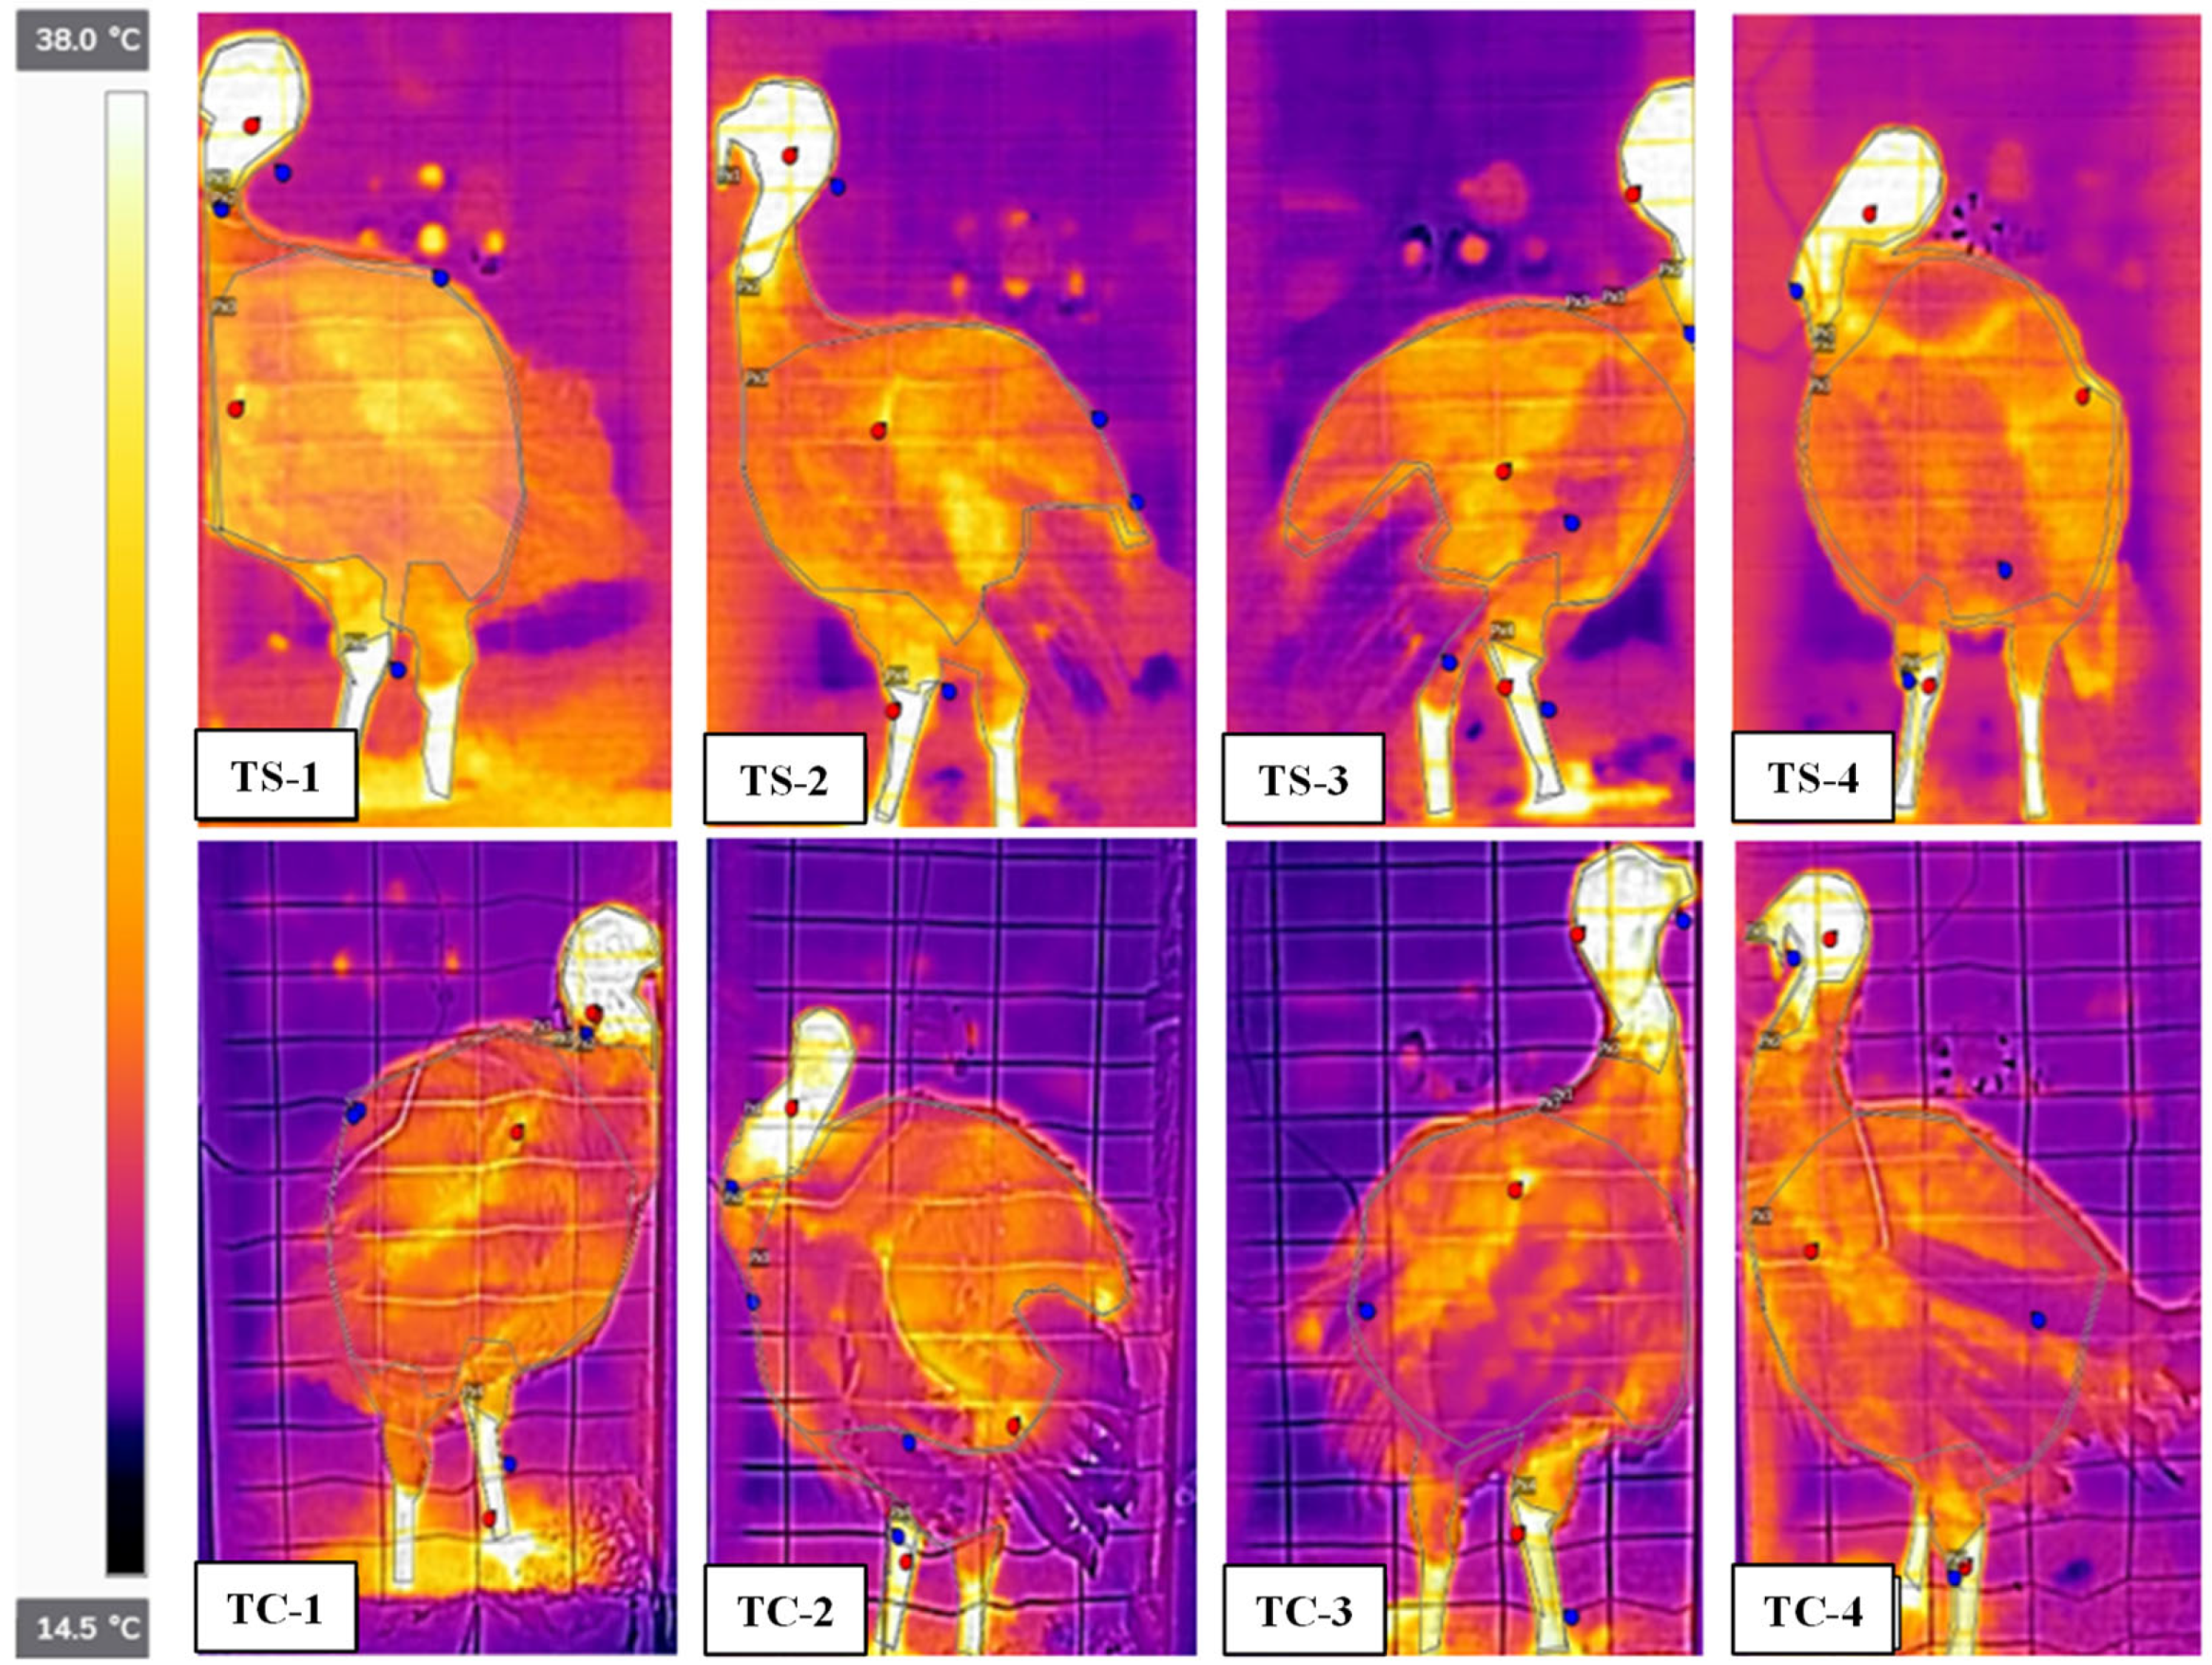
15] temperature measurements as well as IR thermometry [
16], whereas in the room study, temperature measurements were made using implantable sensors and IR thermography. In the room study, heat stress was also assessed based on weight gain and blood chemistry [
17]. Infrared thermography is being used to monitor heat stress and diseases in many livestock species, including poultry [
18]. Hence, it may be possible to measure rapid wind chill based on surface temperature reduction.
4. Conclusions
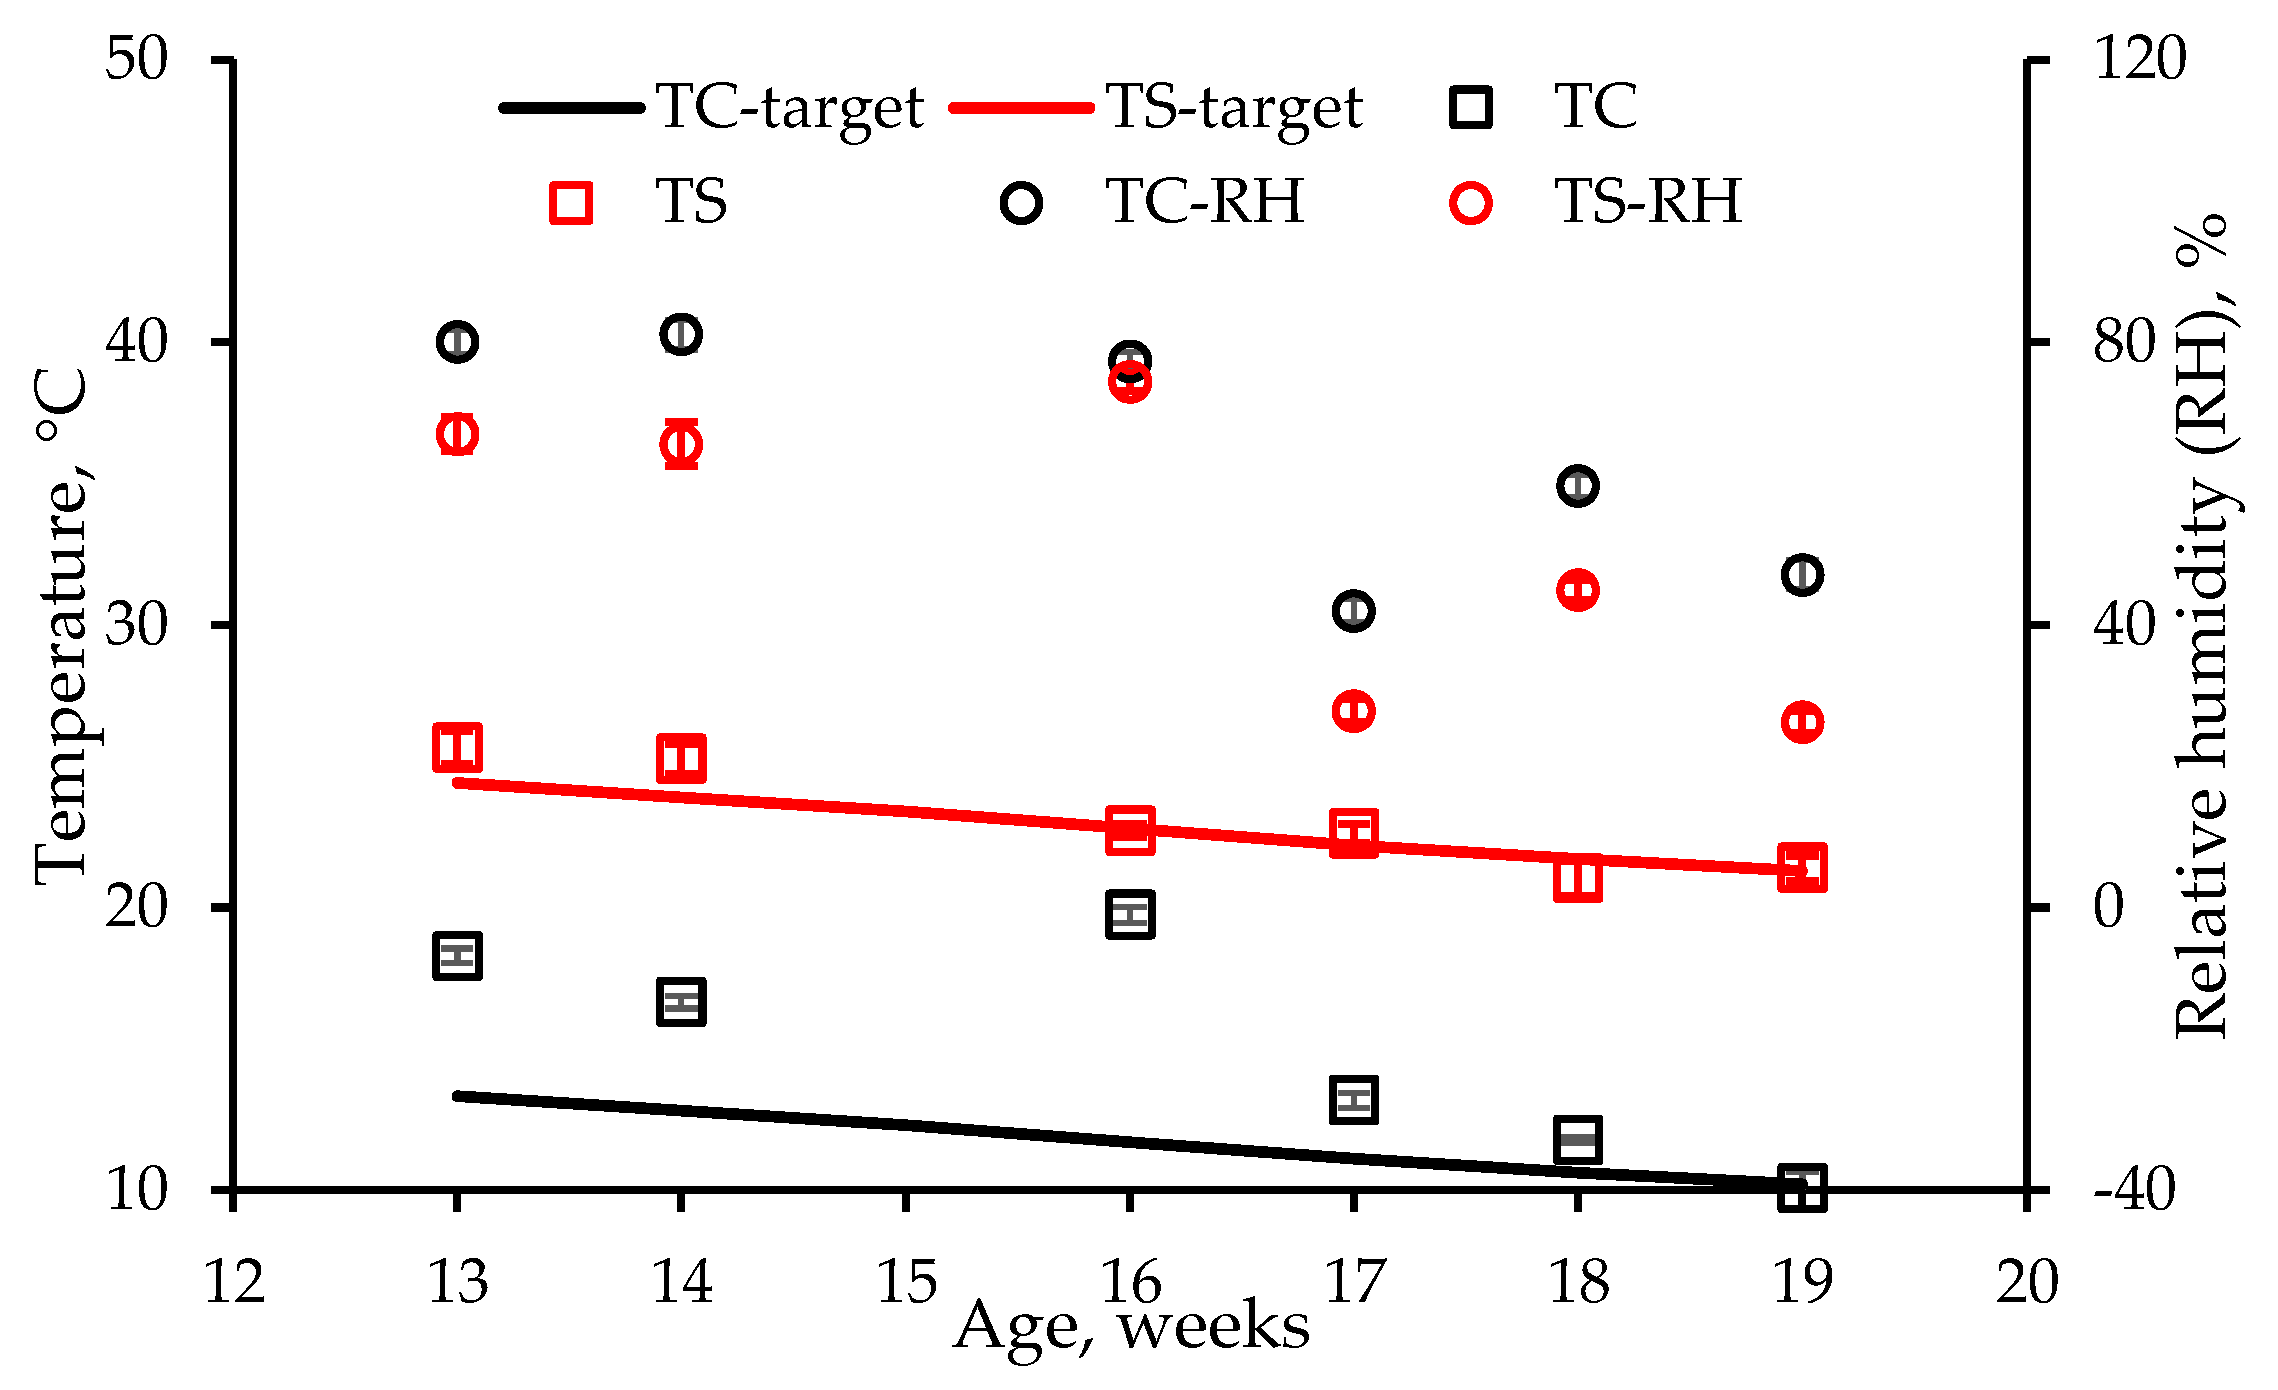
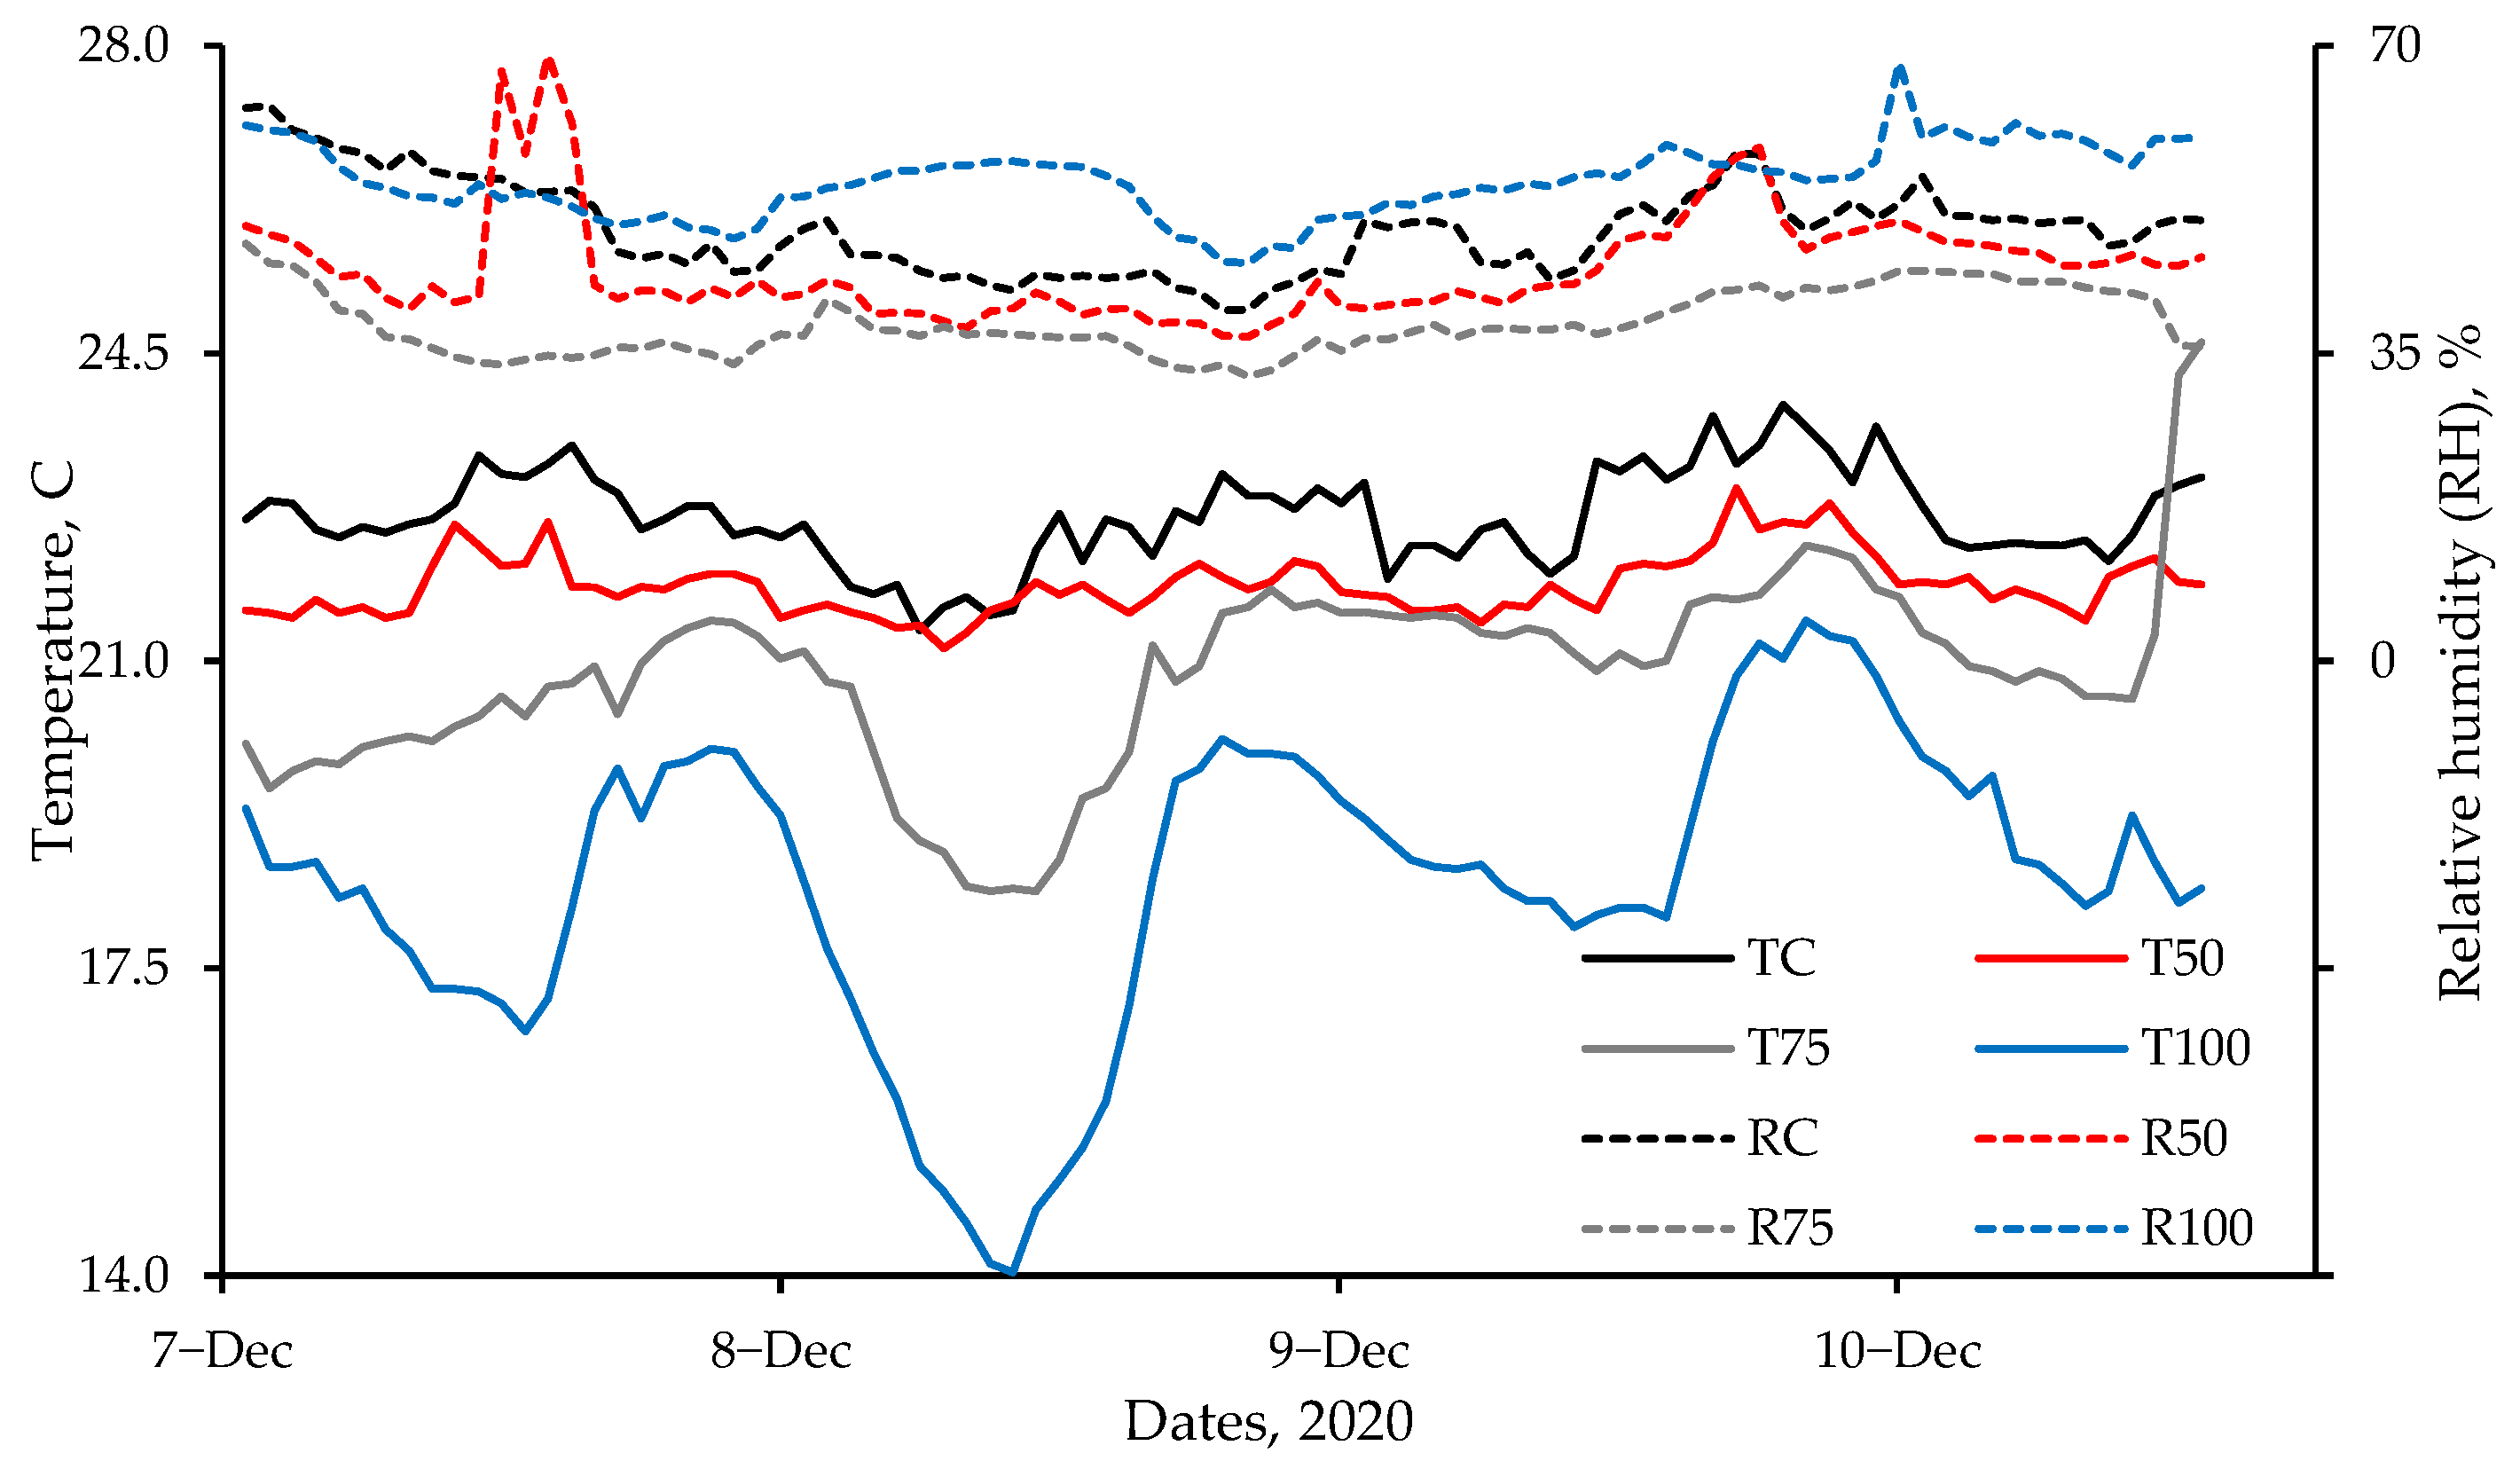
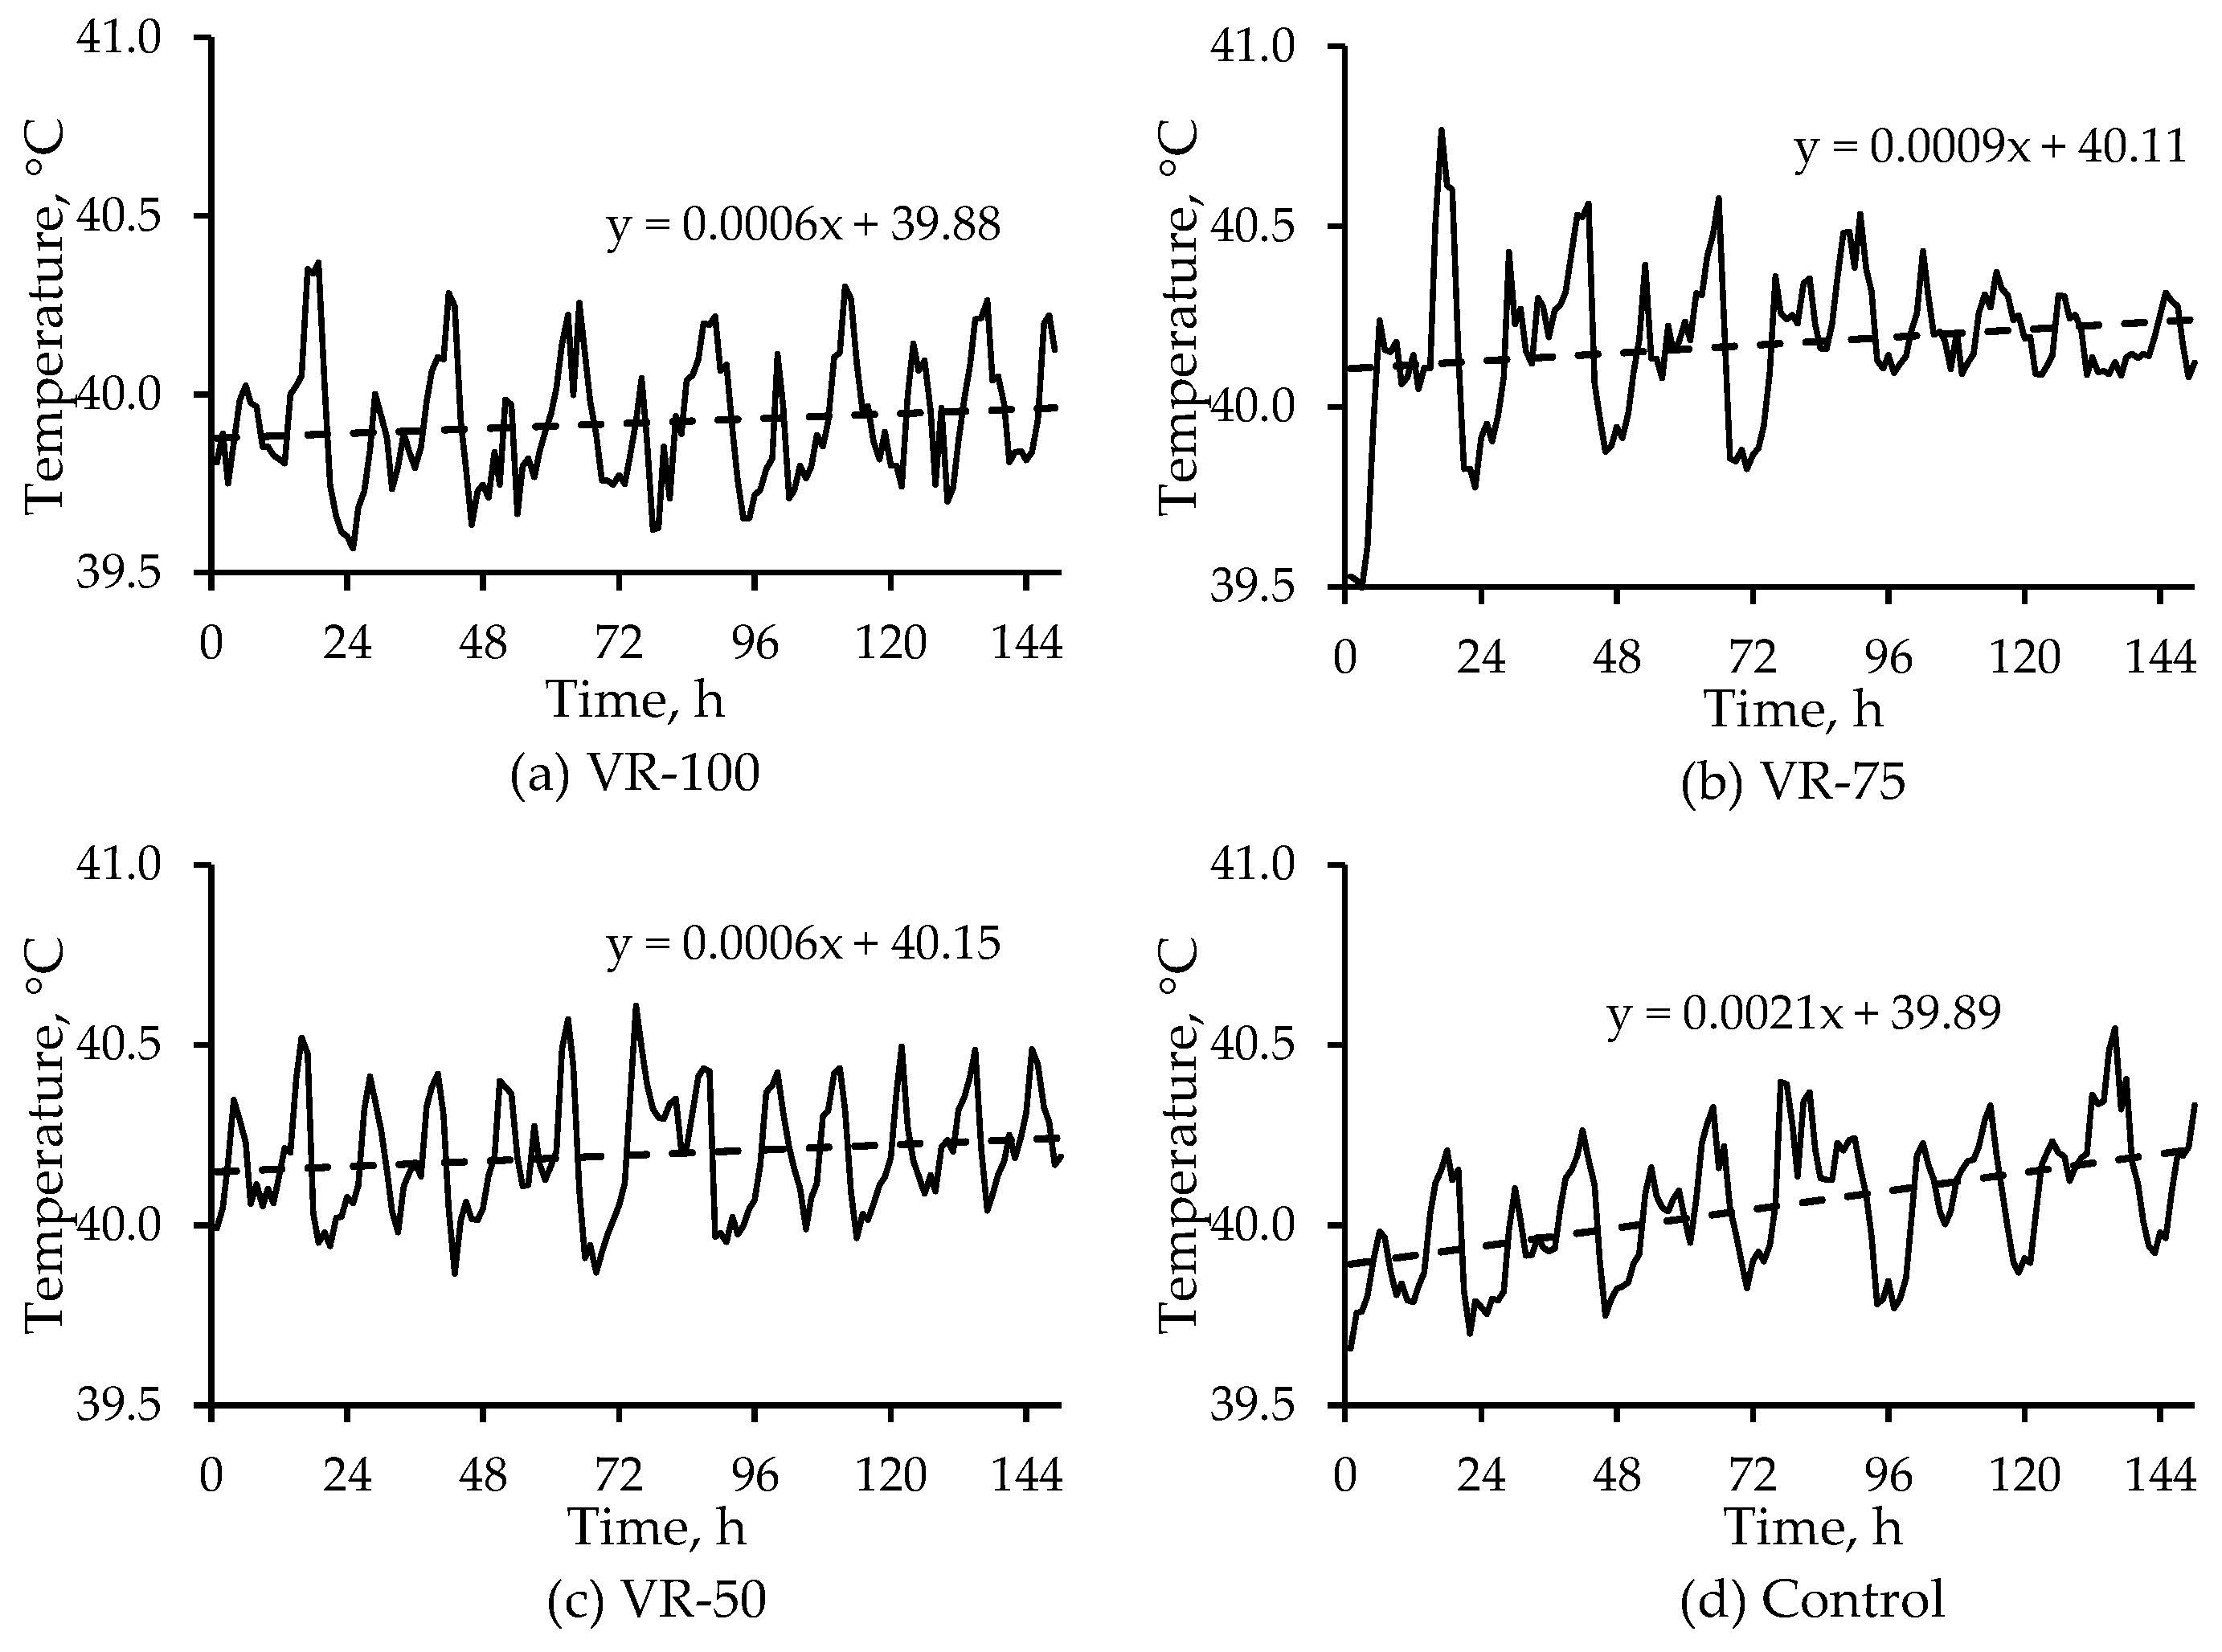
Chamber and room studies were used to assess heat stress at moderate temperatures (<25 °C) and low airspeeds on grown tom turkeys. Subcutaneous, cloacal, and IR temperatures were used, whereas blood chemistry and weight gain were also used in the room study to assess heat stress. In the chamber study, a combination of four ventilation rates and two temperatures (thermal comfort and heat stress) were applied to 13- to 19-week birds. Despite large differences in chamber airflow rates, the lack of treatment effect on any temperature measurement was due to low airspeeds, which were similar among the treatments. Subcutaneous temperature was a better quantitative indicator of short-term (2-h) heat stress than cloacal temperature. In a 6-day room study, where the target room temperature was 11 °C above the comfortable temperature of 21-week toms, four ventilation rates were used. The VR-100, VR-75, and VR-50 treatments had significantly lower whole-body temperatures (IR) than the Control treatment, though VR-100, VR-75, and VR-50 treatments did not significantly differ from one another. With respect to the head IR temperatures, it was VR-75 > VR-100 ≈ VR-50 > Control treatment; there was no treatment effect on subcutaneous temperature. Weight gain was significantly higher in the VR-100 vs. VR-50, whereas there were no significant differences between the other pairs of treatments. There was no treatment effect on hematology. Unlike the chamber study, in the room study, due to the larger number of replicates, the low-cost IR camera effectively detected surface temperature differences as low as 0.8 °C, resulting from small temperature and RH differences but not airspeed differences that were very low. Hence, the FLIR E8 camera could measure small differences in heat stress. Based on the USDA wind chill curve for 7-week broilers, the IR camera could measure wind chill as low as 0.8 °C at an airspeed of 0.8 m·s−1 vs. still air. The combination of machine vision with IR thermography could allow for measuring and mitigating poultry heat stress in real time. Such a system might also be useful in disease detection.


