Article

Detection of Varroa destructor Infestation of Honeybees Based on Segmentation and Object Detection Convolutional Neural Networks

1
College of Mechanical and Electrical Engineering, Shandong Agriculture University, Tai’an 271018, China
2
College of Animal Science and Technology, Shandong Agriculture University, Tai’an 271018, China
*
Authors to whom correspondence should be addressed.
AgriEngineering 2023, 5(4), 1644-1662; https://doi.org/10.3390/agriengineering5040102
Submission received: 5 July 2023 / Revised: 13 September 2023 / Accepted: 21 September 2023 / Published: 26 September 2023
(This article belongs to the Special Issue Computer Vision for Agriculture and Smart Farming)

Abstract

:
Varroa destructor infestation is a major factor leading to the global decline of honeybee populations. Monitoring the level of Varroa mite infestation in order to take timely control measures is crucial for the protection of bee colonies. Machine vision systems can achieve non-invasive Varroa mite detection on bee colonies, but it is challenged by two factors: the complex dynamic scenes of honeybees and small-scale and limited data on Varroa destructor. We design a convolutional neural network integrated with machine vision to solve these problems. To address the first challenge, we separate the image of the honeybee from its surroundings using a segmentation network, and the object-detection network YOLOX detects Varroa mites within the segmented regions. This collaboration between segmentation and object detection allows for more precise detection and reduces false positives. To handle the second challenge, we add a Coordinate Attention (CA) mechanism in YOLOX to extract a more discriminative representation of Varroa destructor and improve the confidence loss function to alleviate the problem of class imbalance. The experimental results in the bee farm showed that the evaluation metrics of our model are better than other models. Our network’s detection value for the percentage of honeybees infested with Varroa mites is 1.13%, which is the closest to the true value of 1.19% among all the detection values.

1. Introduction

Honeybees are a vital part of the ecosystem, not only as producers of delicious honey but also as pollinators of many plants. However, they face numerous threats in their living environment, including the parasitic mite Varroa destructor [1]. Varroa destructor attaches itself to the bees and their larvae, causing a range of negative effects on the colony [2,3,4]. This mite infests bee colonies and feeds primarily on honey bee fat body tissue, directly causing damage to the host bee [5]. Additionally, the development of bee larvae is affected, resulting in the malformation of wings and smaller body sizes, which can impact the survival rate of the colony [6]. Without appropriate prevention and control measures, the bee colony may even collapse within 2–3 years [7,8,9]. Therefore, it is critical to accurately detect the presence of Varroa destructor in bee colonies and assess the level of infestation. This can help beekeepers identify the optimal timing to initiate Varroa treatment measures, thereby protecting the health and productivity of their colonies [10,11].
The traditional method of detecting the presence of Varroa mites is that the beekeeper manually inspects each bee colony by opening up the hive and visually assessing the health of the honeybees. Unfortunately, this detection method is labor-intensive and inefficient, and it may also cause stress in honeybees. Moreover, since the timing of Varroa mite infestations is not predictable, it often happens that the infestation is very serious before it is detected. So, the manual inspection method is extremely unreliable in terms of providing accurate and timely assessments of the Varroa mites infestation level.
In recent years, the incorporation of deep-learning approaches in machine vision technology has led to significant advancements in target detection. In particular, the detection of honeybees and Varroa destructor has benefited greatly from this progress. Santana et al. [12] proposed a method that utilizes wing images to identify bees. Babic et al. [13] proposed a remote embedded detection system for detecting bees carrying pollen at the entrance of beehives. They used background subtraction, color segmentation, and morphological operations to segment the bees, and then used the nearest neighbor classifier to classify the bees into two categories according to color: pollen-carrying and non-pollen-carrying. Martineau et al. [14] conducted a comprehensive study of insect classification methods and explored various techniques such as image capture, feature extraction, classifier, and dataset testing.
For detection of the Varroa destructor infestation, due to their small size, most detection methods are designed based on specialized image or video lighting and capturing devices. Bjerge et al. [2] proposed a technique that utilizes video sequences for detecting the level of infestation caused by Varroa destructor. Their method involves using a video monitoring unit with multispectral illumination and a camera that is used to record videos of honeybees outside the beehive. Subsequently, a customized convolutional neural network is used for mites’ detection. This algorithm was tested on a video sequence containing 1775 bees and 98 visual mites, and the infestation level was measured to be around 5.80% with an error of only 0.28% relative to the true value. Schurischuster et al. [15] designed a special channel at the entrance of the beehive to clearly capture bee videos, and 13,000 images were trimmed and labeled in the video. They compared the performance of two classification methods based on AlexNet and ResNet as well as a semantic segmentation approach using DeepLabV3 to classify images of honeybees infested and uninfested with Varroa mites. The models were trained and evaluated, and the results showed that DeepLabv3 had the best performance, achieving a minimum mean average precision (mAP) of 90.8% and an overall F1 score of 95%.
Kaur et al. [16] proposed a computer vision-based method for classifying infested and healthy honeybees without high-quality and comprehensive image data. As a remedy, Contrast Limited Adaptive Histogram Equalization (CLAHE) and GAN-based image data augmentation techniques were applied to optimize data quantity and quality. The experimental results showed that the CLAHE method with GAN-based augmented data not only improved the sharpness of the image but also boosted the CNN classifier performance.
Voudiotis et al. [17] deployed cameras inside beehives and proposed a beehive monitoring system for early detection of Varroa mite. The bee images captured on the honeycomb were recognized using a CNN model to identify whether the bee colony was infested with Varroa mites. The results showed that the detection accuracy of this method for bees and Varroa mites is close to 70%.
As there is a lack of real-world data on Varroa mites, there are also methods for detecting them based on datasets taken in the laboratory. Bilik et al. [18] proposed a bee colony health monitoring method based on a convolutional neural network object detector. Based on the laboratory dataset with 600 images of a single bee that is healthy or infested with Varroa destructor, the YOLO and SSD [19] object detectors along with the Deep SVDD anomaly detector were compared. The YOLOv5x object detector was found to be the most effective, with an mAP [0.5] of 90.28% and an F1 score of 87.4% in detecting bees infested with mites, and an F1 score of 72.7% in detecting Varroa destructor.
Although some progress has been made in existing work, there are still challenges in the detection of Varroa destructor infestation in the ground truth. Firstly, the honeybees in the bee farm environment have a complex scene, the volume of backgrounds far exceeds the volume of the honeybees, and they are often rich in redundant information. Information such as occlusions and blurring caused by bee movements as well as background colors similar to the bees also cause problems. Secondly, the scales of the honeybee, Varroa destructor, and background in the images are very different. Among them, the detection of mites, a small-scale object, is the most difficult because they carry less feature information. Finally, the number of Varroa destructor is significantly less than that of bees, which leads to the gradient descent algorithm updating the weight parameters of the honeybee category more frequently during the training process. In response to the above challenges, this paper proposes a nonstress detection method for Varroa destructor infestation. The main contributions of this paper are as follows.
(1)
A novel scheme that weakens the background information and distinguishes the key information of honeybees and Varroa destructor is designed. By using image segmentation to isolate the main object in a given image while removing any unnecessary background noise or distractions, the accuracy of the detection is significantly improved, allowing for a more accurate and reliable diagnosis of this harmful parasite in bee populations.
(2)
The adaptive feature pooling of the improved Path Aggregation Network (PAN) [20] fuses feature information on different scales, and a coordinate attention (CA) mechanism reduces the feature inconsistency brought on by scale variation. By focusing on global contextual information, it effectively eliminates errors caused by scale differences, making the network better at detecting Varroa destructor.
(3)
The data augmentation method that generates images of Varroa mites increases the number of minority class samples, and the dynamic scaling factor is used to make the network more focused on training difficult-to-classify samples.

2. Materials and Methods

2.1. Materials

2.1.1. Image Acquisition

The experimental site was the apiary of Panhe Campus, Shandong Agricultural University, Tai’an, Shandong Province, China (E116.40400, N39.92800). Five beehives of Apis cerana were captured every 2 min for a total of 144 h, from June to September 2022, all of which were during the daytime when honeybees were active outside the hive, with a temperature range of 27–39 °C. Disturbance of the bee colonies was kept to a minimum.
The image data was acquired with a JIERUIWEITONG USB industrial camera, model DW1200-4K, with adjustable resolution and variable focus. The camera is vertically fixed above the entrance of the beehive, with a distance of 20 cm from the bottom baffle. The interval for taking photos is set to 30 s, and an external laptop is used for photo storage. A total of 4320 RGB images were acquired with 3840 × 2160 pixels, and 105 of them were found to contain Varroa destructor.

2.1.2. Data Augmentation

In the dataset images, the number of honeybees is sufficient for training deep-learning models, while the number of Varroa mites is only about 1/200 of the number of honeybees. Therefore, this dataset has a serious problem of class imbalance. Abandoning traditional data augmentation methods such as geometric and pixel transformations, we designed a data augmentation method that only enhances images of Varroa destructor. Since the morphology, color, and size of Varroa mites are not significantly different, we selected images in different lighting conditions and manually extracted the Varroa destructor. Then, the extracted mite is pasted onto honeybees to create new images with Varroa destructor. Since the Varroa destructor feeds on the fat body tissues of the bee’s abdomen, we placed more images of the Varroa destructor on the bee’s abdomen and a small amount on other parts of the bee.
Firstly, the images that contain Varroa destructor are divided into 6 groups according to different shooting lighting. A total of 100 Varroa destructor were extracted from the images using image processing techniques such as FCM clustering, image sharpening, and masking. Then, based on the principle of similar lighting and the size ratio of mite and bee, the Varroa destructor is pasted to the back of the honeybee without the Varroa destructor (Figure 1). In this way, a data set of 2000 images was created, of which 1–3 honeybees carry Varroa destructor in 542 images. The dataset is available at: https://github.com/luouy21785/F-YOLOX-b (accessed on 7 June 2023).
The augmented dataset is randomly divided into a training set, a validation set, and a test set in a ratio of 7:2:1. There are 1400 images in the training set, 400 images in the validation set, and 200 images in the test set, as shown in Table 1.

2.2. Methods

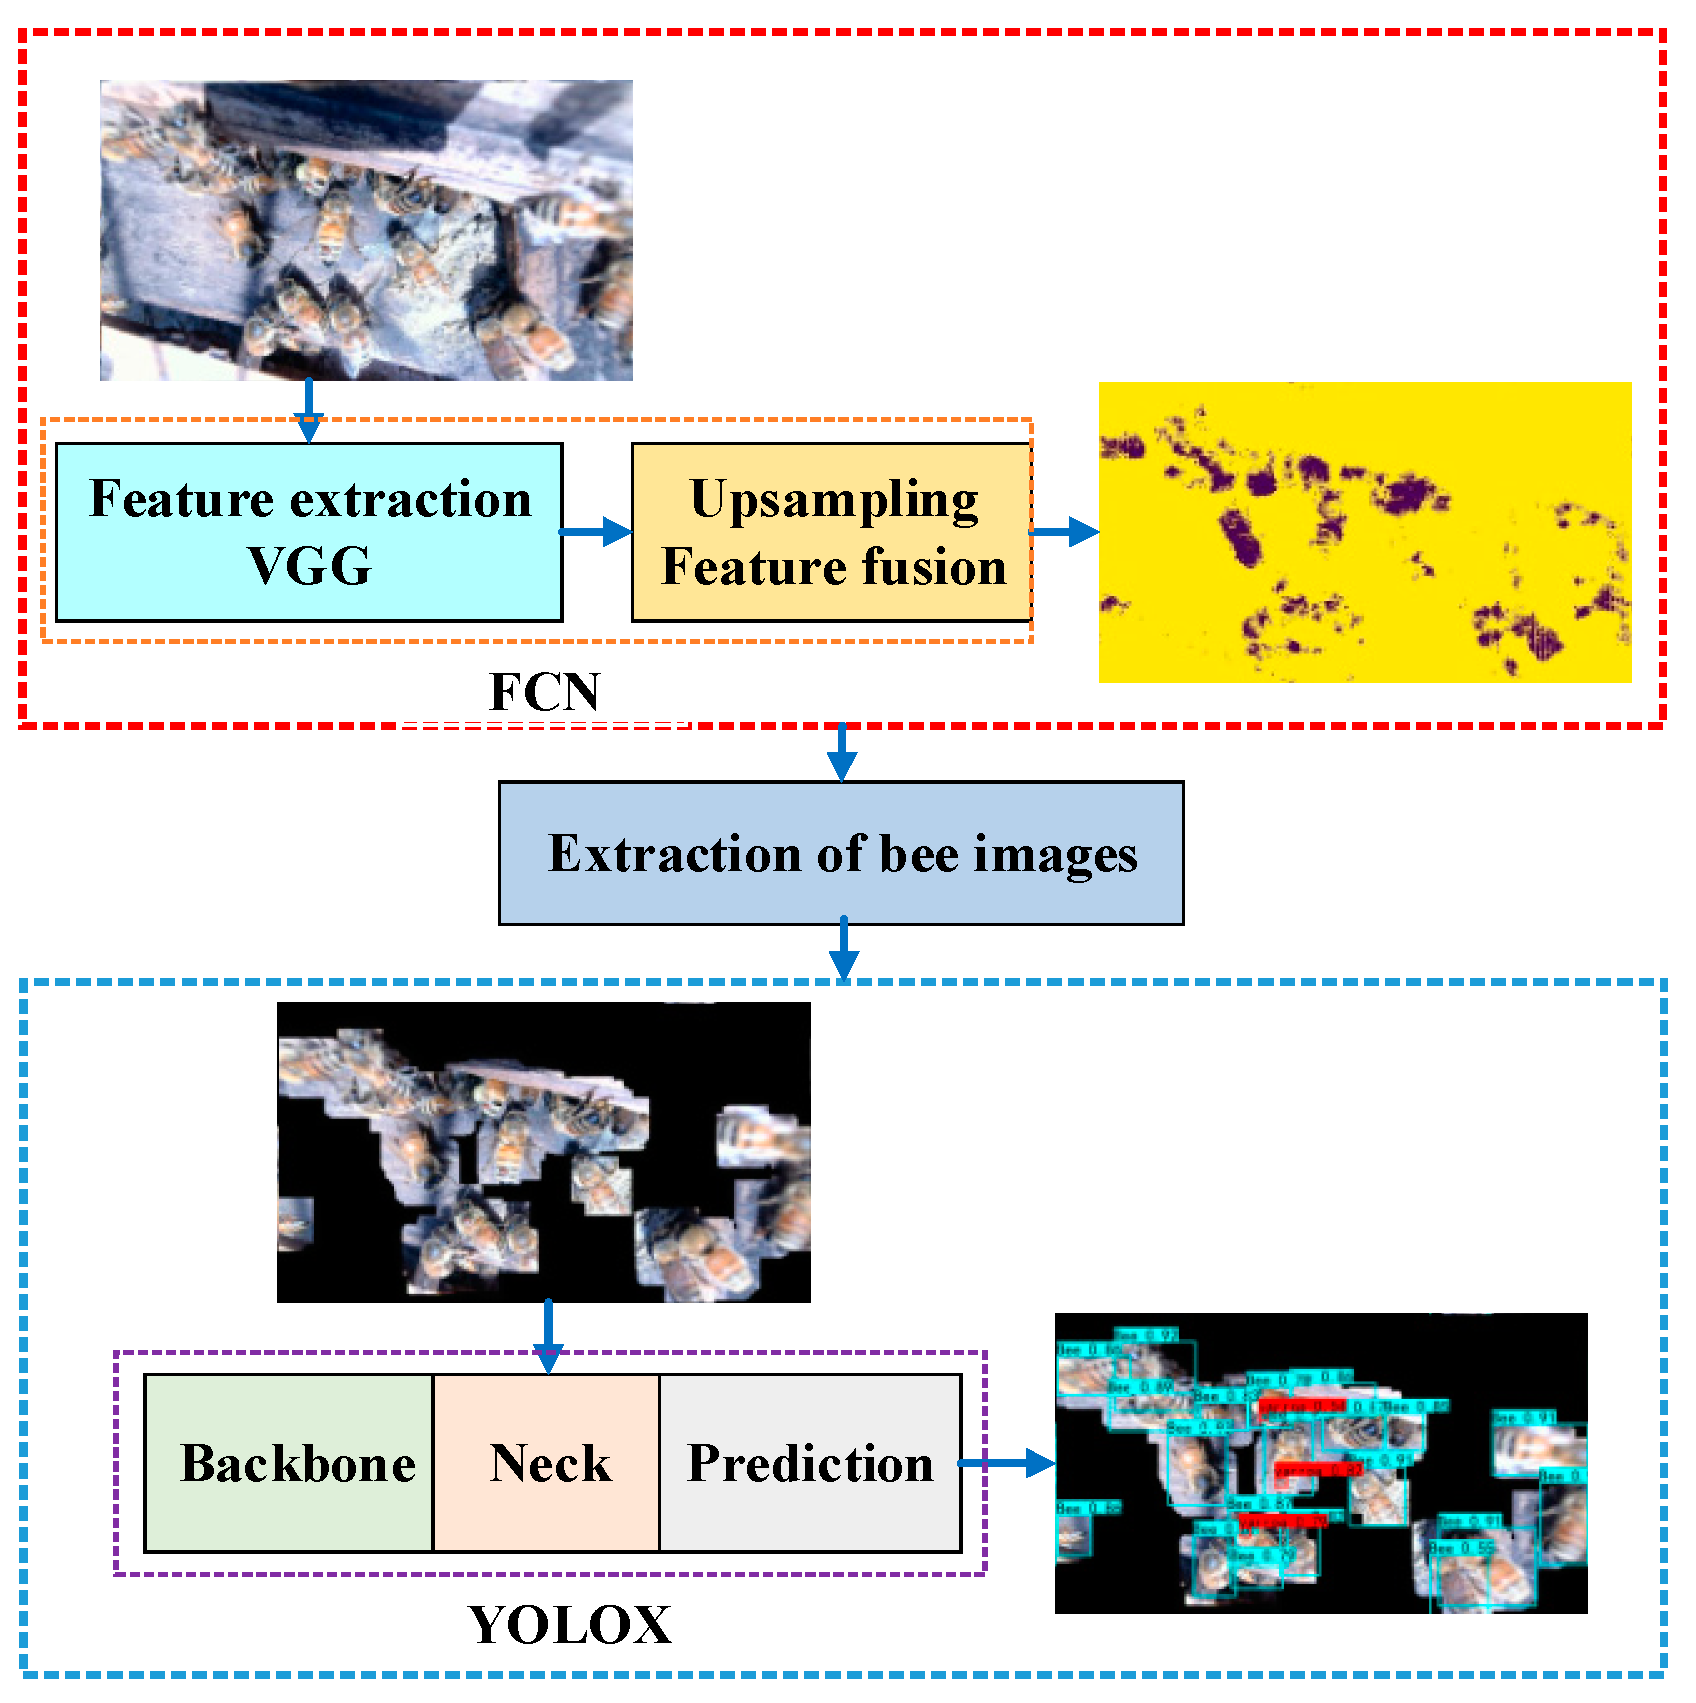
Detecting Varroa mites requires detecting honeybees in the complex background first, and then detecting the mites on honeybees. Compared to the entire image, honeybees and mites are very small objects. In order to avoid interference from the background area, we first structure a Fully Convolutional Network [21] (FCN) model to segment honeybees from the background, so that the target detection model can only focus on honeybee images. Then, YOLOX [22] is used to detect the Varroa destructor in the segmented honeybee images. The implementation process is shown in Figure 2 and explained below.
(1)
Image segmentation: Establish an FCN weight model and use it to segment the image obtained in the original image dataset (referred to as dataset 1) between honeybees and backgrounds.
(2)
Honeybee image extraction: Perform image processing, such as dilation and masking, on the segmented images with the original images to obtain bee images that exclude the background area. The extracted bee images constitute the object-detection dataset (recorded as dataset 2).
(3)
Detection of honeybees and Varroa destructor: Dataset 2 was labeled with Varroa destructor and honeybees; the YOLOX model is trained based on dataset 2, furthermore, add an attention mechanism and improve the loss function to improve the detection accuracy.
(4)
Use the segmentation and object-detection collaborative convolutional neural network to analyze actual images, and then obtain the proportion of honeybees infested with Varroa destructor.

2.2.1. The Structure of Segmentation Network

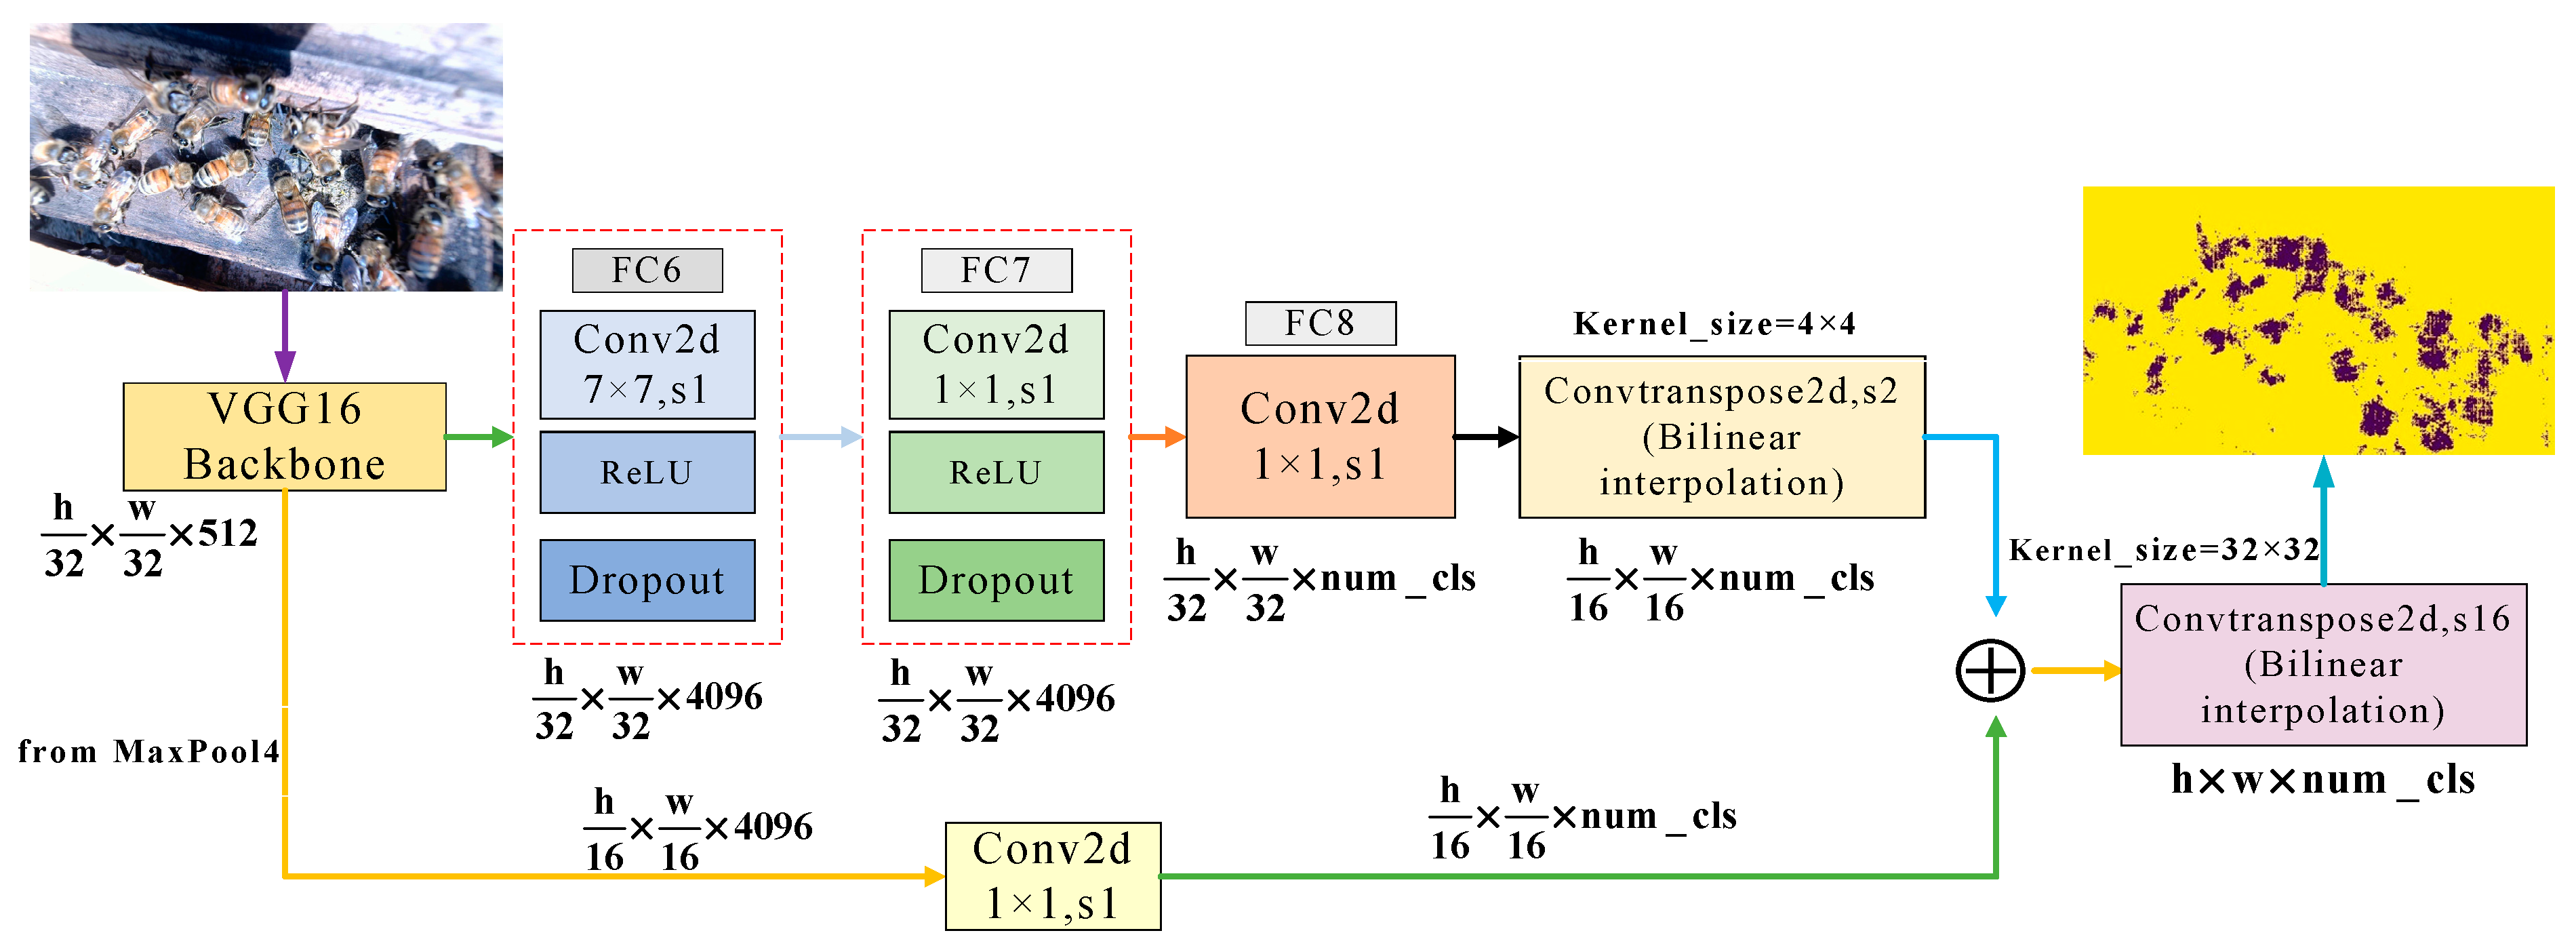
An FCN is used as a segmentation network, whose philosophy is to classify each pixel in the image with labels and ultimately output dense predictions. The FCN model we structured mainly includes input, backbone, upsampling, skip architecture, feature fusion layers, and output, as shown in Figure 3.
(1)
The input for the FCN is the original image of the bees, with a size of 3840 × 2160 pixels.
(2)
Backbone is based on the convolutional structure of VGG16, which stacks 5 layers of convolution and pooling to learn the multi-level features of the image. After 5 convolution operations, the feature map size is reduced to 1/32 of the original image.
(3)
The fully connected layer of VGG16 is replaced with the equivalent 3 convolutional layers, whose convolution kernel sizes (channels, width, height) are (4096, 7, 7), (4096, 1, 1), and (2, 1, 1). After removing the fully connected layer, the network has no limitation of fixed input and output sizes, so it can segment honeybee images of any size.
(4)
After the FC8 layer, the first prediction layer’s feature map was obtained by 2× upsampling. Its coarse-grained features are accurate, but the refined prediction is dissatisfyingly coarse. Therefore, we fused the output feature map of MaxPool4 in backbone with the first prediction layer through a skip architecture. Combining fine layers and coarse layers lets the model make local predictions that respect global structure.
(5)
Finally, the fused feature map is restored to the size of the input image by 16× upsampling. Each pixel gets a predicted class while preserving the spatial information of the honeybee, thus completing the segmentation of the honeybee and background. The output is a segmented image, which is the same size as the input image.

2.2.2. Honeybee Image Extraction

By masking the segmented image with the original image, we can extract the honeybee image from the background. Since there is scattered noise in some images after segmentation, direct masking may lead to incomplete bee images. Therefore, we binarize the segmented image first and then apply the dilation algorithm to remove noise. Lastly, we mask with the original image to extract the minimum bounding rectangle of honeybees.

2.2.3. YOLOX Model Establishment and Improvement

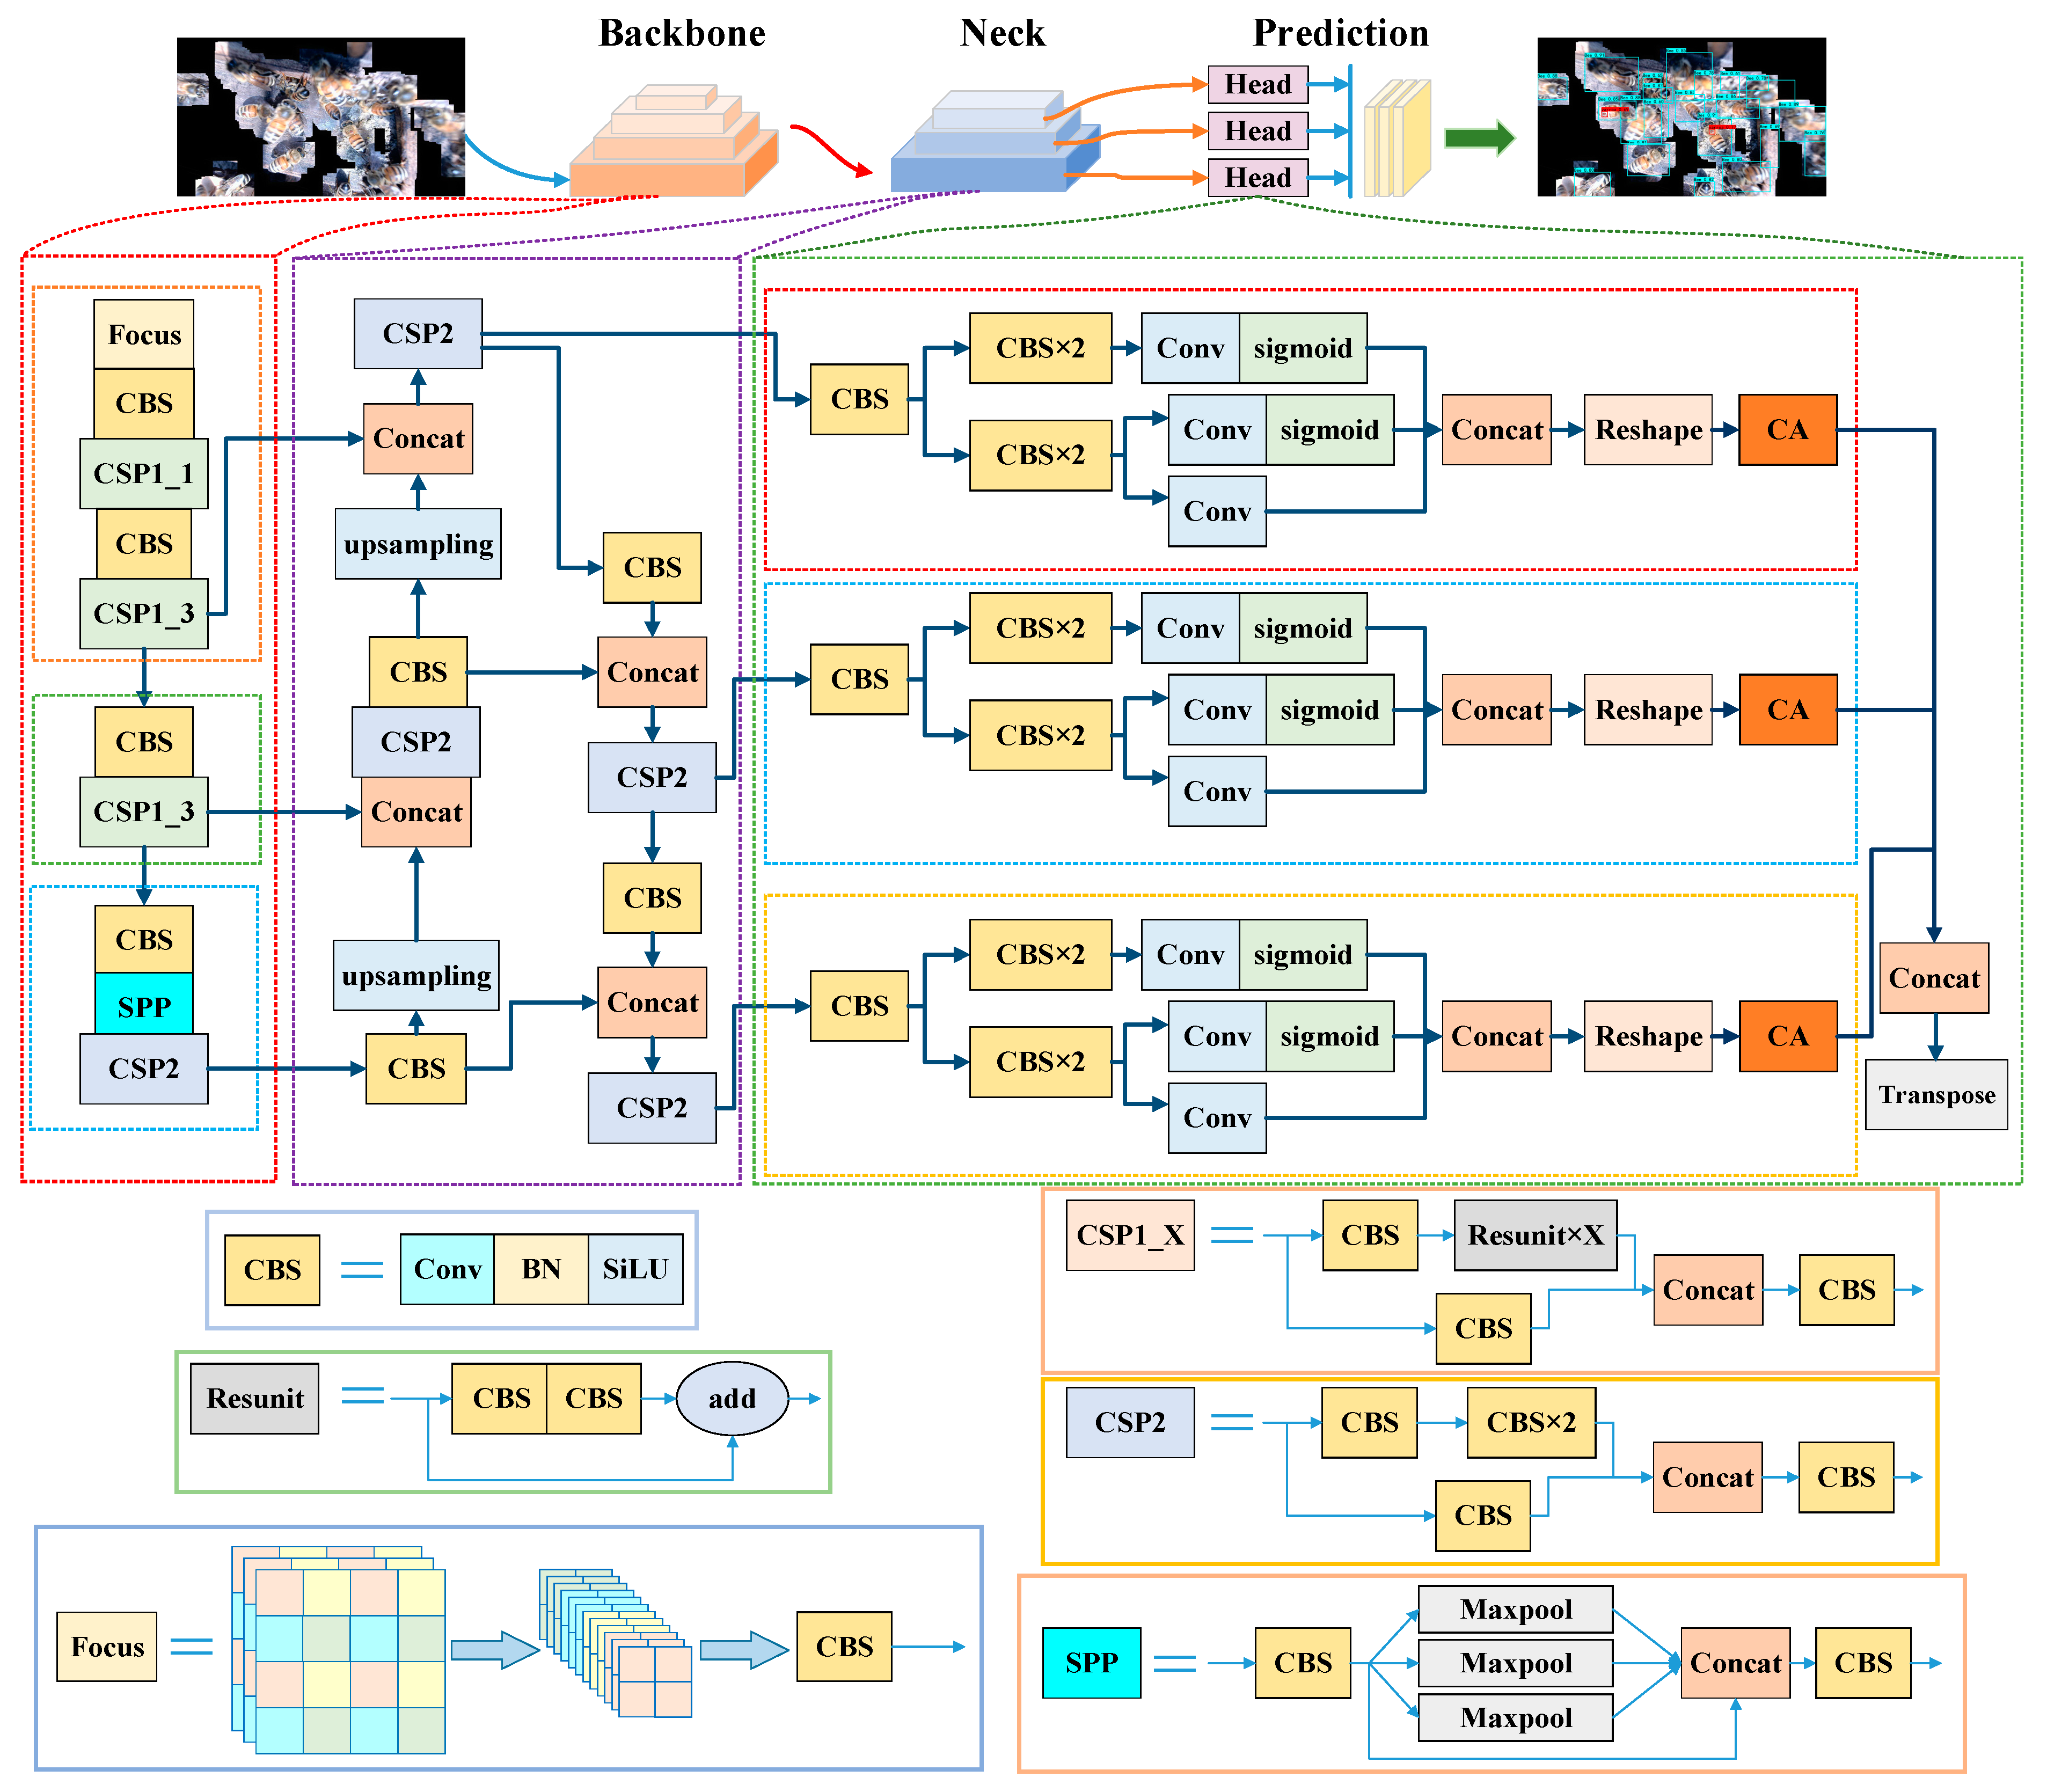
YOLO is one of the best-performing algorithms in the field of target detection. It can predict the boundary boxes of each object based on the target features of the input image and enable real-time object detection. In this study, YOLOX is chosen as a baseline to achieve the detection of honeybees and Varroa destructor, as shown in Figure 4 with its structure and improvements.
(1)
YOLOX Baseline
YOLOX is mainly composed of a backbone feature extractor, a feature fusion network, and an end-to-end decoupled prediction head.
Backbone: The CSPDarknet [23] is adopted as a feature extractor, where the SPP (spatial pyramid pooling) [24] module can effectively increase the receptive field of the backbone feature by parallel pooling. This structure can fuse local features with global features, extracting features of honeybees and mites simultaneously.
Neck: The improved PAN is used for the feature fusion network. A bottom-up path makes low-layer information easier to propagate and adaptive feature pooling allows each proposal to access information from all levels for prediction. The inconsistency of features caused by scale differences between honeybees and Varroa destructor is eliminated effectively. A total of three feature maps of different sizes (80 × 80, 40 × 40, and 20 × 20) are output.
Head: The prediction network adopts anchor-free detectors and applies SimOTA (Simplified Optimal Transport Assignment) as a candidate label-assigning strategy. The three decoupling head branches of the prediction network correspond to three feature layers of different sizes in the backbone. Each decoupling head outputs a 6-channel tensor (1 category score, 1 confidence score, and 4 predicted box parameters). After integrating the feature maps of three different sizes, the final output is a prediction information of 8400 × 6.
The number of parameters N for the network output prediction results is shown in Formula (1).
N = w h 1 D 1 + 1 D 2 + 1 D 3 N r e g + N o b j + N c l s
where w and h stand for the width and height of the input image. D1, D2, and D3 are the downsampling factors of three feature maps. Nreg is the number of parameters that determine the position and size of the target box. Nreg = 4; Nobj is the number of confidence scores for target boxes containing objects, and Nobj = 1; Ncls is the number of classes predicted, with two classes, honeybee and Varroa destructor.
(2)
Attention mechanism for Varroa destructor details
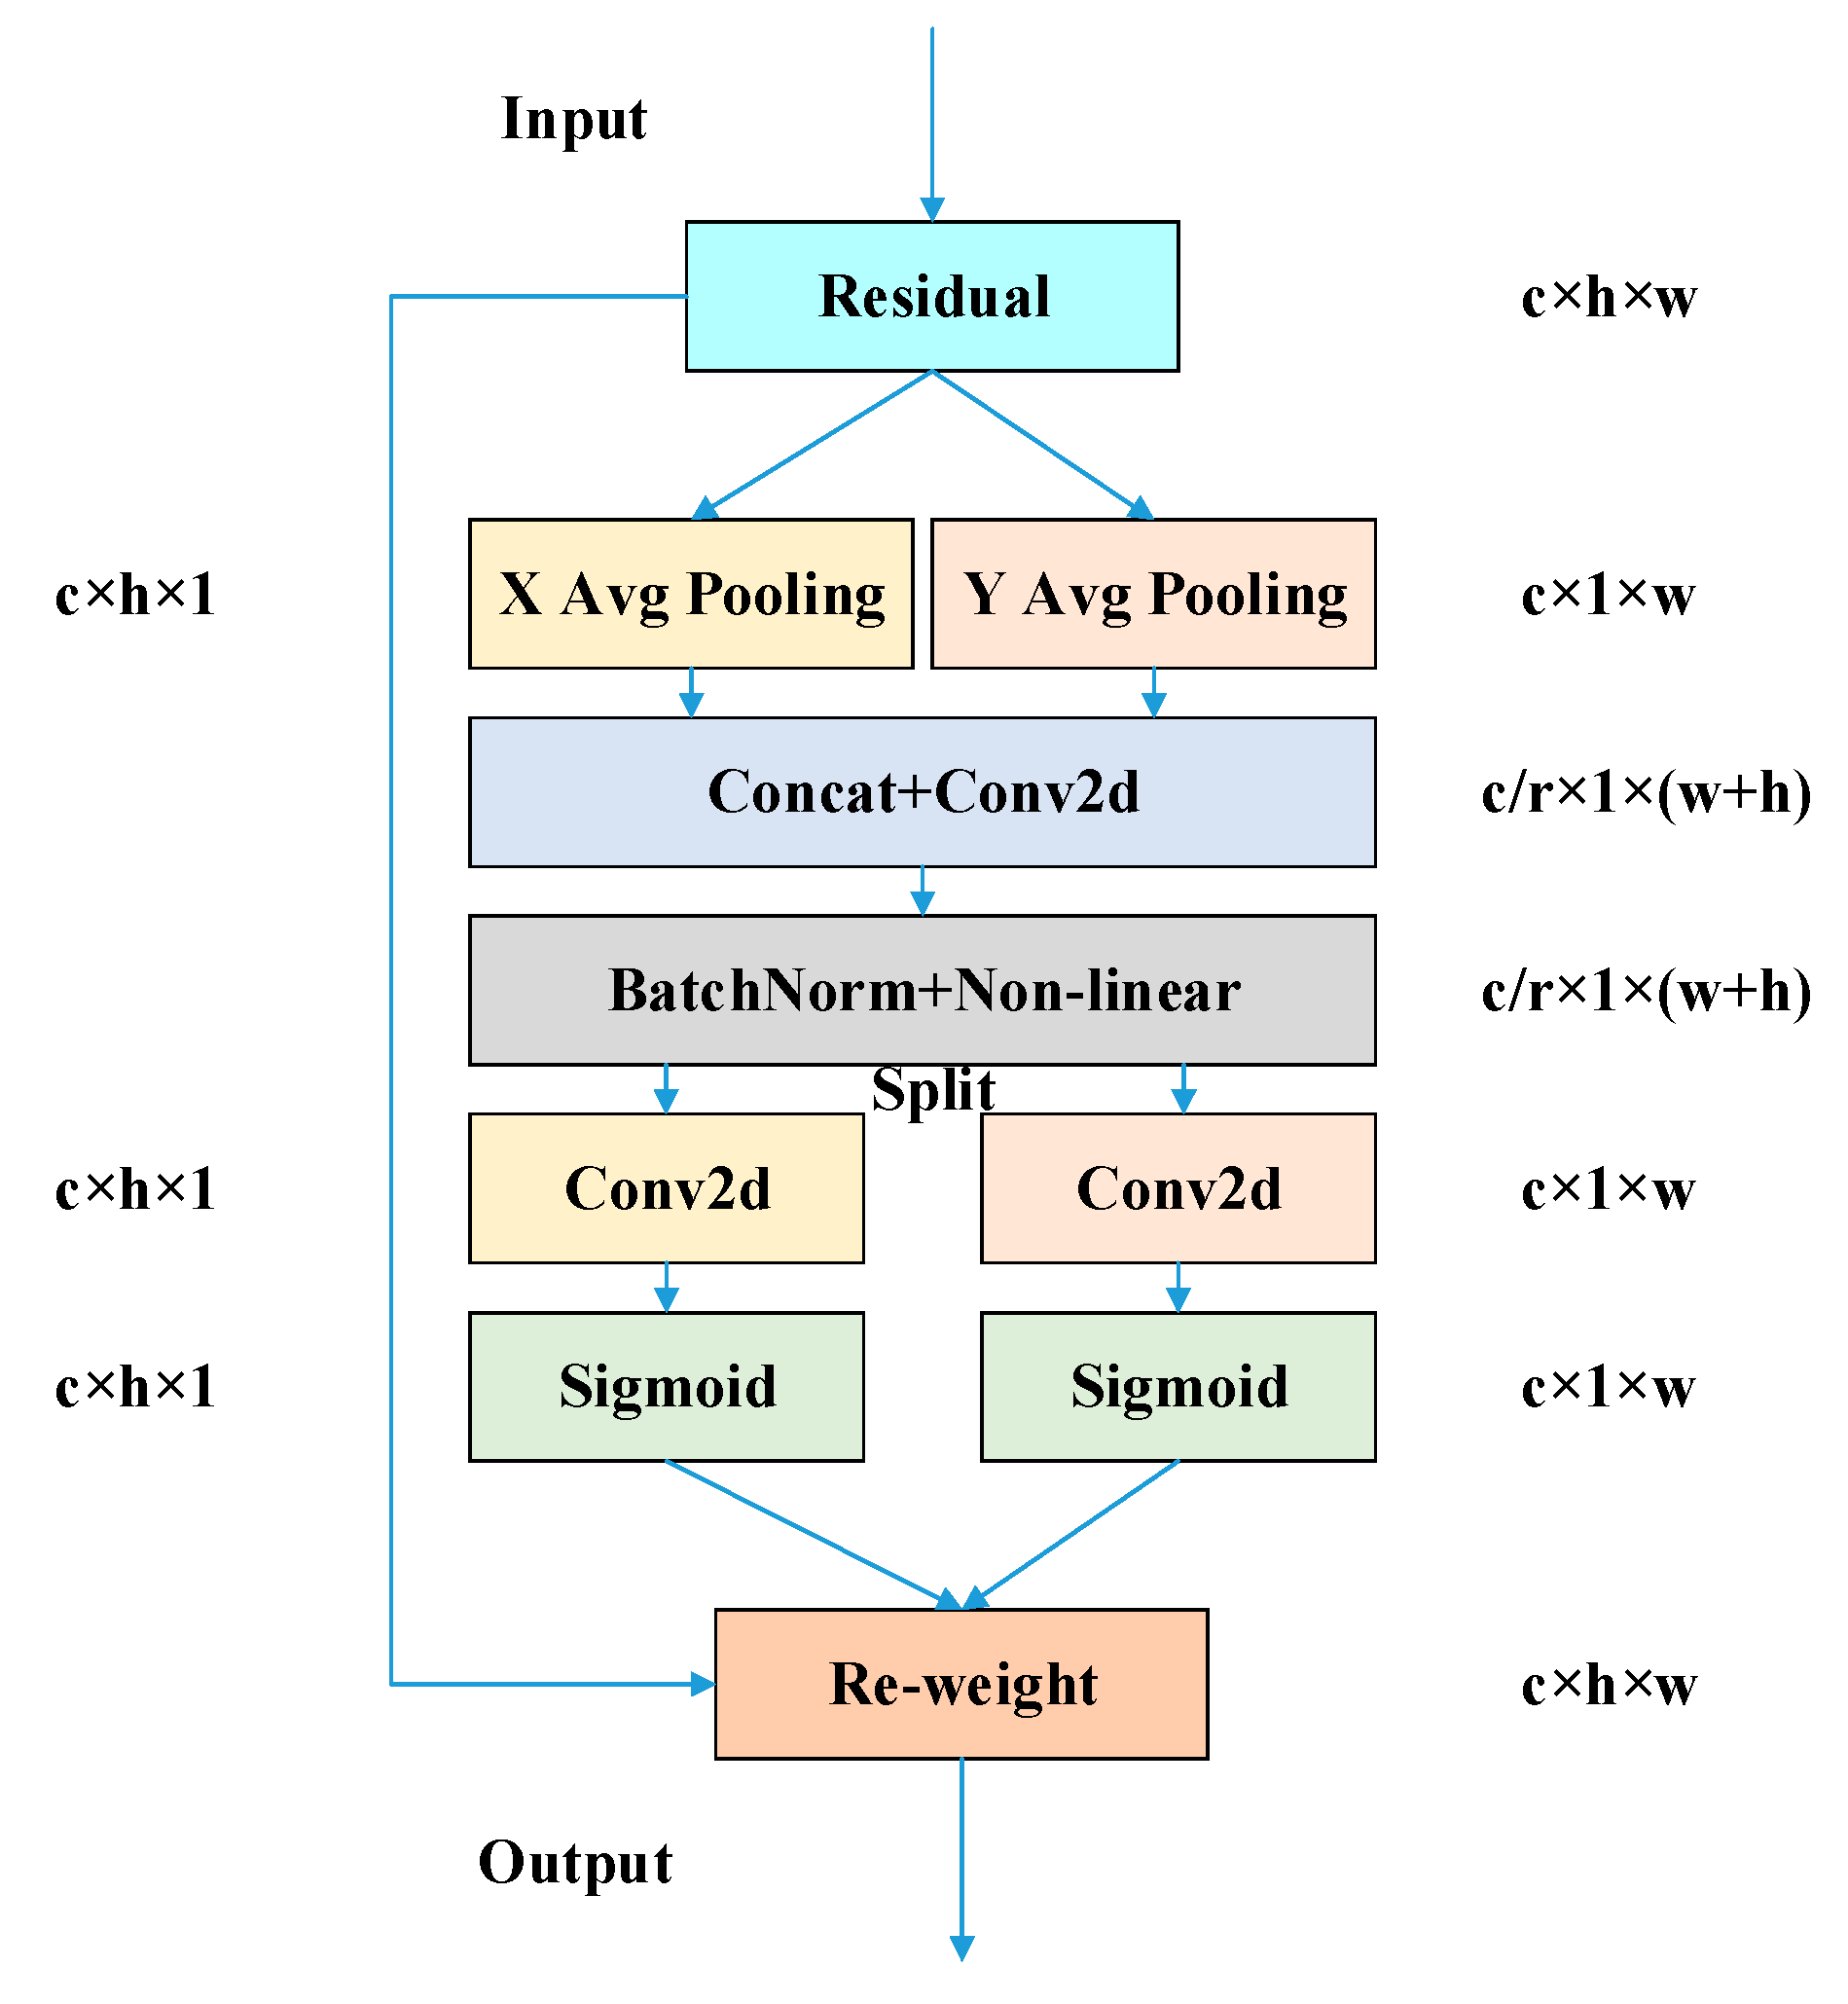
The backbone feature extractor CSPDarknet is capable of extracting features from two different-sized targets, honeybees, and Varroa destructor. However, it ignores the effective focus on Varroa destructor detail information, resulting in the model missing some mites during detection. To improve the accuracy of Varroa destructor detection, the Coordinate Attention (CA) mechanism [25] is introduced to modify the original model. Its structure is shown in Figure 5.
CSPDarknet decomposes the input feature map with a scale of c × h × w into two dimensions. It uses a pooling kernel of size (h, 1) to perform pooling along the X-axis. The channel is encoded and the output is a feature height vector of c × h × 1. Similarly, the pooling kernel of size (1, w) is pooled along the Y-axis to output the width feature vector of c × 1 × w. The encoding formulas for the two channels are (2) and (3).
Z c h ( h ) = 1 w 0 i w x c ( h , i )
Z c w ( w ) = 1 h 0 j h x c ( j , w )
where x stands for input, Z c h is the height output associated with the c-th channel, and Z c w is the width output associated with the c-th channel.
The above two transformations aggregate features along the two spatial directions, respectively, yielding a pair of direction-aware feature maps. We concatenate them and then send them to a shared 1 × 1 convolutional transformation function F1, yielding
f = δ ( F 1 ( [ z h , z w ] ) )
where [·, ·] denotes the concatenation operation along the spatial dimension, δ is a non-linear activation function h-Swish, and f is the intermediate feature vector of c/r × 1 × (w + h) that encodes spatial information in both the horizontal direction and the vertical direction. Here r is the reduction ratio for controlling the block size.
Then, f is split along the spatial dimension into two separate tensors, f h and f w . Another two 1 × 1 convolutional transformations, Fh and Fw, are utilized to separately transform f h and f w to tensors g h and g w with the same channel number to the input.
g h = σ ( F h ( f h ) )
g w = σ ( F w ( f w ) )
where σ is the sigmoid function.
Finally, g h and g w are then expanded and used as attention weights for input X, respectively, and the feature map size is restored to the initial size c × h × w. The output of CA block Y can be written as
y c ( i , j ) = x c ( i , j ) × g c h ( i ) × g c w ( j )
In this study, the CA mechanism is integrated into the head of the YOLOX for network optimization. The separate processing of two directions enables the network to obtain long-range dependencies along both spatial directions while retaining precise positional information. This is beneficial for the network to accurately locate the position of the mite while improving detection accuracy at a lower computational cost.
(3)
Improvement of the loss function to mitigate the class imbalance
In this study, the target number of honeybees is much higher than the number of Varroa destructor, which means that the dataset is imbalanced. The YOLOX model adopts an anchor-free strategy [26], which does not rely on predefined anchor boxes to represent detection boxes. This strategy is implemented to minimize detection errors of hard-to-classify samples. However, it still needs to deal with the impact of imbalanced honeybee and Varroa destructor samples.
The loss of the YOLOX model consists of three parts: loss_iou (location loss), loss_obj (confidence loss), and loss_cls (classification loss). We improve the loss_obj in YOLOX to adapt to the data imbalance during model training. The original confidence loss function in YOLOX is the CE (cross-entropy) loss function, calculated as Formula (8).
l o s s C E = log p
where p represents the probability of a category, p 0 , 1 .
The coefficient α is added to the CE loss function, α 0 , 1 . By adjusting the value of α , the weight of the majority classes samples is reduced, which leads to a decrease in their contribution to the loss function; while the weight of the minority classes samples is increased, which leads to an increase in their contribution to the loss function. At the same time, a dynamic scaling factor is introduced to make the algorithm more focused on training difficult-to-classify samples. This loss function is named the FL loss function, which is defined as follows:
l o s s FL = α 1 p γ log p
When the target is accurately classified, its value of p tends towards 1 and 1 p γ tends towards 0, resulting in a decrease in loss value. In contrast, when the classification is inaccurate, the p-value tends towards 0 and 1 p γ tends towards 1, resulting in an increase in loss value. Therefore, during backpropagation, the model is focused more on difficult-to-distinguish samples, thereby improving the accuracy of such samples.

3. Experimental Results and Discussions

3.1. Experimental Platform and Evaluation Indicators

3.1.1. Experimental Platform

The training and testing hardware platform is the HP Z820 workstation, and the main hardware configuration is shown in Table 2.

3.1.2. Evaluation Indicators

In order to analyze the performance of the model, various metrics are used as evaluation indicators, including Precision ( P ), Recall ( R ), F 1 score, Average Precision ( A P ), and mean Average Precision ( m A P ) for all categories [with a confidence threshold of 0.5], and the percentage of honeybees infested with Varroa mites ( I ). The calculations are performed using the following formulas.
P = T p T p + F p × 100 %
R = T p T p + F N × 100 %
F 1 = 2 P R P + R
A P = 0 1 P ( R ) d R
m A P = i = 0 c A P i C
I = n v N b × 100 %
where T p stands for true positives, F N stands for false negatives, F p stands for false positives, C stands for total number of object categories being detected, n v stands for the number of Varroa mites, and N b stands for the number of honeybees.

3.2. Experiment for Honeybees and Varroa destructor Detection

3.2.1. Segmentation Performance Experiment

The FCN model constructed was trained for segmentation using dataset 1. We set the learning rate to 0.001, the batch size to 16, and the run iterations to 200 times and used the Stochastic Gradient Descent (SGD) algorithm with a momentum of 0.9. The segmented honeybee image is shown in Figure 6b, and the honeybee image extracted by masking the original image is shown in Figure 6c. It can be seen that the honeybees in the original image have all been extracted and the honeybee images are complete.

3.2.2. Target Detection Experiment Results

The improved YOLOX is trained based on dataset 2, and the trained FCN is connected to YOLOX. The images first go through an FCN for bee image segmentation and extraction, and then YOLOX is used for bee and Varroa mite recognition and statistics. This FCN and improved YOLOX collaborative method is named F-YOLOX. The model that introduces the attention mechanism and improved loss functions to YOLOX is named F-YOLOX_b.
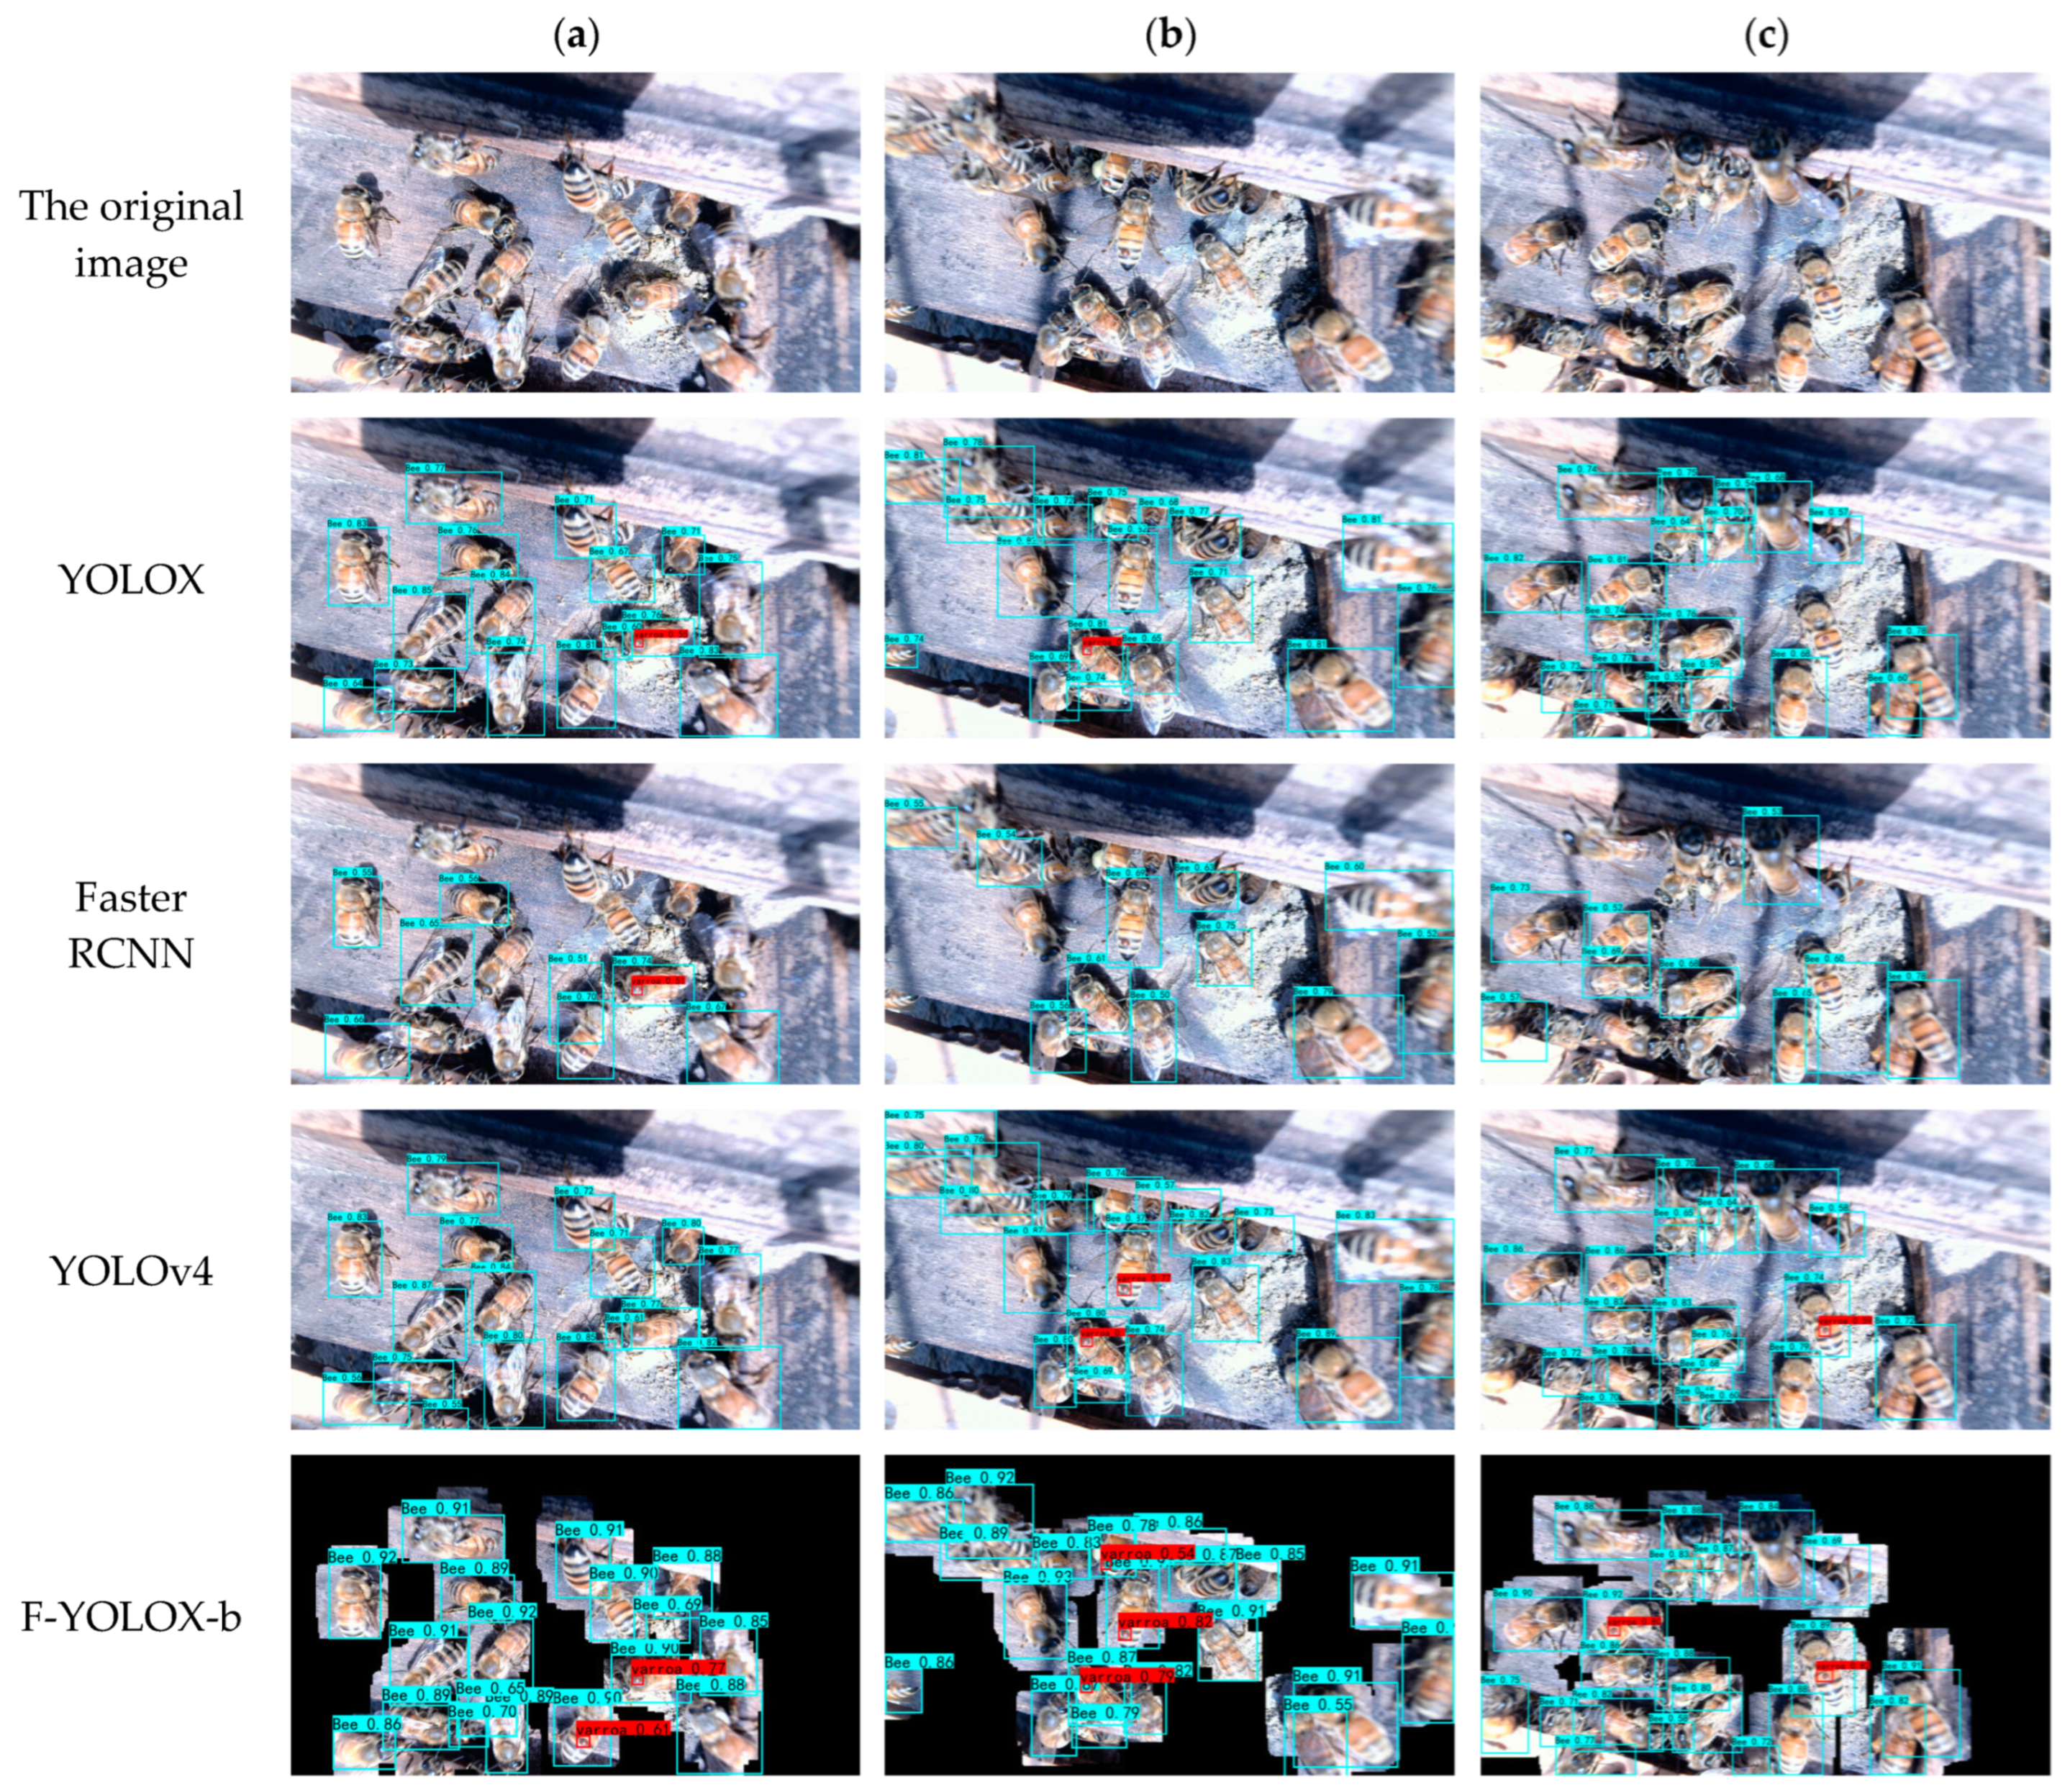
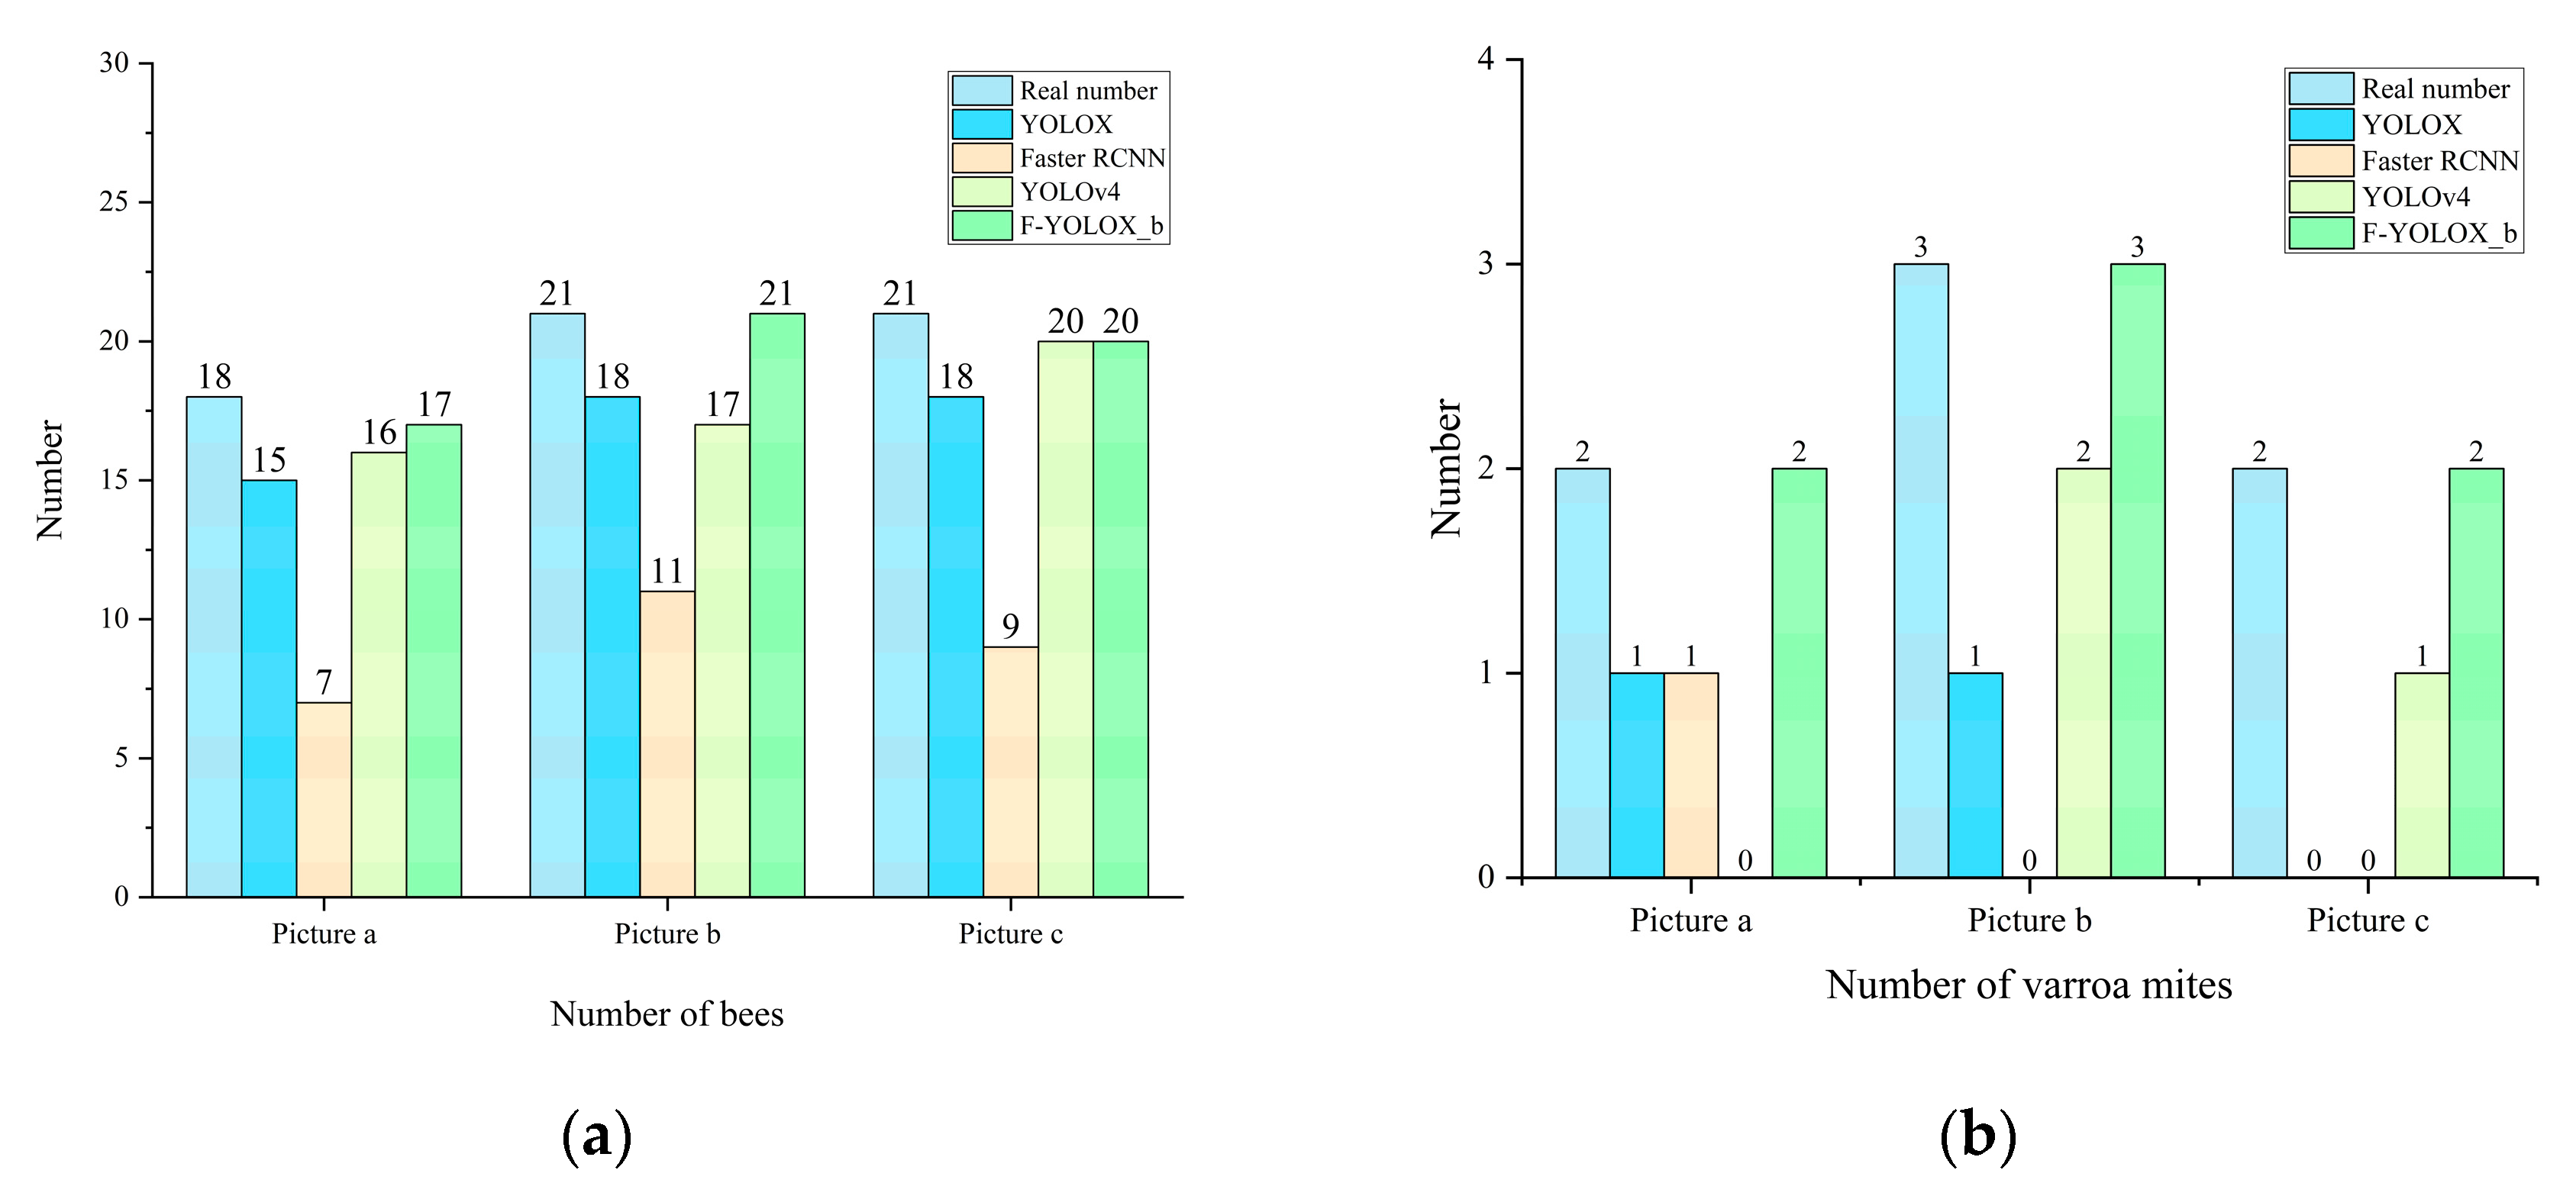
In order to compare the effectiveness of our method, the detection performance of F-YOLOX_b is compared with commonly used object-detection models, including Faster RCNN [27], YOLOV4 [28], and YOLOX. Faster RCNN, YOLOV4, and YOLOX are trained with a learning rate of 0.0001, a batch size of 16, an iteration of 500 times, and a momentum of 0.9. Honeybees and Varroa destructor detection comparison and statistics are shown in Figure 7 and Figure 8.
From Figure 7 and Figure 8, it can be seen that the detection performance of Faster RCNN is the worst, and it can only recognize low numbers of honeybees and Varroa destructor with low confidence. The YOLOv4 model has a higher accuracy for honeybee detection, but a low accuracy in Varroa destructor detection. F-YOLOX_b has a noticeably better detection effect than other models, with only 2 honeybees missed in the detection of 60 honeybees, and the confidence level concentrated between 0.8 and 0.92. It has no errors in the target detection of Varroa destructor, with confidence levels of 0.61, 0.77, 0.79, 0.82, 0.54, 0.80, and 0.82, respectively.

3.3. Analysis of Improved Algorithm Performance

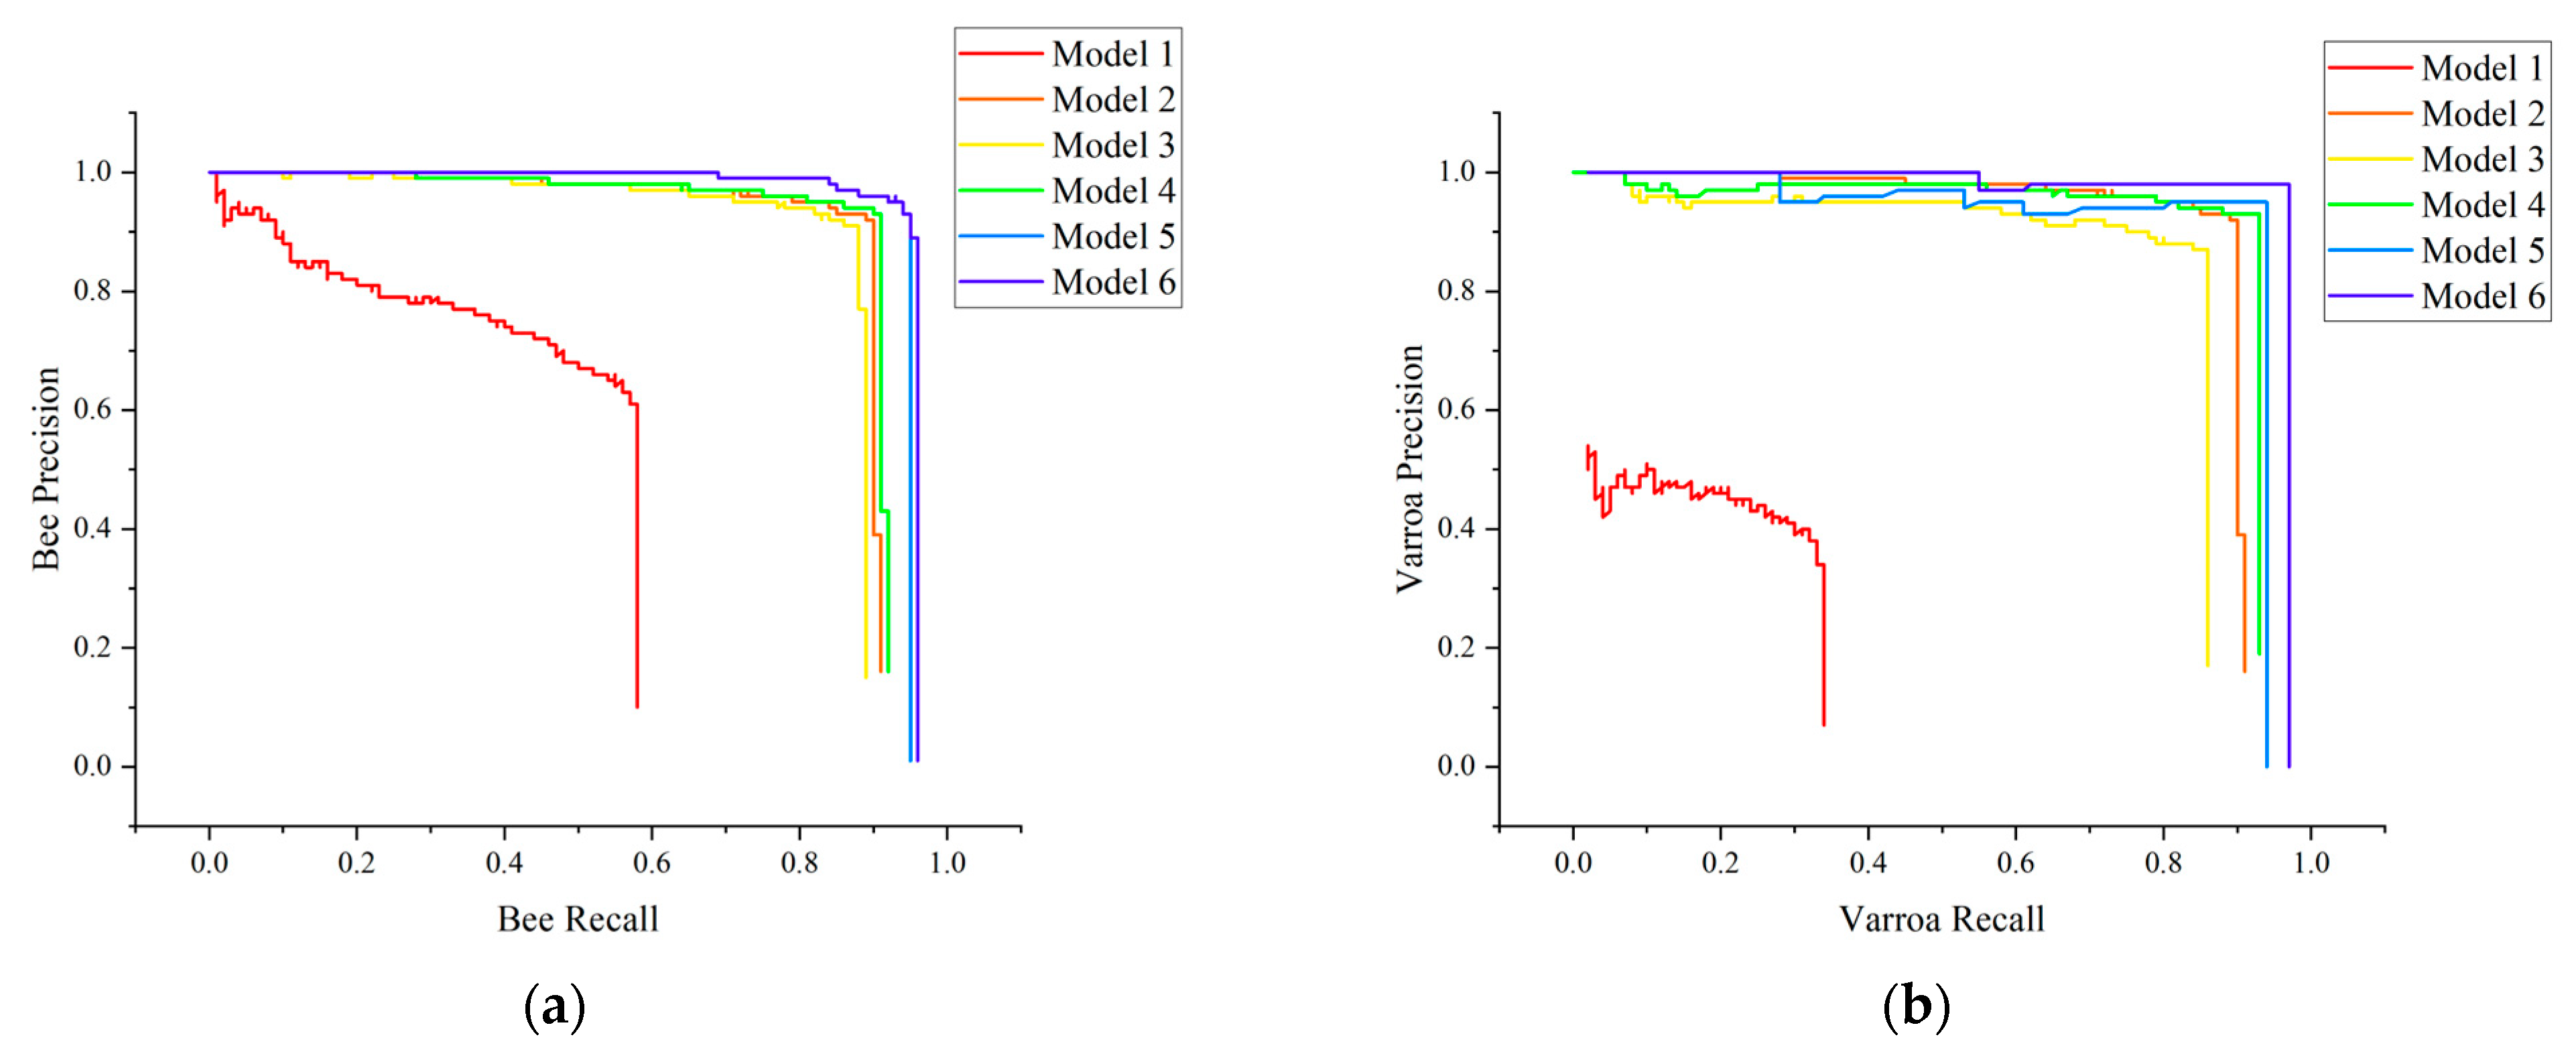
To verify the optimization effect of the CA mechanism and improved loss function introduced in this research, a comparative experiment was conducted. The attention mechanisms of CA, SE [29], and CBAM [30] were added to the YOLOX network, and the loss function was improved also. Model 6 is F-YOLOX_b. The comparative results are shown in Table 3 and the PR curve is shown in Figure 9.
As shown in Table 3, the six optimization methods have different degrees of improvement on the YOLOX. Among them, only adding the SE attention mechanism has the lowest improvement on the YOLOX, with the mAP increasing by 2.43%, and the F1 score for honeybees and Varroa destructor only increasing by 0.95% and 2.37%, respectively. The model performance with the CA mechanism added has the greatest improvement, with the mAP increasing by 8.36%, and the F1 score for honeybees and Varroa destructor increasing by 3.44% and 8.70%, respectively. This indicates that the CA selected in this study is applicable to this dataset, especially for improving the detection performance of small targets such as Varroa destructor.
The model’s mAP and F1 scores for Varroa are further improved by adding CA and improving the FL loss function simultaneously, while the F1 score for honeybees remains almost unchanged. Compared to the original YOLOX model, the mAP increased by 14.08%, and the F1 of Varroa mites increased by 13.22%. It can be seen that the loss function improvement for the problem of fewer Varroa mites than honeybees in the dataset is effective. While not reducing the F1 score for honeybees, the detection performance of Varroa destructor is significantly improved.
There is a slight difference in the average frame time consumption of each model, indicating that the above improvements do not significantly increase the network load. From the PR curves in Figure 9, the AUC (area under the curve) of the PR curves of model 6 (F-YOLOX_b) is significantly higher than that of the other five models. This also reflects that F-YOLOX_b is more applicable than other models for detecting honeybees and Varroa destructor.

3.4. Discussion

3.4.1. Experiments on Unclear Characteristics Image

Honeybee images in ground truth suffer from characteristic blurriness, such as a focus blur due to different flying heights, mutual occlusions caused by crawling or flying bees, and partial capture of only the head or abdomen of a bee due to vertical crawling. Additionally, incomplete bee images are captured at the edge of the frame. In Figure 10, honeybees No. 1 and No. 2 only expose their heads and abdomens, while No. 3 shows two overlapping bees, both of which only captured their abdomens. These unclear characteristics may cause bias or missed detection in the model results. To verify the impact of such images on honeybees’ detection, we conducted a comparison test using both F-YOLOX_b and YOLOv4, which have shown better performance in the bee detection results in Section 3.3.
As shown in Figure 10b,c, YOLOv4 cannot detect honeybee No. 1, only detects one of the overlapping bees in No. 3 with a confidence of 0.74, and honeybee No. 2 was detected with a confidence of only 0.51. In contrast, F-YOLOX_b can detect all bees in three spots, and the confidence of No. 2 was increased to 0.73. In No. 3, where two honeybees overlap, the confidence level of the honeybee on top increased to 0.85, and the one below had a score of 0.72. Therefore, F-YOLOX_b effectively improves the accuracy of honeybee detection, making bee counting more precise.

3.4.2. Experiments on Different Light Degrees

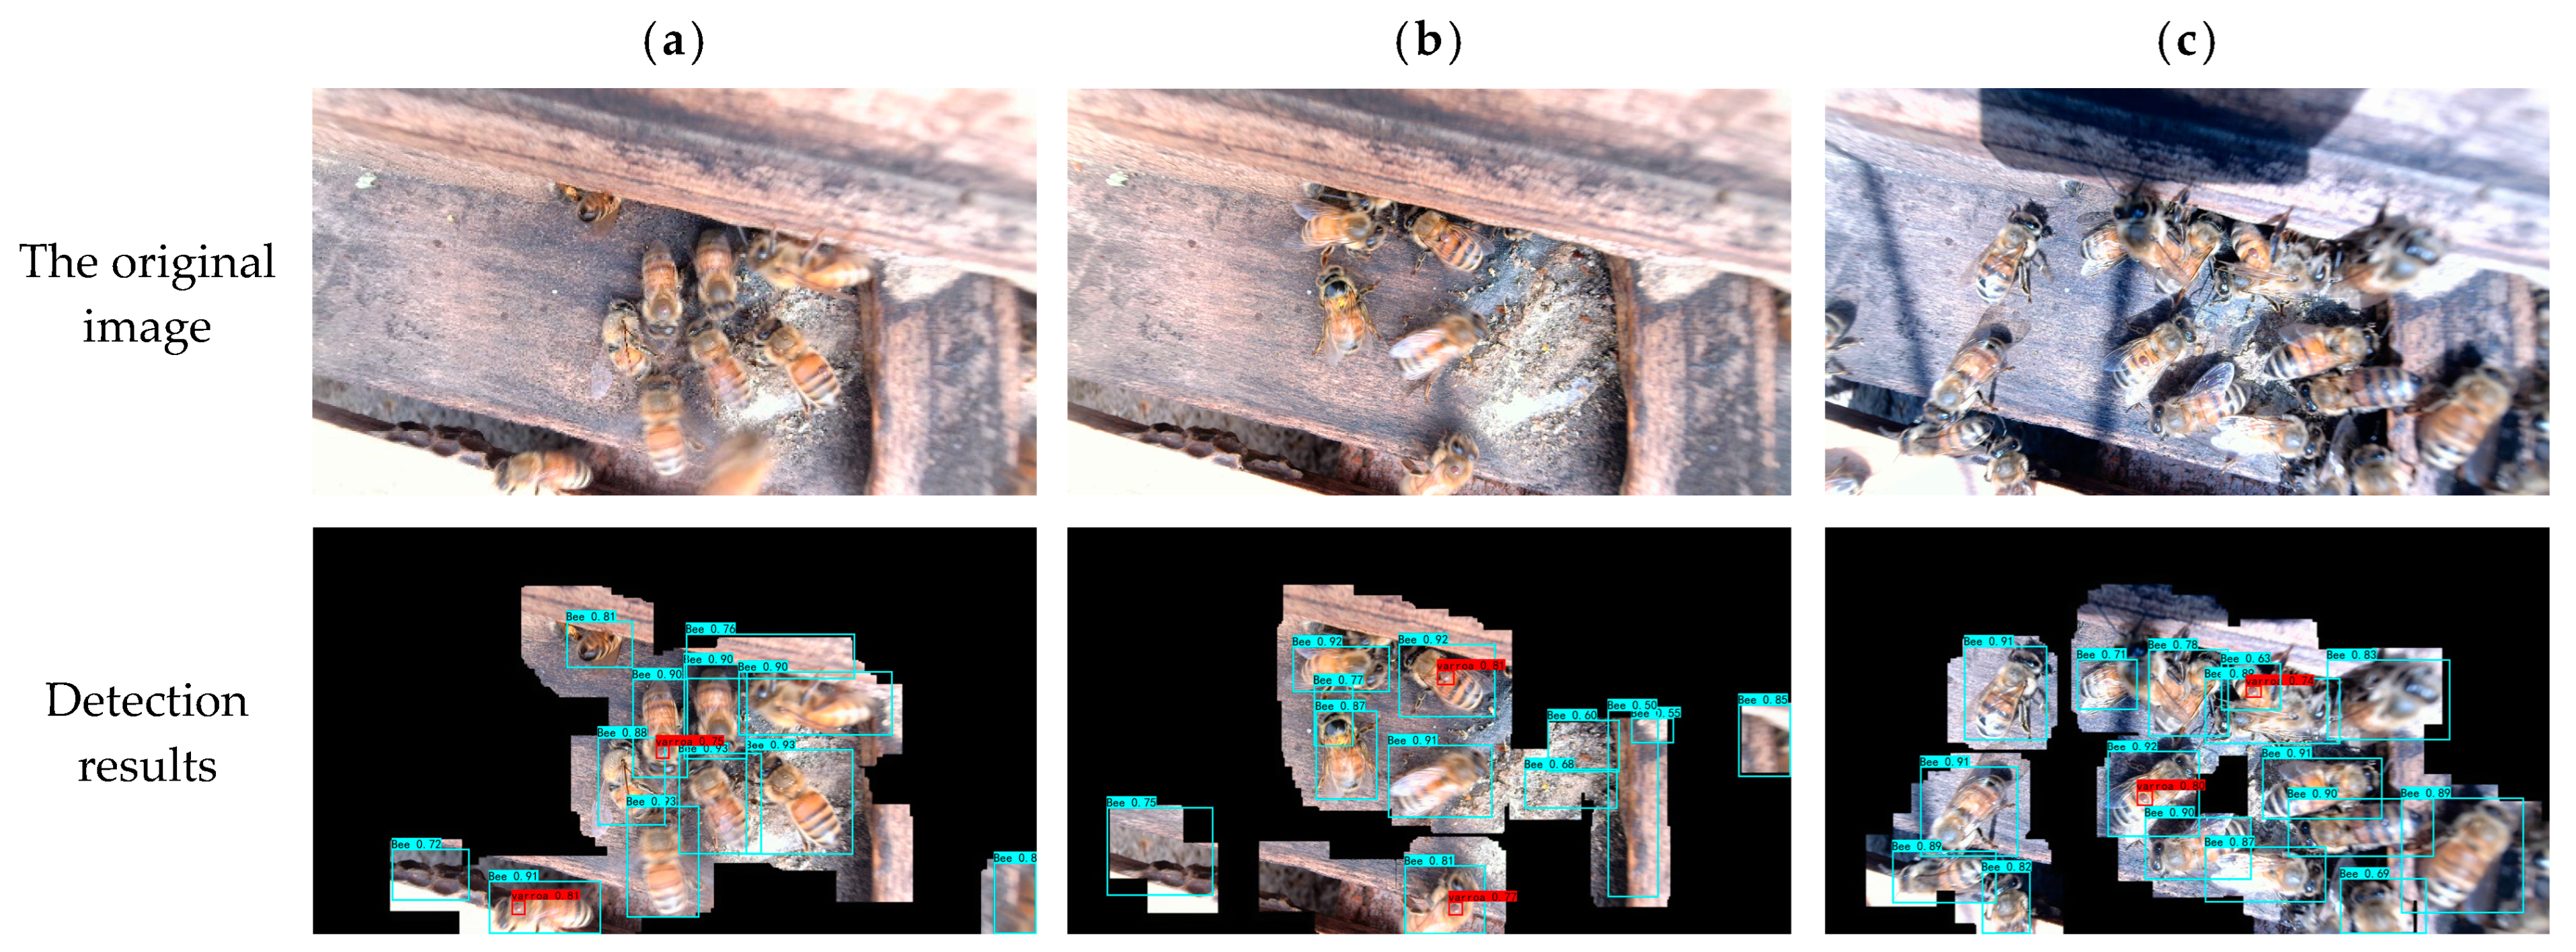
The differences in sunlight and weather can cause variations in the brightness and shadows of captured images. To test the effect of different lighting conditions on detection accuracy, we tested the F-YOLOX_b model under three different shooting conditions: weak sunlight on a sunny day, overcast, and strong sunlight. The results are shown in Figure 11.
From the experimental results, it can be seen that the target detection accuracy in Figure 11c is the highest, where all the Varroa mites and bees were detected. The confidence level for honeybees is the lowest at 0.63, with most between 0.8 and 0.9, while the confidence level for Varroa mites is 0.74 and 0.80. The high confidence level of all the detection boxes indicates that the shadows generated by sunlight in the image did not affect the accuracy of the network.
Both Figure 11a,b have cases where the background is segmented as honeybees, but the Varroa destructor can be detected with a confidence level greater than 0.75. It indicates that the FCN model is greatly affected by lighting conditions, and its ability to extract image features is weaker in low-light environments. In practical applications, there are more bees leaving the hive at noon and fewer in the morning and evening, so the detection of Varroa destructor can be performed during noon.

3.5. Beehive Experiment

To verify the accuracy of the model in practical applications, experiments were conducted at a honeybee farm located in the Science and Technology Innovation Park of Shandong Agricultural University in Tai’an, Shandong Province, China (E116.40400, N39.92800). From September 18–22, 2022, a total of 50 h of continuous shooting was conducted on three beehives with different degrees of infestation, and 200 images were selected randomly as the new test set. YOLOX, YOLOX-b, F-YOLOX-b, YOLOv4, F-YOLOv4 (FCN + YOLOv4), Faster RCNN, and F-Faster RCNN (FCN+ Faster RCNN) were used to detect honeybees and Varroa destructor. The results are compared in Table 4.
As shown in Table 4, all the evaluation metrics for accuracy of F-YOLOX-b, F-YOLOv4, and F-Faster RCNN are significantly higher than those of their corresponding direct object-detection models YOLOX-b, YOLOv4, and Faster RCNN. The mAP has increased by 12.75%, 56.02%, and 16.89%, respectively. The F1 of honeybees has increased by 6.82%, 31.39%, and 9.06%, respectively, and the F1 of Varroa mites has increased by 13.06%, 47.78%, and 29.03%, respectively. The above results indicate that our proposed method of first using image segmentation to eliminate background interference, and then using the network to focus on the extracted bee images for object detection, is effective. Especially for Varroa destructor, which are minority samples and extremely small targets, detecting them on the segmented image greatly improves the accuracy. This is consistent with the conclusion in Section 3.2.
The evaluation metrics of the F-YOLOX-b model are better than other models, especially in detecting the percentage of honeybees infested with Varroa mites. The I of the F-YOLOX-b model is 1.13%, which is the closest to the true value of 1.19% among all the model detection results. In terms of detection speed, although the average frame consumption time of F-YOLOX-b with the segmentation module added is 14 ms higher than YOLOX, the detection of honeybees and Varroa mites does not need to be continuously performed in real time. It can achieve the goal of detecting the health of the bee colony with intervals of 10 min or even longer for detection. Therefore, the F-YOLOX-b model is suitable for the detection of Varroa destructor infestation of honeybees in bee farms.
For beehives at three different stages of infestation, the F-YOLOX-b model detection results are shown in Table 5.
As shown in Table 5, the results of the model are positively correlated with the degree of infestation of the beehives. The infestation rate of Varroa destructor is lower in Beehive 1 and Beehive 2, and the detection values of the F-YOLOX-b for their images are close to the actual infestation values. However, for Beehive 3, which has a higher infestation level, the detection value is only 5.08%. It is significantly different from the actual value of 30.33%. Inspecting the interior of Beehive 3, we found that many bees with wing malformation are unable to leave the hive. Therefore, the image analysis on hive entrances cannot accurately predict the Varroa mite infestation rate of Beehive 3. Our method is more suitable for detection in the early stages of a Varroa destructor infestation.
Compared to the previous method used for image detecting at the entrance of beehives, our method has a mAP of 4.51%, which is higher than the results of Schurischuster et al. [15]. As an early-stage detector for the rate of Varroa destructor infestation, our method’s mAP is 47.2% higher than that of Voudiotis et al. [17]. In addition, since there is no additional channel installed and the hive does not need to be opened, the normal activities of bees, such as entering and exiting, are undisturbed. This is a non-stress detection method.
The results of the experiments show that this technology can be applied to detecting Varroa destructor infestation of bee colonies. However, the correlation between the identification results and the actual infestation rate requires a large amount of long-term monitoring data to support it. In future research, cameras can be fixed above the entrance of smart beehives, and F-YOLOX-b can be deployed on edge computing devices to monitor the Varroa destructor infestation in real time. It can provide accurate data support for beekeepers’ production decisions.

4. Conclusions

(1)
This study proposes a convolutional neural network that combines segmentation and object detection for detecting Varroa destructor infestation of honeybees in bee colonies. The mAP of the model is 95.31%, and the F1 score of honeybees and Varroa destructor are 94.83% and 96.85%, respectively. The average frame time is 35 ms, and the detection value for the proportion of honeybees infested with Varroa mites is extremely close to the true value. The model’s performance is better than other detection algorithms providing a useful exploration for the real-time online diagnosis of Varroa destructor infestation levels in bee colonies.
(2)
Using the constructed FCN to extract honeybee images can effectively filter out the influence of the background on detection accuracy, allowing the target detection model to focus more on the target and effectively improve the detection accuracy of Varroa destructor.
(3)
Adding the CA mechanism and improving the confidence loss function effectively improve the detection accuracy of the model for Varroa destructor. The mAP has increased by 14.08%, while the F1 score for Varroa destructor detection has increased by 8.70%, with only a 1 ms increase in average frame time.

Author Contributions

Conceptualization, M.L.; methodology, M.L.; software, M.C.; validation, M.L. and M.C.; formal analysis, M.L. and M.C.; investigation, Z.C., X.Z. and G.L.; resources, Y.Y., M.L. and B.X.; data curation, M.C., X.X. and Z.L. (Zhenguo Liu); writing—original draft preparation, M.C. and Z.L. (Zhenghao Li); writing—review and editing, M.L., Y.Y. and M.C.; supervision, Y.Y.; funding acquisition, M.L. and B.X. All authors have read and agreed to the published version of the manuscript.

Funding

This research was funded by the National Natural Science Foundation of China (No. 32001419), the project leader is Mochen Liu. The China Agriculture Research System of MOF and MARA (No. CARS-44), Shandong Modern Agricultural Technology System, China (No. SDAIT-18-06) and the Efficient Ecological Agriculture Innovation Project of the Taishan Industry Leading Talent Program (No. LJNY202003), the project leader is Baohua Xu.

Institutional Review Board Statement

Not applicable.

Informed Consent Statement

Not applicable.

Data Availability Statement

The dataset and Python code can be found at: https://github.com/luouy21785/F-YOLOX-b (accessed on 7 June 2023).

Conflicts of Interest

The authors declare no conflict of interest.

References

  1. Potts, S.G.; Biesmeijer, J.C.; Kremen, C.; Neumann, P.; Schweiger, O.; Kunin, W.E. Global pollinator declines: Trends, impacts and drivers. Trends Ecol. Evol. 2010, 25, 345–353. [Google Scholar] [CrossRef] [PubMed]
  2. Bjerge, K.; Frigaard, C.E.; Mikkelsen, P.H.; Nielsen, T.H.; Misbih, M.; Kryger, P. A computer vision system to monitor the infestation level of Varroa destructor in a honeybee colony. Comput. Electron. Agric. 2019, 164, 104898. [Google Scholar] [CrossRef]
  3. Martin, S.J.; Ball, B.V.; Carreck, N.L. Prevalence and persistence of deformed wing virus (DWV) in untreated or acaricide-treated Varroa destructor infested honey bee (Apis mellifera) colonies. J. Apic. Res. 2010, 49, 72–79. [Google Scholar] [CrossRef]
  4. Carreck, N.L.; Ball, B.V.; Martin, S.J. Honey bee colony collapse and changes in viral prevalence associated with Varroa destructor. J. Apic. Res. 2010, 49, 93–94. [Google Scholar] [CrossRef]
  5. Ramsey, S.D.; Ochoa, R.; Bauchan, G.; Gulbronson, C.; Mowery, J.D.; Cohen, A.; Lim, D.; Joklik, J.; Cicero, J.M.; Ellis, J.D. Varroa destructor feeds primarily on honey bee fat body tissue and not hemolymph. Proc. Natl. Acad. Sci. USA 2019, 116, 1792–1801. [Google Scholar] [CrossRef] [PubMed]
  6. Locke, B.; Semberg, E.; Forsgren, E.; De Miranda, J.R. Persistence of subclinical deformed wing virus infections in honeybees following Varroa mite removal and a bee population turnover. PLoS ONE 2017, 12, e0180910. [Google Scholar] [CrossRef] [PubMed]
  7. Guzmán-Novoa, E.; Eccles, L.; Calvete, Y.; Mcgowan, J.; Kelly, P.G.; Correa-Benítez, A. Varroa destructor is the main culprit for the death and reduced populations of overwintered honey bee (Apis mellifera) colonies in Ontario, Canada. Apidologie 2010, 41, 443–450. [Google Scholar] [CrossRef]
  8. Di Prisco, G.; Pennacchio, F.; Caprio, E.; Boncristiani Jr, H.F.; Evans, J.D.; Chen, Y. Varroa destructor is an effective vector of Israeli acute paralysis virus in the honeybee, Apis mellifera. J. Gen. Virol. 2011, 92, 151–155. [Google Scholar] [CrossRef] [PubMed]
  9. Gisder, S.; Aumeier, P.; Genersch, E. Deformed wing virus: Replication and viral load in mites (Varroa destructor). J. Gen. Virol. 2009, 90, 463–467. [Google Scholar] [CrossRef] [PubMed]
  10. Kulhanek, K.; Steinhauer, N.; Wilkes, J.; Wilson, M.; Spivak, M.; Sagili, R.R.; Tarpy, D.R.; McDermott, E.; Garavito, A.; Rennich, K. Survey-derived best management practices for backyard beekeepers improve colony health and reduce mortality. PLoS ONE 2021, 16, e0245490. [Google Scholar] [CrossRef] [PubMed]
  11. Steinhauer, N.; Saegerman, C. Prioritizing changes in management practices associated with reduced winter honey bee colony losses for US beekeepers. Sci. Total Environ. 2021, 753, 141629. [Google Scholar] [CrossRef] [PubMed]
  12. Santana, F.S.; Costa, A.H.R.; Truzzi, F.S.; Silva, F.L.; Santos, S.L.; Francoy, T.M.; Saraiva, A.M. A reference process for automating bee species identification based on wing images and digital image processing. Ecol. Inform. 2014, 24, 248–260. [Google Scholar] [CrossRef]
  13. Babic, Z.; Pilipovic, R.; Risojevic, V.; Mirjanic, G. Pollen bearing honey bee detection in hive entrance video recorded by remote embedded system for pollination monitoring. ISPRS Ann. Photogramm. Remote Sens. Spat. Inf. Sci. 2016, 3, 51. [Google Scholar] [CrossRef]
  14. Martineau, M.; Conte, D.; Raveaux, R.; Arnault, I.; Munier, D.; Venturini, G. A survey on image-based insect classification. Pattern Recognit. 2017, 65, 273–284. [Google Scholar] [CrossRef]
  15. Schurischuster, S.; Kampel, M. Image-based classification of honeybees. In Proceedings of the 2020 Tenth International Conference on Image Processing Theory, Tools and Applications (IPTA), Paris, France, 9–12 November 2020; pp. 1–6. [Google Scholar]
  16. Kaur, M.; Ardekani, I.; Sharifzadeh, H.; Varastehpour, S. A CNN-based identification of honeybees’ infection using augmentation. In Proceedings of the 2022 International Conference on Electrical, Computer, Communications and Mechatronics Engineering (ICECCME), Maldives, Maldives, 16–18 November 2022; pp. 1–6. [Google Scholar]
  17. Voudiotis, G.; Moraiti, A.; Kontogiannis, S. Deep Learning Beehive Monitoring System for Early Detection of the Varroa Mite. Signals 2022, 3, 506–523. [Google Scholar] [CrossRef]
  18. Bilik, S.; Kratochvila, L.; Ligocki, A.; Bostik, O.; Zemcik, T.; Hybl, M.; Horak, K.; Zalud, L. Visual diagnosis of the Varroa destructor parasitic mite in honeybees using object detector techniques. Sensors 2021, 21, 2764. [Google Scholar] [CrossRef] [PubMed]
  19. Liu, W.; Anguelov, D.; Erhan, D.; Szegedy, C.; Reed, S.; Fu, C.-Y.; Berg, A.C. Ssd: Single shot multibox detector. In Proceedings of the Computer Vision–ECCV 2016: 14th European Conference, Amsterdam, The Netherlands, 11–14 October 2016; Proceedings, Part I 14. pp. 21–37. [Google Scholar]
  20. Liu, S.; Qi, L.; Qin, H.; Shi, J.; Jia, J. Path aggregation network for instance segmentation. In Proceedings of the IEEE Conference on Computer Vision and Pattern Recognition, Salt Lake City, UT, USA, 18–23 June 2018; pp. 8759–8768. [Google Scholar]
  21. Long, J.; Shelhamer, E.; Darrell, T. Fully convolutional networks for semantic segmentation. In Proceedings of the IEEE Conference on Computer Vision and Pattern Recognition, Boston, MA, USA, 7–12 June 2015; pp. 3431–3440. [Google Scholar]
  22. Ge, Z.; Liu, S.; Wang, F.; Li, Z.; Sun, J. Yolox: Exceeding yolo series in 2021. arXiv 2021, arXiv:2107.08430. [Google Scholar]
  23. Wang, C.-Y.; Liao, H.-Y.M.; Wu, Y.-H.; Chen, P.-Y.; Hsieh, J.-W.; Yeh, I.-H. CSPNet: A new backbone that can enhance learning capability of CNN. In Proceedings of the IEEE/CVF Conference on Computer Vision and Pattern Recognition Workshops, Seattle, WA, USA, 14–19 June 2020; pp. 390–391. [Google Scholar]
  24. He, K.; Zhang, X.; Ren, S.; Sun, J. Spatial pyramid pooling in deep convolutional networks for visual recognition. IEEE Trans. Pattern Anal. Mach. Intell. 2015, 37, 1904–1916. [Google Scholar] [CrossRef] [PubMed]
  25. Hou, Q.; Zhou, D.; Feng, J. Coordinate attention for efficient mobile network design. In Proceedings of the IEEE/CVF Conference on Computer Vision and Pattern Recognition, Nashville, TN, USA, 20–25 June 2021; pp. 13713–13722. [Google Scholar]
  26. Yan, Y.; Li, J.; Qin, J.; Bai, S.; Liao, S.; Liu, L.; Zhu, F.; Shao, L. Anchor-free person search. In Proceedings of the IEEE/CVF Conference on Computer Vision and Pattern Recognition, Nashville, TN, USA, 20–25 June 2021; pp. 7690–7699. [Google Scholar]
  27. Ren, S.; He, K.; Girshick, R.; Sun, J. Faster r-cnn: Towards real-time object detection with region proposal networks. Faster r-cnn: Towards real-time object detection with region proposal networks. IEEE Trans. Pattern Anal. Mach. Intell. 2017, 39, 1137–1149. [Google Scholar] [CrossRef] [PubMed]
  28. Bochkovskiy, A.; Wang, C.-Y.; Liao, H.-Y.M. Yolov4: Optimal speed and accuracy of object detection. arXiv 2020, arXiv:2004.10934. [Google Scholar]
  29. Hu, J.; Shen, L.; Sun, G. Squeeze-and-excitation networks. In Proceedings of the IEEE Conference on Computer Vision and Pattern Recognition, Salt Lake City, UT, USA, 18–23 June 2018; pp. 7132–7141. [Google Scholar]
  30. Woo, S.; Park, J.; Lee, J.-Y.; Kweon, I.S. Cbam: Convolutional block attention module. In Proceedings of the European Conference on Computer Vision (ECCV), Munich, Germany, 8–14 September 2018; pp. 3–19. [Google Scholar]
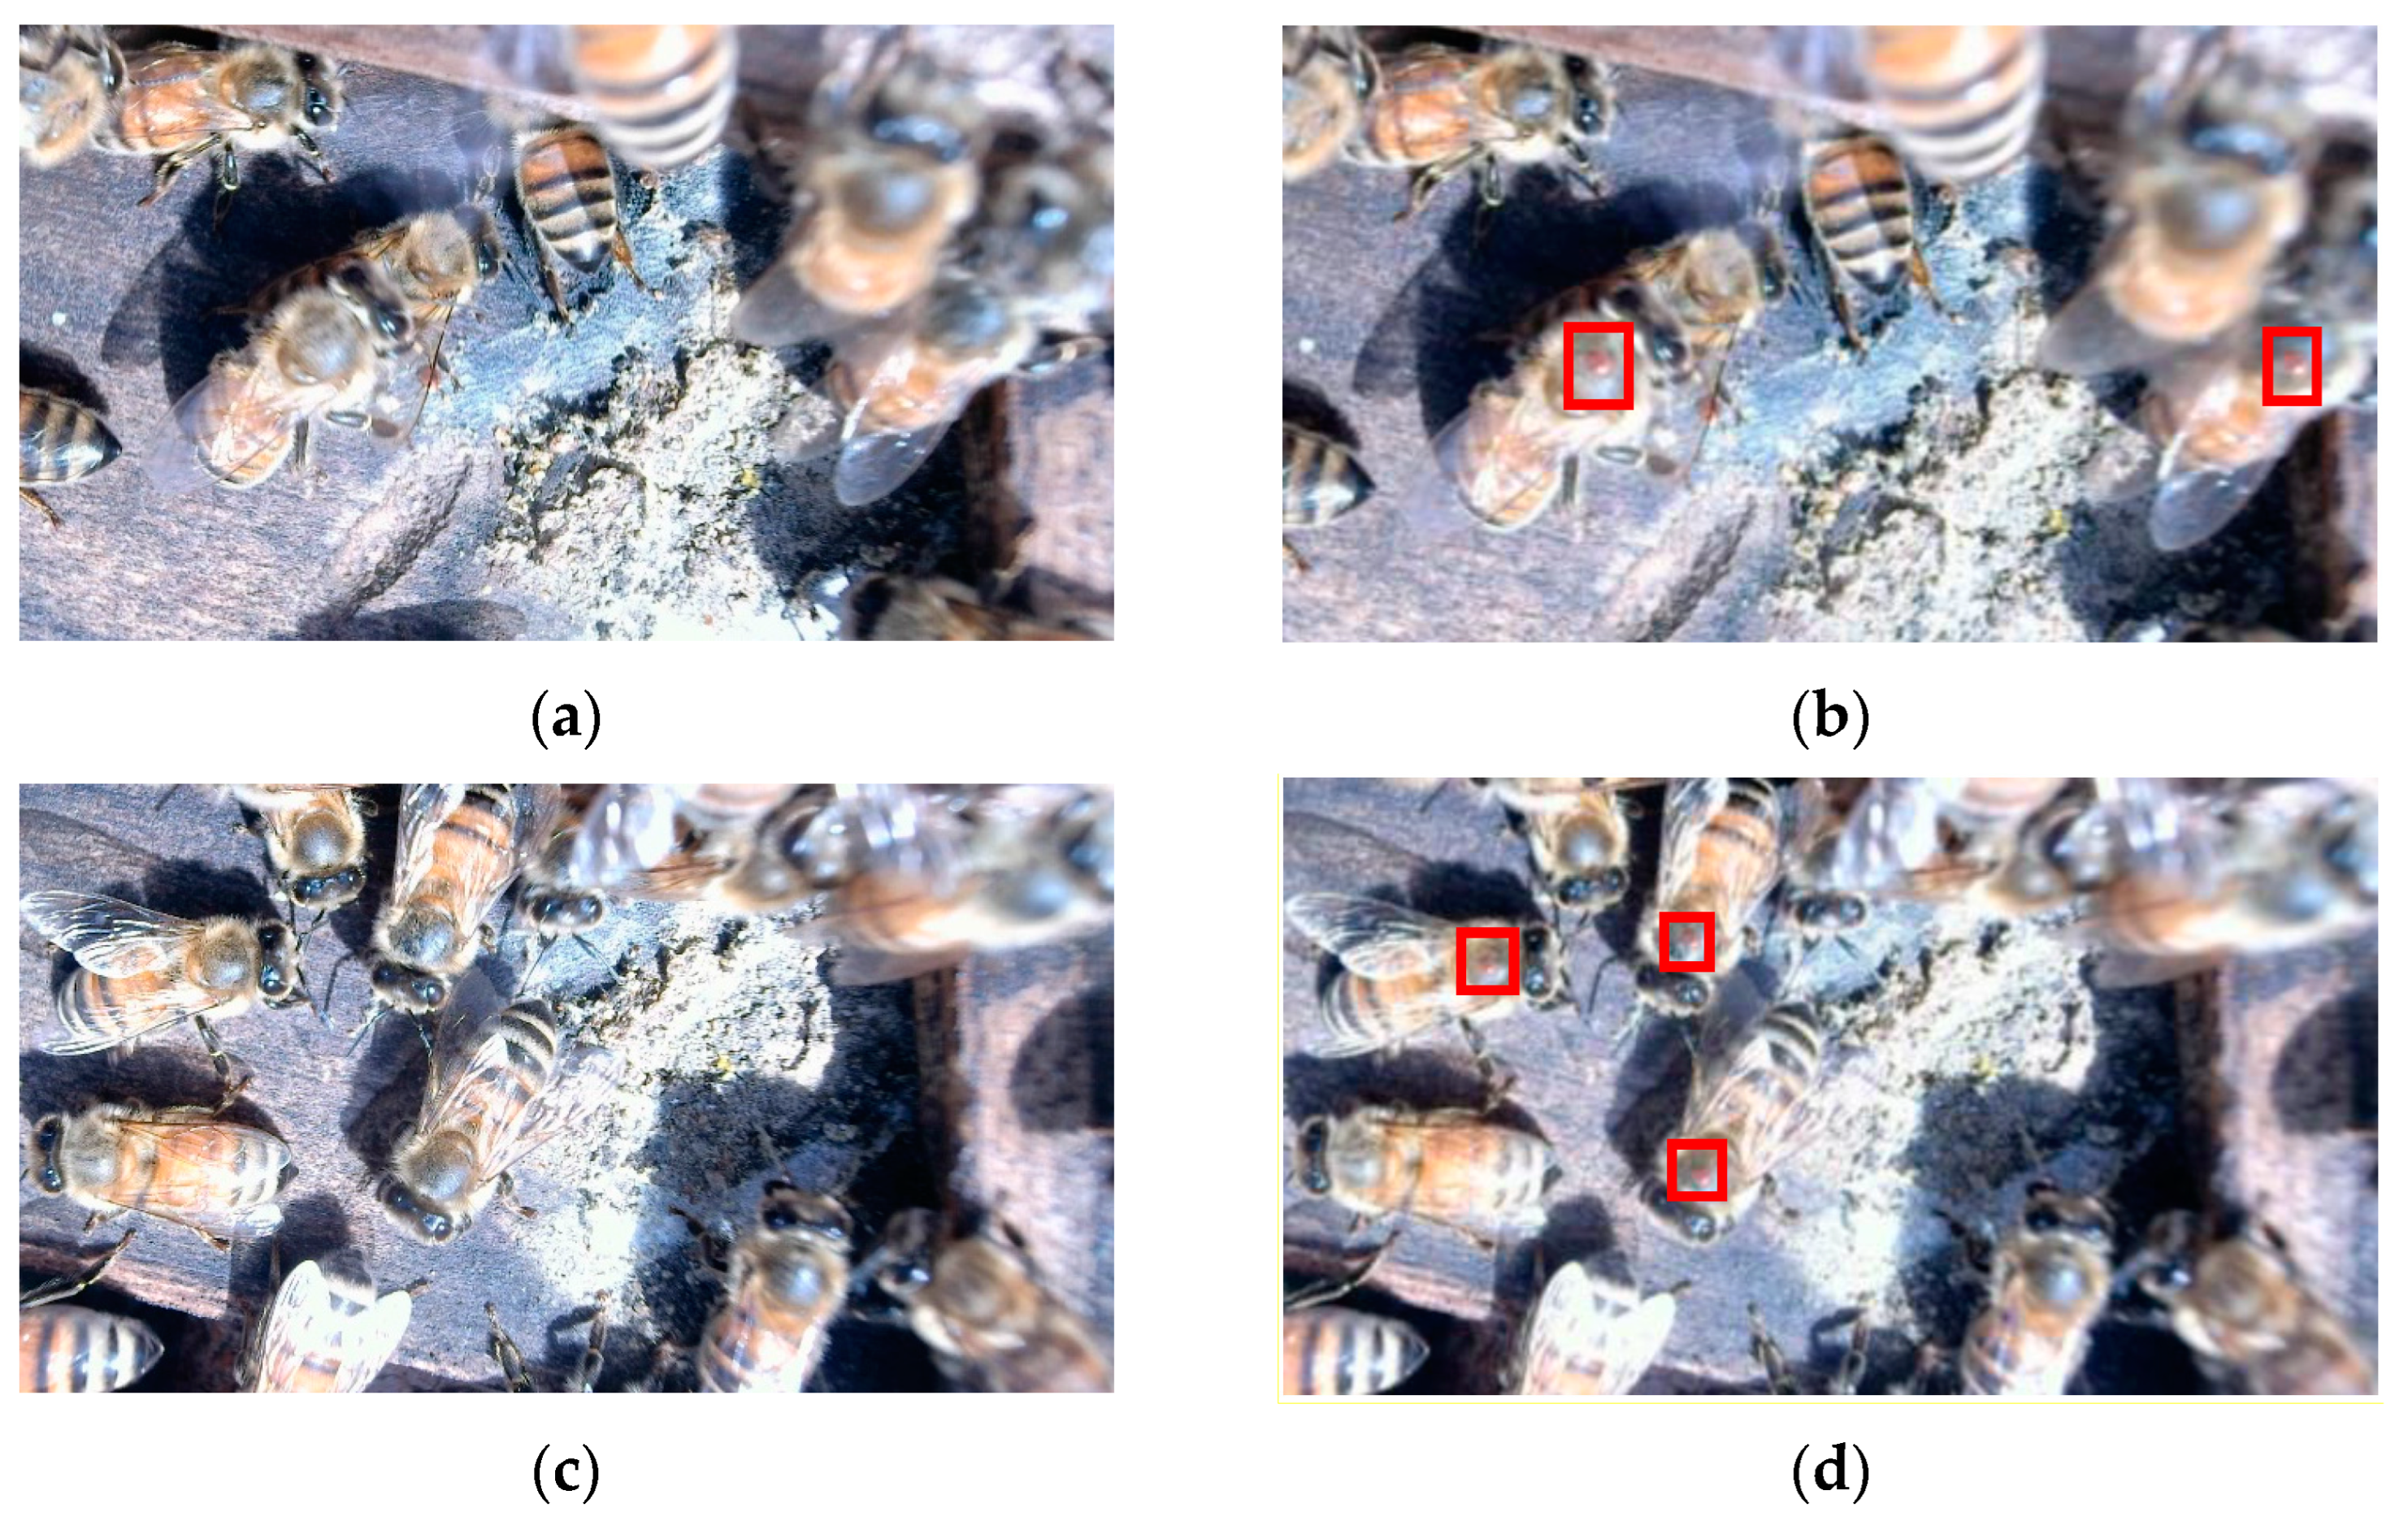
Figure 1. Data augmentation. (a,c) Original images; (b,d) Image of Varroa destructor augmentation. The red squares in (b,d) shows the image of the Varroa mites.
Agriengineering 05 00102 g001
Figure 2. Detection process for honeybees and Varroa destructor.
Agriengineering 05 00102 g002
Figure 3. FCN model network structure diagram (h is the height of the image; w is the width of the image; num_cls is the number of classes, which in this network is 2 for honeybees and background).
Agriengineering 05 00102 g003
Figure 4. Improved YOLOX model architecture. Conv represents a convolution, and the CBS module consists of a Conv, a Batch Normalization (BN) structure, and a SILU activation function. The CPS is composed of multiple CBSs connected in parallel, and then connected in series with another CBS. Sigmoid is an activation function. The model has added a CA attention mechanism to all three decoupling head branches in the target detection head.
Agriengineering 05 00102 g004
Figure 5. Coordinate Attention mechanism. ‘X Avg Pool’ and ’Y Avg Pool’ refer to horizontal global pooling and vertical global pooling, respectively.
Agriengineering 05 00102 g005
Figure 6. Honeybee image segmentation results. (a) Original image. (b) Segmented image. (c) Extracted image of honeybees.
Agriengineering 05 00102 g006
Figure 7. Comparison of honeybees Varroa destructor detection results. (ac) are three randomly selected images from the test set. Image (a) contains 18 honeybees and 2 Varroa destructor, (b) contains 21 honeybees and 3 Varroa destructor, and (c) contains 21 honeybees and 2 Varroa destructor.
Agriengineering 05 00102 g007
Figure 8. Statistical chart of honeybees Varroa destructor detection. (a) is the comparison of the number of bees detected by each model. (b) is the comparison of the number of Varroa mites detected by each model.
Agriengineering 05 00102 g008
Figure 9. PR curve. Model 1 is the original YOLOX model, Model 2 is the YOLOX + CBAM, Model 3 is the YOLOX +SE, Model 4 is the YOLOX + CA, Model 5 is the YOLOX + Focal Loss, and Model 6 is the YOLOX +CA + Focal Loss. (a) is the PR curve of bees detected by each model. (b) is the PR curve of the Varroa mites detected by each model.
Agriengineering 05 00102 g009
Figure 10. Comparison of identification results for honeybees with inconspicuous features. (a) Original image. (b) The details of detecting honeybees with YOLOv4. (c) The details of detecting honeybees with F-YOLOX_b. Number 1 represents a bee only showing its head, number 2 represents a bee only showing its abdomen, number 3 shows two overlapping bees, both of which only captured their abdomens.
Agriengineering 05 00102 g010
Figure 11. Comparison of detection results of the F-YOLOX_b model under different lighting conditions. (a) Weak sunlight on a sunny day. (b) Overcast. (c) Strong sunlight.
Agriengineering 05 00102 g011
Table 1. Dataset image grouping information.
Dataset ClassificationImage ClassificationNumber of Images
Training setContains Varroa destructor380
Does not contain Varroa destructor1020
Validation setContains Varroa destructor107
Does not contain Varroa destructor293
Test setContains Varroa destructor55
Does not contain Varroa destructor145
Table 2. Experimental environment.
ConfigurationParameter
CPUIntel Xeon E5-2620
Memory16G
GPUGeForce RTX 2080 Ti
Accelerated environmentCUDA 10.0 CUDNN 7.1
Operating systemWindows 10.0
Development environmentPython 3.7.11 Pytorch 1.2.0
Table 3. Comparison of optimization methods.
ModelCBAMSECAFLmAP/%F1/%
Honeybee
F1/%
Varroa
Avg (FTime)/ms
1××××81.4888.0183.7934
2×××88.5690.4591.2238
3×××83.9188.9686.1635
4×××89.9491.4592.4934
5×××94.3894.4194.6334
6××95.5694.4497.0135
Table 4. Comparison of test results.
ModelmAP/%F1/%
Honeybee
F1/%
Varroa
I/%
Detection Value
I/%
True Value
Avg (FTime)/ms
YOLOX57.5467.0846.820.711.1921
YOLOX-b82.5688.0183.790.8923
F-YOLOX-b95.3194.8396.851.1335
YOLOv430.8158.4041.390.3673
F-YOLOv486.8389.7989.171.0187
Fester RCNN46.9277.9310.500.5344
F-Faster RCNN63.8186.9939.530.7758
Table 5. Comparison of different infestation stages.
BeehivesDetection of Infestation RateActual Infestation Rate
10.88%0.83%
21.35%1.25%
35.08%30.33%
Disclaimer/Publisher’s Note: The statements, opinions and data contained in all publications are solely those of the individual author(s) and contributor(s) and not of MDPI and/or the editor(s). MDPI and/or the editor(s) disclaim responsibility for any injury to people or property resulting from any ideas, methods, instructions or products referred to in the content.