Abstract
Cage-free (CF) layer houses tend to have high particulate matter (PM) levels because of bedding/litter floor and the birds’ activities, such as perching, dustbathing, and foraging on it. It has been reported that optimizing bedding management can potentially suppress PM levels in CF houses. The objectives of this study were to (1) test the effect of the top application of new bedding materials (BMs) on PM levels and (2) compare different BM PM reduction efficiencies. Small flake shavings (SFS), large flake shavings (LFS), and aspen wood chips (AWC) were top-dressed on the surface of the original litter (33-week-old litter) evenly in each of the BM treatment rooms at 20% volume of the original litter floor. The initial litter depths in the control, SFS, LFS, and AWC rooms were 4.6 ± 0.6, 4.8 ± 0.8 cm, 4.8 ± 0.8 cm, and 4.6 ± 0.9 cm, respectively. One room was used as a control without adding new BM. The results indicate that the top application of new bedding suppressed PM levels in all treatment rooms (p < 0.01). The PM2.5 reductions in the SFS, AWC, and LFS treatment rooms were 36.5%, 34.6%, and 28.9% greater than in the control room, respectively. The mitigation efficiencies were different between PM sizes. For instance, PM2.5, PM10, and TSP in the SFS room were lower than in the control room by 36.5%, 39.4%, and 38.7%, respectively. For litter quality, the moisture content was 18.0 ± 2.8, 20.0 ± 3.1, 20.6 ± 2.4, and 19.7 ± 4.2% in the control, SFS, LFS, and AWC rooms, respectively. Treatment rooms with 20% new BM had 10% higher litter moisture than the control room. The findings of this study reveal that the top application of new bedding on old litter is a potential strategy for reducing PM generation in CF houses. Further studies are warranted, such as regarding the effect of different ratios of new bedding on PM reduction, cost analysis, and verification tests in commercial CF houses.
1. Introduction
Egg production in the US is shifting from conventional cages (CCs) to cage-free (CF) housing systems because of various public concerns over animal welfare [1,2]. Moreover, increasing animal welfare concerns and public demand are supported by major food retailers and manufacturers, grocers, and restaurant chains that have pledged to buy or sell CF eggs in the foreseeable future, such as by 2025 or 2030 [2,3,4]. In the past, CF egg production has shown a general growth rate trend from 4% in 2010 to 14% in 2016, accelerating with the passing years [2]. At the end of 2021, about 32% of US table eggs were produced in a CF housing system, while 68% were produced under caged housing conditions [5]. In addition, the future market prediction assumes that more than 66% of eggs produced by 2026 will be from CF housing [2]. Cage-free production has continued to grow rapidly in recent years and is considered to improve animal welfare by promoting the expression of different behaviors like nesting, perching, and dustbathing, which are not possible in cages [6,7,8]. However, there is an inherent challenge in poor air quality, such as higher levels of particulate matter (PM or dust), ammonia, and airborne bacteria in CF housing [9,10,11,12,13]. Particulate matter of a size ≤ 2.5 μm is considered a major air pollutant and constitutes almost half of the total anthropogenic air pollutant emissions (especially in the eastern and western US) from agricultural sectors, including poultry production [14,15]. The PM concentration in poultry production varies with laying hen housing types [11]. According to Zhao et al. [7], CF housing systems have 6–9 times higher PM10 concentrations than CC and enriched colony cages (ECs).
Particulate matter found in poultry housing is made up of biological, organic, and inorganic compounds in origin and typically consists of a complex mixture of solid and liquid materials such as moisture, feed, skin, feathers, dander, mold spores, excreta, bedding materials (BMs), and microorganisms [11,16,17,18,19]. About 90% of total inhalable PM (diameter ≤ 100 μm) contains organic compounds [17]. In broiler facilities, the major sources of PM found are down feathers, mineral crystals from urine, and litter, whereas the most prominent sources in layer facilities are skin, feathers, and some feed particles from caged housing, with additional excrement, litter debris, and litter particles from the floor-raised housing [17,20].
Based on particle size, PM can be classified into PM1 (PM with an aerodynamic diameter ≤ 1 μm), PM2.5 (PM with an aerodynamic diameter ≤ 2.5 μm), PM4 (PM with an aerodynamic diameter ≤ 4 μm), PM10 (PM with an aerodynamic diameter ≤ 10 μm), and total suspended particulate (TSP) [10,13,21,22,23]. Among these different PM sizes, PM2.5 and PM10 are very harmful to birds and caretakers [6,10,11]. Schwarze et al. [24] found that long-term exposure to high levels of fine PM2.5 and the fraction size of PM10 impaired lung functions and increased mortality risk, respectively. Similarly, endotoxins present in PM decrease the cell-mediated immunity B-cell percentage in laying hens [25], resulting in leukopenia (fewer white blood cells), which makes the immunity system weak and causes various health issues in chickens [26]. Although CF housing with litter floor helps to increase live weight and survivability [27], it is also linked to lung damage [9] and a higher risk of mortality rates in birds due to higher PM production [28]. Particulate matter from poultry houses affects chicken health and is linked to various adverse health issues in workers. Compared with non-poultry workers, poultry workers are at high risk of many respiratory problems like high asthma rates and other respiratory syndromes [11,29,30]. Therefore, suppressing PM concentrations is necessary to improve the health and welfare of laying hens and barn workers. Previous research has reported that PM can be reduced significantly by using various mitigation strategies such as spraying oil or electrolyzed water [31,32], BM, electrostatic charging systems [33,34,35], different ventilation rates and types [36,37], and applying manure management strategies [27,38].
Cage-free houses use litter that constitutes a mixture of initial BM and manure deposited above the BM [39]. Litter floor distribution usually covers the BM by at least 33% (one-third) for layers and 100% for bedding spaces for broilers [40]. Thus, these BMs can be organic (grass, maize silage, plant husk, paper, straw, rice hulls, wood shavings, or chips) or inorganic (clay, sand, or stone) in origin and must be comfortable, highly absorbent, and non-toxic for animals [11,30,41]. PM production from BM depends on BM types, the amount of BM, litter moisture content, application rates [42], and bird activities [43]. Several studies have indicated that using different BMs in CF houses significantly decreases PM concentrations [11,39,44,45].
The litter in a CF layer house is usually removed after each flock, which tends to increase higher PM concentrations within the flock. To improve litter and air quality, the top-dressing of new BM could be an alternate PM mitigation strategy in CF layer housing. Therefore, the objectives of this study were to (1) test the effect of top application of new bedding materials with different sizes on PM levels and (2) compare different BM PM reduction efficiencies.
2. Materials and Methods
2.1. Ethical Approval
This study was conducted in a CF aviary facility at Michigan State University (MSU), utilizing four housing rooms. All the procedures were approved by the MSU Institutional Animal Care and Use Committee before starting this research (AUF#: PROTO202100003; approved on 2 September 2021).
2.2. Housing and Management
This study was conducted in four identical rooms of a multi-tier AV system (NATURA60, Big Dutchman, Holland, MI, USA) at the MSU laying hen facility. Each room measures 20 m in length and 4.3 m in width. The room contains a system divided into four equal discrete AV units or sections separated by a metal fence within the laying hen facility [46]. Each AV unit included a 3-tiered enclosure (wire fence) and an upper level with a 61 cm internal ceiling height. The lower, middle, and upper tiers were 51, 112, and 173 cm, respectively, higher than the AV floor. The lower level was provided with an open litter area consisting of wood shavings (before treatment was applied) and later top-dressed with different BMs over the original litter substrate (pine shavings) for this research. The upper tiers were provided with colony nests. In addition, manure belts were attached and run under each tier for manure removal. Each tier enclosure consisted of round metal internal perches of 3.1 cm diameter at all levels, while additional outer perches were provided in the open litter areas. Drinkers were placed in the lower and upper tiers, but internal and external feeders were in the lower and middle tiers. Similarly, a door in the lower tiers was provided to provide access to switch from enclosure to litter and vice versa.
A total of 2304 hens (Lohmann Brown Lite) were housed in four rooms, resulting in a stocking density of 576 hens/room (144 hens/section). During the onset of this study, hens were 50 weeks of age (WOA), and research was conducted for 6 weeks. In addition, each hen was provided with a total useable floor area of 1132 cm2/hen, which included a tiered section or enclosure space of 551 cm2/hen (112 cm2/hen solid metal ledges and 439 cm2/hen metal wire floor) and an open litter space of 581 cm2/hen. The drinker was a pin-metered nipple and provided one nipple drinker for 9 hens. Similarly, each hen was facilitated with 5.08 cm of feeder space per hen, 88 cm2 of colony nesting space per hen, and 40.64 cm of perch space per hen. Additionally, the hens were provided with a standard mesh diet throughout the study period. Fresh manure in the aviary system was removed twice weekly with manure belts under the wire-mesh flooring on each level.
A PMSI Command III controller (Poultry Management Systems, Inc., Lowell, MI, USA) controlled the room temperature and ventilation rates. The controller was programmed to control the room at a targeted temperature of 21 °C (70 °F) by turning on and off two tunnel ventilation fans and a cooling pad accordingly. For instance, a smaller fan (14” Vortex VX14F1CP, Munter’s Corporation, Mason, MI, USA) would turn on and run continuously as the stage-I ventilation control during the colder time, while a larger fan (24” Vortex VX24F1CP, Munter’s Corporation, Mason, MI, USA) would start to run as the stage-II control during the warmer time. Small and larger exhaust fans turned on when the room temperature exceeded the set temperature and continued until the room temperature limits were met. The research was conducted in warm weather, and the HOBO sensor (HOBO MX CO2 Logger MX1102A, Bourne, MA, USA) data show that the temperature inside the room was more than 21 °C in all treatment rooms during this bedding treatment research. In addition, the lighting schedule adhered to the Lohmann Brown light management guidelines, comprising 16 h of daily light exposure with a light intensity ranging from 10 to 15 Lux.
2.3. Experimental Setup
Three kiln-dried bedding materials, i.e., aspen wood chips (AWC; NEPCO, Warrensburg, NY, USA), large flake shavings (LFS; Family Farm and Home, East Lansing, MI, USA), and small flake shavings (SFS; Family Farm and Home, East Lansing, MI, USA), were tested for dust reduction in this study (Figure 1). The SFS, LFS, and AWC cost around USD 1.9, USD 1.9, and USD 3.9 per ft3, respectively, based on East Lansing, Michigan prices when the study was initiated. Wood shavings were 100% softwood. The original BM used in all treatment rooms before treatment was pine shavings placed at 17 WOA and top-dressed with different bedding treatments when birds were 50 WOA. Litter depth was measured before applying BM to estimate the BM needed for each room and each section. A wooden ruler (30 cm long) was used to measure litter depth. The initial litter depth of the original BM was measured randomly at 16 different locations per room (4 different locations per section). The initial depth was measured from each section of each room and then averaged out to obtain the average initial depth of each room (control—4.57 ± 0.55 cm; SFS—4.83 ± 0.82 cm; LFS—4.83 ± 0.79 cm; AWC—4.57 ± 0.89 cm). One room was maintained as the control of the four rooms without top-applying any BM. The top-dressing amount of new BM (20% of each) was calculated based on the initial litter depth (from the concrete floor) before BM was placed (Table 1). After measuring the litter depth within each room, 20% of the total volume of the original litter floor depth was top-dressed among three different rooms with different litter substrates. Out of the four rooms, one room was maintained as the control without the top application of any BM. Similarly, AV sections within each room had a similar litter substrate.
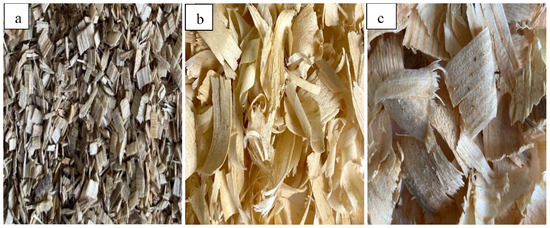
Figure 1.
Bedding material treatment using (a) AWC—aspen wood chips, (b) SFS—small flake shavings, and (c) LFSs—large flake shavings.

Table 1.
Average litter depth (cm) before and at the end of the experiment with top-dressing of 20% bedding material in different aviary laying-hen treatment rooms.
Litter moisture content (LMC) was measured once every two weeks (n = 3). The initial litter moisture content of the AWC, SFS, and LFS was 10.78 ± 0.02, 12.67 ± 0.34, and 12.74 ± 0.10%, respectively. Litter samples (100 g) collected from each room and section were kept in plastic bags and stored in a freezer at −20 °C to prevent nutrient and moisture content loss before sending them away for analysis. For tracking changes in LMC in the control and BM treatment rooms, duplicate litter samples (about 10 g each, one for testing and another for validating) were sampled from each section (n = 48 samples in total) of the 4 rooms for drying in a 105 °C oven for 24 h. The LMC was calculated with the following equation (Equation (1)).
where LMC—litter moisture content (%); LWW—litter wet weight (g); LDW—litter dry weight (g).
2.4. Particulate Matter Measurements
The PM concentrations were measured with the help of a TSI DustTrak sensor (DustTrak DRX Aerosol Monitor 8533, TSI Incorporated, Shoreview, MN, USA), which was placed at the center of each section at a 0.35 m height (bucket height; Figure 2b) above the littered floor inside each room before and after the bedding treatment was placed, and the reading was recorded twice a week (from 9 to 10 a.m.) over six weeks. The selection of morning hours for monitoring was based on previous evidence demonstrating its efficacy in stabilizing house ventilation [23]. The device underwent a multi-point calibration before the research started as the PM can show different properties from the test dust data, which can change the instrument’s reading (US EPA-designated Federal Reference Method) and decrease accuracy [47]. To improve the PM reading accuracy, the DustTrak sensor was zero-calibrated. The filter was changed and cleaned inside monthly. The TSI DustTrak sensor was programmed to collect PM data for 2 min at each section and to record 12 samples per minute (1 sample every 5 s; a total of 24 samples in 2 min). The first 6 samples were not considered because of potential interferences from sensor relocation (changing location) within rooms. This sensor was capable of measuring PM concentrations of five different particle sizes (PM1, PM2.5, PM4, PM10, and TSP). Among these PM sizes, PM2.5, PM10, and TSP were taken into consideration because of their harmful effects on bird and caretaker health and welfare. During the PM measurement, the DustTrak sensor was covered with plastic (leaving the PM inlet open; Figure 2) to prevent dust accumulation and possible damage to the system. Similarly, the DustTrak sensor was randomly assigned to each room and each section (within the room) twice a week to reduce the dust-reading difference between treatment rooms. The PM sensor measured each section randomly before transitioning to the next room.
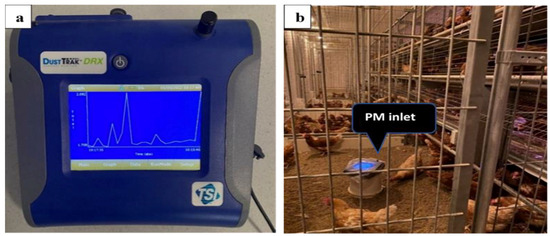
Figure 2.
Particulate matter measuring: (a) TSI DustTrak device and (b) placement in cage-free aviary housing room.
2.5. Environmental Parameters
Environmental parameters (temperature and relative humidity—RH) in each room were continuously measured using a data logger (HOBO MX CO2 Logger MX1102A, Bourne, MA, USA). The data logger was placed 0.9 m above each room’s littered floor in the middle of Section 2 and Section 3. The device was programmed to record the data every 10 min throughout the study.
2.6. Statistical Data Analysis
The litter qualities (e.g., litter moisture content and new bedding) and sampling period (each week) were considered factors and blocks to measure PM of 5 different sizes: PM1, PM2.5, PM4, PM10, and TSP. The statistical analysis used JMP Pro-16 (SAS Institute Inc., Cary, NC, USA). The PM levels, LMC, and litter depth in each treatment were analyzed using two-way ANOVA, which included treatment rooms as the main effect and each week as a block. The difference between treatment rooms was considered significant at p ≤ 0.05. The means were separated using LSMeans Tukey HSD methods.
3. Results and Discussion
3.1. Litter Moisture Content Data
Litter moisture content plays an important role in PM reduction [13,48] and differs according to the BM moisture content used as a treatment. According to Homidan et al. [49], LMC resulting between locations within the house was found to be highest near drinking areas, resulting in less PM production. Usually, rooms with higher LMC have lower PM levels [13,48] because higher LMC binds PM present in litter and makes them heavier, allowing the particulates to be suppressed and settle down. The results from this study show a statistical difference in LMC taken biweekly (p < 0.01; Figure 3A) and between treatment rooms (p < 0.038; Figure 3B). However, sections (p = 0.637) were not different, which is to be expected since a single treatment was placed in each room section, and there was common airflow in the housing room. In addition, the LMC was lowest in the control room (18.0 ± 2.8%) compared with the SFS (20.0 ± 3.1%), LFS (20.6 ± 2.4%), and AWC (19.7 ± 4.2%) rooms. Similarly, LMC increased (p < 0.01) as the age of birds and litter increased. Therefore, an increased LMC might be due to daily fecal matter (which contains water or moisture) deposition [50]. Thus, the increase in LMC is affected by the increasing age of birds and the treatment used in the research.
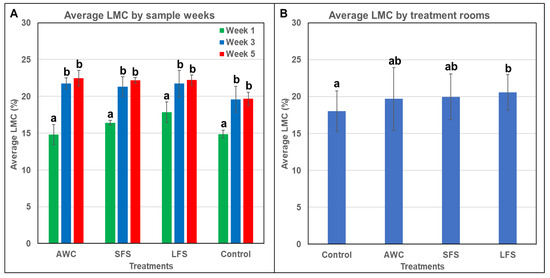
Figure 3.
Percentage change in litter moisture content over different (A) sampling weeks and (B) treatment rooms (n = 3). Different letters above the data bars (standard deviation) represent significant differences at p ≤ 0.05. LMC (litter moisture content); AWC (aspen wood chips); SFS (small flake shavings); LFS (large flake shavings).
3.2. Thermal Environment
The research was conducted in the summer with an outside temperature of an average of 22.8 ± 1.4 °C (73.0 ± 2.6 °F) [51]. Temperature and RH directly affect PM production [11,52]. Increasing the temperature inside a house leads to higher ventilation rates, increasing cooling pad activation. The incoming air carries a significant amount of humidity, causing extreme relative humidity (RH) levels that are absorbed into the litter. Higher RH and lower temperature decrease PM production because moisture present in air binds PM and makes particles heavy enough to settle down. The temperature inside each room was maintained using a controller resulting in the four treatment rooms having similar temperature/ RH values during the test (i.e., 23.2 ± 2.3 °C/65.0 ± 16.1%, 22.8 ± 2.5 °C/66.6 ± 16.0%, 23.0 ± 2.2 °C/65.5 ± 15.8%, and 23.0 ± 2.2 °C/66.3 ± 16.5% in the control, SFS, LFS, and AWC rooms, respectively). RH plays an important role in PM reduction. The higher the RH, the lower the PM level [11,13,53]. Since all treatment rooms have similar temperatures and RH, overall, thermal environment parameters did not affect PM production. However, temperature and RH were hard to control, so differences were found within 6 weeks of hen rearing (Figure 4). There was a high fluctuation in RH within 6 weeks because of the very high temperature outside and humid air inside the housing generated by cooling pads.
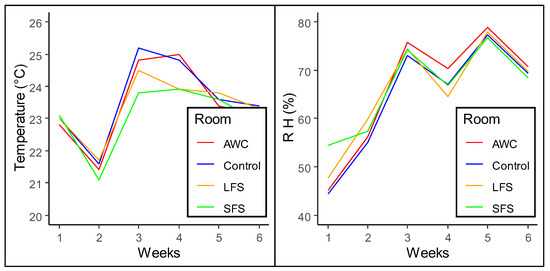
Figure 4.
Temperature and RH variation over 6 weeks of cage-free hen rearing in different treatment rooms. RH represents relative humidity in percentage; AWC—aspen wood chips, LFS—large flake shavings, SFS—small flake shavings, control—without adding any treatment.
3.3. Litter Depth
The litter depth measured did not show any significant difference (p = 0.96; Table 1) when comparing litter depth after topping the BM and at the end of the experiment (over the treatment). Excreta produced while hens were in the aviary system was removed via manure belts and not introduced to the litter, which is the main reason for no significant changes in litter depth. Litter depth was found to be higher where the birds spent the most time dustbathing. According to Moesta et al. [54], birds need thick layers of BM to perform dustbathing; otherwise, dustbathing behavior is impaired with a thin layer of BM. This research also found higher litter depths below the lower tiers than in the open spaces because of a higher incidence of dustbathing behavior.
3.4. Particulate Matter Reduction
Litter is the major source of higher PM concentration in a poultry housing system. Hens raised on bedding or litter floor (an AV or CF floor) have higher PM concentrations than CCs and ECs [7]. Litter in AV houses increases activities like dustbathing, foraging, and locomotion, thus generating higher PM levels of different sizes [6,7,13,23,55,56]. Among the different PM sizes, PM2.5, PM10, and TSP are significantly higher during the daytime [57] because of increased bird activity on the littered floor [13,57]. Using different BMs directly affects PM emissions and helps decrease PM levels [39,44,45]. This research found that the top application of new BM significantly affects PM reduction in different sizes (p < 0.01; Table 2 and Table 3). The reduction in PM might be due to the weight and top area covered by BM, which helps to suppress PM production. Similarly, there was a PM reduction in all treatment rooms during week 3 and week 5, possibly because of higher RH than in other weeks. When RH inside the house increases, it makes PM heavy enough to settle down and thus decreases PM concentrations [13].
Table 2.
Average weekly PM concentrations (mg m−3) in an aviary laying house when litter substrate was top-dressed with different bedding materials.
Table 3.
Overall particulate matter concentration (mg m−3) for each PM size in an aviary laying house when litter substrate was top-dressed with different bedding materials.
3.4.1. PM2.5
The concentration of PM2.5 in the hen house accounted for a 5–13% relatively stable portion of PM10, and PM2.5 has been reported as being influenced by PM10 concentrations [7]. In the current study, as PM10 increased, PM2.5 also increased (Table 2 and Table 3). PM10 increased because of an increase in PM2.5 [58]. The current research found a difference in PM2.5 concentrations between treatment groups (p < 0.01; Table 3) but did not find a significant difference between weeks (p = 0.108; Table 2). The PM2.5 concentration was highest in the control group (0.91 ± 0.23 mg m−3) and smallest in the SFS group (0.58 ± 0.09 mg m−3). No significant difference was found between SFS, AWC (0.60 ± 0.17 mg m−3), or LFS (0.64 ± 0.12 mg m−3; p = 0.95). The PM reductions in SFS, AWC, and LFS were 36.5, 34.6, and 28.9%, respectively (Figure 5). The details on PM2.5 concentrations in various treatments are mentioned in Table 3, and weeks 3–5 had lower indoor PM levels because of increased outdoor and indoor temperatures, which led to higher house ventilation during those three weeks (see temperature information in Figure 5).
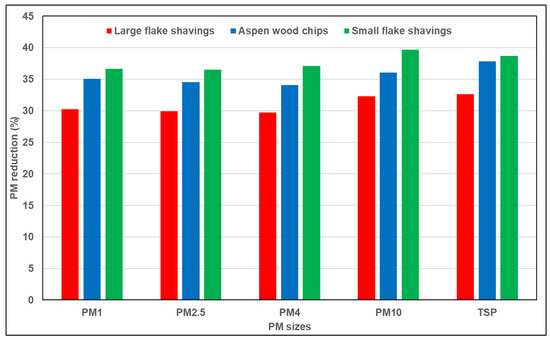
Figure 5.
Percentage reduction in particulate matter concentration of each substrate treatment compared with control treatment (n = 6). PM1 (particulate matter with a diameter ≤ 1 micron); PM2.5 (particulate matter with a diameter ≤ 2.5 microns); PM4 (particulate matter with a diameter ≤ 4 microns); PM10 (particulate matter with a diameter ≤ 10 microns); TSP (total suspended particulate).
3.4.2. PM10
The concentration of PM10 is directly influenced by the hens’ activity, ambient temperature, and the ventilation rate [8,11,59]. PM10 concentrations usually spike (exceeding the upper limit of 20 mg m−3) when lights come on and the flock has access to the littered floor, and the lowest levels occur after the lights turn off [7]. According to [60], PM10 and TSP are usually higher during feeding and ventilation. The current research found a difference in PM10 concentrations between the treatment groups (p < 0.01; Table 3), but there were no differences between weeks (p = 0.113; Table 2). The PM10 concentration was highest in the control group (2.21 ± 0.60 mg m−3) and smallest in the SFS group (1.34 ± 0.22 mg m−3). In addition, we observed no difference (p = 0.94) between SFS, AWC (1.42 ± 0.44 mg m−3), or LFS (1.50 ± 0.29 mg m−3). Thus, PM10 was reduced by top-dressing with the new BM.
3.4.3. TSP
The results indicate a difference in TSP production after introducing new BM (p < 0.01; Table 3). However, TSP was found to show no difference between weeks (p = 0.150; Table 2). Compared with the control group (3.58 ± 1.00 mg m−3), SFS (2.20 ± 0.39 mg m−3), AWC (2.23 ± 0.68 mg m−3), and LFS (2.41 ± 0.46 mg m−3) resulted in higher PM reduction (Figure 5). The TSP reductions due to top-dressing with SFS, AWC, and LFS were 38.7%, 37.9%, and 32.6%, respectively. There was no significant difference in PM reduction found between different bedding treatments.
This study revealed that LMC in the control group was notably lower than in the other treatment groups (p < 0.01), which could have contributed to the elevated PM levels observed in the control group. However, the various treatment groups showed no significant difference in LMC. The effectiveness of PM mitigation through bedding management is influenced by a multitude of factors, including the type and quantity of the BM used, the breaking strength of the BM, and manure management practices [11,42,44,45,48]. Furthermore, the considerably higher levels of PM reduction observed in the treatment groups, except the control group, imply the involvement of additional factors contributing to the enhanced PM reduction. The variability in PM reduction and overall emission levels can be attributed to the specific attributes of the bedding materials, including their capacity to effectively absorb and capture dust particles; their electrostatic properties, which attract and retain dust; and their dense and tightly woven structures acting as barriers. Consequently, the presence of loose litter on the floor may serve as another contributing factor to elevated dust levels, particularly during periods of heightened bird activities.
Among the different treatments employed, it is noteworthy that the cost of AWC was approximately 1.9 times higher per cubic foot compared with SFS and LFS, and AWC may not be as readily accessible as SFS and LFS. Given that AWC, SFS, and LFS demonstrated comparable performance in PM reduction, opting for SFS and LFS would be a more cost-effective choice for producers aiming to mitigate PM levels. Moreover, SFS exhibited a 6–7% greater PM reduction than LFS. Consequently, top-dressing with SFS emerges as a viable alternative for reducing the higher percentage of PM concentration in CF aviary housing.
Although this study did not examine the effect of time change (weeks) on dust levels, insights from previous research on broiler and pullet houses suggest that dust levels vary over time because of factors such as bird growth, increased feed intake, and higher manure generation, resulting in elevated dust and ammonia levels [11,13]. Additionally, bedding material was previously identified as a key factor influencing PM levels in CF houses [23]. Thus, the absence of significant differences between weeks in this study aligns with the understanding that various interrelated factors influence the dynamics of dust levels in such settings.
This study utilized a single portable sensor for PM measurements because of observed differences between newly calibrated sensors. Monitoring each location for 2–5 min instead of 24 h was necessary to prevent sensor damage in the dusty environment. Moreover, the behavioral changes in hens over time were considered, as highlighted by Chai et al. [23], where the highest dust levels in CF houses were observed when birds accessed the litter floor in the morning, with dust levels decreasing after lights off in the evening. These considerations enhance the contextual relevance of the study’s findings and reinforce the complex interplay between bird behavior and indoor dust levels.
3.5. Implications and Future Studies
The findings of this study hold significant implications for poultry producers striving to adopt effective and sustainable methods of mitigating PM emissions and enhancing environmental conditions in poultry housing systems. The research underscores the pivotal role of factors such as litter moisture content, bedding material selection, and environmental variables in shaping PM dynamics. While this study provides valuable insights, certain limitations should be acknowledged. The study’s focus on specific bedding materials and its exclusion of potential contributors like ventilation rates and bird density constrain the breadth of the conclusions. Additionally, reliance on a single portable sensor and the specificity of geographic and seasonal conditions at the study site may impact the broader applicability of the findings.
Future research endeavors could encompass the synergistic effects of bedding materials, ventilation rates, and bird density on PM levels. Employing long-term monitoring with multiple sensors across diverse geographical locations and seasons would bolster the robustness and generalizability of the outcomes. Furthermore, investigating the economic viability of various PM reduction strategies and their potential implications for bird health and welfare would offer practical insights for poultry producers. This study enriches our comprehension of the intricate factors influencing PM reduction in poultry housing systems. The results serve as a valuable compass for formulating effective and feasible strategies to abate PM emissions, elevate environmental quality, and enhance poultry welfare within contemporary production frameworks.
4. Conclusions
In conclusion, the present study demonstrated that the top application of new bedding on old litter is a potential strategy for reducing PM generation in CF houses. Our research has laid a foundation for effective PM reduction practices, with SFS emerging as a cost-efficient and highly effective choice, showcasing a remarkable 36.5% reduction in PM2.5 and a 39.7% reduction in PM10 compared with control groups. Additionally, the treatment rooms showed higher moisture content compared with control rooms with 10% more LMC. Higher moisture content might have helped to reduce PM concentration. This study highlights the potential of the top application of new bedding to reduce PM levels in CF housing, suggesting a practical avenue for PM mitigation. Further research, encompassing varying BM ratios, cost analysis, and real-world testing, is imperative to advance these promising findings for effective PM reduction strategies in commercial CF environments. By advancing our understanding and application of effective PM reduction strategies, we can contribute to improved poultry health and elevated environmental conditions in CF poultry housing systems.
Author Contributions
Conceptualization, L.C.; Methodology, R.B.B. and L.C.; Formal analysis, R.B.B. and A.K.S.; Investigation, R.B.B., P.R. and Y.G.; Resources, P.R., D.K., C.W.R., W.K.K., D.R.J. and L.C.; Writing—original draft, R.B.B. All authors have read and agreed to the published version of the manuscript.
Funding
This project was sponsored by the Egg Industry Center; USDA-NIFA (2023-68008-39853); the UGA CAES Dean’s Research Fund; the UGA COVID Research Recovery Fund; the Georgia Research Alliance Venture Fund; and the USDA-NIFA Hatch Project (GEO00895): Future Challenges in Animal Production Systems: Seeking Solutions through Focused Facilitation, and FFAR (Purdue grants).
Data Availability Statement
Data will be available for reasonable request.
Acknowledgments
We appreciate the statistical analysis assistance from Qian Xiao at the Department of Statistics at UGA and farm management assistance from Cara Robison and Angelo Napolitano at the Michigan State University poultry research facility.
Conflicts of Interest
The authors declare no conflict of interest.
References
- USDA. Poultry Production Systems and Well-being: Sustainability for Tomorrow—University of California, Davis. Available online: https://portal.nifa.usda.gov/web/crisprojectpages/1013484-poultry-production-systems-and-well-being-sustainability-for-tomorrow.html (accessed on 7 August 2023).
- United Egg Producers. UEP Facts & Stats. 2022. Available online: https://unitedegg.com/facts-stats/ (accessed on 22 August 2023).
- Xin, H. Environmental challenges and opportunities with cage-free hen housing systems. In Proceedings of the XXV World’s Poultry Congress, Beijing, China, 5–9 September 2016; pp. 5–9. [Google Scholar]
- Gates, R.S.; Ramirez, B.; Li, G.; Xiong, Y.; Burns, R.T. Evaluating Draft EPA Emissions Models for Laying Hen Facilities. United Eggs 2022, 1–44. Available online: https://unitedegg.com/wp-content/uploads/2022/06/EIC-Evaluation-of-Draft-EPA-Emissions-Models-for-Layers-06-09-2022.pdf (accessed on 8 July 2022).
- Shanker, D.; Pollard, A. Many Hens Are Still Stuck in Cages Despite Cage-Free Egg Pledges, Group Says. Bloomberg 2021. Available online: https://www.bloomberg.com/news/articles/2021-11-17/many-hens-stuck-in-cages-despite-company-pledges-group-says (accessed on 8 July 2023).
- Shepherd, T.A.; Zhao, Y.; Li, H.; Stinn, J.P.; Hayes, M.D.; Xin, H. Environmental assessment of three egg production systems—Part II. Ammonia, greenhouse gas, and particulate matter emissions. Poult. Sci. 2015, 94, 534–543. [Google Scholar] [CrossRef] [PubMed]
- Zhao, Y.; Shepherd, T.A.; Li, H.; Xin, H. Environmental assessment of three egg production systems–Part I: Monitoring system and indoor air quality. Poult. Sci. 2015, 94, 518–533. [Google Scholar] [CrossRef]
- Knight, R.M.; Tong, X.; Liu, Z.; Hong, S.; Zhao, L. Spatial and seasonal variations of PM concentration and size distribution in manure-belt poultry layer houses. Trans. ASABE 2019, 62, 415–427. [Google Scholar] [CrossRef]
- Madelin, T.M.; Wathes, C. Air hygiene in a broiler house: Comparison of deep litter with raised netting floors. Br. Poult. Sci. 1989, 30, 23–37. [Google Scholar] [CrossRef] [PubMed]
- Hayes, M.; Xin, H.; Li, H.; Shepherd, T.; Zhao, Y.; Stinn, J. Ammonia, greenhouse gas, and particulate matter emissions of aviary layer houses in the Midwestern US. Trans. ASABE 2013, 56, 1921–1932. [Google Scholar] [CrossRef][Green Version]
- Bist, R.B.; Chai, L. Advanced Strategies for Mitigating Particulate Matter Generations in Poultry Houses. Appl. Sci. 2022, 12, 11323. [Google Scholar] [CrossRef]
- Bist, R.B.; Subedi, S.; Chai, L.; Yang, X. Ammonia emissions, impacts, and mitigation strategies for poultry production: A critical review. J. Environ. Manag. 2023, 328, 116919. [Google Scholar] [CrossRef]
- Bist, R.B.; Yang, X.; Subedi, S.; Sharma, M.K.; Singh, A.K.; Ritz, C.W.; Kim, W.K.; Chai, L. Temporal Variations of Air Quality in Cage-Free Experimental Pullet Houses. Poultry 2023, 2, 320–333. [Google Scholar] [CrossRef]
- Bauer, S.E.; Tsigaridis, K.; Miller, R. Significant atmospheric aerosol pollution caused by world food cultivation. Geophys. Res. Lett. 2016, 43, 5394–5400. [Google Scholar] [CrossRef]
- Knight, R.M.; Tong, X.; Zhao, L.; Manuzon, R.B.; Darr, M.J.; Heber, A.J.; Ni, J.-Q. Particulate matter concentrations and emission rates at two retrofitted manure-belt layer houses. Trans. ASABE 2021, 64, 829–841. [Google Scholar] [CrossRef]
- Harry, E. Air pollution in farm buildings and methods of control: A review. Avian Pathol. 1978, 7, 441–454. [Google Scholar] [CrossRef] [PubMed]
- Qi, R.; Manbeck, H.; Maghirang, R. Dust net generation rate in a poultry layer house. Trans. ASAE 1992, 35, 1639–1645. [Google Scholar] [CrossRef]
- Wicklin, G.; Czarick, M. Particulate emissions from poultry housing. In Proceedings of the ASAE Annual International Meeting, Minneapolis, MN, USA, 10–14 August 1997; pp. 10–14. [Google Scholar]
- Cambra-López, M.; Hermosilla, T.; Lai, H.T.; Aarnink, A.J.A.; Ogink, N. Particulate matter emitted from poultry and pig houses: Source identification and quantification. Trans. ASABE 2011, 54, 629–642. [Google Scholar] [CrossRef]
- Gustafsson, G.; Von Wachenfelt, E. Airborne dust control measures for floor housing system for laying hens. Agric. Eng. Int. CIGR J. 2006, VIII, 1–13. [Google Scholar]
- EPA. Health and Environmental Effects of Particulate Matter (PM). Available online: https://www.epa.gov/pm-pollution/health-and-environmental-effects-particulate-matter-pm (accessed on 15 June 2023).
- Bonifacio, H.F.; Maghirang, R.G.; Trabue, S.L.; McConnell, L.L.; Prueger, J.H.; Bonifacio, E.R. TSP, PM10, and PM2.5 emissions from a beef cattle feedlot using the flux-gradient technique. Atmos. Environ. 2015, 101, 49–57. [Google Scholar] [CrossRef]
- Chai, L.; Xin, H.; Wang, Y.; Oliveira, J.; Wang, K.; Zhao, Y. Mitigating Particulate Matter Generation in a Commercial Cage-Free Hen House. Trans. ASABE 2019, 62, 877–886. [Google Scholar] [CrossRef]
- Schwarze, P.; Øvrevik, J.; Låg, M.; Refsnes, M.; Nafstad, P.; Hetland, R.; Dybing, E. Particulate matter properties and health effects: Consistency of epidemiological and toxicological studies. Hum. Exp. Toxicol. 2006, 25, 559–579. [Google Scholar] [CrossRef]
- Roque, K.; Shin, K.-M.; Jo, J.-H.; Kim, H.-A.; Heo, Y. Relationship between chicken cellular immunity and endotoxin levels in dust from chicken housing environments. J. Vet. Sci. 2015, 16, 173–177. [Google Scholar] [CrossRef]
- Wang, W.; Wideman, R., Jr.; Chapman, M.; Bersi, T.; Erf, G. Effect of intravenous endotoxin on blood cell profiles of broilers housed in cages and floor litter environments. Poult. Sci. 2003, 82, 1886–1897. [Google Scholar] [CrossRef]
- Monira, K.; Islam, M.; Alam, M.; Wahid, M. Effect of litter materials on broiler performance and evaluation of manureal value of used litter in late autumn. Asian-Australas. J. Anim. Sci. 2003, 16, 555–557. [Google Scholar] [CrossRef]
- Guarino, M.; Caroli, A.; Navarotto, P. Dust concentration and mortality distribution in an enclosed laying house. Trans. ASAE 1999, 42, 1127. [Google Scholar] [CrossRef]
- Radon, K.; Weber, C.; Iversen, M.; Danuser, B.; Pedersen, S.; Nowak, D. Exposure assessment and lung function in pig and poultry farmers. Occup. Environ. Med. 2001, 58, 405–410. [Google Scholar] [CrossRef] [PubMed]
- Viegas, S.; Faísca, V.M.; Dias, H.; Clérigo, A.; Carolino, E.; Viegas, C. Occupational exposure to poultry dust and effects on the respiratory system in workers. J. Toxicol. Environ. Health A 2013, 76, 230–239. [Google Scholar] [CrossRef]
- Aarnink, A.; van Harn, J.; Van Hattum, T.; Zhao, Y.; Ogink, N. Dust reduction in broiler houses by spraying rapeseed oil. Trans. ASABE 2011, 54, 1479–1489. [Google Scholar] [CrossRef]
- Almuhanna, E.A. Dust Control in Livestock Buildings with Electrostatically-Charged Water Spray; Kansas State University: Manhattan, KS, USA, 2007; ISBN 1-109-97127-3. [Google Scholar]
- Lim, T.T.; Heber, A.J.; Ni, J.; Zhao, L.; Hanni, S.H. Effects of Electrostatic Space Charge System on Particulate Matter Emission from High-Rise Layer Barn; American Society of Agricultural and Biological Engineers: St. Joseph, MI, USA, 2008; p. 1. [Google Scholar] [CrossRef]
- Mitchell, B.W.; Baumgartner, J.W. Electrostatic Space Charge System for reducing dust in poultry production houses and the hatchery. In Proceedings of the International Conference How to Improve Air Quality, Citeseer; 2007; pp. 23–24. Available online: https://citeseerx.ist.psu.edu/document?repid=rep1&type=pdf&doi=b5467e69bce33c3b5691d6a4a4a8d065ed1a35f2 (accessed on 22 June 2022).
- Ritz, C.; Mitchell, B.; Fairchild, B.; Czarick III, M.; Worley, J. Improving in-house air quality in broiler production facilities using an electrostatic space charge system. J. Appl. Poult. Res. 2006, 15, 333–340. [Google Scholar] [CrossRef]
- Chai, L.; Ni, J.-Q.; Diehl, C.A.; Kilic, I.; Heber, A.; Chen, Y.; Cortus, E.; Bogan, B.; Lim, T.; Ramirez-Dorronsoro, J.-C. Ventilation rates in large commercial layer hen houses with two-year continuous monitoring. Br. Poult. Sci. 2012, 53, 19–31. [Google Scholar] [CrossRef] [PubMed]
- Redwine, J.S.; Lacey, R.E.; Mukhtar, S.; Carey, J. Concentration and emissions of ammonia and particulate matter in tunnel–ventilated broiler houses under summer conditions in Texas. Trans. ASAE 2002, 45, 1101. [Google Scholar] [CrossRef]
- Anderson, K.; Moore Jr, P.A.; Martin, J.; Ashworth, A.J. Effect of a new manure amendment on ammonia emissions from poultry litter. Atmosphere 2020, 11, 257. [Google Scholar] [CrossRef]
- Van Harn, J.; Aarnink, A.; Mosquera, J.; Van Riel, J.; Ogink, N. Effect of bedding material on dust and ammonia emission from broiler houses. Trans. ASABE 2012, 55, 219–226. [Google Scholar] [CrossRef]
- EU Council Directive. 1999/74/EC of 19 July 1999 Laying down Minimum Standards for the Protection of Laying Hens. Available online: https://www.legislation.gov.uk/eudr/1999/74/contents (accessed on 30 September 2022).
- Munir, M.; Belloncle, C.; Irle, M.; Federighi, M. Wood-based litter in poultry production: A review. Worlds Poult. Sci. J. 2019, 75, 5–16. [Google Scholar] [CrossRef]
- Aarnink, A.; Ellen, H. Processes and Factors Affecting Dust Emissions from Livestock Production. Improv. Air Qual. 2007. Available online: https://www.researchgate.net/profile/Andre-Aarnink/publication/40098613_Processes_and_factors_affecting_dust_emissions_from_livestock_production/links/55adff7508aed9b7dcdb09b3/Processes-and-factors-affecting-dust-emissions-from-livestock-production.pdf (accessed on 25 May 2022).
- Li, H.; Xin, H.; Burns, R.T.; Hoff, S.J.; Harmon, J.D.; Jacobson, L.D.; Noll, S.L. Effects of bird activity, ventilation rate and humidity on PM10 concentration and emission rate of a Turkey barn. In Livestock Environment VIII, 31 August–4 September 2008, Iguassu Falls, Brazil (p. 16); American Society of Agricultural and Biological Engineers: St. Joseph, MI, USA, 2009. [Google Scholar] [CrossRef]
- Gustafsson, G.; Von Wachenfelt, E. Reducing airborne dust in a loose-housing system for laying hens. J. Agric. Sci. Technol. A 2012, 2, 350. [Google Scholar]
- Farghly, M.; Mahrose, K.M.; Cooper, R.; Metwally, K.A.; Abougabal, M.S.; El-Ratel, I. Use of available crop by-products as alternative bedding materials to wheat straw for rearing broilers. Animal 2021, 15, 100260. [Google Scholar] [CrossRef] [PubMed]
- Ali, A.; Campbell, D.; Karcher, D.; Siegford, J. Nighttime roosting substrate type and height among 4 strains of laying hens in an aviary system. Poult. Sci. 2019, 98, 1935–1946. [Google Scholar] [CrossRef] [PubMed]
- Visser, M.; Fairchild, B.; Czarick, M.; Lacy, M.; Worley, J.; Thompson, S.; Kastner, J.; Ritz, C.; Naeher, L. Fine particle measurements inside and outside tunnel-ventilated broiler houses. J. Appl. Poult. Res. 2006, 15, 394–405. [Google Scholar] [CrossRef]
- Ogink, N.; van Harn, J.; van Emous, R.; Ellen, H. Top Layer Humidification of Bedding Material of Laying Hen Houses to Mitigate Dust Emissions: Effects of Water Spraying on Dust, Ammonia and Odor Emissions; American Society of Agricultural and Biological Engineers: St. Joseph, MI, USA, 2012; p. 3. [Google Scholar]
- Homidan, A.A.; Robertson, J.F.; Petchey, A.M. Review of the effect of ammonia and dust concentrations on broiler performance. Worlds Poult. Sci. J. 2003, 59, 340–349. [Google Scholar] [CrossRef]
- Benabdeljelil, K.; Ayachi, A. Evaluation of alternative litter materials for poultry. J. Appl. Poult. Res. 1996, 5, 203–209. [Google Scholar] [CrossRef]
- US Department of Commerce. Climate. Available online: https://www.weather.gov/wrh/Climate?wfo=dtx (accessed on 7 August 2023).
- Tang, Q.; Huang, K.; Liu, J.; Shen, D.; Dai, P.; Li, Y.; Li, C. Seasonal variations of microbial assemblage in fine particulate matter from a nursery pig house. Sci. Total Environ. 2020, 708, 134921. [Google Scholar] [CrossRef]
- Javed, W.; Guo, B. Effect of relative humidity on dust removal performance of electrodynamic dust shield. J. Electrost. 2020, 105, 103434. [Google Scholar] [CrossRef]
- Moesta, A.; Knierim, U.; Briese, A.; Hartung, J. The effect of litter condition and depth on the suitability of wood shavings for dustbathing behaviour. Appl. Anim. Behav. Sci. 2008, 115, 160–170. [Google Scholar] [CrossRef]
- David, B.; Mejdell, C.; Michel, V.; Lund, V.; Oppermann Moe, R. Air quality in alternative housing systems may have an impact on laying hen welfare. Part II—Ammonia. Animals 2015, 5, 886–896. [Google Scholar] [CrossRef]
- Le Bouquin, S.; Huneau-Salaün, A.; Huonnic, D.; Balaine, L.; Martin, S.; Michel, V. Aerial dust concentration in cage-housed, floor-housed, and aviary facilities for laying hens. Poult. Sci. 2013, 92, 2827–2833. [Google Scholar] [CrossRef] [PubMed]
- Lim, T.-T.; Heber, A.J.; Ni, J.-Q.; Gallien, J.; Xin, H. Air Quality Measurements at a Laying Hen House: Particulate Matter Concentrations and Emissions; American Society of Agricultural and Biological Engineers: St. Joseph, MI, USA, 2003; p. 249. [Google Scholar] [CrossRef]
- Houthuijs, D.; Breugelmans, O.; Hoek, G.; Vaskövi, E.; Miháliková, E.; Pastuszka, J.S.; Jirik, V.; Sachelarescu, S.; Lolova, D.; Meliefste, K. PM10 and PM2.5 concentrations in Central and Eastern Europe: Results from the Cesar study. Atmos. Environ. 2001, 35, 2757–2771. [Google Scholar] [CrossRef]
- Lin, X.-J.; Cortus, E.; Zhang, R.; Jiang, S.; Heber, A. Ammonia, hydrogen sulfide, carbon dioxide and particulate matter emissions from California high-rise layer houses. Atmos. Environ. 2012, 46, 81–91. [Google Scholar] [CrossRef]
- Shen, D.; Li, C. Distribution of Particulate Matter and Ammonia in a Mechanically Ventilated Layer House. Anim. Environ. Welf. 2017, 10–16. [Google Scholar]
Disclaimer/Publisher’s Note: The statements, opinions and data contained in all publications are solely those of the individual author(s) and contributor(s) and not of MDPI and/or the editor(s). MDPI and/or the editor(s) disclaim responsibility for any injury to people or property resulting from any ideas, methods, instructions or products referred to in the content. |
© 2023 by the authors. Licensee MDPI, Basel, Switzerland. This article is an open access article distributed under the terms and conditions of the Creative Commons Attribution (CC BY) license (https://creativecommons.org/licenses/by/4.0/).