Abstract
Dynamic performance of a GNSS (Global Navigation Satellite System) positioning device (PD) is of interest to end users of satellite-based auto-guidance systems (AGS) for agricultural vehicles, especially when a low-cost PD is used. This study evaluated the overall dynamic performance in an agricultural environment for the PDs paired with multi-frequency multi-GNSS receivers and antennae, including low-cost and legacy ones. The dynamic performance was evaluated in terms of reacquisition time, heading accuracy, positioning accuracy, and guidance accuracy at short and medium baselines of RTK (Real Time Kinematic) positioning. The dynamic testing was conducted using an instrumented vehicle with test PDs to perform the test runs on agricultural fields and asphalt roads. The test results proved that the dynamic performance of the low-cost PD was not inferior to that of the legacy one and accurate enough to be used as a positioning sensor for the auto guidance of agricultural vehicles. It could reacquire an RTK-fix solution within 4 s after a 3-s GNSS signal blockage and achieve sub-degree-level accuracy of the heading measurement for agricultural vehicles traveling in an open-sky environment. Furthermore, the low-cost PD could obtain a 4-cm-level dynamic RTK positioning accuracy and agricultural vehicle guidance accuracy of less than 3 cm. The techniques and test results from this study provided additional guidelines for determining the overall dynamic performance of the GNSS PDs and AGSs on an agricultural tractor.
1. Introduction
The automation of agricultural field operations based on GNSS technology requires centimeter-level positioning accuracy of the PD due to the need for production cost reduction and accurate alignments of machines and equipment with crop rows. This accuracy must be maintained in every pass and subsequent operations when planting, fertilizing, weeding, pest controlling, and harvesting to minimize negative yield impact and grain loss as well as to reduce environmental risks of nutrient and chemical runoff. Although the adoption of the RTK positioning technique has enabled high-accuracy automation of field operations using the AGS, there have been concerns by end users about the accuracy of different systems on the market. This is because most of the GNSS PD manufacturers report the accuracy of their products using stationary test data; meanwhile, the AGS is used under dynamic conditions when conducting mobile field operations.
Consequently, many attempts have been made to evaluate the dynamic performance of both geodetic grade and low-cost GNSS PDs. The evaluations were made by performing on-vehicle testing [,,] or fixture testing [,,], which involves instrumenting the test PDs on a carrier vehicle or a mechanical fixture such as a rotational device or the rail system, respectively, and driving them through predefined paths. These proposed testing methods for evaluating the dynamic performance of satellite-based positioning devices were standardized by Stombaugh et al. [] to develop the ISO 12188-1 standard []. Other efforts were made to evaluate the accuracy of different AGSs on straight lines by driving a tractor instrumented with the device on agricultural fields [] and a test track [] while using an RTK receiver and a visual sensor, respectively, as the ground truth tracking sensor. The ISO 12118-2 standard [] for testing the AGS during straight and level travel was developed based on these studies. Some attempts after ISO 12118 were also made to improve the method for testing the GNSS PDs [] using a total station as the reference tracking sensor to determine the ground truth of the test GNSS receiver and include the direction error in addition to the position and speed errors measured by the test PDs fixed on a turntable []. Furthermore, autonomous tractors were used to demonstrate the high tracking accuracy of the AGS on a straight line [] and to perform the guidance accuracy testing for providing details on the relative cross-track error calculation, which is not described in ISO 12118-2 [].
However, there is no existing literature to date that reports both the dynamic positioning accuracy and stability of multi-frequency, multi-GNSS PDs, especially in the case of low-cost ones. In addition, it is necessary to evaluate the dynamic performance of the PDs while they are traveling within agricultural fields and on roads with tree canopy obstruction as well as the guidance accuracy of the AGSs during the real field operations performed by an autonomous agricultural vehicle. Therefore, the aim of this study was to perform the overall dynamic evaluation of a typical low-cost multi-frequency multi-GNSS device for positioning and navigation in agriculture. Dynamic evaluation metrics were the RTK-fixed reacquisition time after a loss of GNSS signals (RTK-TTRF), the RTK-fix availability, the RTK positioning accuracy, including the vehicle heading and position, and the GNSS-based vehicle guidance accuracy. The evaluation for different multi-frequency multi-GNSS PDs including the low-cost PDs paired from ZED-F9P receiver (u-blox) and low-cost antennae (ANN-MB-00, u-blox and JCA228, Zhejiang JC) and the legacy PDs was conducted, partly in accordance with the ISO 12188 standard to compare their dynamic positioning accuracy and stability and verify the adaptability of the low-cost PD to the AGS of agricultural vehicles. The dynamic testing, including the horizontal positioning tests and the GNSS signal reacquisition tests, was conducted within and around agricultural fields to determine the dynamic positioning accuracy along a straight segment, U-turn segment, and after signal loss. The reacquisition time measurement method, which is not provided in detail by ISO 12118-1, was described in this study. In addition, a moving base application (MBA), as summarized in the ZED-F9P Application note [], was conducted with a set of two low-cost PDs to confirm their ability to determine the heading angle of a moving object, which is a required parameter for vehicle navigation. Finally, the test PDs were used as a positioning sensor in an AGS of an autonomous tractor to carry out automatic soil tillage and direct soybean seeding. Performance was evaluated to determine the lateral deviation of the representative vehicle point (RVP) from the desired path. This study provided some additional test techniques when using an autonomous agricultural tractor for the overall dynamic performance evaluation of the GNSS-based auto-guidance system.
2. Materials and Methods
2.1. Test Positioning Devices
The main specification of the receivers and antennae used in this study are reported in Table 1. More details about the test devices were reported in the previous publication of the author []. The low-cost antennae ANN-MB-00 and JCA228 were paired with a u-blox ZED-F9P receiver for the MBA, and the dynamic measurements of RTK time to re-fix (TTRF) and RTK positioning accuracy, respectively. The mid-range PD P326/A52 was used for comparing the dynamic RTK positioning accuracy and guidance accuracy to the low-cost PD ZED-F9P/JCA228. The high-end PD A325 was used as the tracking sensor to determine the actual travel course of the test PDs or of the RVP.

Table 1.
Main specifications and settings of GNSS receivers used in the dynamic evaluation.
Furthermore, a Hemisphere compass V113 used in the GNSS AGS of the carrier vehicle was used as the true heading of the test vehicle for evaluating the heading output of the low-cost PDs during the MBA. The errors included within the RTK positionings of A325 and V113 were omitted in the dynamic testing and all navigation data recorded were assumed to be the ground truths. In addition to the high-end PD of SPS855/Zephyr2 used for the local fixed base station (FBS), another SPS855/Zephyr2 instrumented on the carrier vehicle as a positioning sensor of the legacy AGS. GNSS data for measuring the evaluation metrics were logged at the rate of 10 Hz facilitated by the test PDs in accordance with the NMEA (National Marine Electronics Association) 0183 standards and u-blox standards and included the date, time, position, elevation, geoidal separation, heading, speed, number of satellites, correction status, and satellite constellation configuration.
2.2. Carrier and Instrumentation of the Test PDs
An autonomous tractor developed by the Institute of Agricultural Machinery, Japan [], was used as the carrier vehicle to test PDs during dynamic testing. Since the tractor is used with a three-point hitch-mounted implement, a point on the ground directly between the rear wheels of the tractor was defined as the RVP to represent the location of the carrier vehicle, which was used to automatically guide the autonomous tractor when operating in automatic steering mode.
The antennae of test PDs were rigidly mounted on the cabin roof of the carrier vehicle (Figure 1) to record GNSS data for calculating the evaluation metrics as well as information about conditions of dynamic testing, including the date and time for each test run, number of used satellites in view with the corresponding horizontal position, and an indication of any phenomena that may reduce the quality of GNSS performance, such as buildings or tree rows around the test courses. The two ANN-MB-00 antennae were instrumented with two baselines of 20.0 cm and 92.5 cm during the MBA to determine the heading of the carrier vehicle.
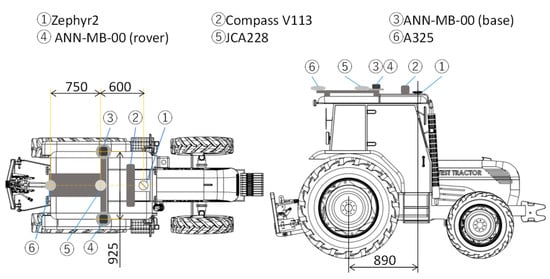
Figure 1.
Outline of GNSS antennae mounted on the carrier vehicle.
2.3. Testing Courses
The test site for the dynamic testing was the experimental agricultural fields of NARO (Figure 2). The test travel courses were designed within the fields and on the asphalt road around the fields for the measurements of the dynamic RTK-TTRF and the vehicle heading, while only travel courses within the agricultural fields were planned for evaluating the accuracy of RTK positioning and the performance of the GNSS-based AGS (Figure 2 and Figure 3). Some segments of the asphalt course, along with roadside tree lines and buildings, which are a typical headland situation of agricultural fields, were used to examine their effects on the RTK-TTRF and the heading accuracy of the low-cost PDs.
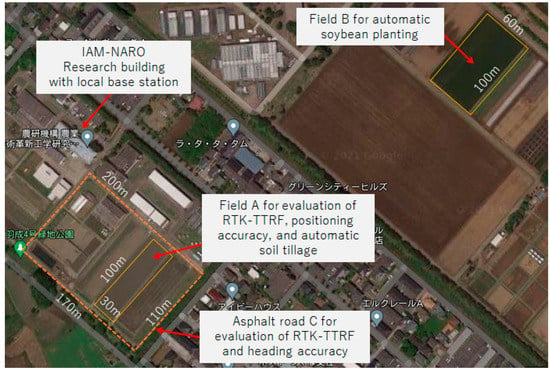
Figure 2.
Testing site for dynamic evaluation of GNSS devices.
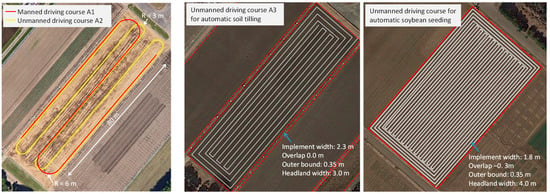
Figure 3.
Manned and unmanned driving courses within agricultural fields.
All the test courses were level and repeatable routes of travel, including 3 or more straight segments, which were at least 80 m long and were oriented approximately 41° or 49° from true north. In the case of test courses within agricultural fields, the straight segments were directly connected at either end of one or more U-turn segments, which traversed 180° at a constant radius of turn between 0.9 m and 6 m. For the autonomous driving courses, the test path was automatically planned by the autonomous control system of the carrier vehicle based on the requirement of the performance evaluation at the headland U-turn, the working width of the rotary tiller (2.4 m) and the soybean seeder (1.5 m), the overlap between two adjacent passes of the tractor, the mounting dimension between the implement and the tractor, and the location of the field entrance.
The speed of the autonomous tractor when performing automatic tilling and seeding was set following the speed requirement of each field task. The experimental settings for different evaluation metrics are shown in Table 2, which include different RTK correction sources, driving modes, test courses, and traveling speeds. The dynamic RTK positionings were performed with two RTCM correction services provided by the FBS at a short baseline (SBL) within 500 m and the real reference system (RRS) at the medium baseline (MBL) of 9 km. The RTK correction for A325 was provided only by FBS to obtain the most accurate positioning performance of the tracking sensor.

Table 2.
Experimental settings for evaluating dynamic performance of the test PDs.
Each test run was replicated three times in the same location along the test courses A1, A2, and C. In the case of the soil tillage and soybean seeding conducted at the test courses A3 and B, respectively, the field operations were automatically completed along the predefined target paths only once.
2.4. Measurement of Dynamic RTK-TTRF
RTK-TTRF of the low-cost PD ZED-F9P/JCA228 in motion was measured by simulating GNSS signal loss on the road with one side of tree rows or high buildings and at the edge of agricultural fields with tree windbreaks. A signal loss of the test PD was simulated by using a radio frequency relay (ARD10012, Panasonic) to disconnect/connect the signal cable between the test antennae and receivers. The RTK-TTRF measurements after a 3-s GNSS signal loss on the test courses C and A1 were conducted at manual driving speeds of approximately 2.0 m/s, respectively (Table 2). The method to derive the RTK-TTRF of GNSS PDs is described in detail by Nguyen et al. []. Besides, the dynamic RTK-TTRF of the test PD at the field headland was measured at an autonomous driving speed of approximately 0.4 m/s following test course A2. The signal loss that occurred due to the tree windbreaks was simulated during the entire 180° U-turn segments of the test course A2 by disconnecting the signal cable for approximately 24 s.
The test runs on all travel courses for the RTK-TTRF measurements were carried out with both short and medium baseline corrections provided by FBS and RRS, respectively. Each test run for the same measurement conditions was replicated three times and completed within a 30-min period. The dynamic RTK-TTRF was calculated by subtracting the time when the test PDs started to transmit the first RTK navigation record after the GNSS signal loss from the time at which signals were removed from the test receiver and the total time of signal loss, which was 3 and 24 s for C and A1 courses, and A2 courses, respectively. The acquisition timeout was 15 s to determine the number of timeouts in all the RTK-TTRF measurements.
2.5. Measurement of Heading Accuracy of the Low-Cost PD
The heading of the carrier vehicle is the horizontally projected direction of travel measured clockwise from true north as defined by NMEA 0183. In dynamic testing, the heading was measured by the MBA with ZED-F9P/ANN-MB-00 units and was compared with the true heading obtained by the compass V113 of the legacy AGS. The heading error was calculated separately for each straight segment. The heading measurements on the test courses C were conducted at autonomous driving speeds of approximately 1.0 m/s (Table 2). The heading of the carrier vehicle was measured by the MBA with two baseline lengths of 20.0 cm and 92.5 cm, which may be suitable for the heading determination of aerial vehicles and ground vehicles, respectively.
In the MBA, the heading output was provided by the ZED-F9P receiver in the UBX-NAV-RELPOSNED message, which provides the RTK heading and distance between the two antennae ANN-MB-00 of the base and rover receivers. Since the baseline of these antennae was perpendicular to the centerline of the carrier vehicle and the rover antenna was mounted on the right side of the vehicle, a heading bias of −90° was added to the output of the MBA, which was logged by a custom application built in Python. The accuracy of the vehicle heading measured by the low-cost PDs was represented by the mean plus the standard deviation of heading error of all valid UBX-NAV-RELPOSNED messages output by the MBA.
2.6. Measurement of RTK-Fix Availability and Dynamic RTK Positioning Accuracy
A GNSS quality indicator for position fix in the logged GGA message was used to compute RTK-fix availability, which is the percentage of the total observation time that a test receiver spent in the RTK fixed integer. The horizontal positioning accuracy of the low-cost and the mid-range PDs was calculated from the off-track error (OTE) in accordance with ISO 12188-1 (Figure 4). In the manual driving course A1, the actual travel course of the tested PDs was calculated from the reference navigation data output by A325 (positioning) and the compass V133 (heading), and the horizontal distance between A325 and the antenna of each test PD (Figure 4a). In the autonomous driving course A2, the RVP of the carrier vehicle was used as the navigation point to guide the vehicle following the pre-determined paths using the legacy AGS. Therefore, the actual travel course of the RVP was not the planned path but was calculated from the reference navigation data of A325 and V113 and the horizontal distance of A325 to the RVP (Figure 4b) to exclude the navigation errors caused by the legacy AGS, the path tracking algorithm, the kinematics of the carrier vehicle, and the field conditions. The horizontal positioning output of the test PDs on course A2 was projected to the RVP using heading data of V113 and the horizontal distance of the test antennae to the RVP to calculate the travel courses of the test PDs. The actual travel course of the RVP in each test run was synchronized with the projected travel course to calculate the OTE.
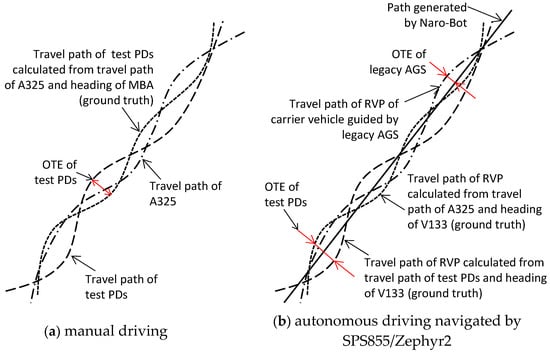
Figure 4.
Definition of the OTE of the test PDs in different driving modes.
The horizontal positioning accuracy of the test PDs was represented by cross-track accuracy (XTA), which is the square root of two times the mean plus the standard deviation of OTEs of all navigation data that fall along the centermost of the 50-m portion of the straight segments of the travel courses. The U-turn accuracy (UTA), which is the dynamic performance determined from OTEs occurring during the traverse of a 180° turn, was represented by the square root of two times the mean plus the standard deviation of all OTEs that occur along the U-turn segments and the first 20 m of the straight segment following the turns (ISO, 2010).
2.7. Measurement of Auto-Guidance Accuracy
The main performance criterion for an AGS is the lateral deviation of a representative point on the vehicle from a desired trajectory for that point (cross-track error, XTE). This performance criterion integrates the uncertainties associated with the performance of all components of the vehicle guidance system, including positioning devices, automated steering components, and vehicle mechanisms and dynamics (ISO, 2012). The dynamic testing, which was conducted while performing soil tillage and direct soybean seeding on straight paths over a level surface of agricultural fields (test courses A3 and B), focused on the steady-state tracking performance of the AGSs combined from the compass V113 and the low-cost and mid-range PDs.
The method for determining the XTE of the test PDs for different RTK corrections during the evaluation of the automatic guidance accuracy is shown in Figure 5a. Since the test PDs navigated the RVP of the autonomous tractor following the pre-planned paths (desired trajectory) and the actual travel path of the RVP was projected from the travel path of A325, the XTE of the test PDs was the lateral deviation between these two travel paths. Furthermore, the seeding accuracy was also verified by measuring the distance between soybean rows of two adjacent seeding paths after the emergence of young seedlings (Figure 5b).
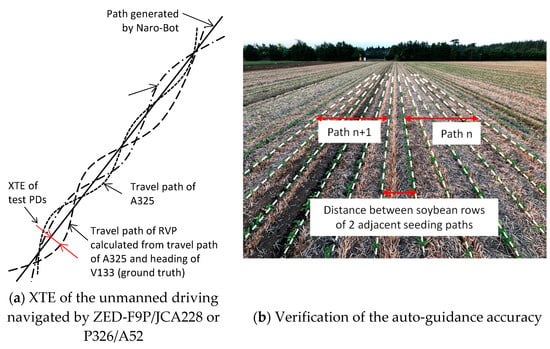
Figure 5.
Methods for determining the auto-guidance accuracy of the test PDs during automatic soil tilling and seeding.
3. Results and Discussion
3.1. Results of Dynamic RTK-TTRF Measurements
The RTK-TTRF of the low-cost PD subjected to the periodical GNSS signal blockage was measured in three scenarios, including the traveling of the carrier vehicle on the C course with side tree canopies and buildings, and the A1 and A2 courses with open sky within the paddy field A. Figure 6 shows the trajectories of the carrier vehicle during the measurement of the RTK-TTRF on the different test courses. While the portions of the trajectories with white dots indicated the RTK positionings of the test PDs, the blue line portions indicated the positioning of the test PD after the GNSS blockage was made 3 s and 24 s for the test course C and A1, and the test course A2, respectively.
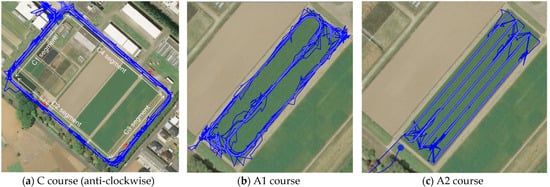
Figure 6.
Trajectories of the carrier vehicle during the measurements of RTK-TTRF. Red arrows indicate traveling direction of the test carrier, while blue lines with white dots indicate the trajectory of the test carrier.
Figure 7 shows the variation in the number of satellites in view when the carrier vehicle in one test run on courses C and A1. As expected, the canopies of the tree lines on the C2 and C3 segments of the C course significantly reduced the number of the satellites in view from approximately 17 satellites to less than 10. Meanwhile, the number of satellites observed by the PD traveling on the test courses within the open sky field A was stable, varying between 16 and 17 satellites. Furthermore, the measured values of the average GNSS signal strength, which were 42.6 ± 9.0 dB-Hz, 45.8 ± 3.6 dB-Hz, and 45.7 ± 4.0 dB-Hz for the C course, A1 course, and A2 course, respectively, also indicated the blockage effect of the tree canopies on the GNSS signals.
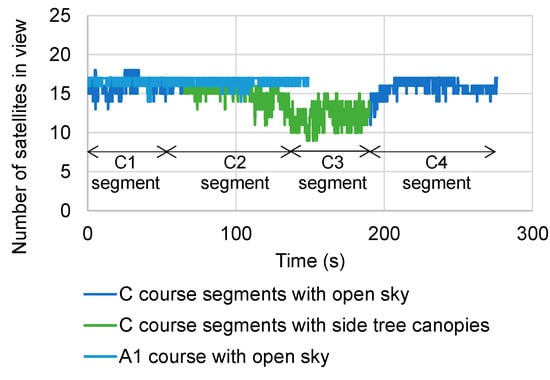
Figure 7.
An example of the variation of the number of satellites in view during the measurements of RTK-TTRF.
The measurement results of the dynamic RTK-TTRF in three replications for each combination of the test courses and the positioning baselines are reported in Table 3. The number of RTK-fixes after the 3 s periodic GNSS signal blockages measured on the test courses C and A1 mainly depended on the traveling speed and distance of the carrier vehicle and were approximately 230 times and 100 times for the course C and A1, respectively. In the case of the RTK-TTRF measurements on course A2, the number of RTK-fixes was the number of the U-turns at the headland of the carrier vehicle and were 32 times. Although the tree canopies reduced the GNSS satellites in view and the signal strength during the test runs on course C, they did not significantly affect the RTK-TTRF performance of the low-cost PD since there was a small difference of 0.1–0.2 s between the 95th percentile average values of the RTK-TTRF measured on course C and course A1 (Table 3). In addition, there were only 1 and 2 reacquisition timeouts of less than 17 s during the short and medium baseline positionings on course C, and there was almost no difference between the average RTK-TTFFs measured at these two baselines. The average values of the dynamic RTK-TTRF were less than 4 s and 7 s for the straight segments and U-turn segments, respectively, and the average dynamic RTK-TTRF after a 3-s signal loss was approximately 1 s longer than the static reacquisition, which was less than 3 s []. These indicated that the low-cost PD could quickly restore the GNSS signal interrupted for a short period of time.

Table 3.
Measurement results for the dynamic RTK-TTRF in different correction sources.
3.2. Results of Carrier Vehicle Heading Measurement
For the MBA, the known baseline length between the base and rover antennae can be used to validate the RTK solution of the application, including the raw heading output. Figure 8b–d show the raw data of the RTK-GNSS calculated distance between the two ANN-MB-00 antennae and the baseline heading in different segments of C1–C4 (Figure 8a) on the test course C during the heading measurements with two baseline lengths of 20.0 cm and 92.5 cm. The tree canopies of the straight segments C3 and C2, which reduced the number of satellites in view (Figure 7), significantly affected the computation of the relative position between the antennae and the baseline heading. The variation of the calculated distance and the carrier vehicle heading in these segments became larger than those in the open sky straight segments of C1-1, C1-2, and C4. Furthermore, if the distance between the antennae is short, as in the case of the 20.0 cm baseline length, the effect of the tree canopies was stronger because the calculated heading did not closely match with the true heading output by V113 (Figure 8c), which was filtered with the extended Kalman filter to remove the noise from the tree lines or buildings around the test courses. The RMS (root mean squared) value of the calculated heading was 1.6° and greater than that of the 92.5 cm baseline length measurement, which was only 0.6°.
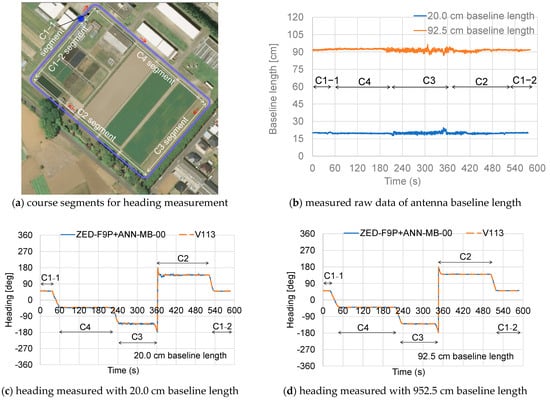
Figure 8.
Measurement results of the heading of the carrier vehicle traveling on course C. Red arrows indicate traveling direction of the test carrier, while blue lines with white dots indicate the trajectory of the test carrier.
The dynamic measurements of the RTK-TTRF and the carrier vehicle heading also verified that a low-cost multi-frequency and multi-GNSS PD could also overcome the issue that the GNSS-based auto-guidance system would not function properly due to the significant reduction of the available number of GNSS satellites when working along tree lines or other obstacles around fields or farm roads between fields. Undoubtedly, using multi-GNSS constellations is necessary to obtain the reliability of the GNSS positioning sensors and allow the guidance technology to operate the agricultural machinery continuously across the whole field and between fields.
3.3. Results of Dynamic RTK-Fix Availability and Positioning Accuracy Measurements
The NMEA GGA sentences recorded by the test PDs during traveling on courses A1, A2, and A3 were parsed to derive the RTK-fix availability and the horizontal position of the test antennae instrumented on the carrier vehicle. The data analysis indicated the 100 percent RTK-fix availability for the whole dynamic evaluation with short and medium RTK correction sources since all recorded GGA sentences had the GNSS quality of 4, which indicates the RTK-fix positioning of the test PDs. Furthermore, no interruption of the vehicle operation when conducting the automatic soil tillage and direct soybean seeding with ZED-F9P/JCA228 as the navigation sensor indicated that the low-cost PD could provide a stable RTK positioning in dynamic conditions when traveling across the whole agricultural field or on the roads between field.
Figure 9 depicts the sample data of the calculated OTE of the dynamic RTK horizontal positioning for the test PDs with respect to the dynamic RTK positioning of the tracking sensor A325 in the different RTK baseline lengths and traveling speeds. As expected, the data indicated the higher OTE for the MBL RTK positioning and 2.0 m/s traveling speed of the carrier vehicle. It also revealed the higher OTE of the U-turn segments than that of the straight segments in all the positioning accuracy tests, even when the speed was reduced from 1.0 m/s to approximately 0.4 m/s during the U-turns in the autonomous driving tests (Figure 9c,d).
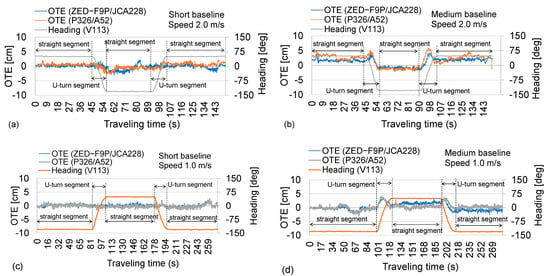
Figure 9.
Sample data of OTE calculated from the dynamic positioning data of the manual driving (a,b) and autonomous driving tests (c,d).
The RMS values of XTA and UTA, which were calculated from the OTE of the test PDs traveling in five straight segments and five U-turn segments, are shown in Figure 10. In the SBL RTK positioning, the XTAs of the low-cost PD were 1.2 cm and 1.0 cm for the carrier vehicle speed of 2.0 m/s and 1.0 m/s, respectively, and almost similar to those of the mid-range PD, which were 1.3 cm and 1.1 cm for the higher and lower speeds. There was almost no difference between the UTA of the test PDs, which ranged from 0.8 cm to 1.8 cm at the different speeds of the carrier vehicle. In the MBL RTK positioning, the XTA and UTA at the speed of 2.0 m/s were reduced to more than a half in comparison with those measured in the SBL RTK positioning and were 2.6 cm and 3.2 cm, respectively, for the low-cost PD, and 3.2 cm and 4.3 cm, respectively, for the mid-range PD. The same trend occurred in the MBL RTK positioning of the low-cost PD at the travel speed of 1.0 m/s since the XTA and UTA were reduced to 1.9 cm and 3.3 cm, respectively. However, the XTA of the mid-range PD was almost unchanged with respect to that in the SBL RTK positioning, while UTA was reduced to 3.3 cm. Accordingly, it could be concluded that the low-cost PD ZED-F9P/JCA228 could provide the cm-level horizontal accuracy during the dynamic RTK positioning conducted at different RTK baseline lengths and travel speeds and its dynamic RTK positioning was not inferior to that of the mid-range PD P326/A52.
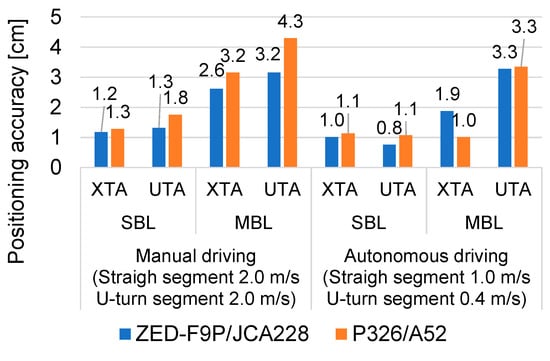
Figure 10.
Dynamic RTK positioning accuracy of the test PDs in terms of RMS values of XTA and UTA.
3.4. Results of Vehicle Guidance Accuracy Measurement
The guidance accuracy of the AGS using the test PDs of ZED-F9P/JAC228 and P326/A52 as the positioning sensors was quantified by the RMS value of unsigned XTE, which was the lateral deviation of the RVP from the desired path. Figure 11a shows sample data of XTE calculated for the soil tillage along the centermost 50-m portions using the AGS with the test PDs. The maximum value of XTE during soil tillage was approximately 6 cm for both the low-cost and mid-range PDs, regardless of the baseline length of the RTK positioning. Meanwhile, the maximum XTE guided by the low-cost PD for the soybean seeding was approximately 7 cm at both the baseline lengths of RTK positioning, and with the mid-range PD was approximately 5 cm and 8 cm for the SBL and MBL, respectively.
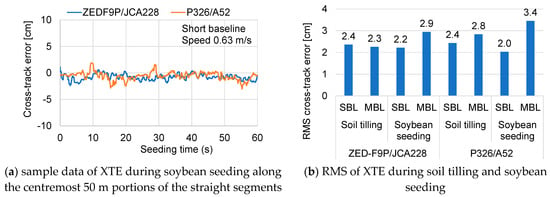
Figure 11.
XTE during soybean seeding along the centermost 50 m.
Because the XTE included the errors from different sources in addition to the positioning error of the test PDs such as the compass V113, the kinematics of the carrier vehicle, the path tracking algorithm, and the soil condition, etc., the RMS value of the XTE was larger than XTA, which depended only on the positioning performance of the test PDs. As can be seen in Figure 11b, the RMS value of XTE for the test PDs was almost less than 3 cm, and the difference between RMS values of XTE for the SBL and MBL was less than 1 cm. However, in the case of the soybean seeding guided by P326/A52, the RMS value at the MBL and the difference of RMS value between different baseline lengths were 3.4 cm and 1.4 cm, respectively. The small difference between the RMS values of XTE of ZED-F9P/JCA228 and P326/A52 during the tilling and seeding operations at the SBL and MBL of RTK positioning indicated that the low-cost PD had the same guidance accuracy compared with that of the mid-range PD. Furthermore, the measured distance between soybean rows of two adjacent seeding paths in the straight segment portions (Figure 5b) was 28.9 ± 0.6 cm for the low-cost PD and 30.9 ± 1.1 cm for the mid-range PD with respect to the set interval of 30 cm of the seeder. Consequently, the low-cost PD was sufficiently adaptable to the automatic work of agricultural machinery, such as for tilling and seeding.
4. Conclusions
Based on the results of the dynamic testing conducted in this study, some main conclusions could be drawn as follows:
(1) The multi-frequency multi-GNSS PDs paired from the low-cost receiver ZED-F9P and the low-cost antennae had stable positioning performance with 100% RTK positioning availability in both the field open sky and canopy obstruction environments. It also took less than 3 s and 7 s to quickly reacquire the RTK solution after the short-time GNSS signal losses of 3 s and 24 s, respectively, at both short and medium RTK positioning baselines.
(2) The low-cost PD had similar accuracy for dynamic positioning and guidance in an agricultural environment compared with the legacy mid-range PD when it could continuously measure the horizontal position of the RVP of the carrier vehicle with 3 cm-level accuracy for the straight segments and 4 cm-level accuracy for the U-turn segments both at the short and medium RTK positioning baselines. The low-cost PD could also accurately measure the heading angle in the open-sky environment with a sub-degree-level error compared with the output of the high-end GNSS compass.
(3) This study indicated that the low-cost multi-frequency multi-GNSS positioning device could be used on the AGS of an autonomous tractor and significantly reduce the total equipment cost of the system without a penalty in the guidance performance.
(4) The techniques and test results from this study could be used to provide additional guidelines for determining the overall dynamic performance of the GNSS-based PDs and AGSs.
Author Contributions
Conceptualization, N.V.N. and W.C.; methodology, N.V.N.; software, W.C.; validation, W.C. and N.V.N.; formal analysis, N.V.N.; investigation, N.V.N.; resources, N.V.N.; data curation, N.V.N.; writing—original draft preparation, N.V.N..; writing—review and editing, W.C.; visualization, N.V.N.; supervision, N.V.N.; project administration, N.V.N.; funding acquisition, N.V.N. All authors have read and agreed to the published version of the manuscript.
Funding
This research received no external funding.
Data Availability Statement
All relevant data are included in the manuscript.
Conflicts of Interest
The authors declare no conflict of interest. This paper discusses the evaluation results of a study conducted by the authors and does not necessarily represent the views or policies of the Institute of Agricultural Machinery, NARO. The authors, Institute of Agricultural Machinery, NARO, do not endorse or promote products and services, or companies. Trade or company names appear herein solely because they are considered essential to the objects of this study.
References
- Ehsani, M.R.; Sullivan, M.D.; Zimmerman, T.L.; Stombaugh, T. Evaluating the dynamic accuracy of low-cost GPS receivers. ASAE Annu. Meet. 2003, 2003, 031014. [Google Scholar]
- Han, S.; Zhang, Q.; Noh, H.; Shin, B. A dynamic performance evaluation method for DGPS receivers under linear parallel-tracking applications. Trans. ASAE 2004, 47, 321–329. [Google Scholar] [CrossRef]
- Min, M.; Ehsani, M.R.; Salyani, M. Dynamic Accuracy of GPS Receivers in Citrus Orchards. Appl. Eng. Agric. 2008, 24, 861–868. [Google Scholar] [CrossRef]
- Cole, J.T.; Stombaugh, T.S.; Shearer, S.A. Development of a test track for evaluation of GPS receiver dynamic performance. ASAE Annu. Meet. 2004, 2004, 041060. [Google Scholar]
- Stombaugh, T.S.; Sama, M.P.; Zandonadi, R.S.; Shearer, S.A.; Koostra, B.K. Standardized Evaluation of Dynamic GPS Performance. Provid. Rhode Isl 2008, 2008, 084728. [Google Scholar]
- Taylor, R.K.; Schrock, M.D. Dynamic testing of GPS receivers. Trans. ASAE 2004, 47, 1017–1025. [Google Scholar] [CrossRef]
- ISO 12188-1; Tractors and Machinery for Agriculture and Forestry—Test Procedures for Positioning and Guidance Systems in Agriculture—Part 1: Dynamic Testing of Satellite-Based Positioning Devices. ISO: Geneve, Switzerland, 2010.
- Ehsani, M.R.; Sullivan, M.; Walker, J.T.; Zimmerman, T.L. A method of evaluating different guidance systems. ASAE Annu. Meet. 2022, 2022, 021155. [Google Scholar]
- Easterly, D.R.; Adamchuk, V.I.; Kocher, M.F.; Hoy, R.M. Using a vision sensor system for performance testing of satellite-based tractor auto-guidance. Comput. Electron. Agric. 2010, 72, 107–118. [Google Scholar] [CrossRef]
- ISO 12188-2; Tractors and Machinery for Agriculture and Forestry—Test Procedures for Positioning and Guidance Systems in Agriculture—Part 2: Testing of Satellite-Based Auto-Guidance Systems during Straight and Level Travel. ISO: Geneve, Switzerland, 2012.
- Sama, M.P.; Stombaugh, T.S. Performance evaluation of a tracking total station as a position reference for dynamic GNSS accuracy testing. Appl. Eng. Agric. 2014, 30, 557–563. [Google Scholar]
- Chosa, T.; Omine, M.; Itani, K.; Ehsani, R. Evaluation of the Dynamic Accuracy of a GPS Receiver—Is Dynamic Accuracy the Same as Static Accuracy? Eng. Agric. Environ. Food 2011, 4, 54–61. [Google Scholar] [CrossRef]
- Carballido, J.; Perez-Ruiz, M.; Emmi, L.; Agüera, J. Comparison of positional accuracy between RTK and RTX GNSS based on the autonomous agricultural vehicles under field conditions. Appl. Eng. Agric. 2014, 30, 361–366. [Google Scholar]
- Rounsaville, J.; Dvorak, J.; Stombaugh, T.S. Methods for calculating relative cross-track error for ASABE/ISO Standard 12188-2 from discrete measurements. Trans. ASAE 2016, 59, 1609–1616. [Google Scholar]
- U-Blox, Moving Base Applications. 2018. Available online: https://www.u-blox.com/sites/default/files/ZED-F9P-MovingBase_AppNote_%28UBX-19009093%29.pdf (accessed on 22 October 2021).
- Cho, W.; Hayashi, K. A Multi-robot operation system for the standard-sized farmland. J. Jpn. Soc. Agric. Mach. 2019, 81, 270–274, in Japanese with English abstract. [Google Scholar]
- Nguyen, V.N.; Cho, W.; Hayashi, K. Performance evaluation of a typical low-cost multi-frequency multi-GNSS device for positioning and navigation in agriculture—Part 1: Static testing. Smart Agric. Technol. 2021, 1, 100004. [Google Scholar] [CrossRef]
Disclaimer/Publisher’s Note: The statements, opinions and data contained in all publications are solely those of the individual author(s) and contributor(s) and not of MDPI and/or the editor(s). MDPI and/or the editor(s) disclaim responsibility for any injury to people or property resulting from any ideas, methods, instructions or products referred to in the content. |
© 2023 by the authors. Licensee MDPI, Basel, Switzerland. This article is an open access article distributed under the terms and conditions of the Creative Commons Attribution (CC BY) license (https://creativecommons.org/licenses/by/4.0/).