Abstract
Permanent dryland pastures are the basis of animal feed in extensive grazing systems. Seasonality and inter-annual climatic variability, associated with shallow, acidic, and not very fertile soils, result in low productivity and rapid degradation of pasture quality, which requires the supplementation of animal feed. In this study, carried out in a biodiverse pasture field in the Mediterranean region of southern Portugal, the vegetation index (NDVI, Normalized Difference Vegetation Index) obtained from measurements performed by a proximal optical sensor (PS) and satellite images (RS) was used to assess pasture quality parameters (pasture moisture content, PMC, crude protein, CP, and neutral detergent fiber, NDF). The monitoring was carried out throughout the 2021/2022 pasture growing season. Significant correlations were obtained between the NDVI obtained by PS and RS (R2 of 0.84) and the reference values of pasture parameters obtained in laboratory protocols: PMC (R2 of 0.88 and 0.78, respectively), CP (R2 of 0.67 and 0.63, respectively), and NDF (R2 of 0.50 and 0.46, respectively). This case study also demonstrated the spatial and temporal variability of vegetative vigour and, consequently, of pasture quality in the Montado, the characteristic Mediterranean ecosystem. These results show the pertinence of these technologies in supporting the decision-making process of the farm manager, namely, to estimate the supplementation needs of animals in critical phases, especially after the spring production peak and before the autumn production peak.
1. Introduction
The Mediterranean mixed ecosystem known as Montado in Portugal and as Dehesa in Spain includes different strata of vegetation where sparsely distributed trees coexist with dryland pastures grazed extensively by livestock [1,2]. This oak-based silvopastoral system of the Iberian Peninsula is commonly considered to have “high nature value” (HNV) [3] and is recognized as a highly biodiverse and multifunctional ecosystem [4] in terms of biodiversity conservation [5,6]. It provides primarily animal feed and welfare (by reducing heat stress) [1], but also, in the long term, contributes to climate regulation and soil erosion protection [7] and is seen as a means of diversifying farmers’ income [1]. These important merits of the Montado ecosystem fit well with the new agricultural paradigm of the Common Agricultural Policy (CAP), based on payments for measurable outcomes related to, e.g., biodiversity, soil degradation neutrality, climate change mitigation, or landscape quality [3].
Montado integrates soil, trees, grassland, and livestock [8]. Grasslands are the major feed source for livestock [6,9], nevertheless, their productivity and quality undergo strong seasonal variations throughout the year [1], with minimal values between July and September (summer period) and maximum values of productivity, in April-May (spring period), and of quality, in November-December (autumn period) [10]. This seasonality reflects the variation of temperature and precipitation, determinant factors for grassland production [5,7]. In addition to seasonality, there is also an important inter-annual variability of these climatic parameters [1]. In this context, the unpredictability of the estimate of the amount/quality of available pastures obliges the application of technology for mapping the temporal and spatial patterns, providing fundamental tools for agronomic and zootechnical decision-making [5]. These will be crucial for proper permanent pasture management [5], for active grazing management (adjusting stocking rates or pasture rotation), or for supplementary feeding management [4,10]. These tools are of key importance, especially in the current scenario of climate change, and pose new challenges for extensive livestock production and for ecoservices-related activities [5].
Chemical composition, water content, and nutrient concentration are widely used as indicators of pasture nutritive value [7]. Among the most common chemical parameters for this purpose, the crude protein (CP) content and neutral detergent fibre (NDF) stand out [7,10]. High CP (and PMC) content and low fibre content [5] are characteristics of pastures of high quality [7,10]. However, the spatial and temporal patterns of these parameters are influenced by climatological and topographical conditions [7]. At the beginning of the cycle, the pasture normally has high levels of PMC and CP and relatively low levels of NDF, gradually inverting this composition until the end of the cycle [10,11].
The traditional method for pasture nutritive value evaluation, involving the collection of representative samples and their preparation and chemical analysis in specialised laboratories, is expensive and therefore impractical in the dynamic decision-making process that is required from the producer [4,12,13]. In recent years, several works have been developed that show the application of new technologies and methodologies for the estimation of pasture quality [13]. Some of the more successful technologies are based on vegetation indices (VI) obtained from the measurement of the reflectance of the radiation received by the plants [14,15]. VI can help assess crop growth, vigor, biomass, or chlorophyll content and, consequently, help understand the patterns of spatio-temporal variability, which is crucial for Precision Agriculture (PA) applications [14]. The Normalized Difference Vegetation Index (NDVI) is the most common vegetation assessment because of its ability to quickly delineate vegetation and vegetative stress [16]. The mathematical expression that allows the calculation of NDVI considers the reflectance of vegetal tissues in the red and near-infrared (NIR) ranges of the electromagnetic spectrum (NDVI = ((NIR − RED)/(NIR + RED)), used to estimate, among other parameters, the plants chlorophyll content [15].
These VI may be obtained rapidly for large areas through remote sensing (RS) or, to a lesser extent, proximal sensing (PS) techniques [15]. There are only a handful of comparative studies between these two levels (RS and PS) of optical technological application to monitor pasture quality in the Montado ecosystem [7,17]. Some examples are the work of Serrano et al. [17], Gozdowski et al. [18], and Mezera et al. [19]. Optical images based on the Sentinel-2 satellite are available free of charge and represent a very interesting tool since they provide large-scale spatial-temporal pasture detection, monitoring, and prediction [19]. However, some limitations to the use of satellite images have been mentioned; among them, the most frequent is the cloud cover restriction, with a higher frequency during the pasture growing season in the Mediterranean region [14]. In the Montado ecosystem, the presence of trees is another constraint to the use of RS [5,17]. These limitations have promoted interest in low-cost PS techniques (e.g., handheld or tractor-mounted) in the past two decades [14,19] as a suitable and flexible alternative [13]. PS allows effective NDVI mapping in cases of increased cloudiness or in shaded areas, e.g., under tree canopy [19].
The estimation of pasture quality (PMC, CP, or NDF) in real-time can be used to: evaluate if grassland improvements are justified (e.g., fertilization or legume mix application); determine the best grazing system (e.g., continuous or deferred, need to adjust stocking rates, and time of grazing); or decide if supplementary feeding is necessary [4]. All these interventions contribute to more overall efficient grazing management, which is useful in allocating herbage and supplements to animals with greater precision and, consequently, with potential economic benefits for the farm business [13].
The objective of this study was to evaluate the potential of NDVI obtained from measurements performed by satellite images (Sentinel-2) and by a proximal optical sensor (“OptRx”) to assess quality parameters (PMC, CP, and NDF) in highly diverse Mediterranean permanent pastures.
2. Materials and Methods
2.1. Study Area
The area of study (Figure 1), located in the Alentejo region of southern Portugal (38° 32′10” N; 7° 59′80” W), is composed of two fields (“Field A”, with 11 ha; “Field B” with 9 ha) of self-seeded Quercus ilex ssp. rotundifolia Lam. and overseeded biodiverse permanent pastures used for extensive and rotational cattle grazing (mostly consisting of indigenous animal breeds, “Alentejana” and “Mertolenga”) and a stocking rate of 0.6 head per hectare [20]. In each field, 6 sampling areas without trees were georeferenced (12 in total), corresponding to a georeferenced sampling Sentinel-2 pixel of “10 m × 10 m”.
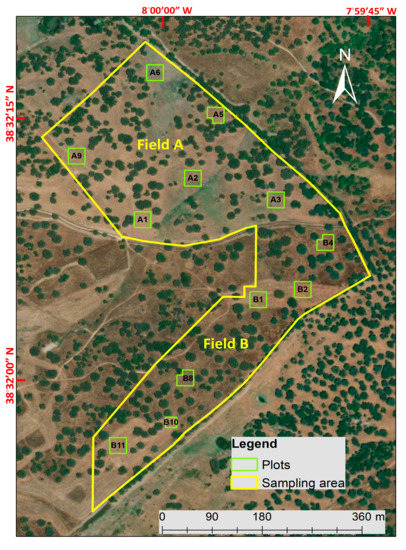
Figure 1.
Experimental fields (A and B) and respective sampling locations.
Shallow and acidic soils of granite rock origin, known as Cambisols [21], are prevalent in this area. These are soils of low fertility and are mostly dedicated to low-input mixed agro-silvo-pastoral production systems [20].
2.2. Climate
This area of the southern Iberian Peninsula is located in the hot summer Mediterranean climate region according to the Köppen climate classification system [22]. Figure 2 illustrates the cumulative daily rainfall between 1 September 2021 and 30 June 2022. Figure 3 shows the monthly temperature and rainfall between July 2015 and June 2022, and the monthly rainfall between July 2021 and June 2022. In terms of accumulated annual rainfall, the year 2021/2022 (504 mm) can be considered a “normal year” (the average of the previous seven years was 542 mm), with a significant concentration of rainfall in the months of September–October (171 mm, representing 34% of the total), December (97 mm, representing 19% of the total), and March-April (198 mm, representing 39% of the total). This diagram also shows a near absence of precipitation in the four months between May and August, a period of the year with the highest average temperatures. The mean temperature of the seven years (2015–2022) showed great amplitude (a minimum of 9 °C in January and a maximum of 24 °C in July).
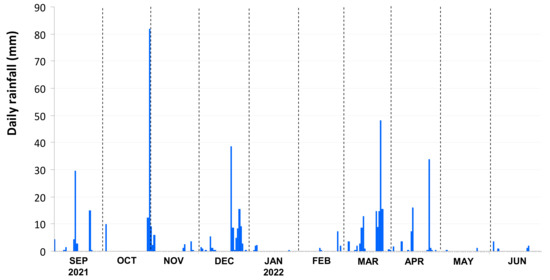
Figure 2.
Cumulative daily rainfall between September 2021 and June 2022.
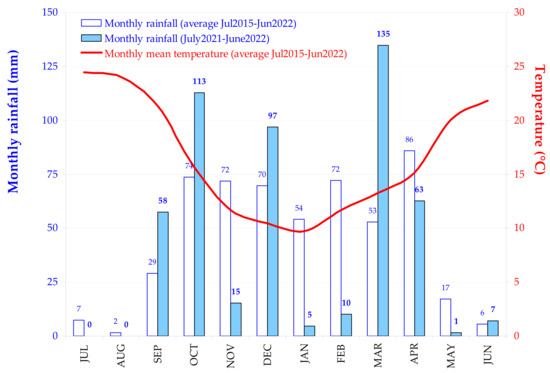
Figure 3.
Monthly rainfall and monthly mean temperature between July 2015 and June 2022.
2.3. Pasture Parameters
Pasture parameters were collected during the vegetative cycle of 2021/2022, between September 2021 and June 2022, from satellite RS images, optical PS, and pasture field samples, according to the approach presented in Figure 4. The 24 September 2021 was considered as the start of the vegetative cycle, corresponding to ten days after 30 mm of accumulated rainfall in early autumn [20]. Pasture sampling was carried out on four dates: late autumn (21 December 2021), late winter (9 March 2022), spring peak production (29 April 2022), and late spring (2 June 2022).
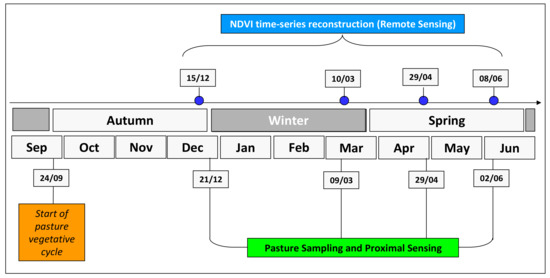
Figure 4.
Chronological diagram of data collection carried out during the vegetative cycle of 2021/2022.
2.3.1. Satellite Remote Sensing Data
For this study, a multi-temporal Sentinel-2 data set with imagery free of clouds and atmospherically corrected was downloaded from the Copernicus data hub for the 12 geo-referenced pixels. Band 8 (B8; NIR; 842 nm) and band 4 (B4; RED; 665 nm), both with a 10 m spatial resolution, were used to calculate the satellite vegetation index (NDVIRS = (B8 − B4)/(B8 + B4)) and for the reconstruction of mean NDVI trends (NDVI time-series records between July 2021 and June 2022) with a temporal resolution of 5 days [23]. Cloudless images with adequate visibility, processed with open-source ORG/GDAL Python libraries, were used in the analysis.
2.3.2. Proximal Sensing Data
An active optical sensor (AOS) called “OptRxTM” (Ag Leader, Ames, IA, USA) was used to obtain multispectral bands. The NDVIPS was calculated based on the NIR (775 nm) and RED (670 nm) bands (NDVIPS = (NIR − RED)/(NIR + RED)). AOS measurements were taken second by second over a 3–4 min period in each pixel area (180–240 measurements per pixel). A Trimble GNSS antenna (GeoExplorer 6000 series; Trimble Navigation Limited, Raunheim, Germany) with sub-metre precision was used to capture the position of the readings taken by the optical sensor. This equipment (optical sensor + GNSS antenna), transported on foot by an operator, was maintained at approximately 0.5 m above the pasture.
2.3.3. Pasture Sampling and Analysis
At each date and pixel sampling area, pasture composite samples were physically obtained by cutting in situ. Each of these consisted of five pasture subsamples (each in a “0.5 m × 0.5 m” area, defined with a metal quadrat), one in the central point of the pixel area, and one in each of its four quadrants, equidistant from the pixel central point (Figure 5). Composite samples were transported to the laboratory, where they were weighed, dried in an oven at 65 °C for 72 h, and weighed again in order to obtain pasture moisture content (PMC, %). The dehydrated samples were analyzed to determine the content of crude protein (CP; in %) and fibre (NDF; in %) using conventional methods [24].
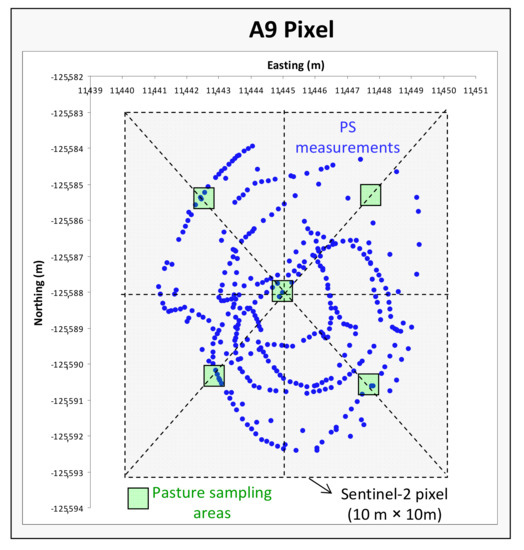
Figure 5.
Sampling areas (e.g., A9 Pixel): (i) Sentinel-2 pixel; (ii) proximal sensing (PS); and (iii) field pasture collection.
2.4. Statistical Analysis of the Data
The descriptive statistical analysis included the calculation of the mean, standard deviation (SD), and range of each dataset: sensor parameters (NDVIRS and NDVIPS) and pasture parameters obtained by a reference laboratory analysis (PMC, CP, and NDF). The means of NDVIRS time-series data were organized graphically to show the pattern of the temporal evolution in the pasture vegetative cycle of 2021/2022.
The inferential statistical analysis was performed using MSTAT-C software (MSTAT-C, Michigan State University, East Lansing, MI, USA) with a significance level of 95% (p < 0.05). The regression analyses were established between sensor parameters (NDVIRS and NDVIPS) and between these and pasture parameters obtained in reference laboratory analysis (PMC, CP, and NDF). The coefficient of determination (R2) was used for model fit assessment.
3. Results
3.1. Evolution of Pasture Parameters
The monitoring of pasture quality is a common process, providing the basis for the management of variables associated with animal grazing. The laboratory determinations of samples collected in the field showed the evolution of the average values of parameters such as PMC, CP, or NDF throughout the 2021/2022 growing season, as well as their spatial variability (Table 1). The use of expedient tools (PS or RS), proved this pattern and confirmed the scale of spatial variability of the vegetative vigour of the pasture, identified by the vegetation index (NDVI).

Table 1.
Mean ± standard deviation (SD) and range of pasture parameters (pasture moisture content, PMC; crude protein, CP; and neutral detergent fibre, NDF); and normalized difference vegetation index (NDVI) obtained by proximal (PS) and remote sensing (RS) in the vegetative cycle of 2021/2022.
In average terms (Figure 6), the PMC showed relatively stable values of more than 80% in the first three evaluation periods (between 21 December and 29 April), however, in the last evaluation period, this parameter showed a very significant drop, to values around 30%. The CP, on the other hand, showed a very significant drop (of approximately 25%) from the first to the second evaluation date (from December to March) and from the third to the fourth evaluation date (a drop of almost 50%). In turn, the fibre (NDF), showed a consistent trend of slight increases between the first and the third assessment date, with a very pronounced increase in the fourth assessment date. The NDVI showed a pattern similar to that of PMC, although with a maximum peak on the third assessment date (April 2022), followed by an abrupt decrease in June.
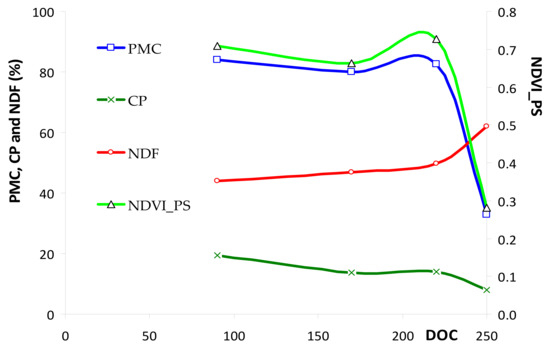
Figure 6.
Pasture quality parameters: patterns of the vegetative cycle of 2021/2022. PMC—Pasture moisture content; CP—Crude protein; NDF—Neutral detergent fibre; NDVIPS—Normalized difference vegetation index measured by proximal sensing.
3.2. NDVI Time Series
Satellite images can be used to obtain certain indices, including NDVI, with the purpose of monitoring the vegetative vigour of the pasture and, consequently, its quality. NDVI is the most popular index used for vegetation assessment [16]. Despite the constraint imposed by the presence of clouds, which are very common in this region during the autumn, winter, and spring periods, it was possible to establish an average and continuous NDVI pattern (Figure 7) due to the availability of images with a high revisiting time (a temporal resolution of 5 days [5]). A pronounced and relatively regular increase in the NDVI is evident from the beginning of the growing season (end of September) until mid-January, when it reached a peak (close to 0.7). Until the end of March, the NDVI values remained relatively stable ((a); Figure 7). March was marked by a pronounced drop in the NDVI to average values of around 0.45. April, however, showed a significant recovery of the NDVI (to values around 0.6 (b); Figure 7). The month of May and the beginning of June showed a clear break in the NDVI, with critical values below 0.2.
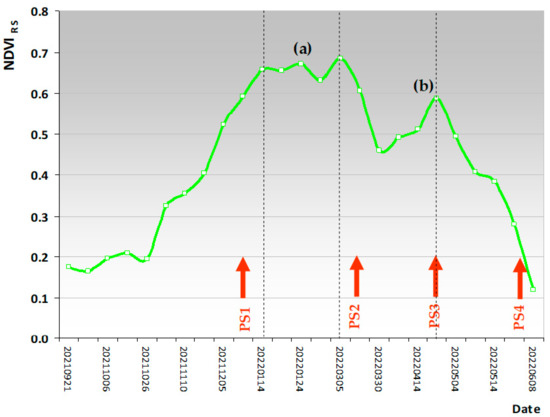
Figure 7.
Normalized difference vegetation index (NDVI) time-series: mean of the records obtained by remote sensing (RS) between 21 September 2021 and 8 June 2022. The arrow indicated the four dates of pasture sampling (from PS1 to PS4). (a) NDVI stable period; (b) NDVI recovery.
The dates of discontinuous field pasture sampling (marked in Figure 7) corresponded to four different phases, representative of the vegetative cycle: PS1 (end of December), phase of significant increase in NDVI; PS2 (early March), start of sharp NDVI decline; PS3 (late April), start of the second NDVI break; and PS4 (early June), very sharp break in NDVI. The results of this pasture sampling and the corresponding reference laboratory determinations formed the database for the establishment of correlations with NDVI obtained either by remote sensing (satellite images) or by proximal sensing (optical sensor “OptRx”).
3.3. Correlation between Pasture Parameters and NDVI
Obtaining NDVI by remote sensing has the clear advantage of not requiring technicians to relocate to the field to make measurements, unlike what happens with the use of proximal sensors. However, the above-mentioned limitation imposed by the presence of clouds justifies the interest in having alternative tools. Figure 8 shows a strong correlation (R2 = 0.84, p < 0.01) between the NDVI values obtained from satellite images (NDVIRS) and those obtained with the proximal optical sensor (NDVIPS), although with a systematic tendency towards lower NDVI values when calculated from RS.
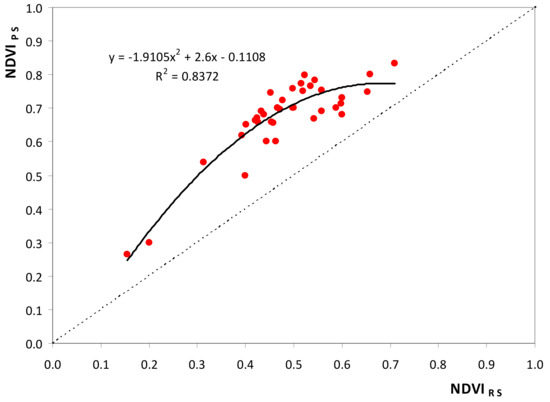
Figure 8.
Normalized difference vegetation index (NDVI): correlation between proximal sensing (NDVIPS) and remote sensing (NDVIRS).
Figure 9, Figure 10 and Figure 11 show significant correlations between vegetation index values (NDVIPS and NDVIRS) and pasture quality parameters, respectively, PMC, CP, and NDF. These correlations were systematically stronger for PS measurements than for RS measurements and were especially high in the correlation with PMC (R2 = 0.88, p < 0.01 with PS; R2 = 0.78, p < 0.01 with RS), showing intermediate values in the correlation with CP (R2 = 0.67, p < 0.01 with PS; R2 = 0.63, p < 0.01 with RS) and lower values with NDF (R2 = 0.50, p < 0.05 with PS; R2 = 0.46, p < 0.05 with RS).
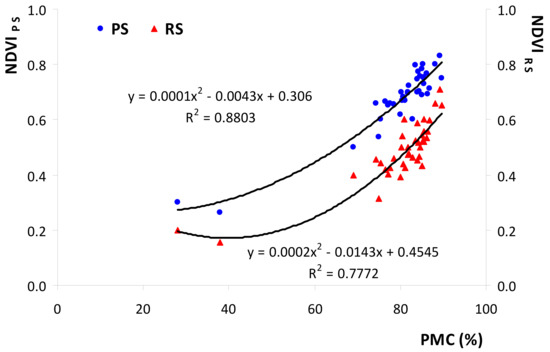
Figure 9.
Correlation between vegetation index values (obtained by proximal sensors, NDVIPS, and by remote sensing, NDVIRS) and pasture moisture content (PMC).
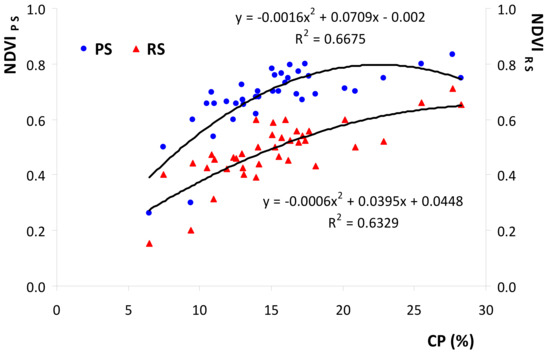
Figure 10.
Correlation between vegetation index values (obtained by proximal sensors, NDVIPS, and by remote sensing, NDVIRS) and pasture crude protein (CP).
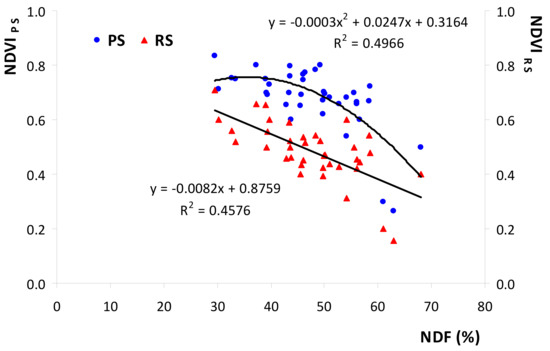
Figure 11.
Correlation between vegetation index values (obtained by proximal sensors, NDVIPS, and by remote sensing, NDVIRS) and pasture neutral detergent fibre (NDF).
4. Discussion
4.1. Changes in Pasture Parameters—Impact on the NDVI
Water, CP, and NDF contents are the chemical parameters most commonly used as indicators of pasture quality [7]. Grasslands are characterized by vegetation growth cycles [9,25]. There are several studies that show strong variability in the evolution of spatial and temporal patterns of pasture quality as a function of rainfall distribution [7,9]. According to Reinermann et al. [9], precipitation is the major determining factor for grassland production. When autumn is relatively dry, there is a delay in the emergence of the pasture, which can impact the availability of this food source for animals after a normally long period (June-September) without precipitation [26]. In the year under study (2021/2022), precipitation events that occurred in mid-September (Figure 2) led to a cumulative monthly precipitation of about 60 mm (Figure 3), which, associated with average temperatures of around 20 °C, allowed the start of the growth cycle in early autumn. The monthly accumulated precipitation of around 100 mm in both October and December provides good levels of moisture in the soil, ensuring a normal production cycle for the pasture [26] and, therefore, the expected impact on the quality parameters (PMC, CP, and NDF). The above description regarding the distribution of precipitation over the seasons of the year and the consequent impact on pasture quality influences the NDVI profile (Figure 7), as already presented in other works by this research team [17,20,27].
The January and February months recorded cumulative precipitation values (5 mm and 10 mm, respectively) well below the average values for the same location in the 2015–2022 period (54 mm and 72 mm, respectively; Figure 3). Simultaneously, the decrease in air temperature (reaching average values below 10 °C in the month of January) tends to be reflected in a decrease in the vegetative vigour of the plants, leading to some vegetative dormancy and, consequently, a stagnation of the leaf area, which is reflected in the quality parameters of the pasture [26]. The highest NDVI values were reached in mid-January ((a); Figure 7), a plateau that remained relatively stable (0.65–0.70) until early March.
The low rainfall observed in January and February (Figure 3), in the middle of winter, and the seasonal decrease in minimum temperatures (which in this region can reach 0 °C; [26]), may help to explain a very pronounced drop in NDVI throughout March (Figure 7). At this time of year, it is also common for the earliest botanical species to start flowering, a phenomenon that has a negative impact on the proportion of “green” leaf area and, therefore, on the reflection capacity of the radiation bands that contribute to the calculation of NDVI (NIR and RED) [20]. On the other hand, the succession of precipitation events that occurred in March 2022 (with a cumulative monthly value of 135 mm; Figure 3) and the permanence of grazing animals in this period [8] may explain the phenological damage to the pasture due to trampling, caused by relatively heavy adult cattle [28].
Normally, the spring period is characterized by a production peak in terms of biomass [26]. The significant rise in air temperature contributes to this peak, but it is necessary to combine this favourable temperature with soil moisture content (SMC): If SMC is available, which depends on previous precipitation, temperature has a positive effect on pasture productivity [9]. In the year under study, the amount of monthly rainfall accumulating in March and April (a total of around 200 mm) created the optimum conditions for maintaining the normal development of the pasture. The duration of this positive response in terms of pasture productivity and partially in terms of pasture quality depends, from that time, on the availability of moisture in the soil since the average air temperature is now above 20 °C [9]. From then on, the pasture quality indicators (high PMC and CP and relatively low fibre contents [5]) tend to develop negatively [7]. In the year under study, the months of May and June were very dry (with only 8 mm of rainfall accumulated in these 2 months), which caused the abrupt decrease in pasture quality indicators (PMC and CP) already in May and early June, precipitating the end of the vegetative cycle. The sharp decline in NDVI (and in pasture vigour) confirms the end of the vegetative cycle, which will have practical implications in terms of animal feed supplementation [8].
4.2. Correlation between Pasture Parameters and NDVI
Pasture quality evaluation is key to optimizing its management, allowing for dynamic decision-making in livestock production [5].
According to the classification of Chang et al. [29], the determination coefficients (R2) obtained in this study show a high correlation between all variables studied. The correlation between the vegetation index (NDVI) measured by remote and proximal sensing (R2 = 0.84, p < 0.01) is similar to that found in a previous study of these same parameters in a pasture field in the same region, but grazed by sheep (R2 = 0.81, p < 0.01; [17]. Despite this close relationship, in both studies we observed a systematic tendency towards lower NDVI values when calculated from RS. Zhao et al. [30] referred to it as the expected “sampling scale effect”: while PS considers five small areas, each of 0.25 m2, RS covers the area of a pixel (100 m2 in this case). Additionally, Fernández-Habas et al. [5] mention sample collection as the factor that affects the accuracy of models established with Sentinel data: while NDVIPS was obtained in the pasture cutting area, NDVIRS involved a considerably larger sampling area. This difference is decisive, given the important spatial and temporal heterogeneity normally associated with biodiverse pastures [14,17], resulting from diverse management practices, multiple functional groups and botanical species, different phenological stages, and interaction with the animals in grazing [12]. All these can be considered confounding factors for the relationship between pasture quality parameters and reflectance, affecting the model prediction accuracy [5]. These same reasons may help explain the systematically stronger correlations of pasture parameters (PMC, CP, and NDF) with NDVIPS than with NDVIRS (PMC: R2 = 0.88, p < 0.01 with PS; R2 = 0.78, p < 0.01 with RS; CP: R2 = 0.67, p < 0.01 with PS; R2 = 0.63, p < 0.01 with RS; NDF: R2 = 0.50, p < 0.05 with PS; and R2 = 0.46, p < 0.05 with RS). These determination coefficients with moderately high accuracy are of similar magnitude to those obtained in other works [12,13,30,31] to predict the nutritive value of mixed pastures based on hyperspectral reflectance data [13].
The practical application remains the main difference between the two sensing approaches considered in this study. Satellite images are available free of charge and represent large areas of pasture over multiple weeks [18], without the need for repeated intensive work of pasture sampling [4,15]. Additionally, time series of RS data can further facilitate the assessment of grazing behaviours covering different phenological phases and allow for faster and more accurate decisions related to pasture and grazing management [4]. Gozdowski et al. [18] describe the results of a similar study comparing a Landsat satellite survey with ground-based measurements using an “OptRx” and, as in our study, underline a demonstrable advantage of PS related to its operability in the case of increased cloudiness, which prevents a reliable use of RS [14,18]. At the same time, these authors draw attention to the usefulness of PS in areas near trees in the Montado ecosystem [18].
One of the challenges in this area of biodiverse pastures is the possibility of identifying, mapping, and distinguishing between beneficial and harmful botanical species in the pasture area using proximal or remote technological approaches. Grassland systems frequently exhibit small-scale botanical and structural heterogeneity with spatial-temporal dynamics, features that present particular complexity for sensor application [32]. The resolution allowed by the RS makes it difficult to identify species, although it has the potential to distinguish representative patches of some families, for example, legumes or grasses [33]. It is, therefore, expected that in the coming years, within the scope of precision agriculture and integrated into the growing incorporation of technology, further research will be carried out using the complementarity of proximal and remote sensors to provide information about the dynamic patterns of grassland composition [32,33].
5. Conclusions
The last decades have been characterized by worrisome extreme climatic events affecting the planet. In the Iberian Peninsula region, for example, there has been a tendency for rising temperatures and abnormal amounts of rainfall concentrated in a few days. The current scenario of climate change and its impact on dryland Mediterranean pastures poses new challenges for extensive livestock production and for ecoservices related to this ecosystem. In this context, several technologies are available that allow mapping the pasture vegetative cycle over time and providing real-time information about pasture quality, which represent a fundamental milestone in supporting decision-making and promoting efficient grazing management.
This study, applied to cattle grazing management, shows that the availability of real-time information on pasture quality derived from NDVI provided by RS (Sentinel-2 imagery) can be used by farmers to evaluate the condition of pastures, plan livestock grazing, and calculate supplementary feeding needs.
Tree presence in the Montado ecosystem and the frequent occurrence of clouds throughout the vegetative cycle of the pastures pose, however, obstacles to the use of these RS tools and justify the growing interest in proximal optical sensors as complementary tools for obtaining this important information.
Author Contributions
Conceptualization, J.S.; methodology, J.S., S.M., S.S. and J.M.d.S.; software, J.S. and J.M.d.S.; validation, J.S.; formal analysis, J.S., S.S. and J.M.d.S.; investigation, J.S. and S.M.; resources, J.S.; data curation, J.S., S.S. and J.M.d.S.; writing—original draft preparation, J.S.; writing—review and editing, J.S. and S.S.; visualization, J.S.; supervision, J.S.; project administration, J.S.; funding acquisition, J.S. All authors have read and agreed to the published version of the manuscript.
Funding
This work was funded by National Funds through the FCT (Foundation for Science and Technology) under the Project UIDB/05183/2020.
Data Availability Statement
Not applicable.
Conflicts of Interest
The authors declare no conflict of interest.
References
- Jaurena, M.; Durante, M.; Devincenzi, T.; Savian, J.V.; Bendersky, D.; Moojen, F.G.; Pereira, M.; Soca, P.; Quadros, F.L.F.; Pizzio, R.; et al. Native grasslands at the core: A new paradigm of intensification for the campos of Southern South America to increase economic and environmental sustainability. Front. Sustain. Food Syst. 2021, 5, 547834. [Google Scholar] [CrossRef]
- Plieninger, T.; Flinzberger, M.L.; Hetman, I.; Horstmannshoff, M.; Reinhard-Kolempas, E.; Topp, G.; Moreno, L.; Huntsinger, L. Dehesas as high nature value farming systems: A social-ecological synthesis of drivers, pressures, state, impacts, and responses. Ecol. Soc. 2021, 26, 23. [Google Scholar] [CrossRef]
- Pinto-Correia, T.; Ferraz-de-Oliveira, I.; Guimarães, M.; Sales-Baptista, E.; Pinto-Cruz, C.; Godinho, C.; Vieira Santos, R. Result-based payments as a tool to preserve the High Nature Value of complex silvo-pastoral systems: Progress toward farm-based indicators. Ecol. Soc. 2022, 27, 39. [Google Scholar] [CrossRef]
- Raab, C.; Riesch, F.; Tonn, B.; Barrett, B.; Meißner, M.; Balkenhol, N.; Isselstein, J. Target-oriented habitat and wildlife management: Estimating forage quantity and quality of semi-natural grasslands with Sentinel-1 and Sentinel-2 data. Remote Sens. Ecol. Con. 2020, 6, 381–398. [Google Scholar] [CrossRef]
- Fernández-Habas, J.; Moreno, A.M.G.; Hidalgo-Fernández, M.A.T.; Leal-Murillo, J.R.; Oar, B.A.; Gámez-Giráldez, P.J.; GonzálezDugo, M.P.; Fernández-Rebollo, P. Investigating the potential of Sentinel-2 configuration to predict the quality of Mediterranean permanent grasslands in open woodlands. Sci. Total Environ. 2021, 791, 148101. [Google Scholar] [CrossRef]
- Ali, I.; Cawkwell, F.; Dwyer, E.; Barret, B.; Green, S. Satellite remote sensing of grasslands: From observation to management—A review. J. Plant Ecol. 2016, 9, 649–671. [Google Scholar] [CrossRef]
- Lugassi, R.; Zaady, E.; Goldshleger, N.; Shoshany, M.; Chudnovsky, A. Spatial and temporal monitoring of pasture ecological quality: Sentinel-2-based estimation of crude protein and neutral detergent fiber contents. Remote Sens. 2019, 11, 799. [Google Scholar] [CrossRef]
- Serrano, J.; Roma, L.; Shahidian, S.; Belo, A.; Carreira, E.; Paniagua, L.L.; Moral, F.; Paixão, L.; Marques da Silva, J. A technological approach to support extensive livestock management in the portuguese Montado ecosystem. Agronomy 2022, 12, 1212. [Google Scholar] [CrossRef]
- Reinermann, S.; Asam, S.; Kuenzer, C. Remote sensing of grassland production and management—A review. Remote Sens. 2020, 12, 1949. [Google Scholar] [CrossRef]
- Serrano, J.; Shahidian, S.; Paixão, L.; Marques da Silva, J.; Morais, T.; Teixeira, R.; Domingos, T. Spatiotemporal patterns of pasture quality based on NDVI time-series in Mediterranean Montado ecosystem. Remote Sens. 2021, 13, 3820. [Google Scholar] [CrossRef]
- Serrano, J.; Shahidian, S.; da Silva, J.M.; Paixão, L.; Carreira, E.; Pereira, A.; Carvalho, M. Climate changes challenges to the management of Mediterranean Montado ecosystem: Perspectives for use of precision agriculture technologies. Agronomy 2020, 10, 218. [Google Scholar] [CrossRef]
- Pullanagari, R.; Yule, I.; Tuohy, M.; Hedley, M.; Dynes, R.; King, W. Proximal sensing of the seasonal variability of pasture nutritive value using multispectral radiometry. Grass Forage Sci. 2013, 68, 110–119. [Google Scholar] [CrossRef]
- Duranovich, F.N.; Yule, I.J.; Lopez-Villalobos, N.; Shadbolt, N.M.; Draganova, I.; Morris, S.T. Using proximal hyperspectral sensing to predict herbage nutritive value for dairy farming. Agronomy 2020, 10, 1826. [Google Scholar] [CrossRef]
- Sishodia, R.P.; Ray, R.L.; Singh, S.K. Applications of Remote Sensing in Precision Agriculture: A review. Remote Sens. 2020, 12, 3136. [Google Scholar] [CrossRef]
- Pezzopane, J.R.M.; Bernardi, A.C.C.; Bosi, C.; Crippa, P.H.; Santos, P.M.; Nardachione, E.C. Assessment of Piatã palisadegrass forage mass in integrated livestock production systems using a proximal canopy reflectance sensor. Eur. J. Agron. 2019, 103, 1301–1339. [Google Scholar] [CrossRef]
- Huang, S.; Tang, L.; Hupy, J.P.; Wang, Y.; Shao, G. A commentary review on the use of normalized difference vegetation index (NDVI) in the era of popular remote sensing. J. For. Res. 2021, 32, 1–6. [Google Scholar] [CrossRef]
- Serrano, J.; Shahidian, S.; da Silva, J.M. Monitoring seasonal pasture quality degradation in the Mediterranean montado ecosystem: Proximal versus remote sensing. Water 2018, 10, 1422. [Google Scholar] [CrossRef]
- Gozdowski, D.; Stępień, M.; Panek, E.; Varghese, J.; Bodecka, E.; Rozbicki, J.; Samborski, S. Comparison of winter wheat NDVI data derived from Landsat 8 and active optical sensor at field scale. Remote Sens. Appl. Soc. Environ. 2020, 20, 100409. [Google Scholar] [CrossRef]
- Mezera, J.; Lukas, V.; Horniaček, I.; Smutný, V.; Elbl, J. Comparison of proximal and remote sensing for the diagnosis of crop status in site-specific crop management. Sensors 2022, 22, 19. [Google Scholar] [CrossRef]
- Serrano, J.; Shahidian, S.; Costa, F.; Carreira, E.; Pereira, A.; Carvalho, M. Can soil pH correction reduce the animal supplementation needs in the critical autumn period in Mediterranean Montado ecosystem? Agronomy 2021, 11, 514. [Google Scholar] [CrossRef]
- FAO. World Reference Base for Soil Resources. Food and Agriculture Organization of the United Nations, World Soil Resources Reports N 103; FAO: Rome, Italy, 2006. [Google Scholar]
- Peel, M.C.; Finlayson, B.L.; McMahon, T.A. Updated world map of the Köppen-Geiger climate classification. Hydrol. Earth Syst. Sci. 2007, 11, 1633–1644. [Google Scholar] [CrossRef]
- ESA (European Space Agency). S2 MPC: Sen2Cor Configuration and User Manual; Ref. S2-PDGS-MPC-L2ASUM-V2.5.5; ESA (European Space Agency): Paris, France, 2018. [Google Scholar]
- AOAC. Official Methods of Analysis of AOAC International, 18th ed.; AOAC International: Arlington, VA, USA, 2005. [Google Scholar]
- Wijesingha, J.; Astor, T.; Schulze-Brüninghoff, D.; Wengert, M.; Wachendorf, M. Predicting forage quality of grasslands using UAV-borne imaging spectroscopy. Remote Sens. 2020, 12, 126. [Google Scholar] [CrossRef]
- Efe Serrano, J. Pastures in Alentejo: Technical Basis for Characterization, Grazing and Improvement; (In Portuguese). Universidade de Évora—ICAM: Évora, Portugal, 2006; pp. 165–178. [Google Scholar]
- Serrano, J.; Shahidian, S.; Marques da Silva, J. Evaluation of normalized difference water index as a tool for monitoring pasture seasonal and inter-annual variability in a Mediterranean agro-silvo-pastoral system. Water 2019, 11, 62. [Google Scholar] [CrossRef]
- Donkor, N.T.; Gedir, J.V.; Hudson, R.J.; Bork, E.W.; Chanasyk, D.S.; Naeth, M.A. Impacts of grazing systems on soil compaction and pasture production in Alberta. Can. J. Soil Sci. 2002, 82, 1–8. [Google Scholar] [CrossRef]
- Chang, S.; Chen, H.; Wu, B.; Nasanbat, E.; Yan, N.; Davdai, B. A practical satellite-derived vegetation drought index for arid and semi-arid grassland drought monitoring. Remote Sens. 2021, 13, 414. [Google Scholar] [CrossRef]
- Zhao, D.; Starks, P.; Brown, M.; Phillips, W.; Coleman, S. Assessment of forage biomass and quality parameters of bermudagrass using proximal sensing of pasture canopy reflectance. Grassl. Sci. 2007, 53, 39–49. [Google Scholar] [CrossRef]
- Albayrak, S. Use of reflectance measurements for the detection of N, P, K, ADF and NDF contents in Sainfoin pasture. Sensors 2008, 8, 7275–7286. [Google Scholar] [CrossRef]
- Wachendorf, M.; Fricke, T.; Möckel, T. Remote sensing as a tool to assess botanical composition, structure, quantity and quality of temperate grasslands. Grass Forage Sci. 2017, 73, 1–14. [Google Scholar] [CrossRef]
- Serrano, J.; Shahidian, S.; Machado, E.; Paniagua, L.L.; Carreira, E.; Moral, F.; Pereira, A.; de Carvalho, M. Floristic composition: Dynamic biodiversity indicator of tree canopy effect on dryland and improved Mediterranean pastures. Agriculture 2021, 11, 1128. [Google Scholar] [CrossRef]
Disclaimer/Publisher’s Note: The statements, opinions and data contained in all publications are solely those of the individual author(s) and contributor(s) and not of MDPI and/or the editor(s). MDPI and/or the editor(s) disclaim responsibility for any injury to people or property resulting from any ideas, methods, instructions or products referred to in the content. |
© 2023 by the authors. Licensee MDPI, Basel, Switzerland. This article is an open access article distributed under the terms and conditions of the Creative Commons Attribution (CC BY) license (https://creativecommons.org/licenses/by/4.0/).