Article

Using Deep Neural Networks to Evaluate Leafminer Fly Attacks on Tomato Plants

by
Guilhermi Martins Crispi
1,
Domingos Sárvio Magalhães Valente
1,
Daniel Marçal de Queiroz
1,*,
Abdul Momin
2,
Elpídio Inácio Fernandes-Filho
3 and
Marcelo Coutinho Picanço
4
1
Department of Agricultural Engineering, Federal University of Viçosa, Viçosa 36570-900, MG, Brazil
2
School of Agriculture, Tennessee Tech University, Cookeville, TN 38505, USA
3
Department of Soils, Federal University of Viçosa, Viçosa 36570-900, MG, Brazil
4
Department of Entomology, Federal University of Viçosa, Viçosa 36570-900, MG, Brazil
*
Author to whom correspondence should be addressed.
AgriEngineering 2023, 5(1), 273-286; https://doi.org/10.3390/agriengineering5010018
Submission received: 9 December 2022 / Revised: 16 January 2023 / Accepted: 20 January 2023 / Published: 31 January 2023

Abstract

:
Among the most common and serious tomato plant pests, leafminer flies (Liriomyza sativae) are considered one of the major tomato-plant-damaging pests worldwide. Detecting the infestation and quantifying the severity of these pests are essential for reducing their outbreaks through effective management and ensuring successful tomato production. Traditionally, detection and quantification are performed manually in the field. This is time-consuming and leads to inaccurate plant protection management practices owing to the subjectivity of the evaluation process. Therefore, the objective of this study was to develop a machine learning model for the detection and automatic estimation of the severity of tomato leaf symptoms of leafminer fly attacks. The dataset used in the present study comprised images of pest symptoms on tomato leaves acquired under field conditions. Manual annotation was performed to classify the acquired images into three groups: background, tomato leaf, and leaf symptoms from leafminer flies. Three models and four different backbones were compared for a multiclass semantic segmentation task using accuracy, precision, recall, and intersection over union metrics. A comparison of the segmentation results revealed that the U-Net model with the Inceptionv3 backbone achieved the best results. For estimation of symptom severity, the best model was FPN with the ResNet34 and DenseNet121 backbones, which exhibited lower root mean square error values. The computational models used proved promising mainly because of their capacity to automatically segment small objects in images captured in the field under challenging lighting conditions and with complex backgrounds.

1. Introduction

Agricultural pests are considered an important cause of losses in world agricultural production [1]. Among agricultural pests, insects can be particularly harmful, as they feed on various parts of the plant, affecting their development, as well as acting as vectors of various devastating plant diseases [2]. In some situations, losses can reach 100% of the production if detection and control are ineffective or nonexistent [3,4].
The tomato plant is one of the vegetable crops most susceptible to pests and diseases [5,6]. Leafminer flies of the genus Liriomyza are among the main pests afflicting the tomato crop, with the largest number of host plants reported within the Agromyzidae family [7]. The larvae feed by opening galleries or mines in the leaf parenchyma, which is why they are called leafminer larvae. It is estimated that the larvae of Liriomyza sativae, the species most associated with tomatoes, reduce plant photosynthesis levels by up to 65% because of stippling and tunneling [8]. This leads to yield reduction, causing significant economic losses for producers.
The detection and quantification of the severity of pest infestation are important tools in sampling plants that assist in decision making for controlling pests and protecting crops [9]. Frequent visual inspection of plantations, aimed at detecting and identifying pests, requires specialized labor. In most cases, inspection consists of manual and visual sampling along the plot using a beating sheet [10]. The problem with this traditional pest sampling method is that, by the time the infestation is detected, the damage has already been caused, and control will be more difficult [11,12]. In addition, the method is subject to human error and may become unfeasible depending on the size of the area [13,14,15]. Therefore, developing an automatic pest identification system could benefit producers by controlling pests and reducing yield loss.
An increasing number of solutions combining digital images with machine learning techniques have been developed for problems related to pest identification. Image processing coupled with machine learning algorithms helps identify and map the most infested areas, assisting in integrated pest management. Among the techniques used for the identification and mapping of pests, there is a predominance of studies using traps. However, one problem with this approach is that only adults and flying insects are captured [16]. An alternative could be direct identification in the field through images of the symptoms caused by pests observable in plant leaves [17,18,19]. Nevertheless, the challenge of this technique is related to the heterogeneity of field conditions, such as the complex background, variability of lighting, and presence of shadows [15,20,21,22].
Currently, artificial intelligence algorithms, such as convolutional neural networks (CNNs), have been successfully deployed in the segmentation of digital images for pest and disease detection [23,24,25,26,27]. Some models currently in evidence for semantic segmentation are U-Net, created for the segmentation of biomedical microscopy images [28,29]; FPN [30], developed primarily for object detection and image segmentation for urban planning and natural landscape monitoring [31]; and LinkNet [32], developed for the segmentation of high-resolution images of urban landscapes.
Creating an automatic identification system requires developing an image segmentation method for leaves attacked by leafminer flies in a natural environment. This automatic system will allow the development of robotic monitoring devices that can be used by pesticide application machinery, reducing operational costs, losses from pest attack, and the environmental impact associated with the control of leafminer flies. Therefore, the present study is aimed at developing and evaluating models of CNNs for the detection and automatic estimation of the severity of symptoms of leafminer fly attacks in tomato leaf digital images captured under field conditions.

2. Material and Methods

For better organization and understanding, the research design of the study was divided into several steps: creating the database, annotating the images and creating reference masks, preprocessing the data, configuring the experiment, applying the model evaluation metrics, and estimating the severity.

2.1. Database Creation

The image database used in this study consisted of 90 images (with a size of 2268 × 4032 pixels) of tomato leaves with symptoms of attack by the leafminer fly (Liriomyza spp.). Images were obtained from two different tomato fields located in the city of Coimbra, Minas Gerais, Brazil. A Huawei P20 Lite smartphone (Huawei Technologies Co., Shenzhen, Guangdong, China) with a 13-megapixel-resolution camera was used to acquire leaf images. An attempt was made to focus on one leaf in each image. The images were captured under field conditions during the daytime, with variations in the lighting and background.
The image bank obtained was then randomly divided into 80% for the training set and 20% for the testing set. The testing set was only used to evaluate the performance of the model. In the training set, 10% of the images were used for model validation during the model training process. The validation process helps determine the best modeling hyperparameters (features) during the model training process, which refers to the percentage of accurately elucidated data samples [33].

2.2. Annotation of Images and Creation of Reference Masks

Image annotation is the process of labeling images to outline the target characteristics of the dataset representing the way a human would perceive them. The resulting dataset is then considered a functional dataset to train the machine learning models. In this study, each image was manually annotated for training the machine learning algorithm by sampling all the classes present, the leaf, and the symptom. At the same time, the background was automatically segmented after demarcation of the target of interest. After annotation, a binary mask containing three classes was created, as shown in Figure 1.

2.3. Data Preprocessing

In the preprocessing step, performed before the CNN model training, patches of size 256 × 256 pixels were extracted from source images and their respective masks. The image patch process is an intermediate solution between feature-based and direct-image methods, enabling precise image localization and a more extensive set of training data [29]. After the patches from the images and masks were extracted, selection was performed on the training patches. Patches containing >95% of their pixels corresponding to the background class were discarded from the training set. This was performed to improve the balance among classes, as much of the original image was the background. In the end, 1900 images (256 × 256 pixels) were left for training and 200 images (256 × 256 pixels) for testing. Finally, to increase the generalization capacity and prevent the model from overfitting, all images and reference masks in the training database were subjected to a data augmentation process with several transformations, including horizontal and vertical rotation and zooming in and out [13,34,35].

2.4. Configuration of the Experiment

Three CNN models, U-Net, FPN [36], and LinkNet, were selected for this study. Transfer learning was used for all the models. In transfer learning, the weights of the pretrained models, called backbones, are defined in the encoder block of the models (Figure 2). The backbones used in this study were VGG16, ResNet34, Inceptionv3, and DenseNet121. These backbones have a significant capacity to generalize predictions for images outside the database used for training. All the backbones were trained using the ImageNet database [37], which is an extensive visual database designed for use in the development of visual object recognition.
The Google Colaboratory platform was used to conduct the experiment using a virtual machine. The configuration of the virtual machine consisted of an Intel Xeon 2.2 GHz processor, an Nvidia Tesla P100 video card with 16 GB of dedicated memory, and 32 GB of RAM.
The training process was performed with 20, 30, 40, 50, and 100 epochs, and it was verified that the model with 30 epochs presented the best results. Then, the models were trained using the following configurations: 30 epochs from scratch, intersection over union (IoU) of the validation database as early stopping, and patience for 5 epochs. Early stopping is a regularization technique widely used in machine learning to avoid model overfitting. The batch size was 16, and Softmax was defined as the activation function for all the output neurons of the last layer. The Adam optimization algorithm was used to adjust the neural network parameters with a learning rate of 0.001.
For improved inference and comparison of the results obtained in this study, all hyperparameters were standardized for all trained models. The loss function initially used for multiclass semantic segmentation tasks was the categorical cross entropy between the predicted value and the reference value for each pixel [38,39]. However, the imbalance among sampled classes also indicates an imbalance in the learning of these different classes. Hence, focal loss was used; this is an adjusted categorical cross entropy highly recommended for semantic segmentation tasks with a database with an imbalance among classes [40,41]. Focal loss is characterized by a categorical cross entropy with the addition of a weighting factor (γ) to the equation, which increases the reliability of the prediction for more sampled classes, making it possible to focus the training of the model for the less sampled classes—in this case, the symptoms under study, which had defined γ = 2 [41]. The Dice coefficient is quite similar to the IoU and is often used as a metric to assess the similarity between two images, but here, it was applied as a loss function (Dice loss).

2.5. Model Evaluation Metrics

The performance of the models employed in this study was evaluated based on accuracy A, precision P, recall R, and IoU, also known as the Jaccard similarity coefficient. This coefficient is precisely the intersection of the reference mask with that predicted by the model over the union of the reference mask with the model prediction. It is widely used to calculate the similarity between two images [40]. These metrics are defined by the following equations:
A = T P + T N T P + T N + F P + F N  
P = T P T P + F P  
R = T P T P + F N
I o U = T P T P + F P + F N
where
TP =
true positive is the number of pixels correctly assigned to the evaluated semantic class (background, healthy leaf, and injured leaf);
FP =
false positive is the number of pixels incorrectly classified in the semantic class, although they belong to another class;
FN =
false negative is the number of pixels belonging to the semantic class assigned to another class.
The values of these metrics range from 0 to 1. A value of 0 means no overlap, whereas a value of 1 represents a complete overlap of the classes between the reference mask and that predicted by the model.

2.6. Severity Estimation

The severity of pest attack in plants is traditionally estimated by the proportion of the attacked tissue of the plant relative to the total leaf area [14,42,43,44]. The precision of these estimates ensures a closer-to-reality analysis, which enables their use as indicators for decision making by producers to control pests. The severity was estimated using the ratio between the number of pixels contained in the lesion class and the total area of the leaf focused on in the image [23]:
  severity = S S + L 100  
where
L = area of pixels contained in the leaf class;
S = area of pixels contained in the symptom class.

3. Results

3.1. Comparison of Models and Backbones

The performance of U-Net, FPN, and LinkNet CNN models with different backbones was investigated to quantify the severity of leafminer fly attacks on tomato leaves. The IoU’s of the validation data during the training for each epoch were compared to evaluate the quality of training of the models. All trained models converged with six epochs, except for the FPN model with the VGG16 backbone, which converged with seven epochs.
Table 1 shows the results of the best models and worst model for each class separately, enabling a better understanding of the performance of each model for each class. For class 1 (i.e., background) and class 2 (i.e., leaf area), the best result was obtained using the U-Net model and the Inceptionv3 backbone, and the worst result was obtained using the LinkNet model and the VGG16 backbone. However, for class 3 (i.e., symptoms), the best model was obtained using the FPN model and the DenseNet121 backbone, and the worst model was obtained using the LinkNet model and the VGG16 backbone. Among all the semantic segmentation backbones used in this study, Inceptionv3 achieved the best result for segmenting the pixels of classes 1 and 2, and the DenseNet121 backbone achieved the best result for segmenting the pixels of class 3.
Table 2 presents the performance of the models employed in this semantic segmentation study using transfer learning. In general, the models performed well for the segmentation task in the testing database. The U-Net model with the Inceptionv3 backbone had the best IoU (77.71%). The second-best model with performance in terms of IoU (76.62%) was obtained using FPN with the DenseNet121 backbone. LinkNet with the VGG16 backbone performed the worst (IoU = 53.03%).
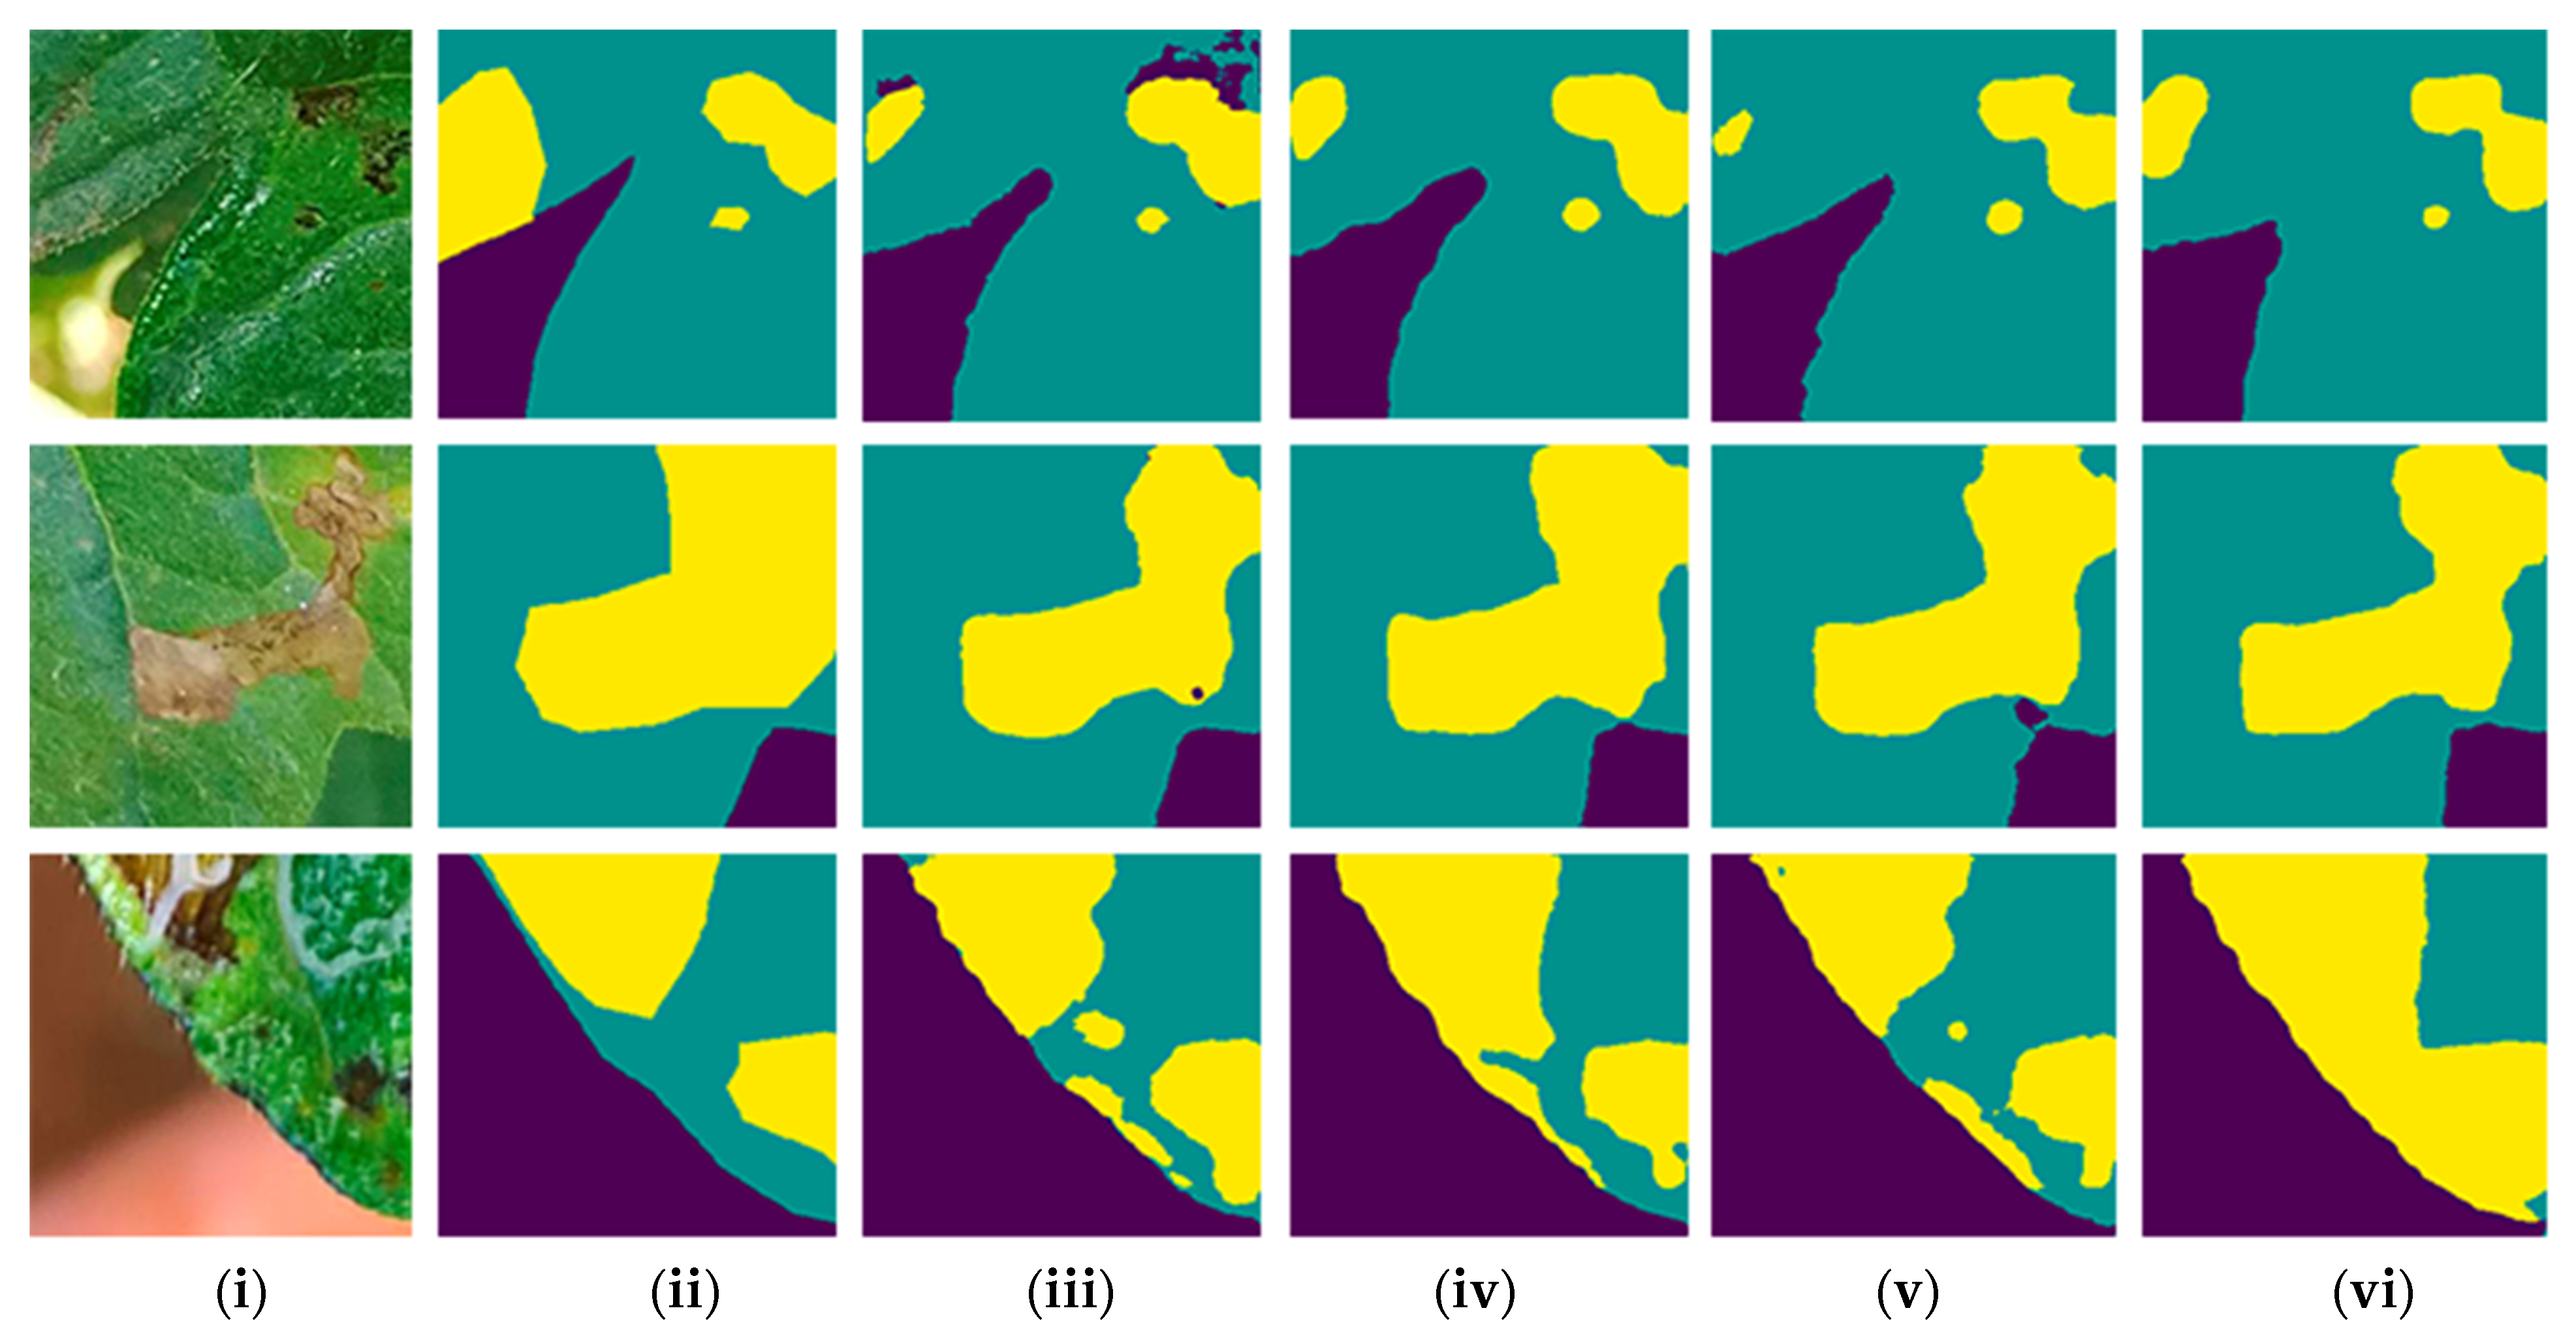
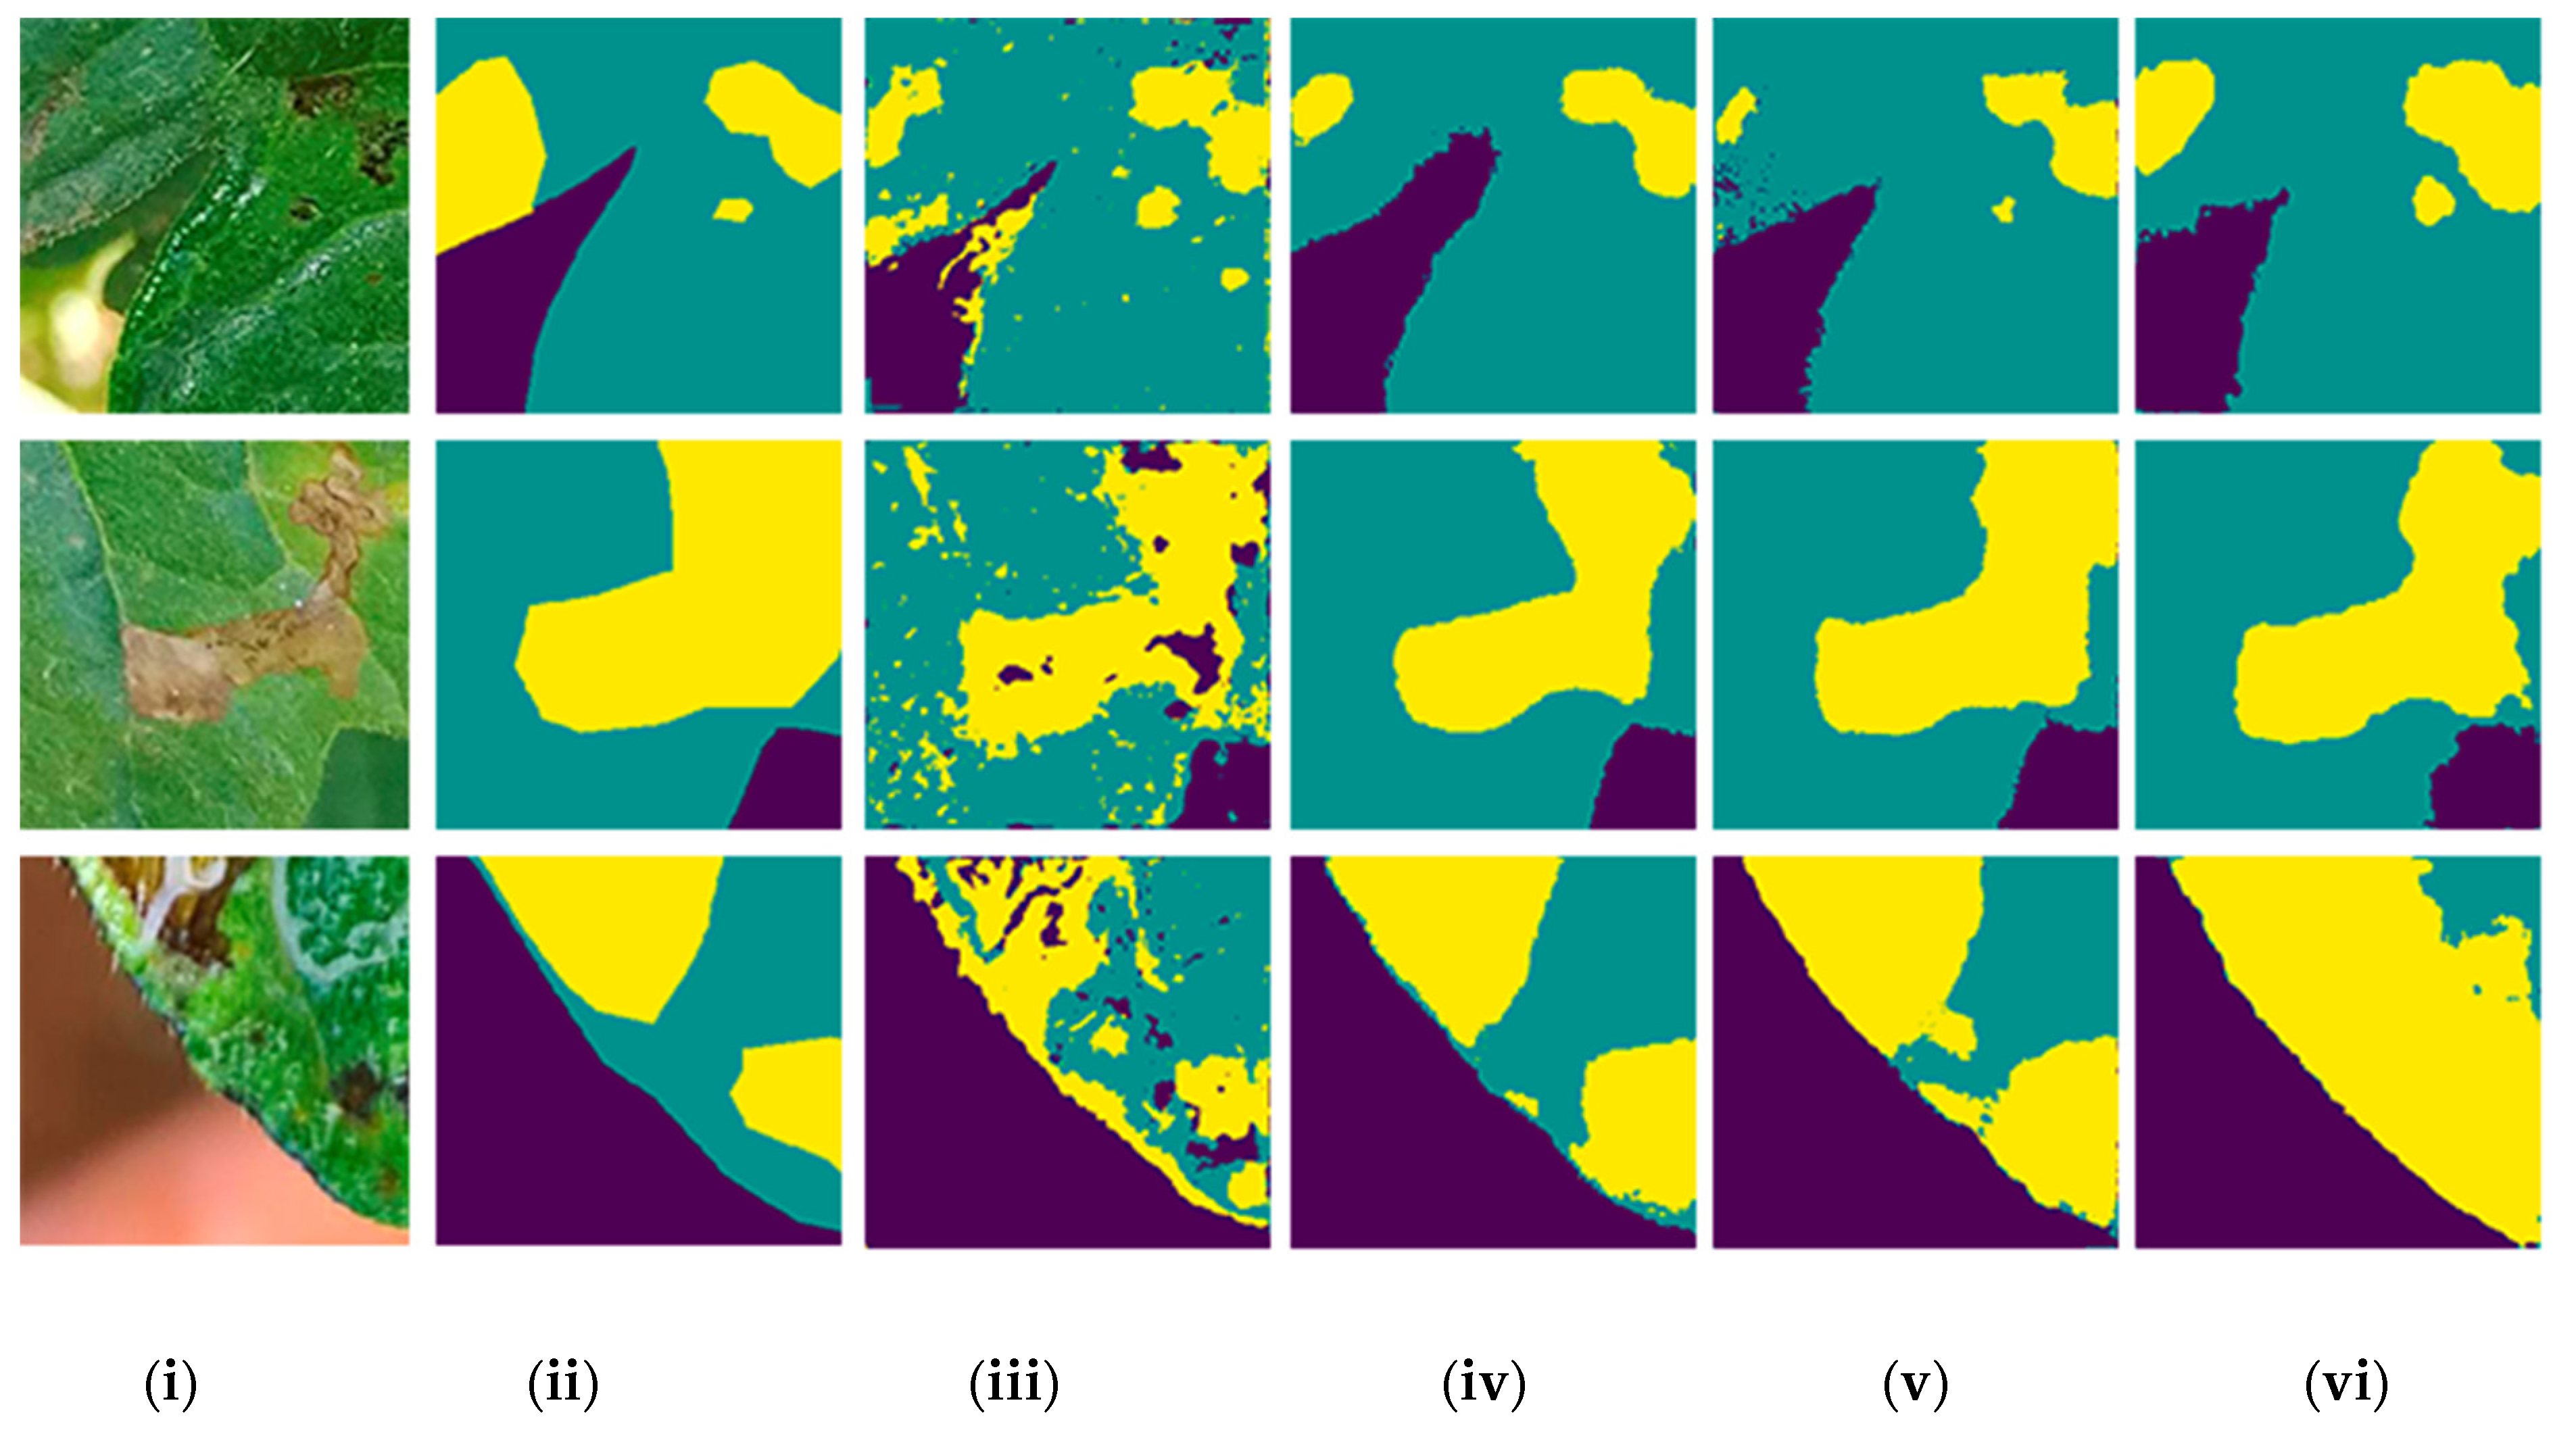
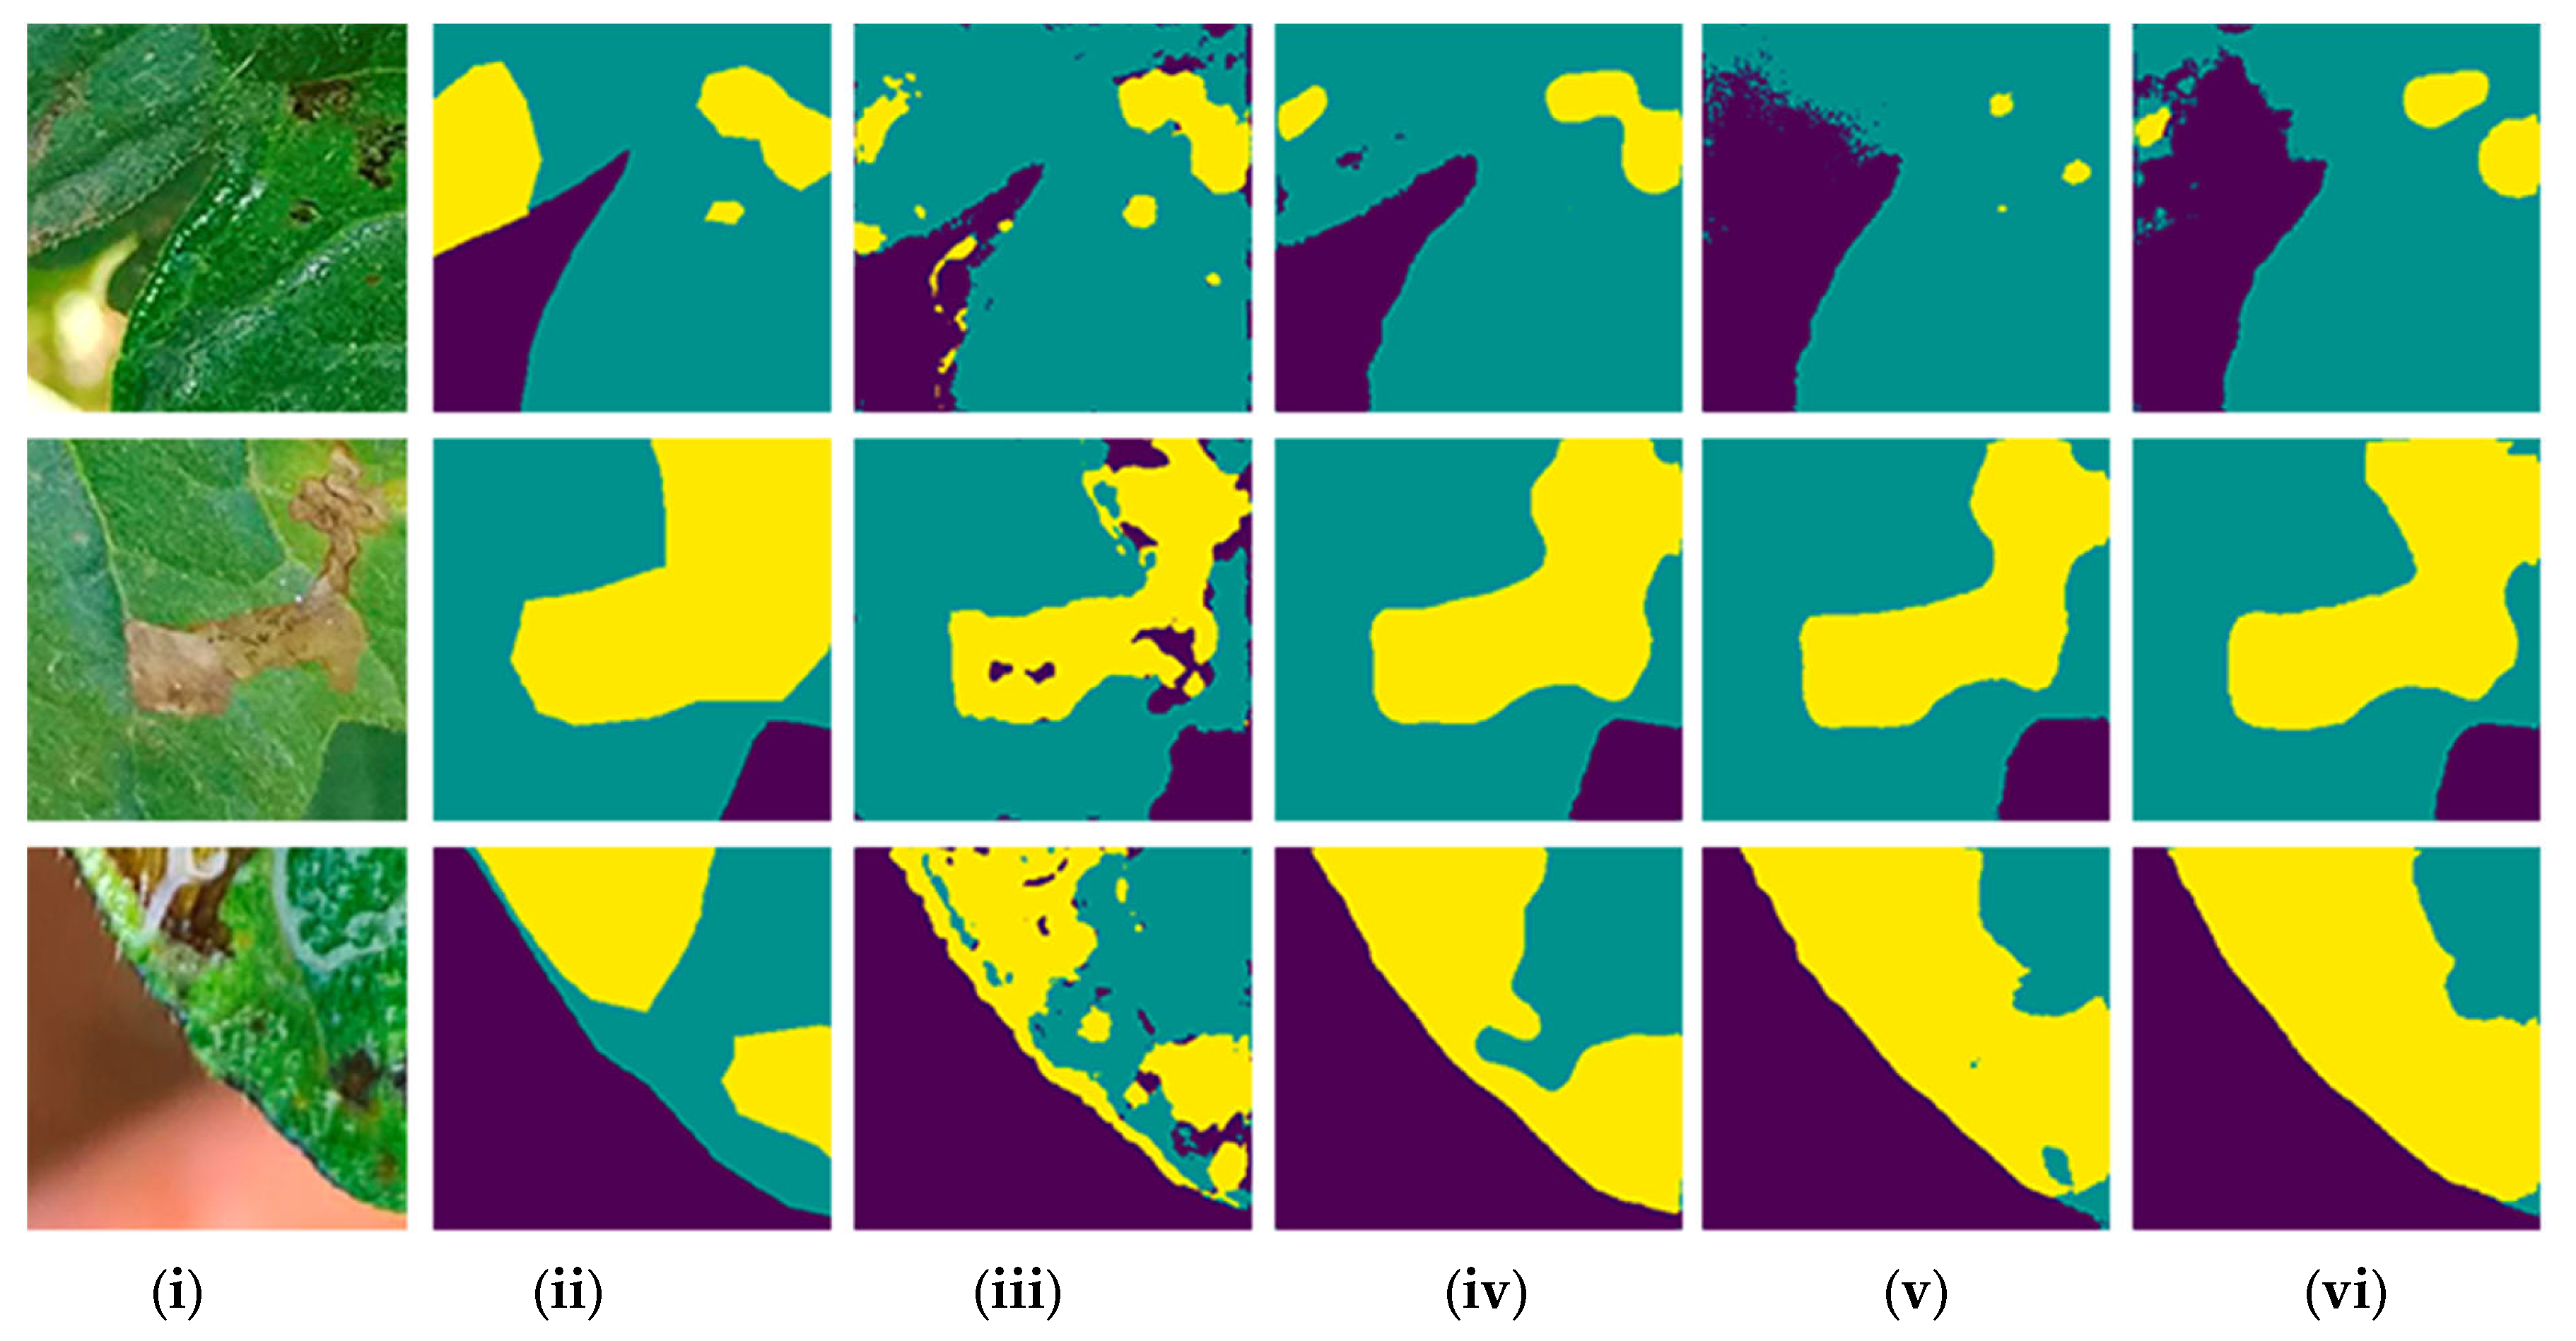
Figure 3, Figure 4 and Figure 5 show the results of the multiclass semantic segmentation performed by the different CNN models and backbones on the testing database. This visual comparison with the reference mask, which was manually annotated, and the images predicted by the models reveals a better segmentation of classes 1 and 2 by the U-Net model with the Inceptionv3 backbone. For class 3, the FPN model with the DenseNet121 backbone achieved better segmentation owing to the higher IoU values obtained by this model. For the tested backbones, the best segmentation was obtained using DenseNet121 and Inceptionv3. The worst result was obtained using VGG16 for all three models.

3.2. Severity Estimated by Models

The severity of the leaf symptoms caused by the leafminer fly in tomato crops was evaluated using masks manually annotated with masks predicted at the pixel level by the U-Net, FPN, and LinkNet segmentation models. The relationship between the total area comprising the pixels of the leaf class and that of the symptom class was obtained, as determined by Equation (5). Figure 6, Figure 7 and Figure 8 show predicted severity and reference severity (observed) scatter plots. In addition, the figures show the R², RMSE, and MAE metrics. The R² metrics were calculated based on a linear regression between prediction and reference severity. Greater values of R² and lower values of RMSE and MAE indicate better models. The FPN models gave better estimates of leaf symptom severity when the reference masks (i.e., manually annotated) were used as input data for training the models, with the Inceptionv3 backbone having the lowest root mean square error (RMSE) value (Figure 6).
The U-Net models obtained the second-best result among the trained models, exhibiting intermediate RMSE values when compared with those of the others (Figure 7). Inceptionv3 and ResNet34 backbones for the U-Net model had the lowest RMSE values. The LinkNet model exhibited the worst performance (Figure 8). The LinkNet models overestimated the severity of leaf symptoms and erroneously classified the pixels that constituted the classes.

4. Discussion

Among the models analyzed in this study, U-Net gave the best results on the testing database. It is a full CNN with two blocks that uses line-by-line convolution. Therefore, its performance was equal to that of the dense layer of a traditional CNN. In the contraction block, each pooling operation degrades the resolution of the image, and because this is an irreversible operation, there is a loss of spatial information of small targets [45], which is probably the reason for the lower performance compared to that of the other networks.
The FPN model achieved the second-best performance in the overall score, although the IoU results obtained for each symptom class were in question. A possible explanation is that the FPN utilizes a descending stochastic gradient and a horizontally connected structure that combines low resolution, robust semantic features with high resolution, and weak semantic features for the detection and segmentation of small targets, such as those sampled by the symptom class [30]. Compared with the results reported in the literature, the results obtained in this study are satisfactory for the same operation in a considerably smaller database for the semantic segmentation task. For instance, Gonçalves et al. [46] obtained IoU values from 64.7% to 79.4% for leaf symptoms caused by coffee leafminers, soybean rust, and wheat tan spot.
The LinkNet model gave the worst results for overall segmentation. However, when evaluating the IoU for the symptom class, it produced a slightly inferior result compared with the FPN model. LinkNet is a fully convolutional network that is widely used for semantic segmentation tasks, focusing on rapid prediction based on an encoder–decoder structure. To ensure no loss of pixel location information in the encoding part of the model, LinkNet directly propagates the spatial information from the encoder to the decoder at the same level, which may explain this result [32]. In addition, the time and operations required to relearn lost features are reduced, thus leading to a significant reduction in processing time.
The experiments revealed that the DenseNet121 backbone achieved better IoU results in all segmentation models, except for U-Net, because it was able to sample more pixels referring to the symptom class. Theoretically, deeper networks are expected to perform better in semantic segmentation tasks. However, the experimental results showed the opposite when comparing the number of trainable parameters per model and the backbone (Table 3). A possible explanation is that the size of the database used in this study was small, requiring deeper networks [47].
In terms of RMSE values, the best severity estimate of leafminer fly symptoms was obtained using the FPN model with the backbones ResNet34 and Inceptionv3. The models trained with U-Net and the Inceptionv3 backbone estimated the second-best severity of leafminer fly symptoms. These RMSE results also confirm the higher values of IoU obtained for both the FPN and U-Net models. The LinkNet models overestimated the severity, as verified by the IoU values found for the classes presented and by the visual comparison made in the present study, which indicated poor classification of the classes in the masks predicted by the model. The LinkNet model was developed to process high-resolution aerial images, which may explain this result. The resolution used in this study may have been insufficient, causing a decrease in performance. In addition, the number of targets used was relatively small, which affected the detection accuracy [14,48].
The results obtained demonstrate that it is possible to perform segmentation and estimation of the severity of leaf symptoms in images with the current challenges existing in semantic segmentation tasks, such as capturing images directly in fields with complex backgrounds and variable lighting [20]. In addition, the proposed method is nondestructive, with no need to remove the leaves to capture images in an environment with controlled lighting and homogeneous background, unlike what has been addressed in the literature [49].
The values of the mostly used evaluation metrics in machine learning studies, such as accuracy, precision, and recall, were higher than those of IoU, which was expected. None of these metrics were considered adequate for multiclass semantic segmentation precisely because of the imbalance of the sampled classes, which is common in semantic segmentation tasks [50,51] in which the precision of the most sampled classes ends up shadowing the imprecision of the smallest classes. Therefore, IoU has been recommended for leafminer fly symptom severity estimation, as it better reflects the quality of the segmentation [23]. It was possible to confirm the difficulty of segmentation of fewer sampled classes, despite the use of focal loss, by using the IoU values separately.
The importance of transfer learning in machine learning, specifically in semantic segmentation using a small database, is evident. The lack of data, especially annotated data, is one of the limitations of CNN models [13]. The annotation of images is a supervised process and can be very time-consuming and challenging, depending on the size and quantity of objects to be annotated in the images and the number of classes present. Collecting images under real field conditions, previous annotation, and subsequent sharing of data with the scientific community would encourage the consolidation of machine and deep learning in various areas of agriculture.
Future research should consider the use of (i) videos rather than digital images and (ii) CNN YOLO v2 or v3 (You Only Look Once), which has several benefits and is widely used for instance segmentation. This segmentation method combines object detection and semantic segmentation to distinguish different objects in a scene. It provides different identifiers for different objects and can simultaneously evaluate different symptoms. In addition, using different backbones trained in different datasets and a considerably more extensive database could improve model performance.

5. Conclusions

In this study, the severity of leafminer fly symptoms in tomato leaves was experimentally compared using different deep CNNs and backbones. The results show that the U-Net network achieves better performance in segmenting the background and leaf area classes. The FPN model has a greater capacity for segmentation of the symptom class, exhibiting slightly better performance than the others in predicting small and less sampled targets, even when using a small database. The experimental results also demonstrate that Inceptionv3 and DenseNet121 backbones could provide the best performance for the semantic segmentation network of small targets in complex backgrounds with variations in lighting and multiple occlusions. The backbones VGG16 and ResNet34 exhibited the worst results.
In conclusion, the segmentation of symptoms under the complex conditions presented in this study, with images captured in a field with a complex background and irregular lighting, is feasible. This can serve as front-end decision support for developing an automatic pest identification system attached to tractors and farm implements directly in the field.

Author Contributions

G.M.C. conceptualized the study, collected the data, conducted the experiments, analyzed the results, and wrote the manuscript. D.S.M.V., D.M.d.Q., E.I.F.-F. and M.C.P. discussed the experiments and reviewed the manuscript. A.M. reviewed and corrected the manuscript. All authors have read and agreed to the published version of the manuscript.

Funding

The authors thank the National Council for Scientific and Technological Development (CNPq), Brazil, for its support with a scholarship throughout the research period. This study was supported by the Coordination for the Improvement of Higher Education Personnel–Brazil (CAPES), Financial Code 001, and FAPEMIG.

Data Availability Statement

The data used for the analysis of the results, conclusion of the study, and construction of the graphs are publicly available at https://osf.io/suh7m/. The data were stored in the images and spreadsheets. (Uploaded on 16 May 2022).

Conflicts of Interest

The authors declare that they have no competing financial interests or personal relationships that may have influenced the study reported in this article.

References

  1. FAO, FAOSTAT—Food and Agriculture Organization of the United Nations. Statistical Database 2020. 2020. Available online: http://faostat.fao.org (accessed on 17 December 2020).
  2. Nalam, V.; Louis, J.; Shah, J. Plant defense against aphids, the pest extraordinaire. Plant Sci. 2019, 279, 96–107. [Google Scholar] [CrossRef] [PubMed]
  3. Gusmão, M.R.; Picanço, M.; Leite, G.L.; Moura, M.F. Seletividade de inseticidas a predadores de pulgões. Hortic. Bras. 2000, 18, 130–133. [Google Scholar] [CrossRef] [Green Version]
  4. Picanço, M.C.; Bacci, L.; Crespo, A.L.B.; Miranda, M.M.M.; Martins, J.C. Effect of integrated pest management practices on tomato production and conservation of natural enemies. Agric. For. Entomol. 2007, 9, 327–335. [Google Scholar] [CrossRef]
  5. Gilbertson, R.L.; Batuman, O. Emerging viral and other diseases of processing tomatoes: Biology, diagnosis and management. Acta Hortic. 2013, 971, 35–48. [Google Scholar] [CrossRef]
  6. Liu, J.; Wang, X. Tomato diseases and pests detection based on improved YOLO V3 convolutional neural network. Front. Plant Sci. 2020, 11, 898. [Google Scholar] [CrossRef] [PubMed]
  7. Scheffer, S.J.; Hawthorne, D.J. Molecular evidence of host-associated genetic divergence in the holly leafminer Phytomyza glabricola (Diptera: Agromyzidae): Apparent discordance among marker systems. Mol. Ecol. 2007, 16, 2627–2637. [Google Scholar] [CrossRef] [PubMed]
  8. Johnson, M.W.; Welter, S.C.; Toscano, N.C.; Ting, P.I.; Trumble, J.T. Reduction of tomato leaf photosynthesis rates by mining activity of Liriomyza sativae (Diptera: Agromyzidae). J. Econ. Entomol. 1983, 76, 1061–1063. [Google Scholar] [CrossRef]
  9. Zhang, J.; Huang, Y.; Pu, R.; Gonzalez-Moreno, P.; Yuan, L.; Wu, K.; Huang, W. Monitoring plant diseases and pests through remote sensing technology: A review. Comput. Electron. Agric. 2019, 165, 104943. [Google Scholar] [CrossRef]
  10. Moura, A.P.; Michereff Filho, M.; Guimarães, J.A.; Liz, R.S. Manejo Integrado de Pragas do Tomateiro para Processamento Industrial; Circular Técnica; Embrapa: Brasilia, Brazil, 2014; Volume 129. [Google Scholar]
  11. Lin, T.L.; Chang, H.Y.; Chen, K.H. The pest and disease identification in the growth of sweet peppers using faster R-CNN and mask R-CNN. J. Internet Technol. 2020, 21, 605–614. [Google Scholar]
  12. Wang, K.; Zhang, S.; Wang, Z.; Liu, Z.; Yang, F. Mobile smart device-based vegetable disease and insect pest recognition method. Intell. Autom. Soft Comput. 2013, 19, 263–273. [Google Scholar] [CrossRef]
  13. Barbedo, J.G.A. Detecting and classifying pests in crops using proximal images and machine learning: A review. AI 2020, 1, 312–328. [Google Scholar] [CrossRef]
  14. Bock, C.H.; Barbedo, J.G.; Del Ponte, E.M.; Bohnenkamp, D.; Mahlein, A.K. From visual estimates to fully automated sensor-based measurements of plant disease severity: Status and challenges for improving accuracy. Phytopathol. Res. 2020, 2, 9. [Google Scholar] [CrossRef] [Green Version]
  15. Dawei, W.; Limiao, D.; Jiangong, N.; Jiyue, G.; Hongfei, Z.; Zhongzhi, H. Recognition pest by image-based transfer learning. J. Sci. Food Agric. 2019, 99, 4524–4531. [Google Scholar] [CrossRef] [PubMed]
  16. Liu, T.; Chen, W.; Wu, W.; Sun, C.; Guo, W.; Zhu, X. Detection of aphids in wheat fields using a computer vision technique. Biosyst. Eng. 2016, 141, 82–93. [Google Scholar] [CrossRef]
  17. Fuentes, A.; Yoon, S.; Kim, S.C.; Park, D.S. A robust deep-learning-based detector for real-time tomato plant diseases and pests recognition. Sensors 2017, 17, 2022. [Google Scholar] [CrossRef] [Green Version]
  18. Huang, M.; Wan, X.; Zhang, M.; Zhu, Q. Detection of insect-damaged vegetable soybeans using hyperspectral transmittance image. J. Food Eng. 2013, 116, 45–49. [Google Scholar] [CrossRef]
  19. Ma, Y.; Huang, M.; Yang, B.; Zhu, Q. Automatic threshold method and optimal wavelength selection for insect-damaged vegetable soybean detection using hyperspectral images. Comput. Electron. Agric. 2014, 106, 102–110. [Google Scholar] [CrossRef]
  20. Barbedo, J.G.A. A review on the main challenges in automatic plant disease identification based on visible range images. Biosyst. Eng. 2016, 144, 52–60. [Google Scholar] [CrossRef]
  21. Divya, B.; Santhi, M. SVM-based pest classification in agriculture field. Int. J. Recent Technol. Eng. 2019, 7, 150–155. [Google Scholar]
  22. Mustafa, W.A.; Yazid, H. Illumination and contrast correction strategy using bilateral filtering and binarization comparison. J. Telecommun. Electron. Comput. Eng. 2016, 8, 67–73. [Google Scholar]
  23. Chen, S.; Zhang, K.; Zhao, Y.; Sun, Y.; Ban, W.; Chen, Y.; Zhuang, H.; Zhang, X.; Liu, J.; Yang, T. An approach for rice bacterial leaf streak disease segmentation and disease severity estimation. Agriculture 2021, 11, 420. [Google Scholar] [CrossRef]
  24. Cheng, X.; Zhang, Y.; Chen, Y.; Wu, Y.; Yue, Y. Pest identification via deep residual learning in complex background. Comput. Electron. Agric. 2017, 141, 351–356. [Google Scholar] [CrossRef]
  25. Chowdhury, M.E.; Rahman, T.; Khandakar, A.; Ayari, M.A.; Khan, A.U.; Khan, M.S.; Al-Emadi, N.; Reaz, M.B.I.; Islam, M.T.; Ali, S.H.M. Automatic and reliable leaf disease detection using deep learning techniques. AgriEngineering 2021, 3, 294–312. [Google Scholar] [CrossRef]
  26. Fuentes, A.F.; Yoon, S.; Lee, J.; Park, D.S. High-performance deep neural network-based tomato plant diseases and pests diagnosis system with refinement filter bank. Front. Plant Sci. 2018, 9, 1–15. [Google Scholar] [CrossRef] [PubMed] [Green Version]
  27. Hidayatuloh, A.; Nursalman, M.; Nugraha, E. Identification of tomato plant diseases by leaf image using squeezenet model. In Proceedings of the 2018 International Conference on Information Technology Systems and Innovation, ICITSI 2018, Bandung, Indonesia, 22–26 October 2018; pp. 199–204. [Google Scholar]
  28. Weng, W.; Zhu, X. INet: Convolutional networks for biomedical image segmentation. IEEE Access 2021, 9, 16591–16603. [Google Scholar] [CrossRef]
  29. Ronneberger, O.; Fischer, P.; Brox, T. U-Net: Convolutional networks for biomedical image segmentation. In Proceedings of the International Conference on Medical Image Computing and Computer-assisted Intervention, Munich, Germany, 5–9 October 2015; Springer: Berlin/Heidelberg, Germany, 2015; pp. 234–241. [Google Scholar]
  30. Lin, T.Y.; Dollár, P.; Girshick, R.; He, K.; Hariharan, B.; Belongie, S. Feature pyramid networks for object detection. In Proceedings of the 30th IEEE Conference on Computer Vision and Pattern Recognition, CVPR 2017, Honolulu, HI, USA, 21–26 July 2017; pp. 936–944. [Google Scholar]
  31. Seferbekov, S.; Iglovikov, V.; Buslaev, A.; Shvets, A. Feature pyramid network for multi-class land segmentation. In Proceedings of the IEEE Computer Society Conference on Computer Vision and Pattern Recognition Workshops, Salt Lake City, UT, USA, 18–22 June 2018; pp. 272–275. [Google Scholar]
  32. Chaurasia, A.; Culurciello, E. LinkNet: Exploiting encoder representations for efficient semantic segmentation. In Proceedings of the 2017 IEEE Visual Communications and Image Processing, IEEE, St. Petersburg, FL, USA, 10–13 December 2017; pp. 1–4. [Google Scholar]
  33. Dhiman, P.; Kukreja, V.; Manoharan, P.; Kaur, A.; Kamruzzaman, M.M.; Dhaou, I.B.; Iwendi, C. A novel deep learning model for detection of severity level of the disease in citrus fruits. Electronics 2022, 11, 495. [Google Scholar] [CrossRef]
  34. Wang, J.; Perez, L. The effectiveness of data augmentation in image classification using deep learning. Convolutional Neural Netw. Vis. Recognit. 2017, 11, 1–8. [Google Scholar]
  35. Takahashi, R.; Matsubara, T.; Uehara, K. Data augmentation using random image cropping and patching for deep CNNs. IEEE Trans. Circuits Syst. Video Technol. 2020, 30, 2917–2931. [Google Scholar] [CrossRef] [Green Version]
  36. Szegedy, C.; Vanhoucke, V.; Ioffe, S.; Shlens, J.; Wojna, Z. Rethinking the inception architecture for computer vision. In Proceedings of the IEEE Computer Society Conference on Computer Vision and Pattern Recognition, Las Vegas, NV, USA, 27–30 June 2016; pp. 2818–2826. [Google Scholar]
  37. Russakovsky, O.; Deng, J.; Su, H.; Krause, J.; Satheesh, S.; Ma, S.; Huang, Z.; Karpathy, A.; Khosla, A.; Bernstein, M.; et al. ImageNet large scale visual recognition challenge. Int. J. Comput. Vis. 2015, 115, 211–252. [Google Scholar] [CrossRef] [Green Version]
  38. Freudenberg, M.; Nölke, N.; Agostini, A.; Urban, K.; Wörgötter, F.; Kleinn, C. Large scale palm tree detection in high resolution satellite images using U-Net. Remote Sens. 2019, 11, 312. [Google Scholar] [CrossRef] [Green Version]
  39. Wang, C.; Zhao, Z.; Yu, Y. Fine retinal vessel segmentation by combining nest U-Net and patch-learning. Soft Comput. 2021, 25, 5519–5532. [Google Scholar] [CrossRef]
  40. Jadon, S. A survey of loss functions for semantic segmentation. In Proceedings of the 2020 IEEE Conference on Computational Intelligence in Bioinformatics and Computational Biology, CIBCB 2020, Online. 27–29 October 2020. [Google Scholar]
  41. Lin, T.Y.; Goyal, P.; Girshick, R.; He, K.; Dollár, P. Focal loss for dense object detection. IEEE Trans. Pattern Anal. Mach. Intell. 2020, 42, 318–327. [Google Scholar] [CrossRef] [PubMed] [Green Version]
  42. Bock, C.H.; Parker, P.E.; Cook, A.Z.; Gottwald, T.R. Characteristics of the perception of different severity measures of citrus canker and the relationships between the various symptom types. Plant Dis. 2008, 92, 927–939. [Google Scholar] [CrossRef] [PubMed] [Green Version]
  43. Bock, C.H.; Poole, G.H.; Parker, P.E.; Gottwald, T.R. Plant disease severity estimated visually, by digital photography and image analysis, and by hyperspectral imaging. Crit. Rev. Plant Sci. 2010, 29, 59–107. [Google Scholar] [CrossRef]
  44. Madden, L.; Hughes, G.; Van Den Bosch, F. Measuring Plant Diseases. In the Study of Plant Disease Epidemics; American Phytopathological Society: St. Paul, MN, USA, 2007; pp. 11–31. [Google Scholar]
  45. Piao, S.; Liu, J. Accuracy improvement of UNet based on dilated convolution. J. Phys. Conf. Ser. 2019, 1345, 052066. [Google Scholar] [CrossRef]
  46. Gonçalves, J.P.; Pinto, F.A.C.; Queiroz, D.M.; Villar, F.M.M.; Barbedo, J.G.A.; Del Ponte, E.M. Deep learning architectures for semantic segmentation and automatic estimation of severity of foliar symptoms causedby diseases or pests. Biosyst. Eng. 2021, 210, 129–142. [Google Scholar] [CrossRef]
  47. Torres, D.L.; Feitosa, R.Q.; Happ, P.N.; La Rosa, L.E.C.; Marcato Junior, J.; Martins, J.; Bressan, P.O.; Gonçalves, W.N.; Liesenberg, V. Applying fully convolutional architectures for semantic segmentation of a single tree species in urban environment on high resolution UAV optical imagery. Sensors 2020, 20, 563. [Google Scholar] [CrossRef] [Green Version]
  48. Zhu, Q.; Zheng, Y.; Jiang, Y.; Yang, J. Efficient multi-class semantic segmentation of high resolution aerial imagery with dilated linknet. In Proceedings of the International Geoscience and Remote Sensing Symposium (IGARSS), Yokohama, Japan, 28 July–2 August 2019; pp. 1065–1068. [Google Scholar]
  49. Esgario, J.G.; Krohling, R.A.; Ventura, J.A. Deep learning for classification and severity estimation of coffee leaf biotc stress. Comput. Eletronics Agric. 2020, 169, 105162. [Google Scholar] [CrossRef] [Green Version]
  50. Cui, B.; Chen, X.; Lu, Y. Semantic segmentation of remote sensing images using transfer learning and deep convolutional neural network with dense connection. IEEE Access 2020, 8, 116744–116755. [Google Scholar] [CrossRef]
  51. Rahman, M.A.; Wang, Y. Optimizing intersection-over-union in deep neural networks for image segmentation. In Lecture Notes in Computer Science; including subseries Lecture Notes in Artificial Intelligence and Lecture Notes in Bioinformatics; Springer International publishing: Las Vegas, NV, USA, 2016; Volume 10072, pp. 234–244. [Google Scholar]
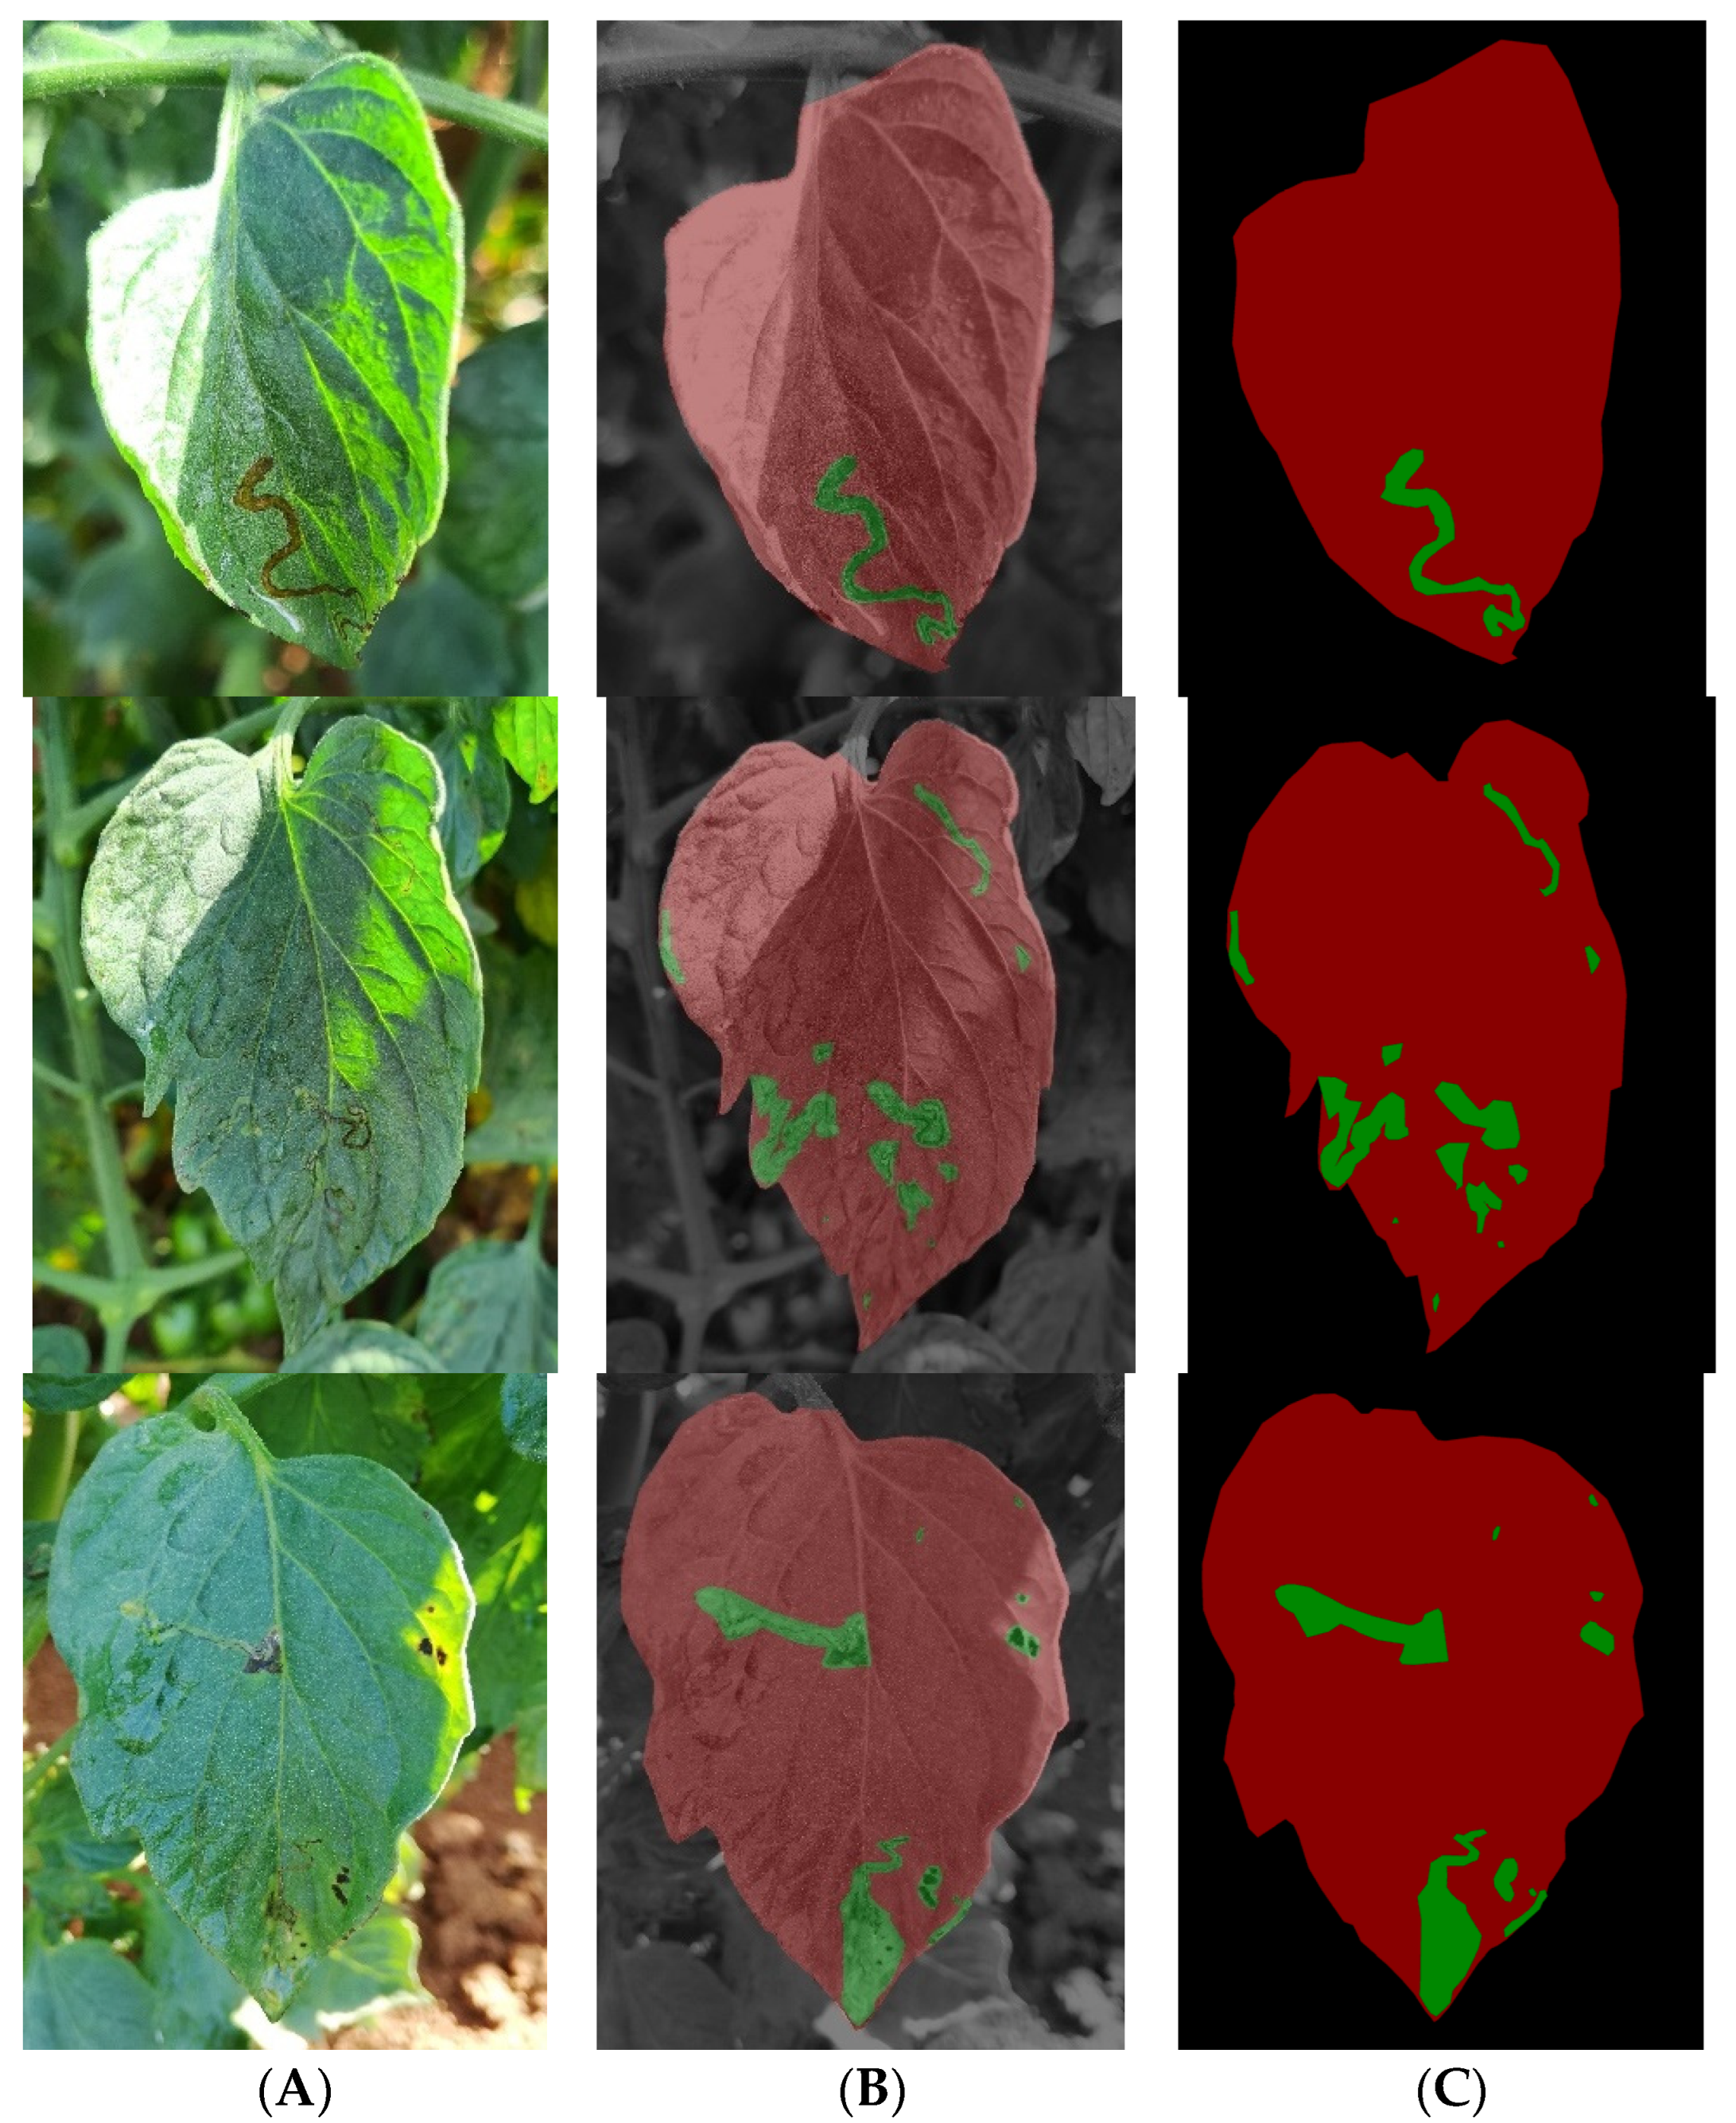
Figure 1. Examples of (A) the original image, (B) polygons manually generated from regions of interest, and (C) results of the reference masks with the three annotated classes. The background is black, the leaf of interest is red, and pest symptom is green.
Agriengineering 05 00018 g001
Figure 2. Flowchart of the semantic segmentation experiment using the transfer learning technique.
Agriengineering 05 00018 g002
Figure 3. Visual comparison of the results of the multiclass semantic segmentation from the FPN model performed on the testing database. (i) Original image, (ii) reference annotation, (iii) VGG16, (iv) DenseNet121, (v) Inceptionv3, (vi) ResNet34. The background class is purple, the tomato leaf class is green, and the leafminer fly symptom class is yellow.
Agriengineering 05 00018 g003
Figure 4. Visual comparison of the results of the multiclass semantic segmentation from the LinkNet model performed on the testing database. (i) Original image, (ii) reference annotation, (iii) VGG16, (iv) DenseNet121, (v) Inceptionv3, (vi) ResNet34. The background class is purple, the tomato leaf class is green, and the leafminer fly symptom class is yellow.
Agriengineering 05 00018 g004
Figure 5. Visual comparison of the results of the multiclass semantic segmentation from the U-Net model performed on the testing database. (i) Original image, (ii) reference annotation, (iii) VGG16, (iv) DenseNet121, (v) Inceptionv3, (vi) ResNet34. The background class is purple, the tomato leaf class is green, and the leafminer fly symptom class is yellow.
Agriengineering 05 00018 g005
Figure 6. Scatter plots of the first-order regression line for the relationship between reference severity obtained from reference masks (manually annotated) and the severity estimated by using the FPN model and different backbones.
Agriengineering 05 00018 g006
Figure 7. Scatter plots of the first-order regression line for the relationship between reference severity obtained from reference masks (manually annotated) and the severity estimated by using the U-Net model and different backbones.
Agriengineering 05 00018 g007
Figure 8. Scatter plots of the first-order regression line for the relationship between reference severity obtained from reference masks (manually annotated) and the severity estimated by using the LinkNet model and different backbones.
Agriengineering 05 00018 g008
Table 1. Performance summary of the best and worst models used for the prediction of class 1 (background area), class 2 (leaf area), and class 3 (leafminer fly symptom) in the validation data during the training processing.
CategoryDeep Learning ModelBackboneClassAverage IoU (%)
Best modelsU-NetInceptionv3Background86
U-NetInceptionv3Leaf87
FPNDenseNet121Symptoms61
Worst modelsU-NetVGG16Background65
LinkNetVGG16Leaf69
LinkNetVGG16Symptoms25
Table 2. Performance summary of the U-Net, LinkNet, and FPN models and backbones in the testing database.
Deep Learning ModelBackboneTest Accuracy (%)Average Precision
(%)
Average Recall
(%)
Average IoU
(%)
U-NetVGG1683.9080.6378.3161.76
ResNet3490.0086.6385.8172.73
Inceptionv391.5887.8487.5977.71
DenseNet12191.2587.8387.7476.33
LinkNetVGG1681.2373.9467.8753.03
ResNet3488.6684.6284.7773.21
Inceptionv391.0687.0987.3975.67
DenseNet12190.7287.0086.7975.99
FPNVGG1689.2785.5884.3173.12
ResNet3490.5387.2986.2774.61
Inceptionv391.1087.9886.8275.12
DenseNet12191.5688.6387.7176.62
Table 3. Number of trainable parameters per model and backbone.
BackboneDeep Learning Model
U-NetLinkNetFPN
Trainable ParametersTrainable ParametersTrainable Parameters
VGG1623,748,53120,318,61117,572,547
ResNet3424,439,09421,620,11823,915,590
Inceptionv329,896,97926,228,24324,994,851
DenseNet12112,059,6358,267,4119,828,099
Disclaimer/Publisher’s Note: The statements, opinions and data contained in all publications are solely those of the individual author(s) and contributor(s) and not of MDPI and/or the editor(s). MDPI and/or the editor(s) disclaim responsibility for any injury to people or property resulting from any ideas, methods, instructions or products referred to in the content.