Classification of Soymilk and Tofu with Diffuse Reflection Light Using a Deep Learning Technique


Abstract

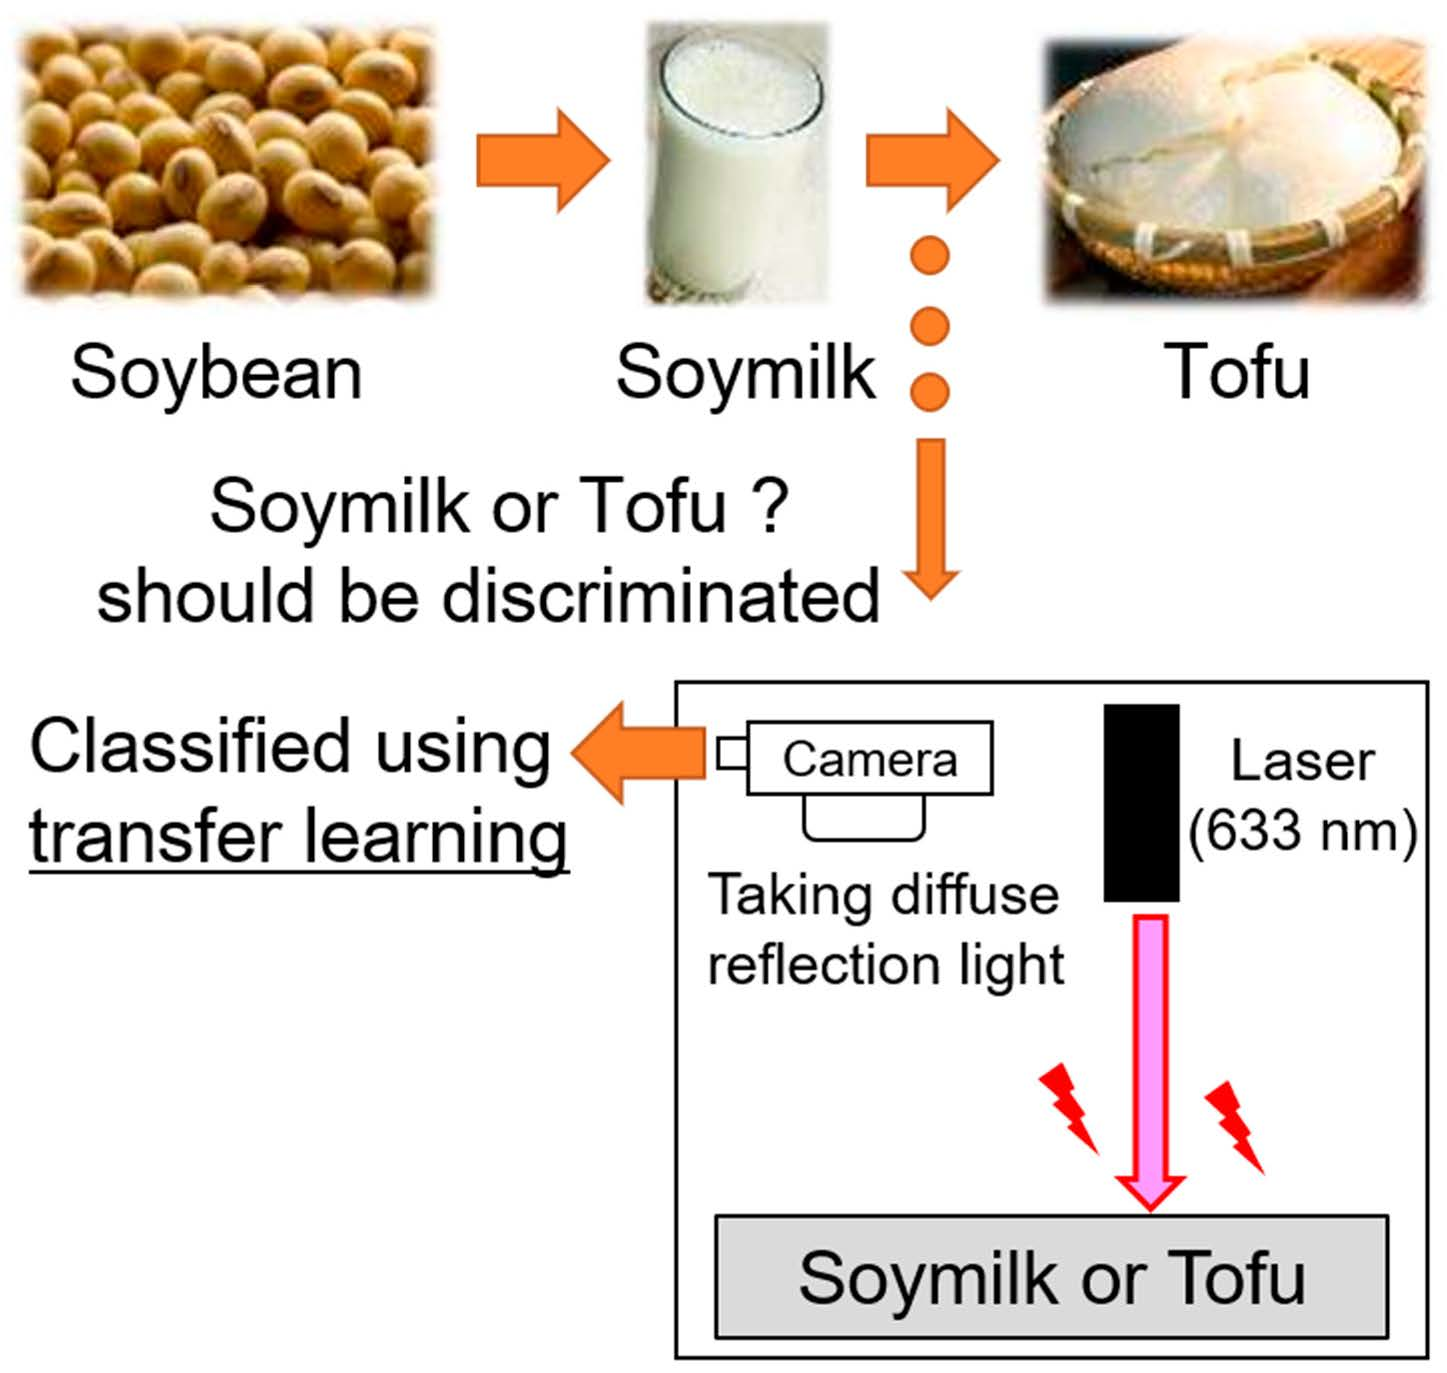
1. Introduction
2. Materials and Methods
2.1. Sample Preparation
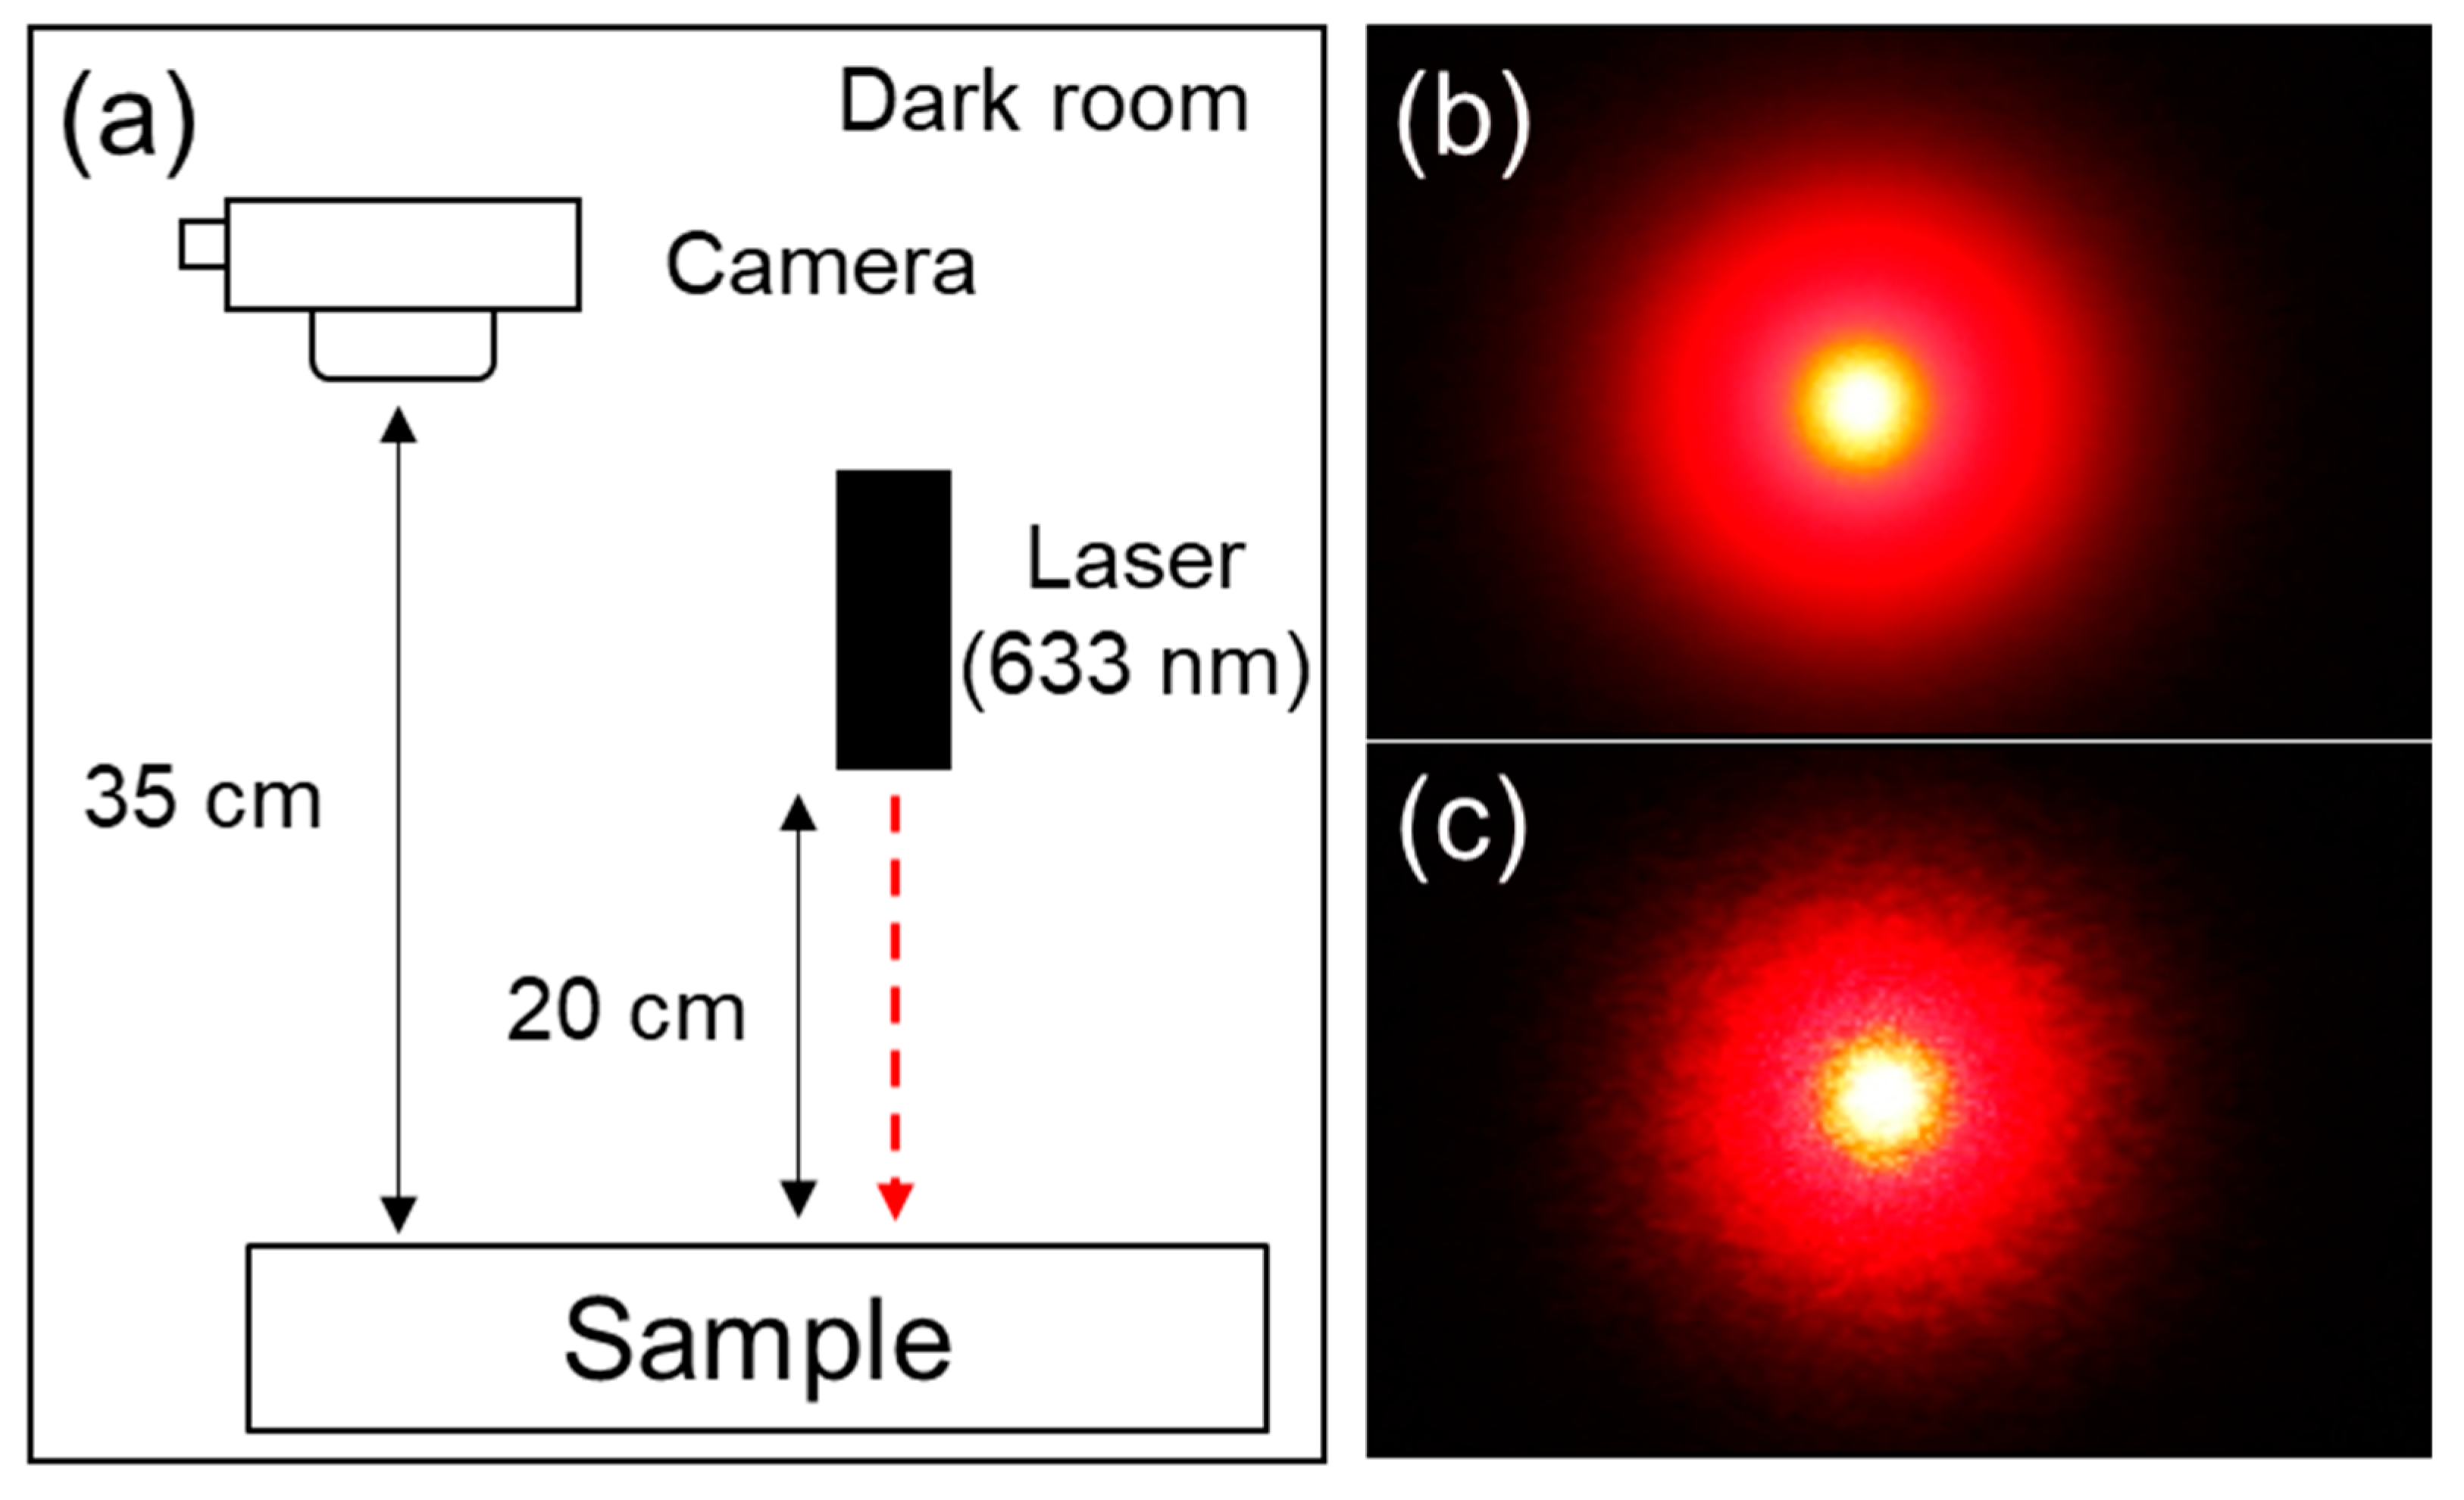
2.2. Experimental Setup
2.3. Training of Classifier via Deep Learning Technique
2.3.1. Data for Classification
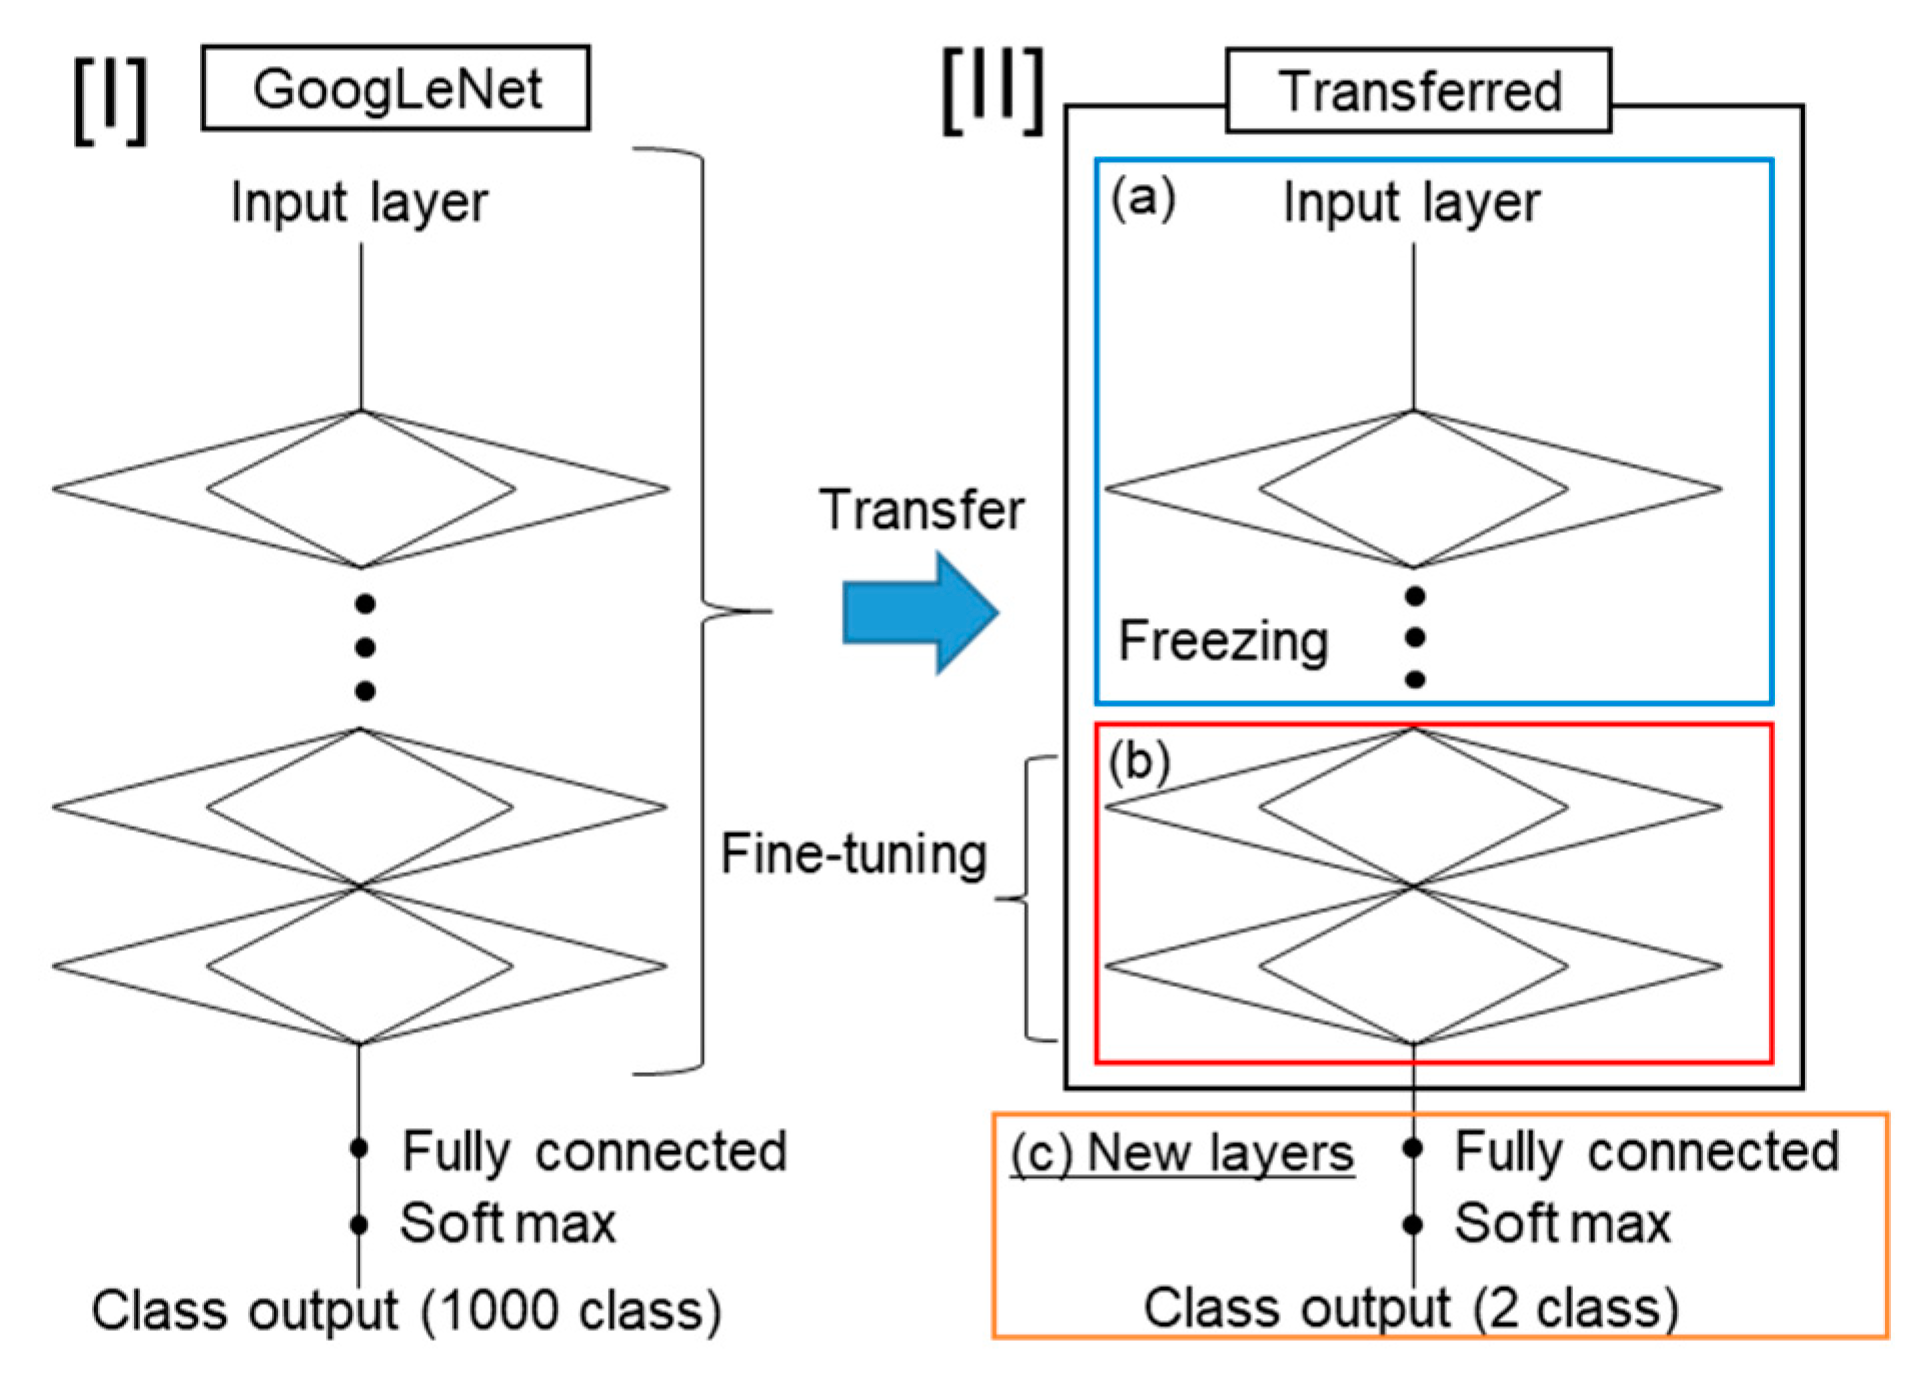
2.3.2. Network Architecture
2.3.3. Hyperparameter Settings
3. Results and Discussion
3.1. Classification Accuracy
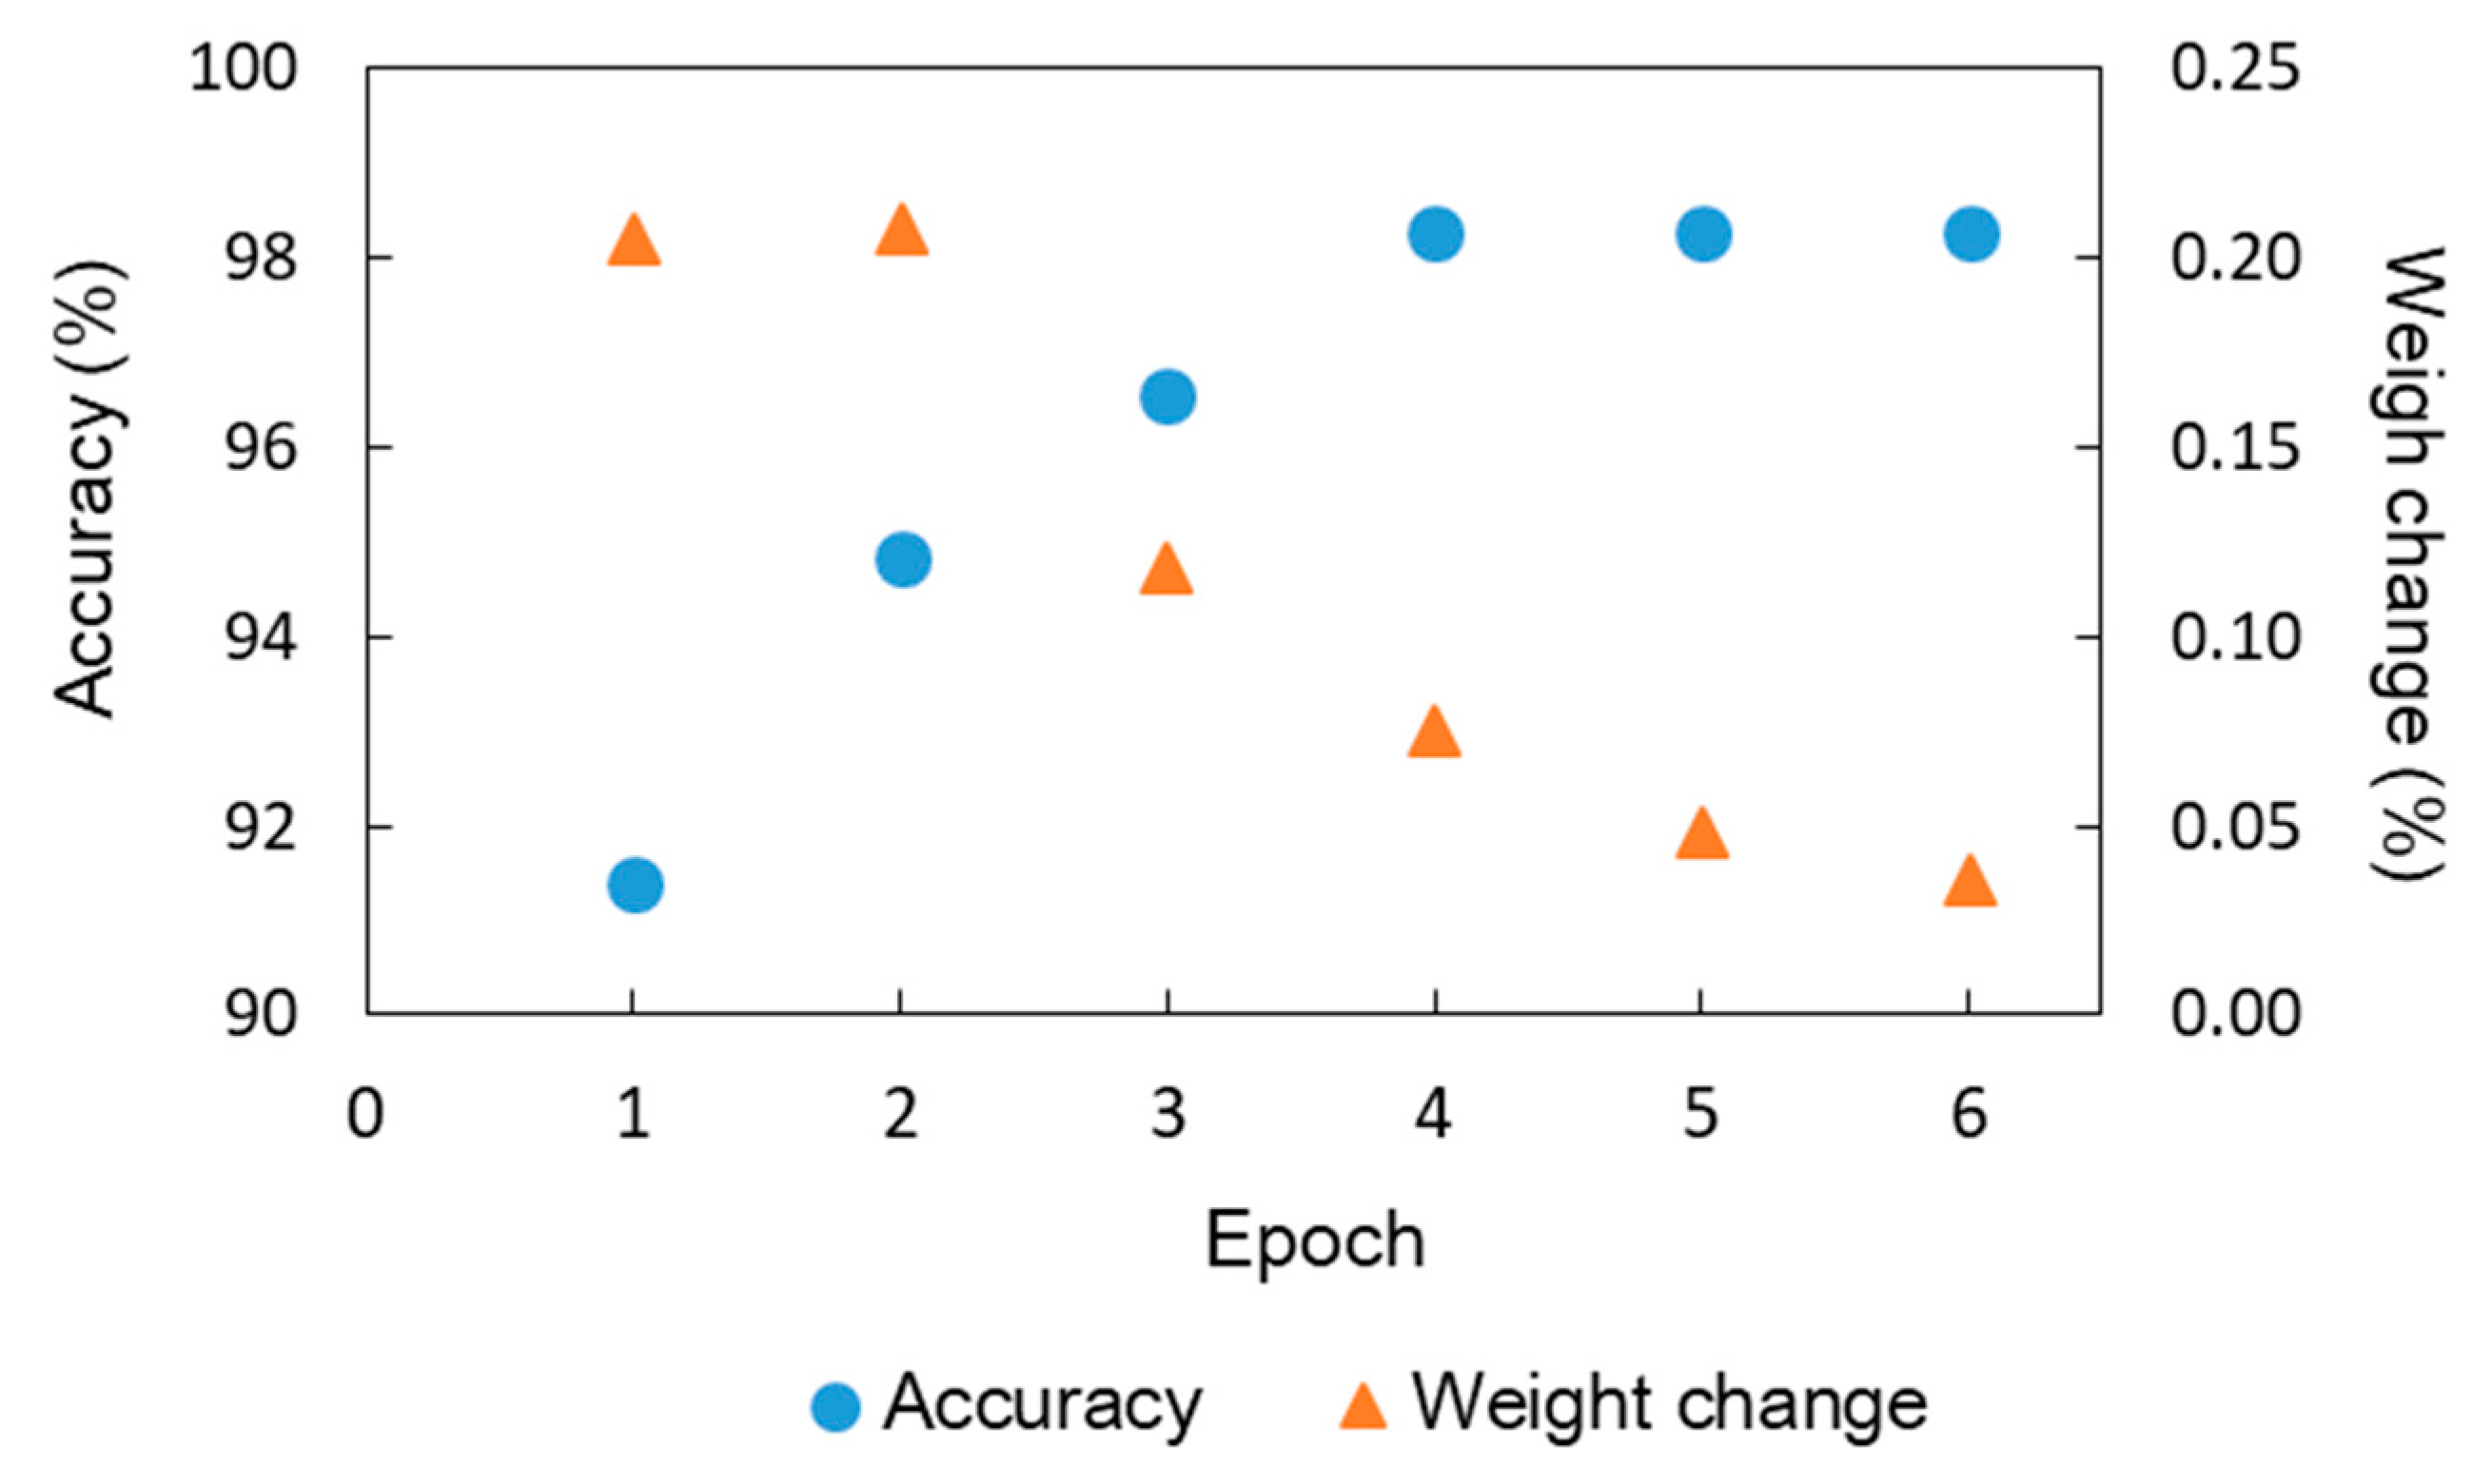
3.2. Monitoring of Accuracy and Weight Change during Training Process
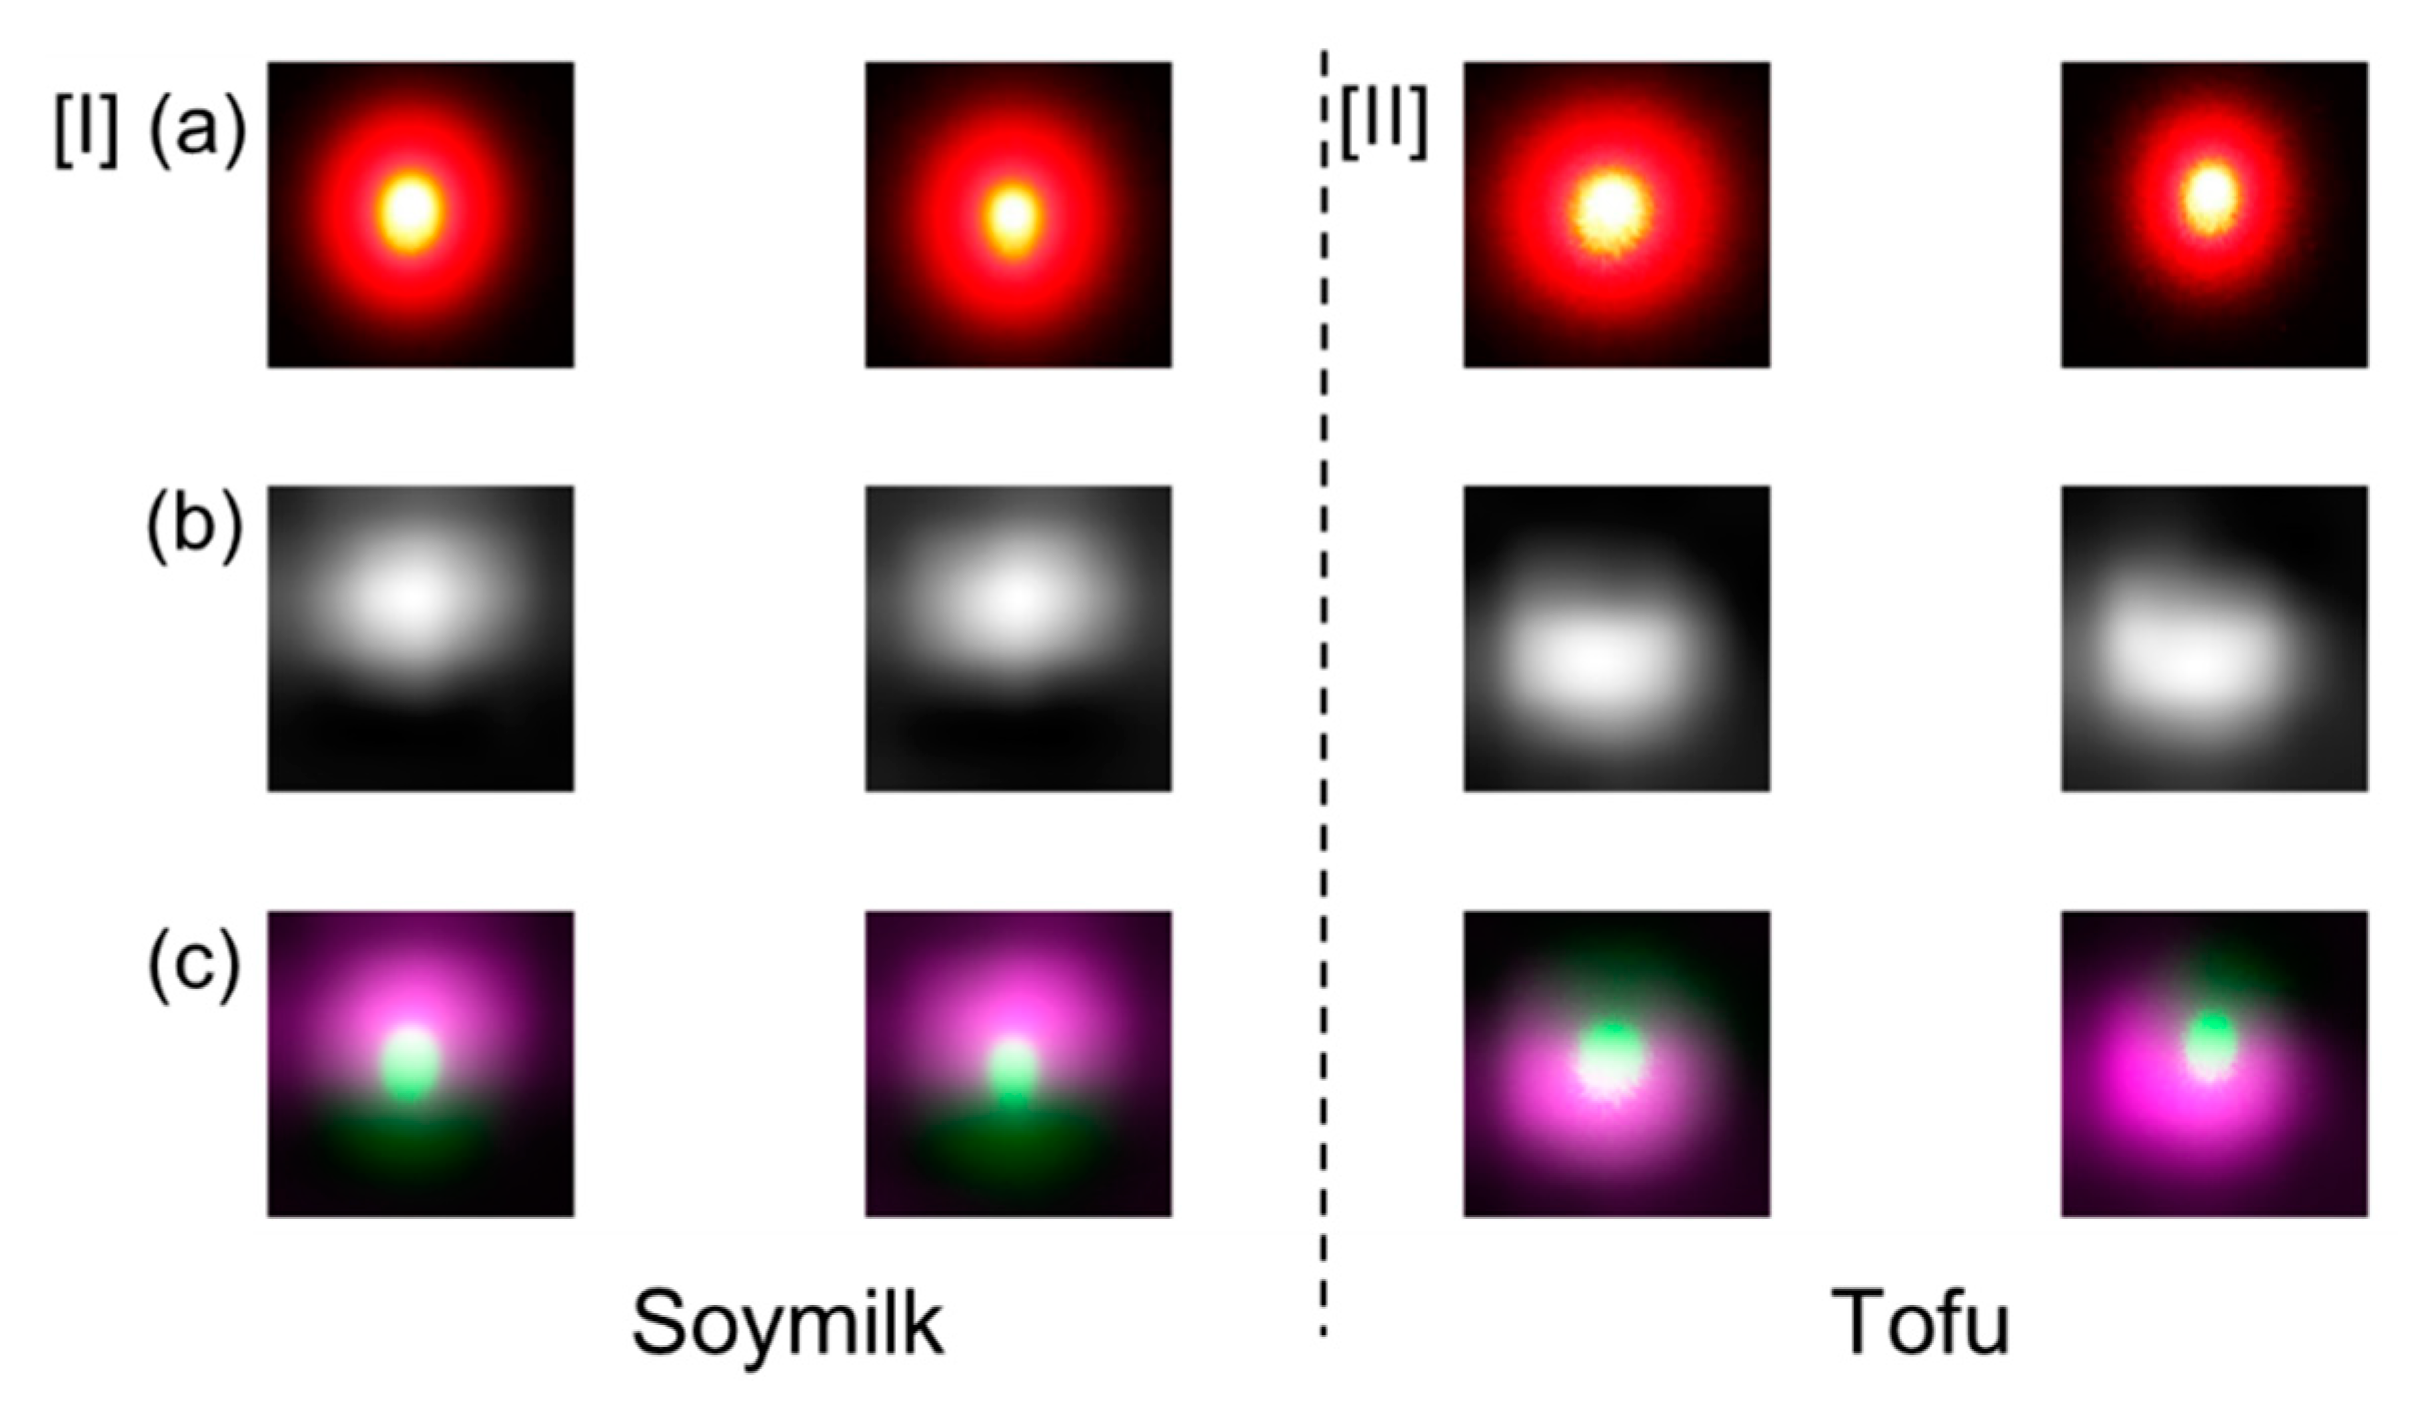
3.3. Activation Map
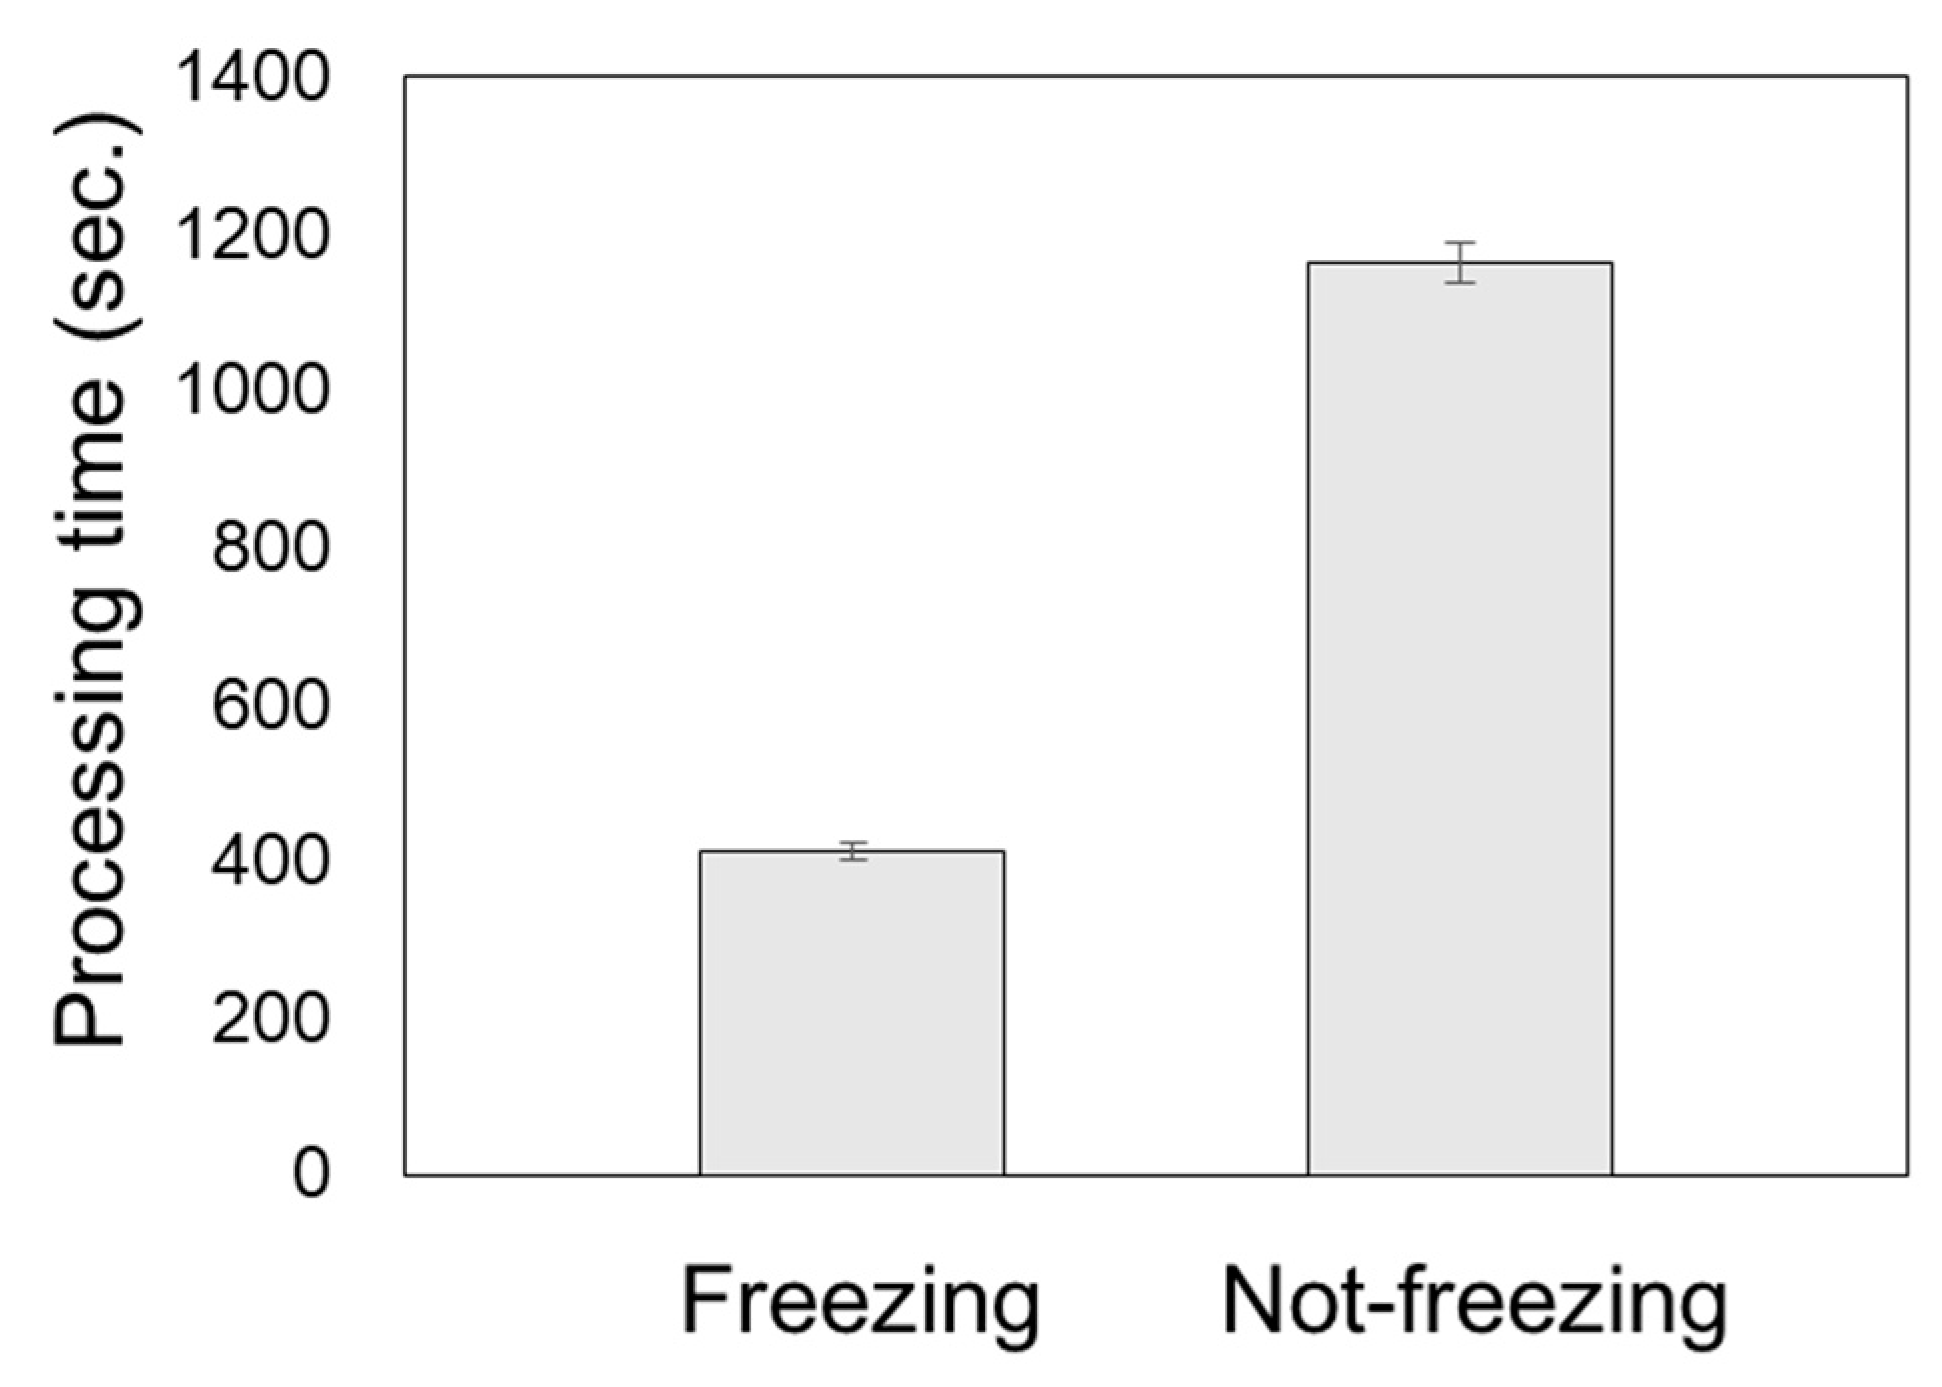
3.4. Reduction in Processing Time
4. Conclusions
Author Contributions
Funding
Conflicts of Interest
References
- Sakai, N.; Hagiwara, T.; Hui, Y.; Tojo, A. Heat transfer analysis of tofu coagulation process. Nippon Shokuhin Kagaku Kogaku Kaishi 2001, 48, 733–737. [Google Scholar] [CrossRef][Green Version]
- Kawaguchi, T.; Kita, R.; Shinyashiki, N.; Yagihara, S.; Fukuzaki, M. Physical properties of tofu gel probed by water translational/rotational dynamics. Food Hydrocoll. 2018, 77, 474–481. [Google Scholar] [CrossRef]
- Maurya, S.B.; Shukla, S.S.; Gour, L. Studies on physical and hunter colour of gamma irradiated tofu (soy paneer). Int. J. Curr. Microbiol. Appl. Sci. 2018, 7, 2008–2018. [Google Scholar] [CrossRef]
- Zhang, Q.; Wang, C.; Li, B.; Li, L.; Lin, D.; Chen, H.; Liu, Y.; Li, S.; Qin, W.; Liu, J. Research progress in tofu processing: From raw materials to processing conditions. Crit. Rev. Food Sci. Nutr. 2018, 58, 1448–1467. [Google Scholar] [CrossRef] [PubMed]
- Yang, A.; James, A.T. Effects of soybean protein composition and processing conditions on silken tofu properties. J. Sci. Food Agric. 2013, 93, 3065–3071. [Google Scholar] [CrossRef] [PubMed]
- Peng, X.; Ren, C.; Guo, S. Particle formation and gelation of soymilk: Effect of heat. Trends Food Sci. Technol. 2016, 54, 138–147. [Google Scholar] [CrossRef]
- Kamizake, N.K.K.; Silva, L.C.P.; Prudencio, S.H. Impact of soybean aging conditions on tofu sensory characteristics and acceptance. J. Sci. Food Agric. 2018, 98, 1132–1139. [Google Scholar] [CrossRef]
- Onodera, Y.; Ono, T.; Nakasato, K.; Toda, K. Homogeneity and microstructure of tofu depends on 11S/7S globulin ratio in soymilk and coagulant concentration. Food Sci. Technol. Res. 2009, 15, 265–274. [Google Scholar] [CrossRef]
- Ito, Y. Easy measurement method of “Tofu” hardness. J. Iwate Ind. Res. Inst. 2007, 14, 44–46. [Google Scholar]
- He, P.; Zhou, Z.; Wang, N. Development of a novel fiber optic sensor for on-line monitoring of soymilk coagulation. Appl. Mech. Mater. 2011, 52, 1703–1708. [Google Scholar] [CrossRef]
- Mine, Y.; Murakami, K.; Azuma, K.; Yoshihara, S.; Fukunaga, K.; Saeki, T.; Sawano, E. A comparison of various coagulants in tofu-forming properties. Nippon Shokuhin Kogyo Gakkaishi 2005, 52, 114–119. [Google Scholar] [CrossRef][Green Version]
- Ohara, T.; Sakai, T.; Matsuhashi, T. Computerized measurement of minimum coagulant necessary for coagulation of soymilk by electric conductivity meter. Nippon Shokuhin Kogyo Gakkaishi 1992, 39, 406–411. [Google Scholar] [CrossRef][Green Version]
- Saito, Y.; Konagaya, K.; Suzuki, T.; Kondo, N. Determination of optical coefficients of tofu using spatially resolved diffuse reflectance at 633 nm. Eng. Agric. Environ. Food 2018, 11, 38–42. [Google Scholar] [CrossRef]
- Li, X.S.; Toyoda, K.; Ihara, I. Characterization of tofu coagulation process by impedance spectroscopy. J. Jpn. Soc. Agric. Mach. 2008, 70, 265–266. [Google Scholar]
- Toyoda, K.; Li, X. Monitoring of coagulation process of soymilk by an integrated electrical sensing and control system. In Proceedings of the CIGR XVIIth World Congress, Quebec City, QC, Canada, 13–17 June 2010; pp. 1–10. [Google Scholar]
- Li, X.S.; Toyoda, K.; Ihara, I. Coagulation process of soymilk characterized by electrical impedance spectroscopy. J. Food Eng. 2011, 105, 563–568. [Google Scholar] [CrossRef]
- Krizhevsky, A.; Sutskever, I.; Hinton, G.E. ImageNet Classification with Deep Convolutional Neural Networks. In Advances in Neural Information Processing Systems 25, Proceedings of the Neural Information Processing Systems 2012, Lake Tahoe, NV, USA, 3–8 December 2012; Pereira, F., Burges, C.J.C., Bottou, L., Weinberger, K.Q., Eds.; NIPS: Lake Tahoe, NV, USA, 2012; pp. 1106–1114. [Google Scholar]
- LeCun, Y.; Bengio, Y.; Hinton, G. Deep learning. Nature 2015, 521, 436–444. [Google Scholar] [CrossRef] [PubMed]
- Kamilaris, A.; Prenafeta-Boldú, F.X. Deep learning in agriculture: A survey. Comput. Electron. Agric. 2018, 147, 70–90. [Google Scholar] [CrossRef]
- Dyrmann, M.; Karstoft, H.; Midtiby, H.S. Plant species classification using deep convolutional neural network. Biosyst. Eng. 2016, 151, 72–80. [Google Scholar] [CrossRef]
- Barbedo, J.G.A. Impact of dataset size and variety on the effectiveness of deep learning and transfer learning for plant disease classification. Comput. Electron. Agric. 2018, 153, 46–53. [Google Scholar] [CrossRef]
- Barbedo, J.G.A. Factors influencing the use of deep learning for plant disease recognition. Biosyst. Eng. 2018, 172, 84–91. [Google Scholar] [CrossRef]
- Sibiya, M.; Mbuyu, S. A computational procedure for the recognition and classification of maize leaf diseases out of healthy leaves using convolutional neural networks. AgriEnging 2019, 1, 9. [Google Scholar] [CrossRef]
- Maggiori, E.; Tarabalka, Y.; Charpiat, G.; Alliez, P. Convolutional neural networks for large-scale remote-sensing image classification. IEEE Trans. Geosci. Remote Sens. 2017, 55, 645–657. [Google Scholar] [CrossRef]
- Liu, X.; Tian, Y.; Yuan, C.; Zhang, F.; Yang, G. Opium Poppy Detection Using Deep Learning. Remote Sens. 2018, 10, 1886. [Google Scholar] [CrossRef]
- Itakura, K.; Hosoi, F. Estimation of tree structural parameters from video frames with removal of blurred images using machine learning. J. Agric. Meteorol. 2018, 74, 154–161. [Google Scholar] [CrossRef]
- Peng, Y.; Kondo, N.; Fujiura, T.; Suzuki, T.; Yoshioka, H.; Itoyama, E. Classification of multiple cattle behavior patterns using a recurrent neural network with long short-term memory and inertial measurement units. Comput. Electron. Agric. 2019, 157, 247–253. [Google Scholar] [CrossRef]
- Pan, S.; Yang, Q. A survey on transfer learning. IEEE Trans. Knowl. Data Eng. 2010, 22, 1345–1359. [Google Scholar] [CrossRef]
- Nakayama, H. Image feature extraction and transfer learning using deep convolutional neural networks. IEICE Tech. Rep. 2015, 115, 55–59. [Google Scholar]
- Kamishima, T. Deep Learning; Kindaikagakusha: Tokyo, Japan, 2015; p. 177. [Google Scholar]
- Itakura, K.; Hosoi, F. Background and foreground segmentation in plant images with active contour model and plant image classification using transfer learning. ECO Eng. 2018, 30, 81–85. [Google Scholar]
- Suh, H.K.; Ijsselmuiden, J.; Hofstee, J.W.; Van Henten, E.J. Transfer learning for the classification of sugar beet and volunteer potato under field conditions. Biosyst. Eng. 2018, 174, 50–65. [Google Scholar] [CrossRef]
- Saito, K. Deep Learning from Scratch; Oreilly Japan: Tokyo, Japan, 2016; p. 245. [Google Scholar]
- Bargoti, S.; Underwood, J. Deep fruit detection in orchards. In Proceedings of the 2017 IEEE International Conference on Robotics and Automation (ICRA), Singapore, 29 May–3 June 2017; pp. 3626–3633. [Google Scholar]
- Ronneberger, O.; Fischer, P.; Brox, T. U-net: Convolutional networks for biomedical image segmentation. In Proceedings of the International Conference on Medical Image Computing and Computer-Assisted Intervention, Quebec City, QC, Canada, 10–14 September 2015; pp. 234–241. [Google Scholar]
- Cui, X.; Goel, V.; Kingsbury, B. Data augmentation for deep neural network acoustic modeling. IEEE/ACM Trans. Audio Speech Lang. Process. 2015, 23, 1469–1477. [Google Scholar]
- Itakura, K.; Saito, Y.; Suzuki, T.; Kondo, N.; Hosoi, F. Estimation of citrus maturity with fluorescence spectroscopy using deep learning. Horticulturae 2019, 5, 2. [Google Scholar] [CrossRef]
- Szegedy, C.; Ioffe, S.; Vanhoucke, V.; Alemi, A.A. Inception-v4, inception-resnet and the impact of residual connections on learning. In Proceedings of the Thirty-First AAAI Conference on Artificial Intelligence, San Francisco, CA, USA, 4–10 February 2017. [Google Scholar]
- Szegedy, C.; Liu, W.; Jia, Y.; Sermanet, P.; Reed, S.; Anguelov, D.; Erhan, D.; Vanhoucke, V.; Rabinovich, A. Going deeper with convolutions. In Proceedings of the IEEE Conference on Computer Vision and Pattern Recognition, Boston, MA, USA, 7–12 June 2015; pp. 1–9. [Google Scholar]
- Shin, H.C.; Roth, H.R.; Gao, M.; Lu, L.; Xu, Z.; Nogues, I. Deep convolutional neural networks for computer aided detection: CNN architectures, dataset characteristics and transfer learning. IEEE Trans. Med. Imaging 2016, 35, 1285–1298. [Google Scholar] [CrossRef] [PubMed]
- Deng, L.; Hinton, G.; Kingsbury, B. New types of deep neural network learning for speech recognition and related applications: An overview. In Proceedings of the IEEE International Conference on Acoustics, Speech and Signal Processing, Vancouver, BC, Canada, 26–31 May 2013; pp. 8599–8603. [Google Scholar]
- Qian, N. On the momentum term in gradient descent learning algorithms. Neural Netw. 1999, 12, 145–151. [Google Scholar] [CrossRef]
- Goodfellow, I.; Bengio, Y.; Courville, A. Deep Learning; MIT Press Cambridge: London, UK, 2016. [Google Scholar]
- Močkus, J. On Bayesian methods for seeking the extremum. In Proceedings of the Optimization Techniques IFIP Technical Conference; Springer: Berlin/Heidelberg, Germany, 1975; pp. 400–404. [Google Scholar]
- Mockus, J.; Vytautas, T.; Antanas, Z. The application of Bayesian methods for seeking the extremum. Towards Glob. Opt. 1978, 2, 117–129. [Google Scholar]
- Brochu, E.; Cora, M.; de Freitas, N. A Tutorial on Bayesian optimization of expensive cost functions, with application to active user modeling and hierarchical reinforcement learning. arXiv 2010, arXiv:1012.2599. [Google Scholar]
- Snoek, J.; Hugo, L.; Adams, R.P. Practical Bayesian Optimization of Machine Learning Algorithms. In Advances in Neural Information Processing Systems 25, Proceedings of the Neural Information Processing Systems 2012, Lake Tahoe, NV, USA, 3–8 December 2012; Pereira, F., Burges, C.J.C., Bottou, L., Weinberger, K.Q., Eds.; NIPS: Lake Tahoe, NV, USA, 2012; pp. 2951–2959. [Google Scholar]
- Zhang, Y.; Sohn, K.; Villegas, R.; Pan, G.; Lee, H. Improving object detection with deep convolutional networks via bayesian optimization and structured prediction. In Proceedings of the IEEE Conference on Computer Vision and Pattern Recognition, Boston, MA, USA, 7–12 June 2015; pp. 249–258. [Google Scholar]
- Kano, M.; Yoshizaki, R. Operating condition optimization for efficient scale-up of manufacturing process by using Bayesian optimization and transfer learning. J. Soc. Instrum. Control Eng. 2017, 56, 695–698. [Google Scholar]
- Yoshida, A.; Adachi, M.; Amano, M. Coagulation monitoring of gel material using reflected speckle pattern. In Proceedings of the JSPE Semestrial Meeting, Utsunomiya, Japan, 2006; pp. 699–700. [Google Scholar]
- Oquab, M.; Bottou, L.; Laptev, I.; Sivic, J. Learning and transferring mid-level image representations using convolutional neural networks. In Proceedings of the IEEE Conference on Computer Vision and Pattern Recognition, Columbus, OH, USA, 24–27 June 2014; pp. 1717–1724. [Google Scholar]
- Litjens, G.; Kooi, T.; Bejnordi, B.E.; Setio, A.A.A.; Ciompi, F.; Ghafoorian, M.; van der Laak, J.A.W.M.; Van Ginneken, B.; Sánchez, C.I. A survey on deep learning in medical image analysis. Med. Image Anal. 2017, 42, 60–88. [Google Scholar] [CrossRef] [PubMed]
- Simonyan, K.; Zisserman, A. Very deep convolutional networks for large-scale image recognition. arXiv 2014, arXiv:1409.1556. [Google Scholar]
- Iandola, F.N.; Han, S.; Moskewicz, M.W.; Ashraf, K.; Dally, W.J.; Keutzer, K. Squeezenet: Alexnet-level accuracy with 50x fewer parameters and <0.5 mb model size. arXiv 2016, arXiv:1602.07360. [Google Scholar]
- He, K.; Zhang, X.; Ren, S.; Sun, J. Deep residual learning for image recognition. In Proceedings of the IEEE Conference on Computer Vision and Pattern Recognition, Las Vegas, NV, USA, 26 June–1 July 2016; pp. 770–778. [Google Scholar]
- Huang, G.; Liu, Z.; Van Der Maaten, L.; Weinberger, K.Q. Densely connected convolutional networks. In Proceedings of the IEEE Conference on Computer Vision and Pattern Recognition, Honolulu, HI, USA, 21–26 July 2017; pp. 4700–4708. [Google Scholar]
- Hochreiter, S. The vanishing gradient problem during learning recurrent neural nets and problem solutions. Int. J. Uncertain. Fuzziness Knowl. Based Syst. 1998, 6, 107–116. [Google Scholar] [CrossRef]
- Pascanu, R.; Mikolov, T.; Bengio, Y. Understanding the exploding gradient problem. arXiv 2012, arXiv:1211.5063. [Google Scholar]
- Zhou, B.; Khosla, A.; Lapedriza, A.; Oliva, A.; Torralba, A. Learning deep features for discriminative localization. In Proceedings of the IEEE Conference on Computer Vision and Pattern Recognition, Las Vegas, NV, USA, 26 June–1 July 2016; pp. 2921–2929. [Google Scholar]
- Ono, T. New techniques for stable colloidal solution and mixed solid from study on soymilk and tofu. Food Ind. 2008, 51, 50–56. [Google Scholar]
- Ono, T. Formation of soymilk colloid for tofu or drinks. Nippon Shokuhin Kogyo Gakkaishi 2017, 64, 220–225. [Google Scholar] [CrossRef][Green Version]
- Farrell, T.J.; Patterson, M.S.; Wilson, B. A diffusion theory model of spatially resolved, steady-state diffuse reflectance for the noninvasive determination of tissue optical properties in vivo. Med. Phys. 1992, 19, 879–888. [Google Scholar] [CrossRef] [PubMed]
- Sow, L.C.; Chong, J.M.N.; Liao, Q.X.; Yang, H. Effects of κ-carrageenan on the structure and rheological properties of fish gelatin. J. Food Eng. 2018, 239, 92–103. [Google Scholar] [CrossRef]
- Sow, L.C.; Kong, K.; Yang, H. Structural modification of fish gelatin by the addition of gellan, κ-carrageenan, and salts mimics the critical physicochemical properties of pork gelatin. J. Food Sci. 2018, 83, 1280–1291. [Google Scholar] [CrossRef] [PubMed]
- Sow, L.C.; Tan, S.J.; Yang, H. Rheological properties and structure modification in liquid and gel of tilapia skin gelatin by the addition of low acyl gellan. Food Hydrocoll. 2019, 90, 9–18. [Google Scholar] [CrossRef]
- Sow, L.C.; Toh, N.Z.Y.; Wong, C.W.; Yang, H. Combination of sodium alginate with tilapia fish gelatin for improved texture properties and nanostructure modification. Food Hydrocoll. 2019, 94, 457–467. [Google Scholar] [CrossRef]
- Zhou, Y.; Yang, H. Effects of calcium ion on gel properties and gelation of tilapia (Oreochromis niloticus) protein isolates processed with pH shift method. Food Chem. 2019, 277, 327–335. [Google Scholar] [CrossRef]


| Parameter | Value or Name |
|---|---|
| Optimizer | Stochastic gradient descent |
| Momentum | 0.9 |
| Weight decay | 1.0 × 10⁻⁴ |
| Initial learn rate | 1.0 × 10⁻⁴ |
| Max epochs | 10 |
| Minibatch size | 30 |
| Validation frequency during learning | Every 3 iterations |
© 2019 by the authors. Licensee MDPI, Basel, Switzerland. This article is an open access article distributed under the terms and conditions of the Creative Commons Attribution (CC BY) license (http://creativecommons.org/licenses/by/4.0/).
Share and Cite
Itakura, K.; Saito, Y.; Suzuki, T.; Kondo, N.; Hosoi, F. Classification of Soymilk and Tofu with Diffuse Reflection Light Using a Deep Learning Technique. AgriEngineering 2019, 1, 235-245. https://doi.org/10.3390/agriengineering1020017
Itakura K, Saito Y, Suzuki T, Kondo N, Hosoi F. Classification of Soymilk and Tofu with Diffuse Reflection Light Using a Deep Learning Technique. AgriEngineering. 2019; 1(2):235-245. https://doi.org/10.3390/agriengineering1020017
Chicago/Turabian StyleItakura, Kenta, Yoshito Saito, Tetsuhito Suzuki, Naoshi Kondo, and Fumiki Hosoi. 2019. "Classification of Soymilk and Tofu with Diffuse Reflection Light Using a Deep Learning Technique" AgriEngineering 1, no. 2: 235-245. https://doi.org/10.3390/agriengineering1020017
APA StyleItakura, K., Saito, Y., Suzuki, T., Kondo, N., & Hosoi, F. (2019). Classification of Soymilk and Tofu with Diffuse Reflection Light Using a Deep Learning Technique. AgriEngineering, 1(2), 235-245. https://doi.org/10.3390/agriengineering1020017