1. Introduction
Sustainable urban development is one of the main challenges of the XXI century. Sustainable Development Goals (SDGs) 11 and 16, as a part of the initiative of the United Nations, aim to achieve inclusive, secure, resilient, sustainable, and peaceful cities, through targets that include participatory planning (Goal 11.3) and inclusive and representative decision-making (Goal 16.7) [
1]. However, in middle- and low-income countries [
2], local governments do not generate and use data for the smart management of cities. The absence of data and its lack of use in understanding community problems is common in countries like Ecuador, where traditional data collection methods are expensive, infrequent, and outdated [
3]. R. Pateman et al. [
4] allege that 68% of environmental indicators in these contexts lack adequate data coverage, limiting the capacity of local governments to monitor SDGs. This limitation has driven the exploration of complementary approaches, such as Citizen Science (CS), which leverages the collective capacity of non-expert volunteers to collect, process, and analyze data in collaboration with professional researchers.
Modern CS is distinguished by its systematic design, which allows projects to be proposed that have been specifically designed or adapted for this purpose because of the required magnitude or geographical scale [
5]. Bonney et al. [
6] classified four kinds of CS projects, and they found solid evidence that citizen science scientific results are well documented, contribute to social welfare, and give people a voice in decision-making at the local level. At the same time, the advancement of Artificial Intelligence (AI) offers new possibilities to expand the scope, productivity, and precision of these initiatives. Fortson et al. [
7] recognized AI and CS as complementary approaches that are able to expedite data processing and quality, improve the temporal and geographical scope of projects, and expand citizen participation opportunities. Hsu et al. [
8] argued that AI systems co-created with local communities can address regional problems and empower residents when the design processes are community-centered and not exclusively focused on researchers. However, CS integration with standardized and analyzed urban indicators, supported by AI, has been little explored in low- and middle-income countries. The ISO 37120 (2018) standard provides indicators to measure the performance of urban services and quality of life, organized into water and sanitation, environment, safety, transport, housing, education, health, solid waste management, and other categories [
9]. By mapping these indicators to CS categories, a solid base is obtained for citizens to report localized problems aligned with official planning metrics. In Ecuador, decentralized autonomous governments (DAGs) are responsible for territorial planning and the provision of public services [
10]. However, they lack reliable and up-to-date data on the needs of their communities. The National Council of Competencies [
11] documented the need to activate mechanisms and instances of citizen participation, while De la Torre & Núñez [
12] observed that access to public information is fundamental to strengthening public management and the quality of democracy. While each of these related works approaches different techniques and methods for the particular use of standards or norms and the application of Citizen Science, our proposed idea represents an advance as it integrates CS, ISO 37120, and AI to overcome these closely related challenges in the Ecuadorian context.
The present study proposes an integrated community monitoring system that allows DAGs to obtain disaggregated, timely territorial data about urban problems perceived by citizens in order to guide decision-making in territorial planning in a participatory manner that aligns with international standards. For this purpose, between October 2025 and February 2026, citizen reports about community problems in 22 provinces, 93 cantons, and 181 parishes (the smaller administrative unit in the territorial structure) in Ecuador were collected, analyzed, and classified according to ISO 37120 to identify the factors that predict the perceived severity of these problems and the spatial patterns that emerge from their territorial distribution. The methodological design is based on the six-stage life cycle for citizen science projects proposed by ref. [
13], adapted to the context of urban sustainability through ISO 3720. Data management is driven by the integrated AI-CS ecosystem established by ref. [
7]. Another aspect that was adopted in the design is the ethical governance of citizen data, aligning with the Copenhagen Declaration on Citizen Data [
14].
After applying the integrated monitoring system, 30,253 georeferenced reports were collected (99.1% with valid GPS coordinates) in urban territories (39.0%) and rural ones (61.0%).
Despite the growing use of citizen science for sustainable development, the operational integration of citizen science, the ISO 37120 standard, and machine learning analysis into a single monitoring framework remains underexplored, particularly in Global South contexts. As detailed in
Section 2, our targeted literature search found no prior studies explicitly combining citizen science with ISO 37120. The present study addresses this gap.
In summary, this investigation provides two contributions: (1) a monitoring citizen system that integrates CS, AI, ISO 37120, and university–community–government partnerships to contribute to SDGs 9, 11, 16 and 17, specifically supporting smart city management; and (2) empirical evidence about citizens’ perception of urban problems in the Ecuadorian context. To achieve these contributions, the study addresses two goals (detailed in
Section 3) that are formulated from the research questions RQ1 and RQ2.
This article is structured as follows:
Section 2 presents related work;
Section 3 describes the methodology;
Section 4 presents the results;
Section 5 discusses the findings; and
Section 6 offers the conclusions of the investigation.
2. Related Work
CS has experienced exponential growth boosted by the increasing availability of technological information infrastructures, including mobile devices, low-cost sensors, and cloud-based data systems [
13]. This growing interest is also reflected by the volume of scientific publications indexed in scientific databases. A recent Scopus search using the string (TITLE-ABS-KEY(“Citizen Science”)) AND (PUBYEAR > 2020 AND PUBYEAR < 2027) retrieved 9270 documents.
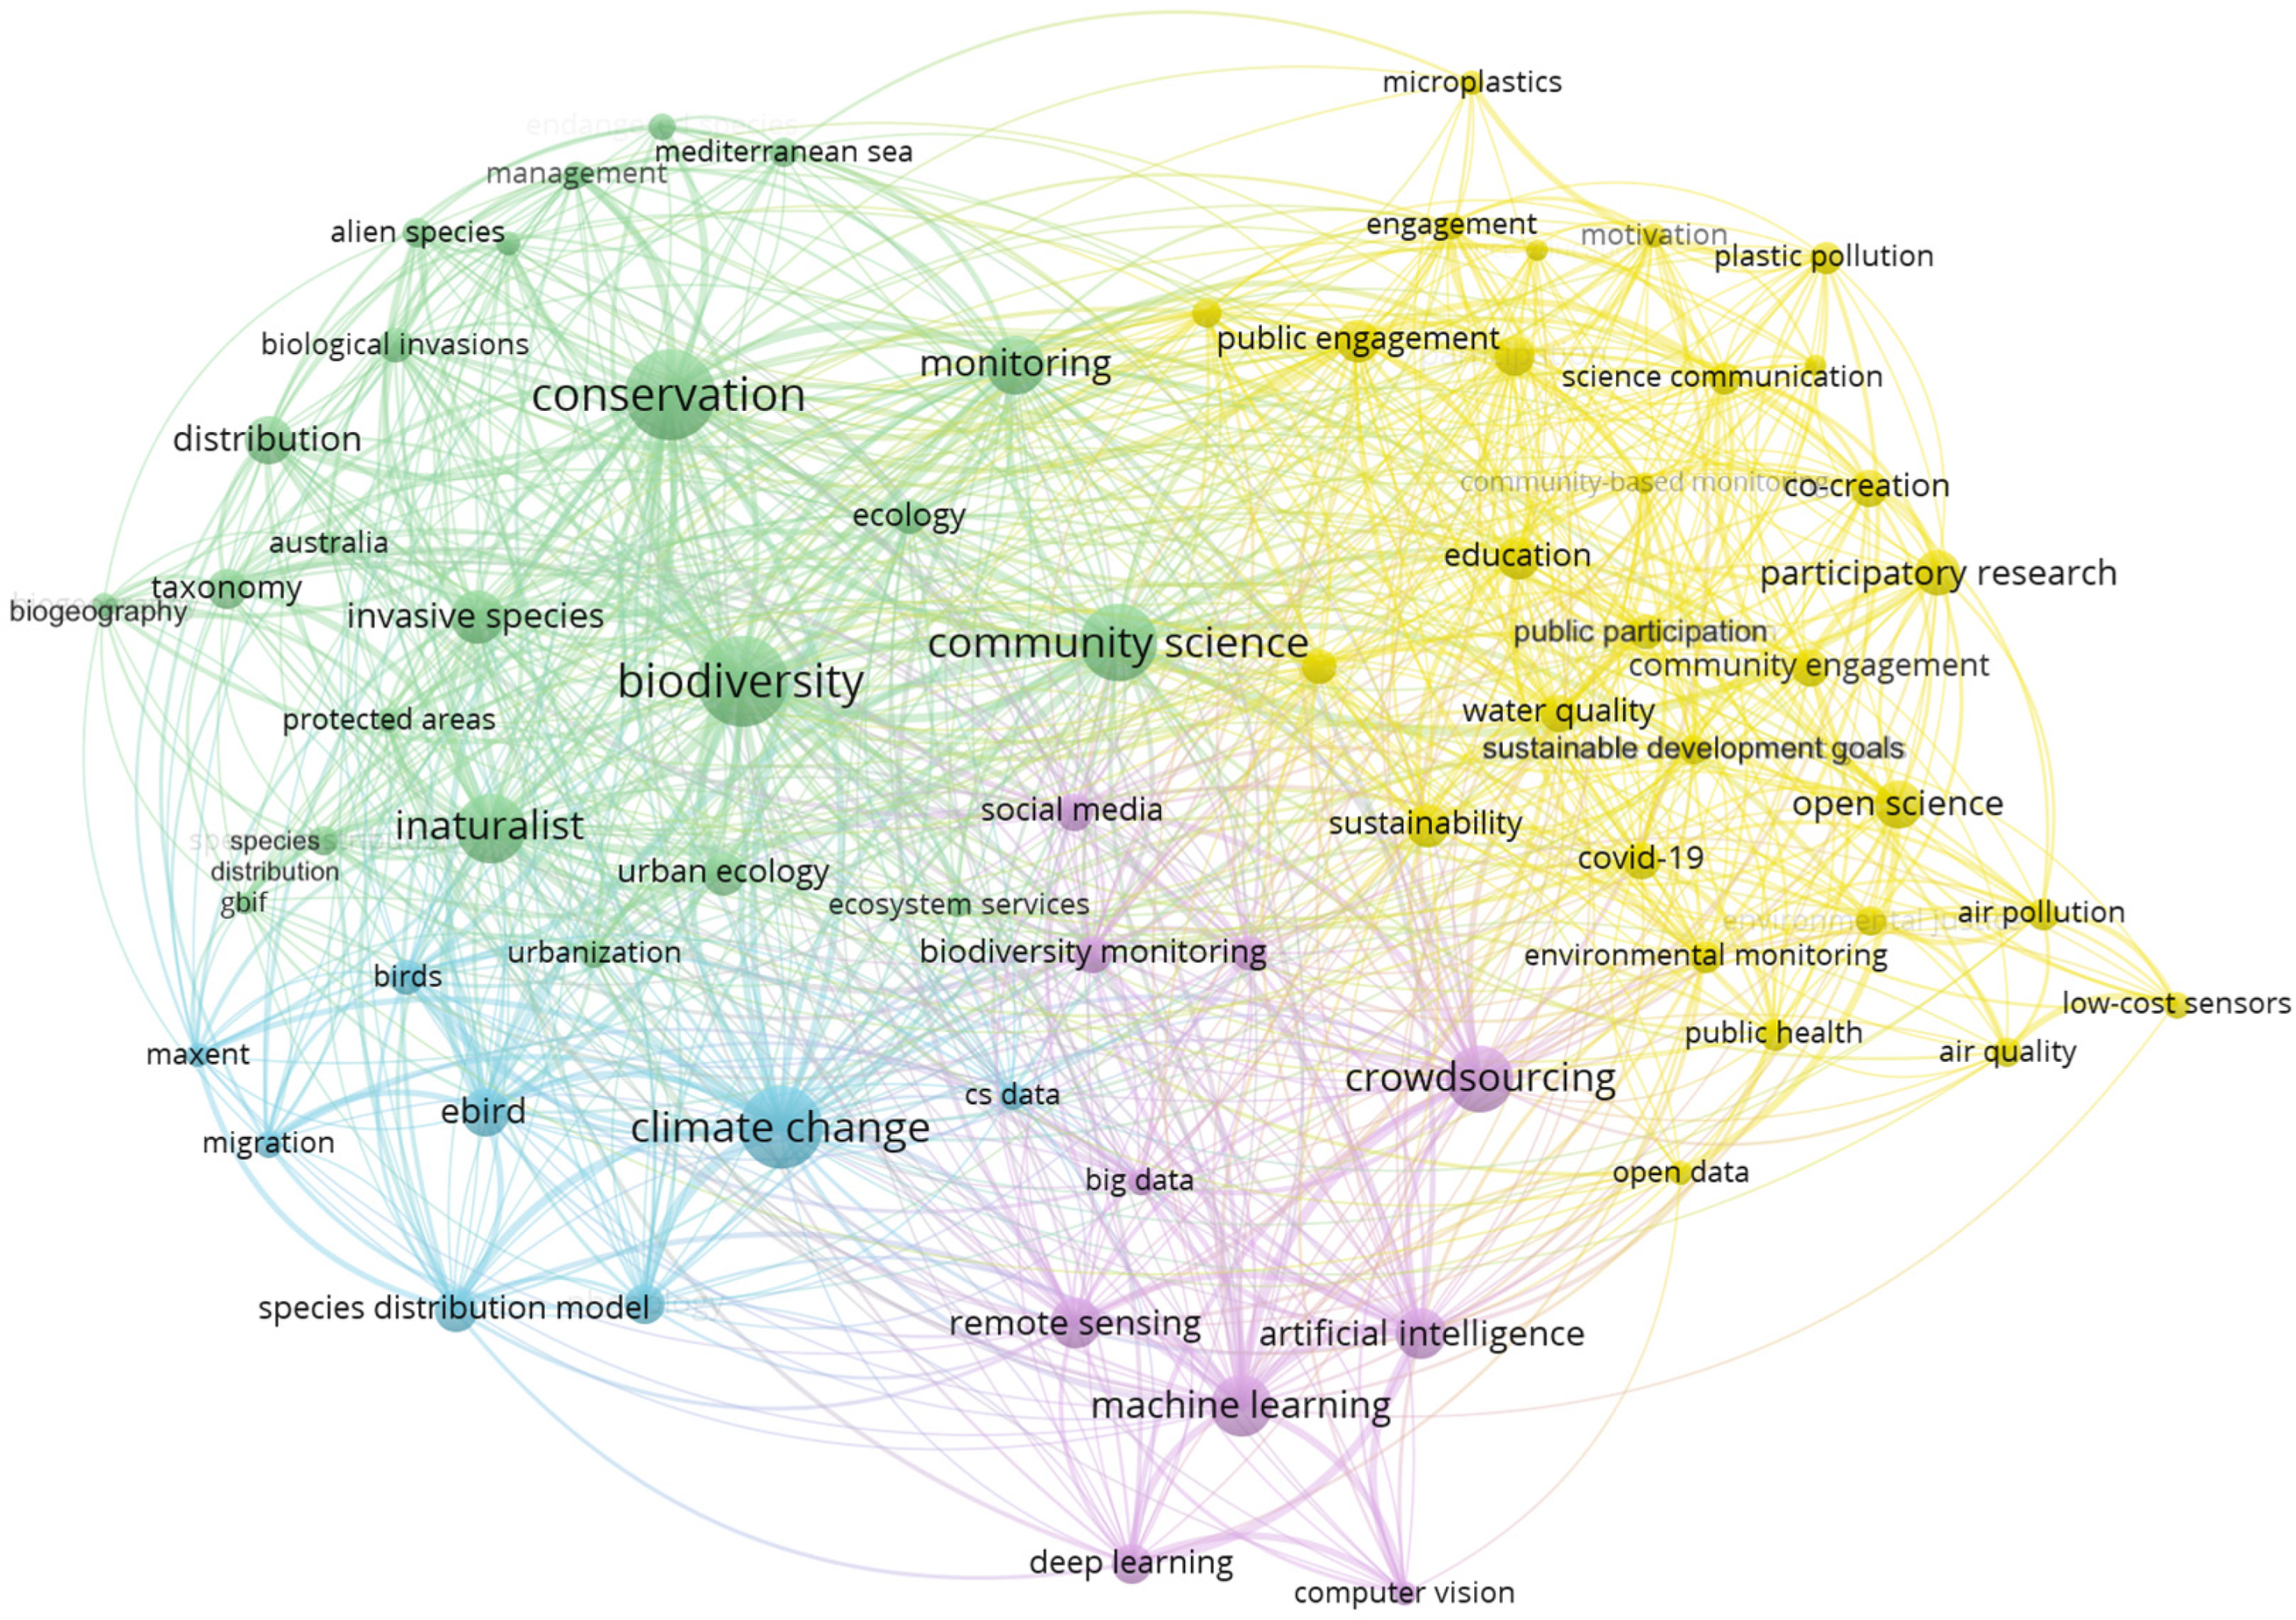
Figure 1 presents a co-occurrence map of
author keywords from these records. The network was constructed using VOSviewer (v1.6.16), excluding the term “citizen science” to avoid its dominance over other relevant keywords. The ten most frequent words were
conservation,
biodiversity,
climate change,
community science,
iNaturalist,
crowd sourcing,
machine learning,
monitoring,
invasive species, and
artificial intelligence.
The clusters shown in
Figure 1 demonstrate that recent citizen science publications are structured around four main areas: (i) biodiversity/conservation, (ii) climate change and species distribution, (iii) public participation/open science, and (iv) analytical technologies. Although ecological terms dominate the network, the emergence of the last cluster, which is associated with machine learning, deep learning, computer vision, remote sensing, and artificial intelligence, is noteworthy.
Based on a preliminary review of the Scopus results, one of the primary objectives of integrating CS into projects is to enable the collection of real-time, participatory data across broad geographical areas that professional researchers could not cover individually [
5,
15,
16,
17,
18]. To ensure the responsible, professional, and ethical production and use of citizens’ data, the Copenhagen Framework on Citizens’ Data [
14] establishes seven principles to meet: independence, relevance, informed consent, professional standards, data security, confidentiality, and openness. These principles are especially relevant in CS projects, where citizens are simultaneously producers and beneficiaries of generated data.
However, the large-scale generation of citizen data also requires advanced computational capabilities to process complex datasets, automate the classification of observations, and support analyses for territorial and urban management. In this context, a shift can be observed from approaches that are mainly focused on citizen observation toward hybrid models in which AI supports classification, environmental monitoring, big data analysis, and participatory decision-making. Beyond data collection, CS has also been integrated into other stages of the scientific life cycle, including the production of well-documented scientific results and the promotion of public science understanding [
6,
19].
Evidence on the need to combine AI systems with local community engagement is presented in [
8]. In that study, the authors introduce the Community Citizen Science (CCS) as an approach to address civil society issues. Their work shows that community empowerment requires granting communities’ the autonomy to use technology and data as instruments of social and political influence. In this regard, the convergence of AI and CS raises significant challenges, particularly the need to translate the technical possibilities of these technologies into operational structures that can be adopted by local governments, especially those with limited institutional capacity.
In the context of the SDGs, Fritz et al. [
3] mapped the potential contributions of CS to the 17 SDGs, highlighting the growing recognition of non-traditional data sources as innovative sources of information for sustainable development. Similarly, Pateman et al. [
4] show that CS can generate data across broad geographical scales, with fine spatial resolution and from locations that may be inaccessible to official monitoring systems, while also involving marginalized populations in monitoring activities. In this regard, previous studies suggest that co-created CS can generate spaces for dialogue among communities, authorities, and stakeholders, thereby strengthening citizen participation in social change. However, despite these advances, gaps remain in the availability of government-funded data in countries of the Global South [
20]. In Latin America, several studies have shown the potential of CS in areas such as biodiversity and environmental conservation [
15,
16,
21,
22]; governance, community participation, and social change [
23,
24]; education, participation, and civic capacities [
25]; and urban management and sustainable cities [
26]. Therefore, although researchers have made important efforts to strengthen scientific outcomes through citizen participation, there is still a need to better align the efforts of academia, government, and communities to increase the impact of collaboration. This methodological need is further reinforced by the limited number of initiatives that integrate AI to support data analysis, prediction, interpretation, and the translation of results into actionable outcomes [
27].
One of the studies that presents a conceptual framework for the integration of AI and CS is presented by Fortson et al. [
7]. The framework comprises three components: (i) data collection (where citizens act as citizen scientists), (ii) data processing (where AI classifies, detects anomalies, and identifies objects) and (iii) data analysis (where human and machine participation converge). This integration ecosystem between AI and CS operates under two modalities: humans-in-the-loop, where people provide labels, correct predictions, and validate results; and machines-in-the-loop, in which AI assists in automatic classification and anomaly detection. According to McClure et al. [
28], the integration of AI and CS has the potential to streamline the processing and analysis of big data, positively contributing to scientific advances. These studies suggest that AI can also help make findings more accessible to people, increasing levels of interest and community participation in the scientific process.
To strengthen community participation and communication in the governance and management of sustainable cities, the ISO 37120:2018 standard defines a set of indicators organized into categories such as water and sanitation, environment, safety, transport, housing, education, health, and solid waste management. These indicators are intended to measure the performance of urban services and quality of life [
9]. Although the standard was originally conceived to compare urban performance across cities, its taxonomy also provides a structured basis for the systematic collection of data at the community level. However, the literature shows a notable lack of studies that operationally connect ISO 37120 with AI and CS methodologies, particularly in Latin America. This gap is supported by a general Scopus query combining CS and the ISO standard name—TITLE-ABS-KEY(“Citizen Science”) AND TITLE-ABS-KEY(“ISO 37120” OR “ISO-37120” OR “ISO37120”)—which returned no results. Therefore, this study addresses this gap by adapting ISO 37120 categories as a citizen data collection tool, thereby bridging internationally standardized urban indicators with the participatory generation of territorial data.
Finally, regarding the methodology for structuring CS projects, Fraisl et al. [
13] propose a six-stage life cycle: (Stage 1) identifying the need, (Stage 2) determining whether CS is the right approach, (Stage 3) designing the project, (Stage 4) building the community, (Stage 5) managing the data, and (Stage 6) evaluating the project. This cycle has mainly been applied in environmental and ecological CS projects and has proven useful for organizing geographically large-scale initiatives involving non-expert participants. However, its application to urban sustainability contexts in low- and middle-income countries, as well as its integration with AI tools for citizen data analysis, remains insufficiently explored in the literature. The present study adapts this cycle to the Ecuadorian context by incorporating ISO 37120 categories as a data collection instrument in Stage 3 and integrating the AI–CS ecosystem proposed in [
7] into Stage 5.
Although previous studies make valuable contributions to CS, AI, and urban sustainability, they do not pursue the same objective as the present study. In response to this gap, we propose a methodological system that integrates citizen data collection, guided by the formal taxonomy of ISO 37120, with continuous monitoring and AI-supported analysis to assess population-level needs and benefits.
3. Materials and Methods
This section presents the methodology used specifically for our investigation. It follows the six-stage life cycle for citizen science projects proposed by Fraisl et al. [
13], adapted to the Ecuadorian urban sustainability context using ISO 37120 indicators. The life cycle comprises: (Stage 1) identifying the need; (Stage 2) determining whether CS is the right approach; (Stage 3) designing the project; (Stage 4) building the community; (Stage 5) managing the data; and (Stage 6) evaluating the project. These stages form an iterative process. In Stage 5 (data management), the AI-CS ecosystem described in [
7] conceptually informs the process shown in
Figure 2.
Throughout this manuscript, we follow the terminological convention of Fortson et al. [
7], who use “artificial intelligence” (AI) as an umbrella term that encompasses machine learning (ML) and reserve specific ML terminology for concrete techniques. Accordingly, we use “AI” when referring to the conceptual AI-CS ecosystem and its human-in-the-loop and machine-in-the-loop modalities, and “machine learning” when describing the specific analytical technique employed. The spatial pattern analysis is performed with DBSCAN, an unsupervised ML clustering algorithm that, as Fortson et al. [
7] note, discovers patterns “through clustering on features inherent in the dataset”. The subsequent modelling of perceived severity is carried out with ordinal logistic regression, a statistical method. This AI/ML distinction is increasingly emphasized in the urban-governance literature [
29,
30].
In our investigation, the objectives are as follows: O1: identify the urban priorities perceived by Ecuadorian citizens according to the ISO 37120 categories and the factors that predict the level of severity of the reported community problems; O2: characterize the spatial patterns that emerge from georeferenced reports and identify how the categories of urban problems differ geographically between urban and rural contexts in Ecuadorian territory. The research questions used to approach both objectives are the following: RQ1—What are the urban priorities perceived by citizens according to ISO 37120 categories and what are the factors that predict the level of severity of community problems? RQ2—What spatial patterns emerge from the georeferenced reports, and how do urban problems categories differ geographically? To answer these questions, an approach based on statistics, logistic regression, and clustering is used to discover valuable insights that support the management of problems faced by citizens.
Drawing on Slovic’s psychometric paradigm, in which perceived lack of control and difficulty of risk reduction are qualitative characteristics associated with higher perceived risk [
31], we hypothesize that the persistence of a problem over time may increase its perceived severity by weakening citizens’ sense that it can be controlled or effectively resolved. Accordingly, two hypotheses address RQ1, concerning the predictors of perceived severity:
H1: The recurrence of a problem determines the perceived severity more than the category or citizen profile;
H2: Citizen Safety problems present a significantly higher proportion of urgent reports than any other ISO 37120 category.
One hypothesis addresses RQ2, concerning the spatial structure of the reports:
H3: The perceived severity of a given ISO 37120 category varies significantly across territories, so that the same type of problem exhibits heterogeneous urgency levels depending on its geographic location.
Both articulated cycles operate as follows: Stage 1 identifies the gap in community data in Ecuadorian DAG as a central problem that justifies our study. Stage 2 validates that CS’s contributory approach is appropriate for the scale and required data type. Stage 3 designs the data collection instrument structured in the 22 categories of ISO 37120, implemented in KoboToolbox [
32]. Stage 4 focuses on the conformation of the community of data collectors, made up of 57 students from Practicum 3 and the citizens participating in their territories. Stage 5 manages data in three sequential phases: collection, processing, and analysis. The AI-CS ecosystem of [
7] is integrated in the analysis phase, where the citizen acts as an autonomous sensor in the collection and AI intervenes exclusively in the subsequent analysis through DBSCAN. Stage 6 evaluates the project using formative criteria during data collection and summative criteria by verifying the proposed hypotheses and analyzing the geographic coverage achieved. Each stage is detailed below.
3.1. Stage 1: Problem Identification
Through the research carried out, the main problem is the lack of public community information in Ecuadorian DAG and the lack of citizen participation in the public sphere for territorial planning [
11,
12]. Also, Ortiz-Fernández et al. [
33] point out that to assess urban sustainability in Ecuador, the availability of data has become critical in public institutions. Official sources of open data in Ecuador are very limited, as official data presents access problems and outdated information [
34]. In our study, this problem was framed from three complementary perspectives, each of which informed a specific design decision. First, from the perspective of the DAG, the lack of territorially disaggregated data on community needs limits their capacity for evidence-based territorial planning; this need motivated the choice of a georeferenced reporting instrument organized by standardized urban categories, so that the resulting data would be directly usable for planning. Second, from the perspective of citizens, the absence of accessible channels to report the problems they experience limits their participation in the public sphere; this motivated the use of an accessible digital instrument that any resident could complete without specialized knowledge. Third, from the perspective of the university, the need to generate applied knowledge with social relevance motivated the involvement of students as data collectors within a structured academic activity, linking research training with community engagement. The convergence of these three perspectives justifies a citizen science approach that simultaneously addresses local governments’ data needs, citizens’ participation, and the university’s commitment to producing socially relevant applied knowledge. To structure the data collection, ISO 37120 (2018) was adopted as the taxonomic structure. Considering that this international standard defines standardized indicators to measure the performance of urban services and the quality of life in any city or local government [
9]. This selection responds to its alignment with SDG 11; its multidimensional coverage, such as water, environment, safety, transport, housing, health, governance, economy, among others; and its ability to be directly implemented as a categorization system for citizen reports.
3.2. Stage 2: Validation of CS Approach
At this stage, participant benefit was assessed retrospectively through evidence emerging from project activities; this means no standardized instrument was applied to validate the approach. Future phases of the project will incorporate instruments to assess participant benefit in terms of perceived learning, empowerment, digital and data literacy, motivation, and the perceived usefulness of the project outcomes.
As of the current date, the suitability of the CS approach was evaluated by following the criteria defined by Fraisl et al. [
13], who established that a CS project is appropriate when two conditions are met: (1) that citizen participation allows for the desired research results to be achieved, and (2) that participants benefit by having their needs met or by developing new skills and competencies. In regard to the first condition, the required data (georeferenced reports of community problems) were collected by non-experts with accessible digital tools. Also, the national scope of the project (22 provinces, 93 cantons) required a data-distributed collection that would be unfeasible using conventional centralized methods. Regarding the second condition, the benefits were verified at both levels: the reporting citizens, who constitute 87.3% of the reports (as detailed in
Section 4.1.2) benefited from having a structured channel to make the problems in their own communities visible to the DAG, and the 57 university students of the Practicum 3 subject of the Information Technologies career obtained benefits in their professional training by developing skills in data collection, the use of digital tools and territorial analysis.
Additionally, the complementary factors indicated by [
13] were verified: the required level of experience was viable with basic training, the coordination efforts (assignment of tasks and responsibilities) were manageable through the academic structure of the Practicum 3 subject and the available resources were sufficient according to the institutional nature of the project.
3.3. Stage 3: Project Design
The data collection instrument used in our study is a structured digital survey implemented in KoboToolbox. For the disaggregation of the 22 ISO 37120 categories into citizen reporting subcategories, the core and support indicators of each category were considered: the feasibility of direct observation by non-expert citizens and its relevance to SDG 11. Before field deployment, the instrument underwent a content validation process conducted by a panel of four experts with recognized experience in sustainable development and citizen participation. The validation followed a three-rounds review procedure, during which each expert independently assessed the survey instrument and provided recommendations for refinement. The evaluation focused on two criteria. The first is correspondence, defined as the degree of alignment between each citizen-reportable subcategory and the corresponding ISO 37120 category and indicator, which ensured that the survey adequately represented the conceptual scope of the standard. The second is clarity, defined as the comprehensibility, wording, and interpretability of the survey items and response scales for non-expert citizens, to ensure that questions could be consistently understood across diverse urban and rural contexts. Expert feedback was systematically reviewed by the research team, and the instrument was revised until consensus was achieved regarding both conceptual alignment with ISO 37120 and the clarity of the questionnaire before its implementation.
Table 1 summarizes the structure of the instrument.
The participating DAG included 22 cities in Ecuador and cantons associated with them. The categories to consult in each territory were not uniform: the participating DAG and community representatives were selected from the 22 available categories, with priority given according to the specific sector or population’s needs to guarantee the local relevance of the instrument. Before its deployment, the instrument was validated by experts in urban and sustainable development, who evaluated the correspondence of the subcategories with ISO 37120 indicators, the clarity of the response scales and the viability of citizen reporting in rural and urban contexts.
The perceived severity variable was measured using a three-point Likert-type scale (mild, moderate, and urgent) to improve cognitive accessibility for citizens with diverse educational and technological backgrounds, facilitate large-scale citizen reporting, and reduce respondent burden and ambiguity between adjacent categories. Although a five-point scale could provide greater measurement of granularity, the three-level scale was considered sufficient to support operational prioritization while maintaining ease of use.
3.4. Stage 4: Community Building
The community was built on two levels. At the collector level, 57 students received training on the survey protocol, informed consent, and the use of digital tools. At the community level, the students established contact with residents, merchants, visitors and other actors in their cantons using face-to-face interactions and digital channels. Coverage reached 22 provinces, 93 cantons and 181 parishes between October 2025 and February 2026. Inclusivity was prioritized through digital and paper-based modalities.
Prior to fieldwork, the 57 student data collectors completed a one-month training program designed to standardize survey implementation and ensure high-quality data collection. The training covered the survey protocol, including the study objectives, sampling procedures, questionnaire administration, and standardized interviewing techniques. Particular emphasis was placed on ethical considerations, with instruction on informed consent procedures, participant confidentiality, and the responsible handling of research data. Students also received hands-on training in the use of digital data collection and monitoring tools, including KoboToolbox for questionnaire administration and data management, and Microsoft Power BI Desktop (v2.155) [
35] for data visualization and progress monitoring. In addition, the program established standardized guidelines for data capture, emphasizing questionnaire completeness, response accuracy, real-time validation, and adherence to predefined quality-control procedures. The training combined theoretical instruction with practical exercises and pilot data collection activities to ensure that all participants achieved a consistent level of technical proficiency before the start of field operations.
To ensure inclusivity, paper-based questionnaires were incorporated as an alternative data collection modality for participants who were unable or unwilling to complete the digital survey due to limited internet connectivity, lack of access to electronic devices, or low digital literacy. The paper instrument was identical to the KoboToolbox questionnaire, ensuring consistency in question wording, response options, and survey flow across both collection modalities. After fieldwork, completed paper questionnaires were digitized through manual data entry into KoboToolbox by trained personnel. To ensure data quality, each digitized record was verified against the original paper questionnaire, with discrepancies resolved through a second review. Additional quality-control procedures included completeness checks, consistency validation, and routine supervisory oversight before the records were merged into the final KoboToolbox database. This hybrid data collection strategy expanded participation while preserving the integrity, comparability, and quality of the final dataset.
3.5. Stage 5: Data Management
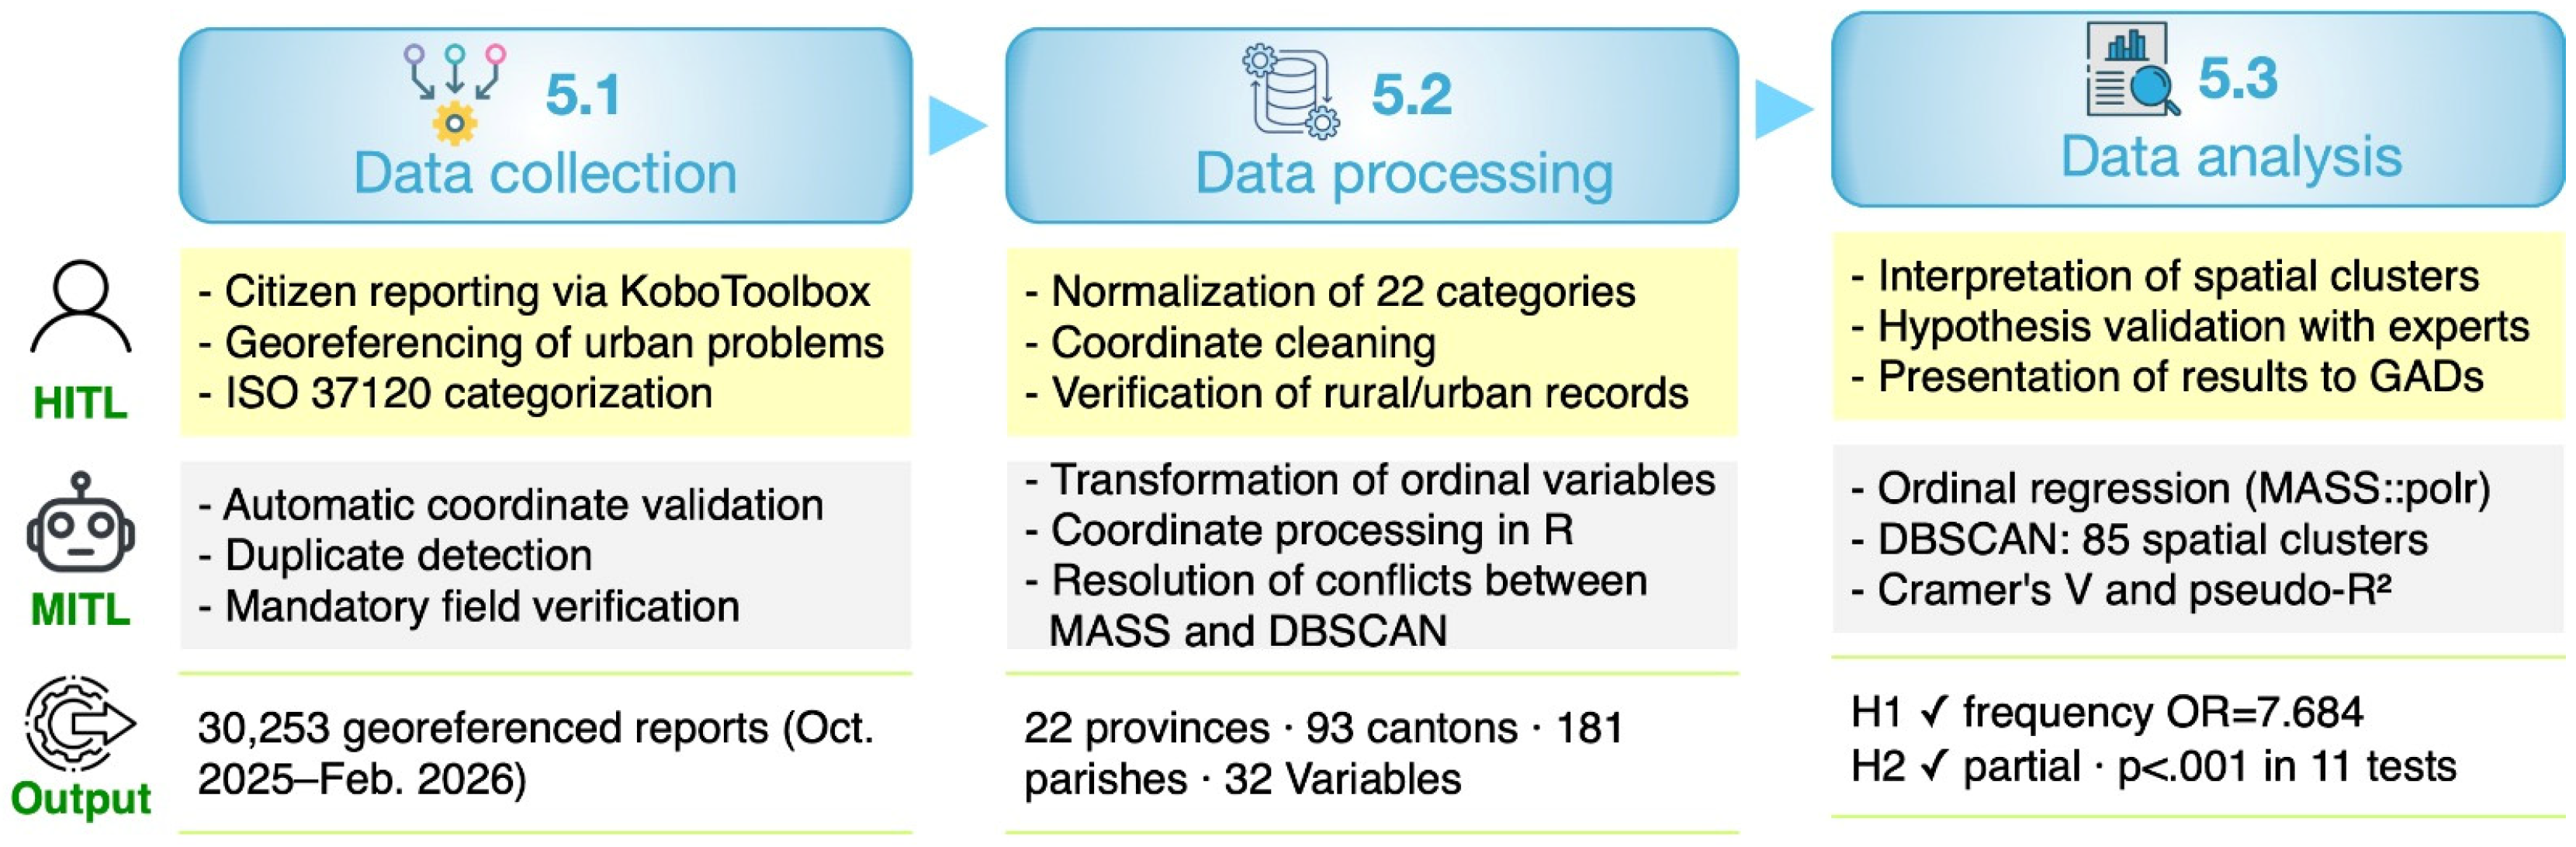
The data management phase is based on the CS-AI ecosystem of Fortson et al. [
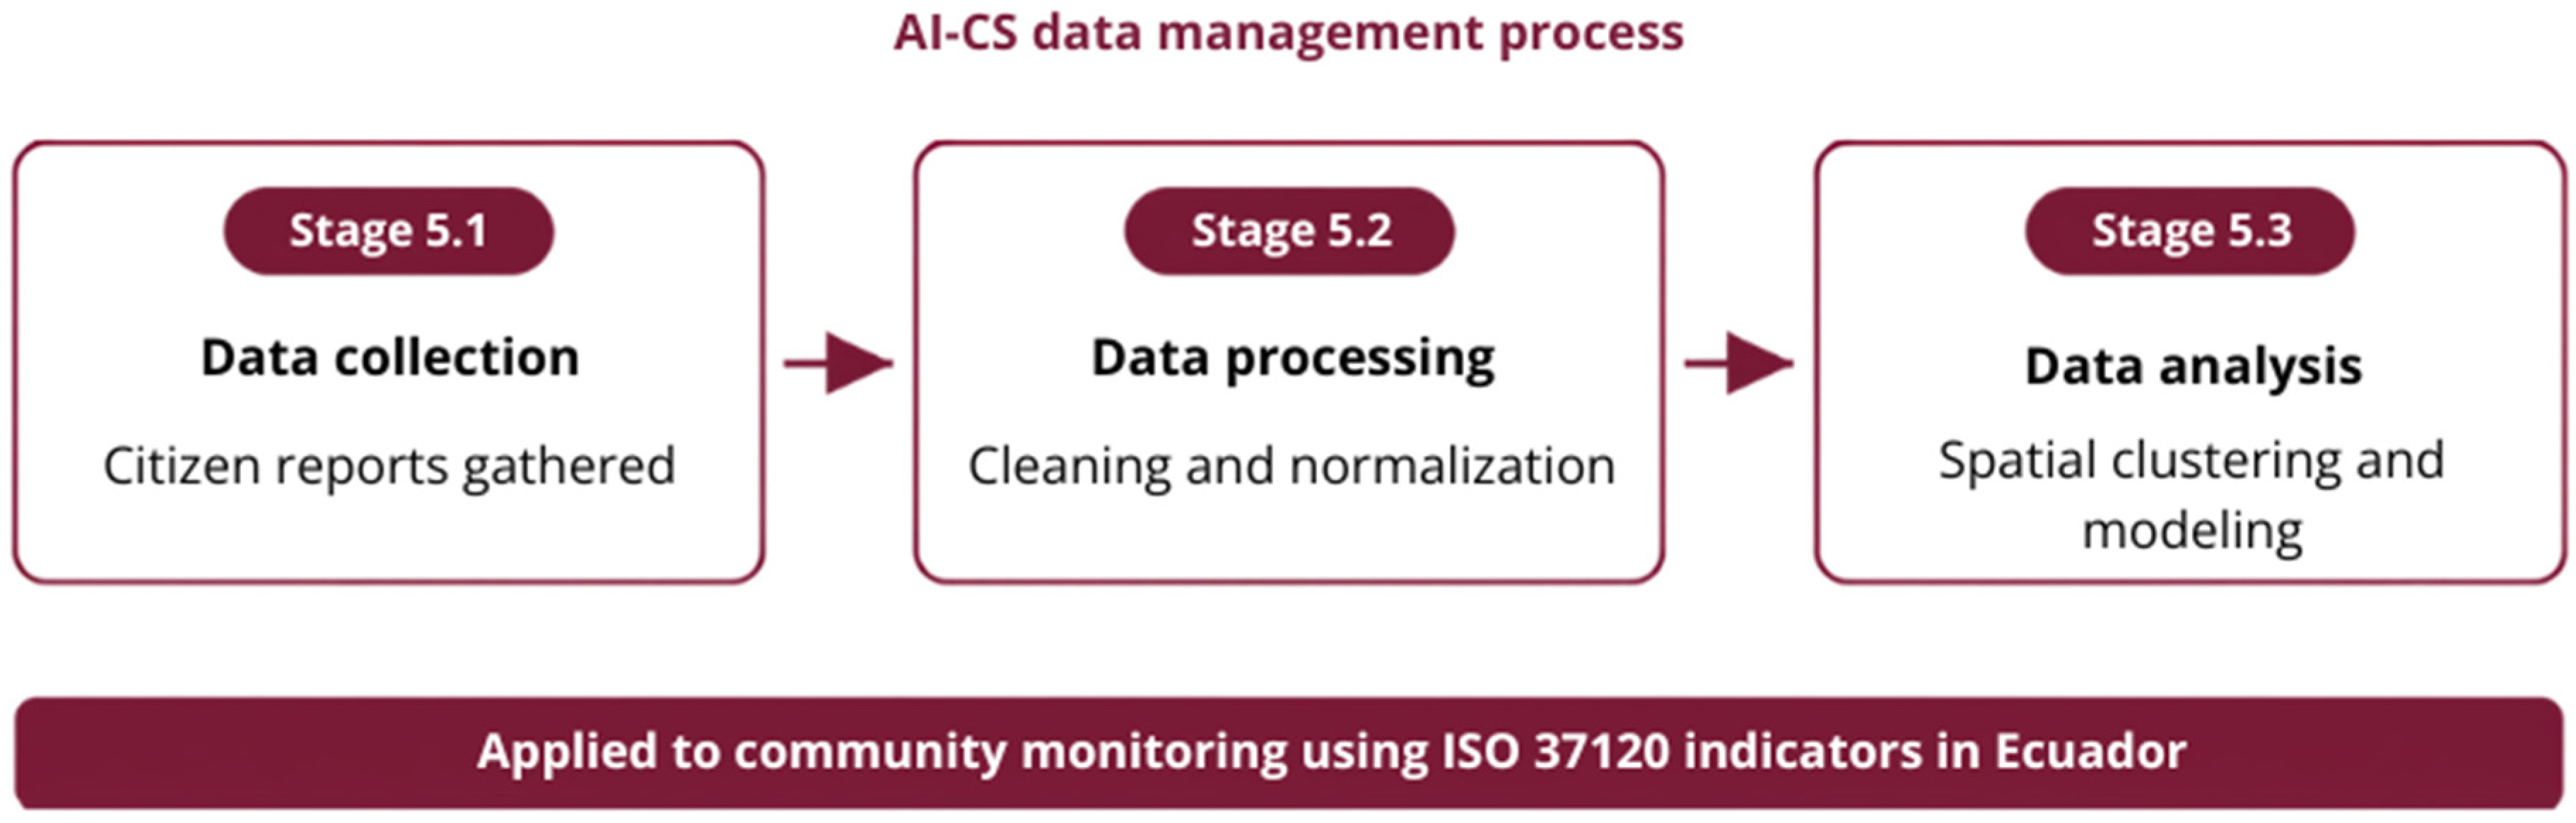
7], which consists of three components: (1) data collection, (2) data processing and (3) data analysis. A clear separation of roles is established: the citizen acts in the collection, while AI intervenes exclusively in the data processing and analysis phases, preserving the independence of the citizen data (see
Figure 3).
3.5.1. Stage 5.1: Data Collection
Based on the Copenhagen principles [
14], the collection produced 30,253 georeferenced reports distributed across 22 provinces, without machine-learning intervention during capture. Data quality was managed through two complementary types of procedures. Quality Assurance (QA), of a preventive nature, aimed to prevent errors before and during data capture, and comprised the training of student collectors and the use of standardized reporting protocols. Quality Control (QC), of a corrective nature, aimed to detect and correct errors in the collected data, and comprised expert review of the records, detection and removal of duplicates, and validation of the GPS coordinates. Together, these procedures resulted in a dataset organized into the 22 standardized categories aligned with ISO 37120.
3.5.2. Stage 5.2: Data Processing
The raw data exported from KoboToolbox (30,253 records × 32 variables) were subjected to a preparation pipeline in R v4.5.2, following four sequential steps:
Step 1—Normalization of Categories: The category field contained 29 textual variants arising from writing inconsistencies (capitalization, spacing, and accents). Through automated text-pattern normalization—that is, case folding, whitespace and accent removal, and rule-based mapping of the textual variants to canonical labels—these were consolidated into the 22 canonical ISO 37120 categories, removing ambiguity in the main independent variable.
Step 2—Coordinate Debugging and Validation: The records had two coordinate sources (manual entry and automatic device geolocation). A priority fusion strategy was applied: the GPS coordinate of the device was used when available; otherwise, the coordinates were manually entered by the collector. Coordinates outside Ecuadorian territory were eliminated through range restrictions (latitude −5.2° to 1.7°; longitude: −92° to −75.0°), resulting in 29,977 valid georeferenced records (99.1%).
Step 3—Coding of Ordinal and Nominal Variables: The dependent variables’ perceived severity (free text: “mild”; “moderate”; “urgent”) were recoded as a three-level, ordered factor (1 < 2 < 3), ordinal regression model requirement. The frequency of the problem and the age range were also coded as ordered factors.
Step 4—Territorial Variable Incorporation: The type of parish (urban or rural) did not appear on the instrument, so it was incorporated as a binary factor from the crossing with the territorial code of the National Institute of Statistics and Censuses of Ecuador.
The metadata of the resulting data set were standardized according to the FAIR (Findable, Accessible, Interoperable, Reusable) principles to be archived and reused. To enhance findability, each dataset version was assigned a unique identifier, version number, creation date, and comprehensive metadata describing the study objectives, data sources, variable definitions, geographic coverage, temporal scope, collection methodology, and quality-control procedures. A structured data dictionary and metadata documentation were maintained to facilitate dataset discovery and interpretation by authorized users.
Accessibility was implemented through a controlled-access model. Because the database contains georeferenced citizen observations that could increase the risk of indirect participant identification, individual-level records are not publicly released. Instead, access to anonymized datasets is granted upon justified research request and institutional authorization, while aggregated indicators, summary statistics, and interactive dashboards are publicly available to support transparency without compromising privacy.
To ensure interoperability, the database was organized using standardized variable names, controlled vocabularies, and internationally recognized coding schemes. Geospatial information was stored using the WGS84 coordinate reference system (EPSG:4326), territorial identifiers followed the official Ecuadorian DPA-INEC classification, and citizen reports were classified according to the ISO 37120 taxonomy. Data were maintained in interoperable formats (CSV, GeoJSON, and ESRI-compatible geospatial layers), enabling integration with GIS platforms, statistical software, and business intelligence tools.
Finally, reusability was supported through comprehensive metadata, documented data-processing protocols, version control, and standardized coding procedures. Although individual observations remain protected under ethical and privacy requirements, the combination of rich metadata, standardized formats, and documented workflows ensures that the resulting datasets can be reliably interpreted, integrated, and reused for future urban analytics, comparative studies, and evidence-based decision-making.
3.5.3. Stage 5.3: Data Analysis
In this analysis phase, within the AI-CS cycle of Fortson et al. [
7], spatial pattern analysis was performed with DBSCAN (Density-Based Spatial Clustering of Applications with Noise), an unsupervised machine-learning clustering algorithm that identifies geographic concentrations of reports without requiring prior specification of the number of clusters or assuming predefined geometric shapes [
36,
37]. This implements the machines-in-the-loop modality of Fortson et al. [
7], in which the algorithm automatically detects spatial patterns that would be unfeasible to identify manually at the scale of 29,977 georeferenced reports. The other levels of analysis were performed through inferential statistics, which were structured in four progressive levels.
Table 2 summarizes the tests applied, the purpose and the validation criteria applied for each level.
The selection of each test responds to statistical criteria derived directly from the variables’ nature and their measurement scale. The details of each level are explained below:
Descriptive level analysis constitutes the basis of the study, as it characterizes the complete distribution of the 30,253 reports before applying any inferential statistical techniques. Frequencies and percentages were used to describe the distribution of reports by ISO 37120 category, perceived severity level, frequency of the problem, demographic profile of the reporter, and type of parish (urban/rural). This choice responds to the fact that the instrument of the variables combines scales such as nominal (category, role, type of parish), ordinal (severity, frequency, age) and continuous (GPS coordinates), which makes the use of a single summary statistic inadequate. The mean and standard deviation (SD) are used only for the perceived severity variable, despite its three-level ordinal nature, and are presented as complementary descriptive statistics to facilitate comparison between categories. This decision is supported by evidence from [
38], demonstrating the robustness of parametric statistics, including the mean and standard deviation when they are applied to data from Likert-type ordinal scales, without compromising the validity of the conclusions. The cumulative percentage allows to identify which categories concentrate the largest proportion of reports and in which parts of the ranking 50% and 75% of the total are reached, information that is directly useful for the prioritization of resources by the DAG. The urban/rural dimension is incorporated as a contextual variable of analysis, allowing for a comparison of the descriptive profiles between both territorial contexts and evaluation of possible differences in citizen priorities according to the type of parish.
At the association level, the chi-square statistical test is used in combination with Cramer’s V instead of Pearson or Spearman correlation coefficients because, with categorical variables, the analysis has to be based on observed frequencies and not on statistics derived from measures of central tendency, as occurs in correlation coefficients [
39]. As the Chi-square statistical test is sensitive to sample size (N = 29,909), Cramer’s V is incorporated as a measure of effect size normalized between 0 and 1, which facilitates the comparison of the real magnitude of associations between pairs of categorical variables [
39]. The analysis was complemented by the Kruskal–Wallis and Wilcoxon tests because the dependent variable “severity” is of the ordinal nature with three levels, without guaranteed equidistant intervals, which invalidates the assumption of normality and cardinality required by parametric tests such as ANOVA or Student’s t. Therefore, non-parametric tests were used, such as the Kruskal–Wallis test to compare the distribution of severity between multiple groups (for instance, category, age or role), and the Wilcoxon test for the urban–rural binary comparison; both tests are robust against asymmetric distributions and ordinal variables. Since the Kruskal–Wallis test identifies global differences between groups without specifying which specific pairs differ, post hoc comparisons were made with Bonferroni correction, and the level of significance was adjusted depending on the number of comparisons made in order to control the type I error rate in multiple tests.
At the level of modeling analysis, the dependent variable of perceived severity has three levels with an intrinsic order (mild < moderate < urgent), without guaranteed equidistant intervals, which invalidates the use of linear regression. Multinomial logistic regression was also discarded for ignoring the order of the categories and losing information in the process. Therefore, McCullagh’s proportional odds model [
40] was adopted, since it allows the dependent variable to be modeled as ordinal without assuming cardinality. This approach estimates a single coefficient set for all cutting thresholds and allows for interpreting those coefficients through its exponential transformation as an odds ratios (OR) associated with the cumulative probability of greater severity. The six predictors used correspond to the variables of the instrument with an analytical nature that are susceptible to inclusion in the model: category, frequency, personal impact, age, role and type of parish. The selection of these six predictors is grounded in risk perception theory. Slovic’s psychometric research shows that perceived risk is not determined solely by technical estimates of harm, but is systematically shaped by the qualitative characteristics of the hazard, such as the familiarity, controllability, and voluntariness of exposure, and by cognitive and social factors including personal experience [
31]. Comprehensive models organize these determinants into cognitive, experiential, socio-demographic, and contextual dimensions [
41]. Accordingly, the ISO 37120 category captures the intrinsic nature of the problem; frequency reflects its persistence and the associated sense of control; personal impact reflects the reporter’s direct experience, a known predictor of perceived risk [
41]; age and role account for the heterogeneity of the observer; and parish type incorporates the urban or rural context. The GPS coordinates were reserved for spatial analysis. This subcategory was omitted from the model because of its high granularity: with between one and six subcategories per category, its inclusion would have fragmented the sample into a large number of small cells, reducing statistical power and the stability of the estimates. This exclusion implies that the model does not capture within-category nuances (for example, distinctions among specific problems within the same ISO 37120 category); however, the ISO 37120 category is the appropriate level of analysis for this study, since this is the level at which local governments prioritize and plan urban interventions. The model was implemented using polr() from the MASS (v7.3.65) package in R (v4.5.2). The goodness of fit (GoF) was assessed using three complementary criteria: McFadden’s pseudo-R
2, which quantifies the proportional improvement in the full model regarding the null model, where values between 0.10 and 0.20 are considered acceptable for perception models, because the range of 0.20 to 0.40 indicates excellent fit for [
42], equivalent to a linear R
2 up to 0.80 [
43]; the AIC (Akaike Information Criterion) penalizes model complexity and allows for a comparison of alternative specifications, and the likelihood ratio test (LRT) formally determines whether the complete model is significantly superior to the null model. Stepwise backward selection starts with the complete model and the six predictors and iteratively eliminates those that do not improve the fit; this guarantees a simpler model without loss of explanatory capacity. The complete analysis code, together with a dictionary of the variables used, is openly available in a public repository (Zenodo,
https://doi.org/10.5281/zenodo.21266822) to support reproducibility.
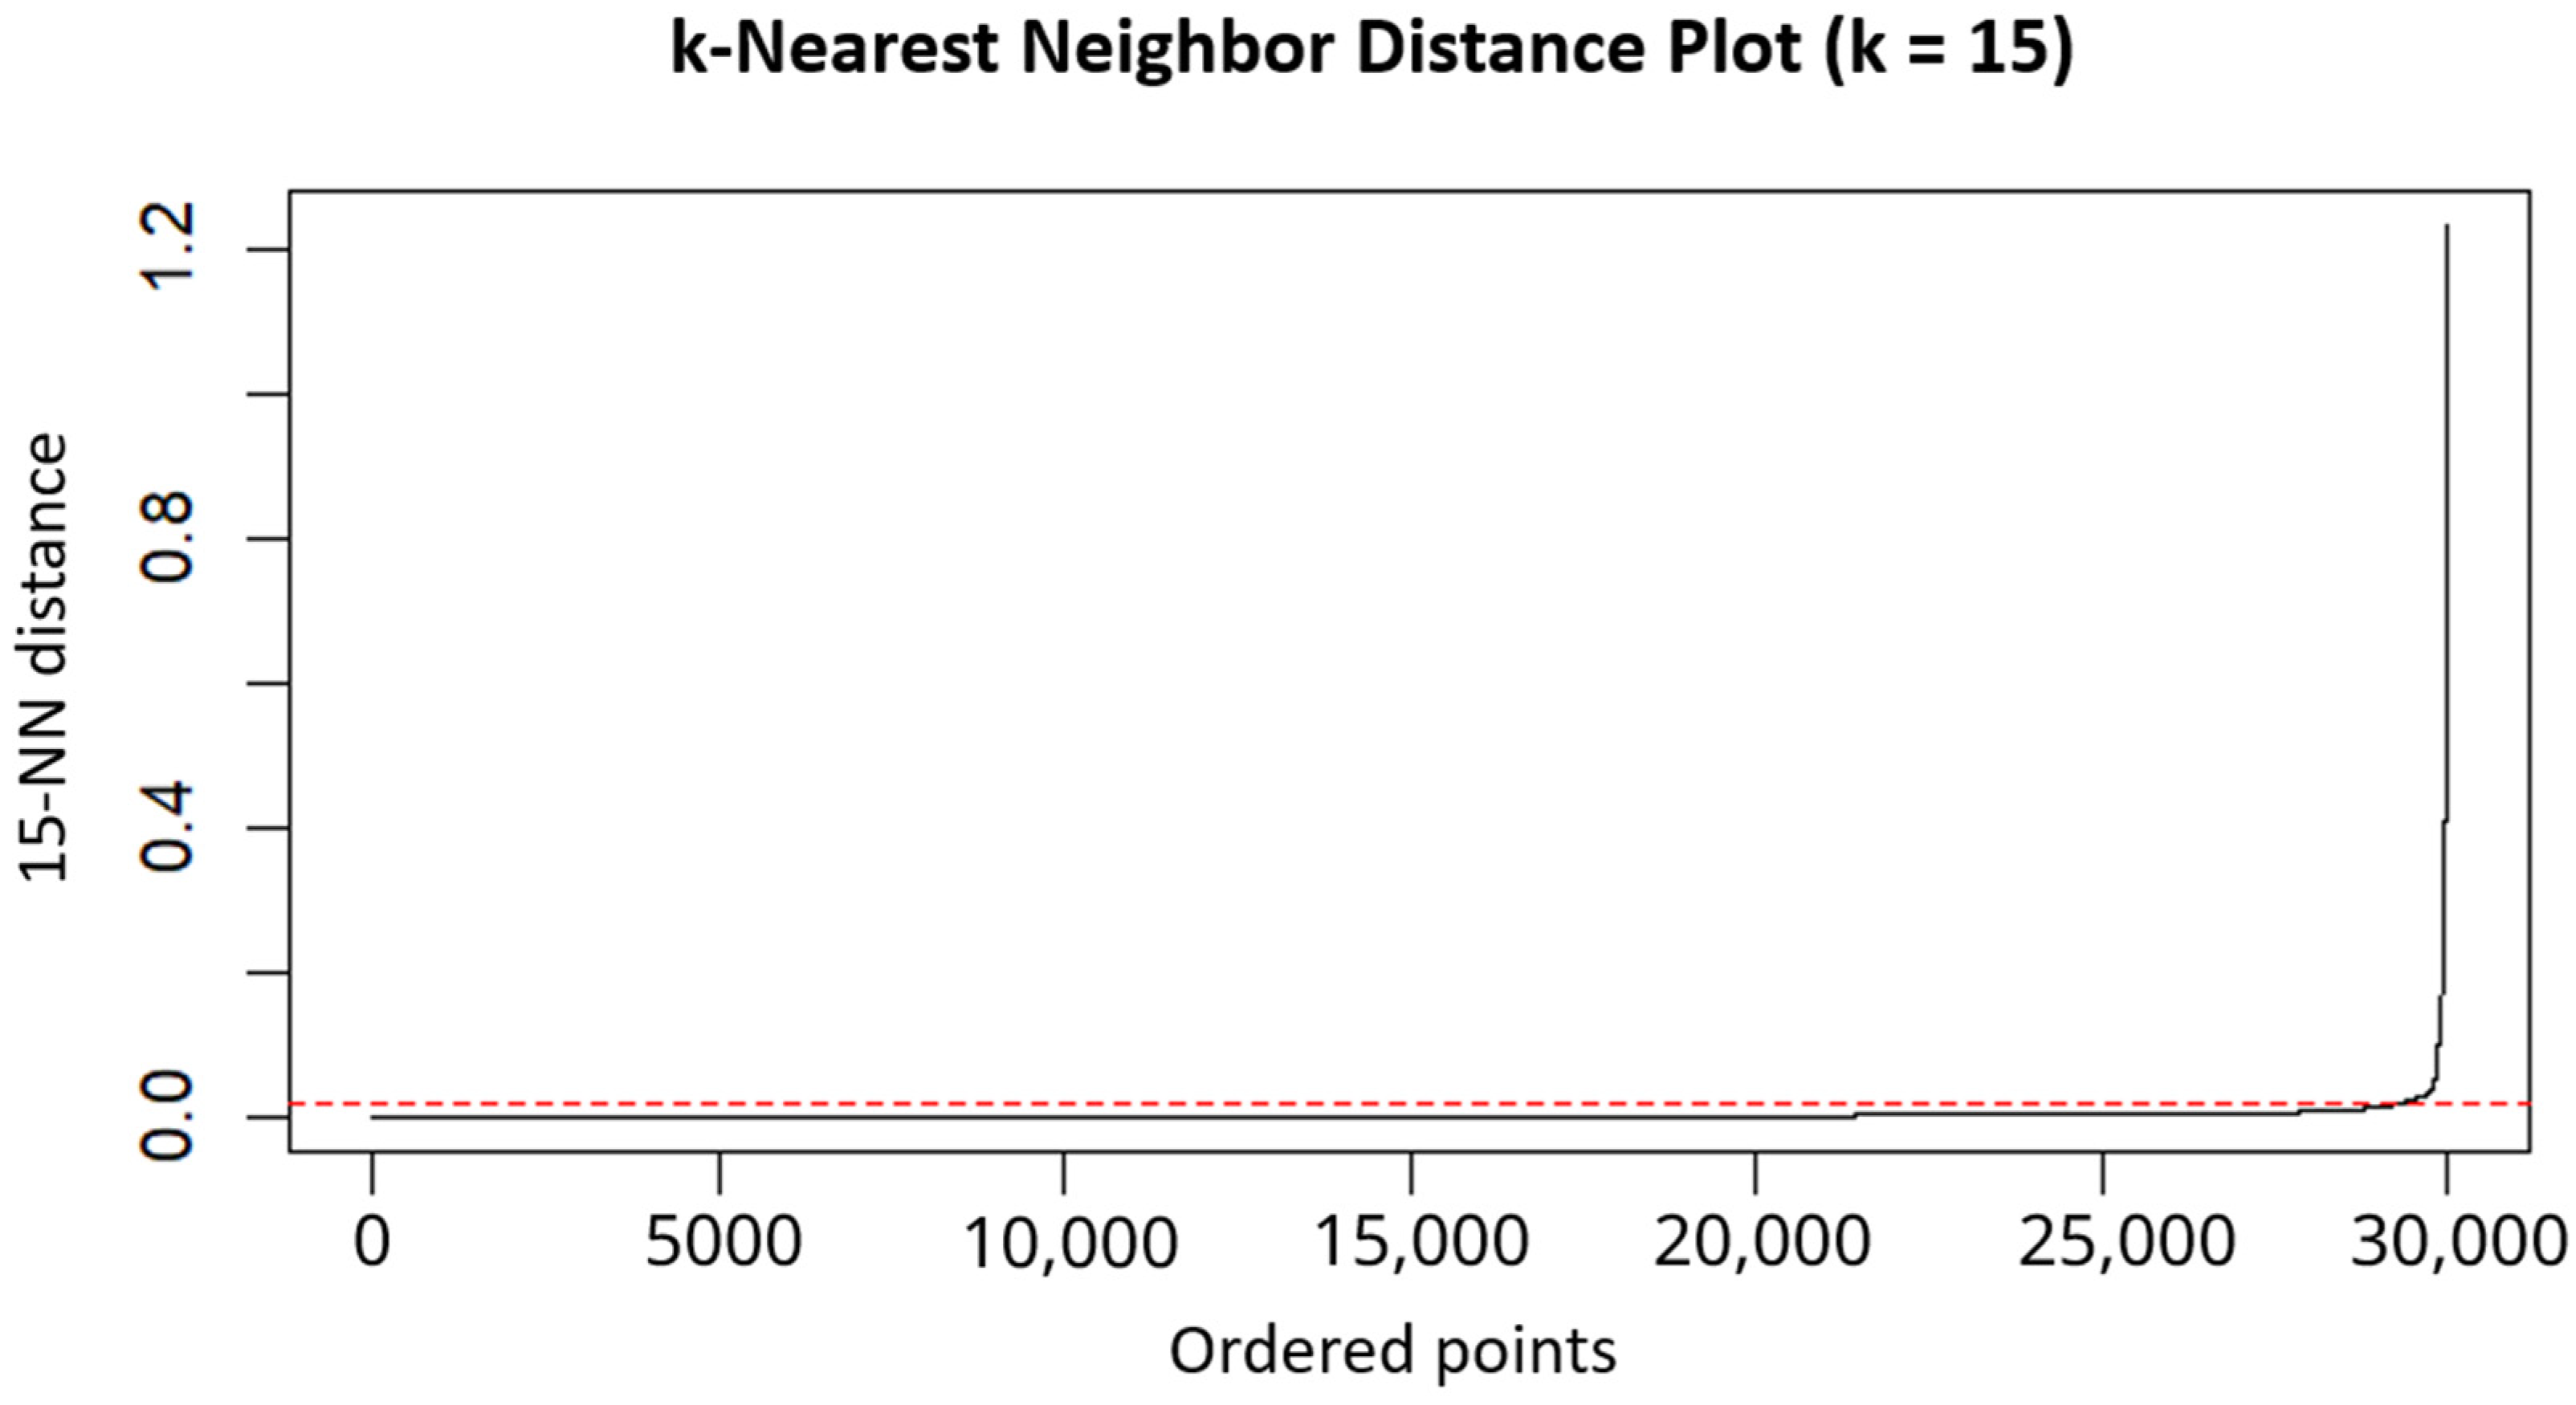
At the spatial analysis level, when the DBSCAN technique is applied, the algorithm requires two decisions: eps (neighborhood radius) and minPts (minimum density). The eps value = 0.12 (expressed in decimal degrees of geographic coordinates, equivalent to approximately 13.3 km at the latitude of Ecuador, where 1° ≈ 111 km) was identified by using the k-distance plot with k = 15, selecting the maximum curvature point of the ordered distance curve [
36]; see
Figure 4. This neighborhood radius allows for clusters to be captured at the cantonal scale, consistent with the territorial unit of study analysis. minPts = 15 was set above the base value of 2 × dim = 4 recommended for two-dimensional data [
36], following the recommendation of [
37], to increase this parameter in large-volume datasets. The low resulting noise proportion of 0.28% (85 points, classified as georeferenced noise of 29,892) confirms the suitability of the selected value, placing itself within a desirable noise range between 1% and 30%, which is established as an indicator of adequate parameters [
37].
The obtained results were integrated into dashboards delivered to the DAGs of Loja and Cuenca and other participants for incorporation into territorial planning processes and for the formulation of public policies [
13].
3.6. Stage 6: Project Evaluation
The evaluation combined formative and summative approaches. The formative evaluation consisted of monitoring during data collection, allowing for the reporting protocols and the assignment of collectors to be adjusted as the campaign progressed. The summative evaluation was based on two complementary sets of criteria. The first set concerned the project as a citizen science initiative and was assessed through independent process and outcome indicators: the territorial coverage achieved (22 of the 24 provinces, 93 cantons, and 181 parishes), the volume and breadth of participation (30,253 reports, of which 87.3% were contributed by non-student citizens), and the quality of the collected data (99.1% of reports with valid GPS coordinates). The second set concerned the research objectives and consisted of the formal verification of the hypotheses through statistical and spatial analyses. This distinction separates the evaluation of the initiative from the testing of the hypotheses. As part of the dissemination of results to local governments, the refined dataset was exported to Power BI [
35] to generate density maps and dashboards individualized for each participating DAG. The results are presented in
Section 4 and discussed in
Section 5.
3.7. Ethical Considerations
This study was derived from the research project “Monitoreo inteligente para comunidades sostenibles basado en la metodología Citizen Science” (protocol code 2026-07-INT-EO-SR-003), which provided the framework for the collection of the 30,253 citizen reports analyzed here. The project was reviewed by the Research Ethics Committee for Human Beings of Universidad Técnica Particular de Loja (CEISH-UTPL), accredited by the competent governmental authority under code DNIVS-CEISH-11-UTPL-30, which determined that it qualifies as risk-free research under Article 27, literal h, of the CEISH-UTPL Internal Regulations, given that the data were collected anonymously and no data allowing the identification of participants were recorded.
Participation was voluntary and based on informed consent, obtained through the digital data-collection instrument prior to any submission. No direct personal identifiers were collected: reporters were characterized only by age range and by the parish of the report, and no names, contact details, or precise home addresses were recorded. Participation was restricted to adults. The georeferenced coordinates correspond to the location of the reported community problem, not to the reporter’s residence, which further protects participant privacy. The management of citizen-generated data followed the principles for the governance of citizens’ data of the Copenhagen Framework [
14], ensuring transparency, proportionality, and responsible data stewardship throughout the project life cycle.
4. Results
This section presents the results of the analysis of 30,253 georeferenced citizen reports, collected between October 2025 and February 2026 in 22 provinces of Ecuador, with the support of 57 university students from a higher education institution. After the standardization of canonical categories (22 standardized ISO 37120 categories), the resulting analysis was organized into four levels: (N.1) descriptive, (N.2) association, (N.3) modeling and (N.4) spatial. The results are directly linked to the two research questions (RQ1, RQ2) and the two formulated hypotheses (H1, H2).
4.1. Methodological Design of the Process of Collecting Disaggregated Community Data
This section presents the general results of the data collection process, characterizing the territorial coverage achieved, the quality of the records obtained, and the general profile of the resulting dataset. These indicators allow us to establish the starting point for the descriptive, association, modeling and spatial analysis that are developed in the following sections.
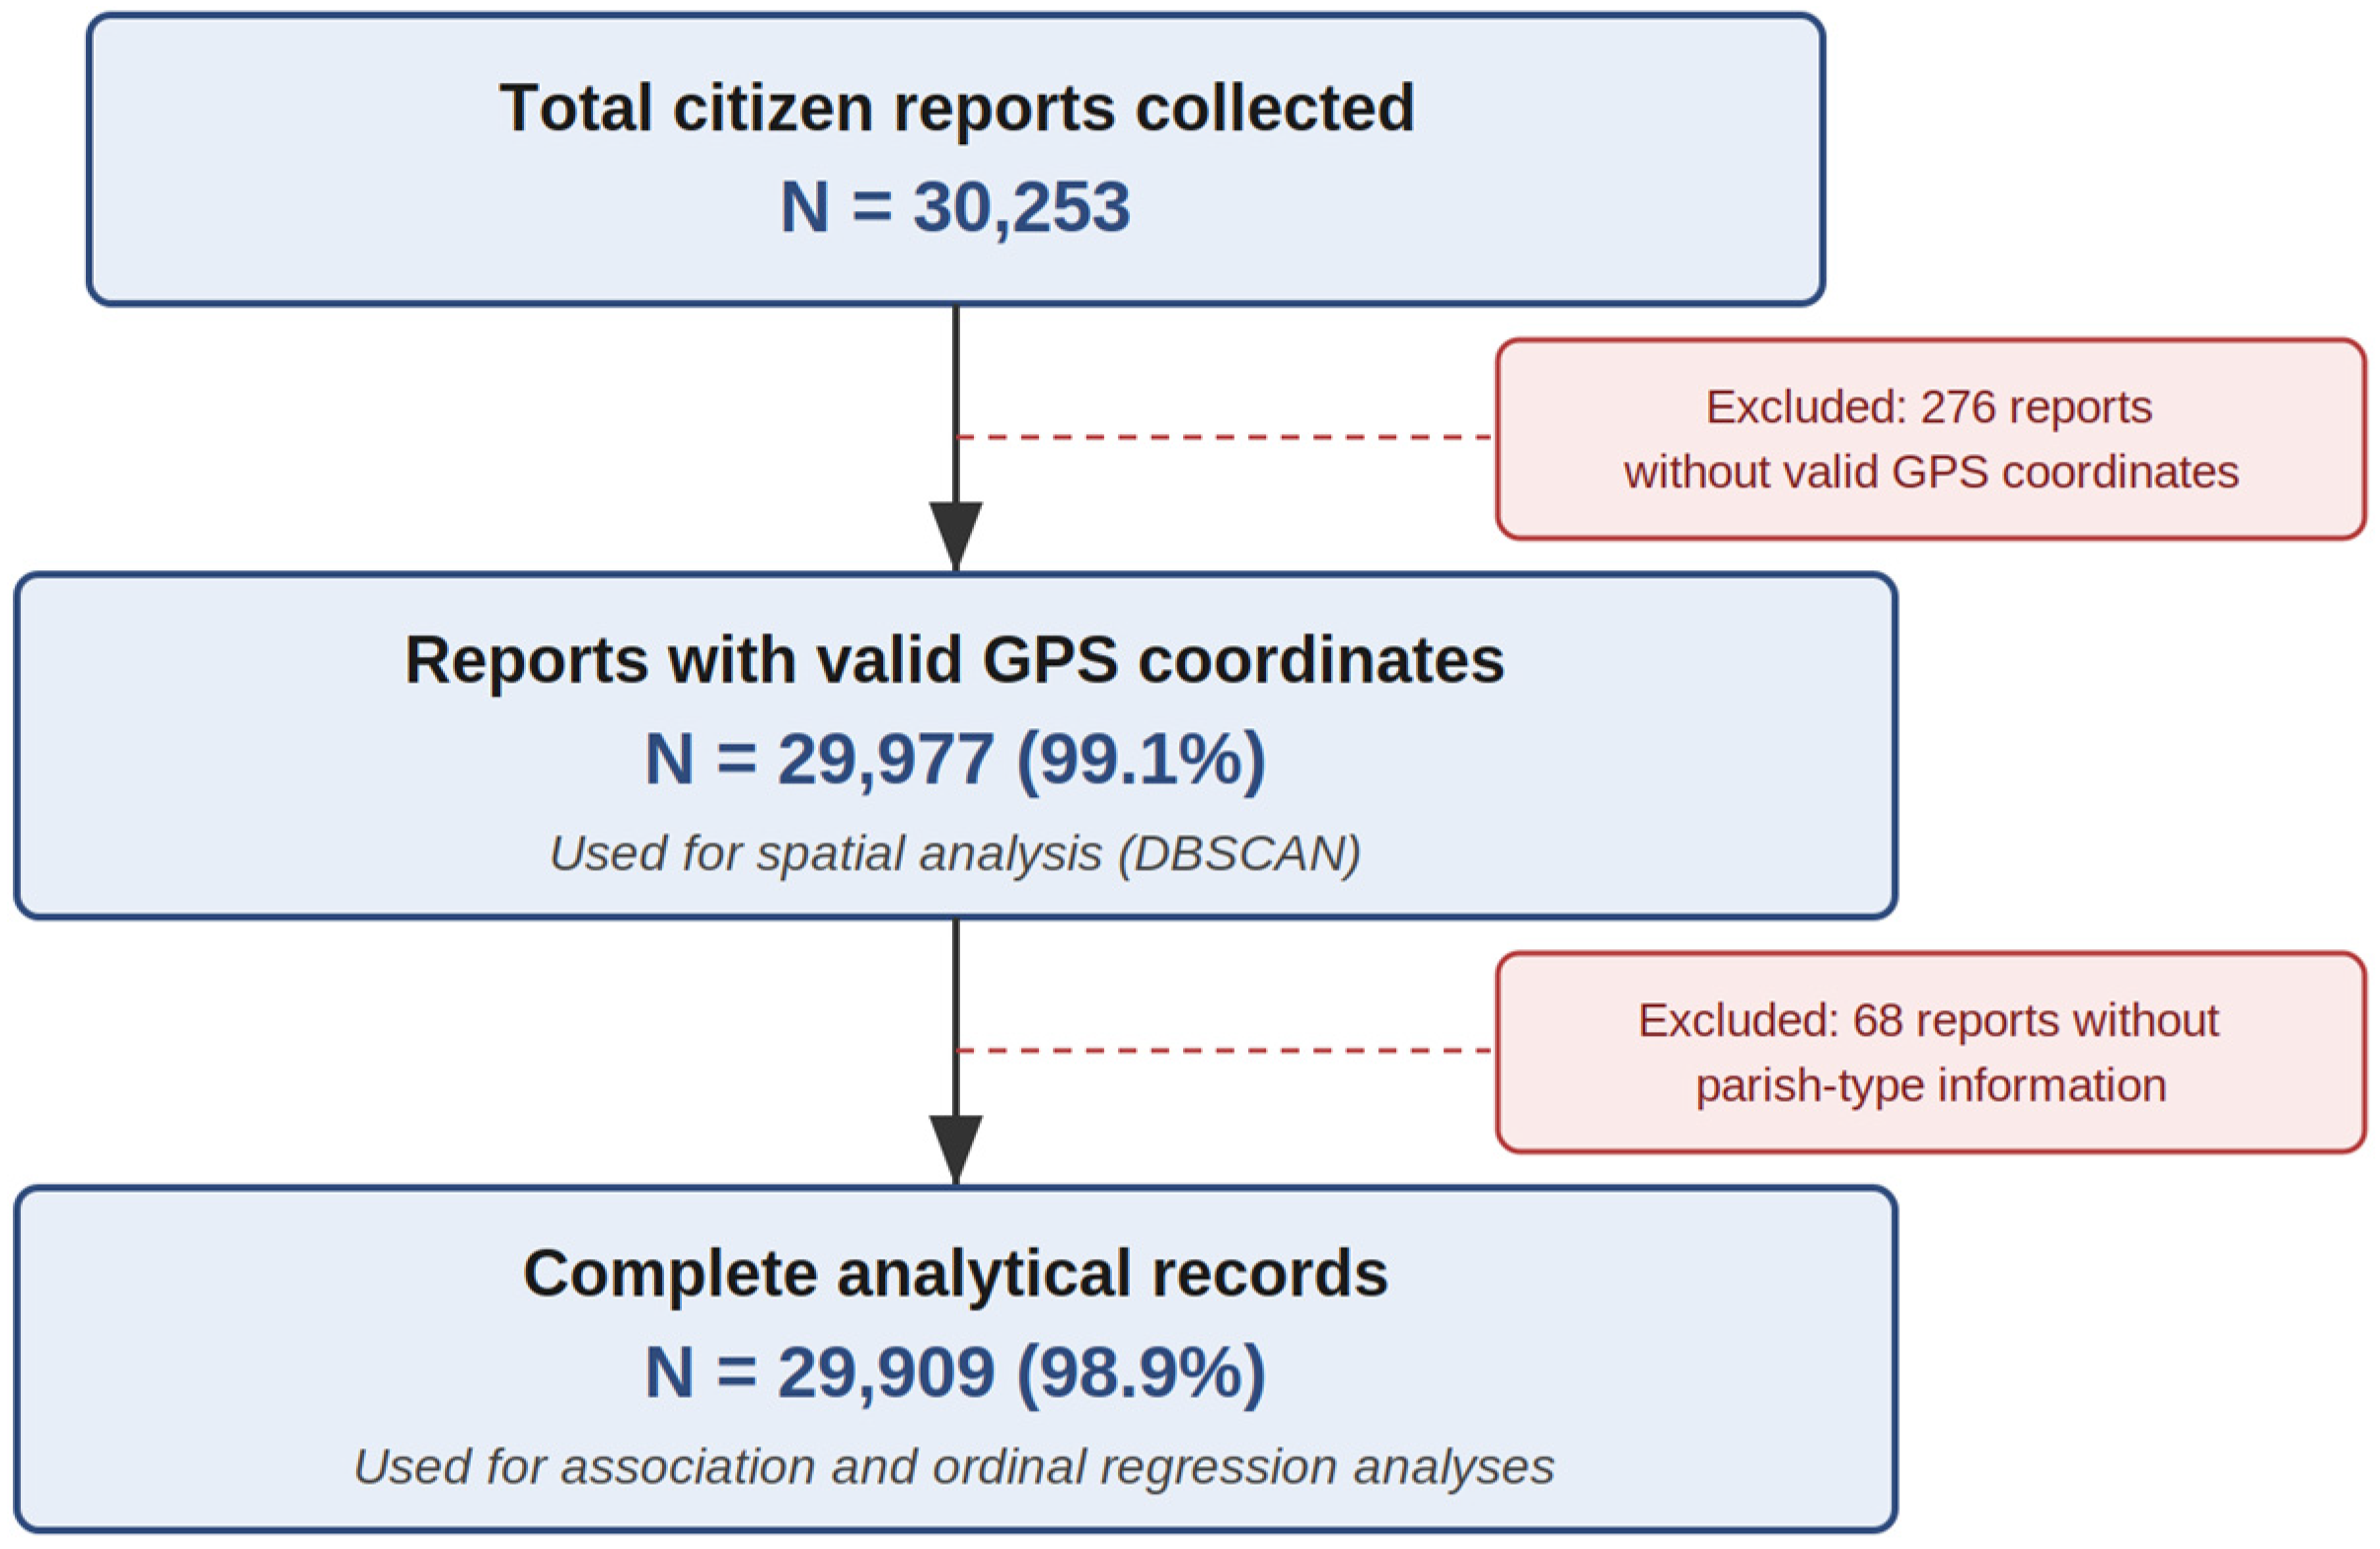
From the total of 30,253 reports, 29,977 (99.1%) had valid GPS coordinates and were used for spatial analysis, and 29,909 (98.9%) also included parish-type information and were used for the association and regression analyses, as shown in the record-inclusion flowchart (
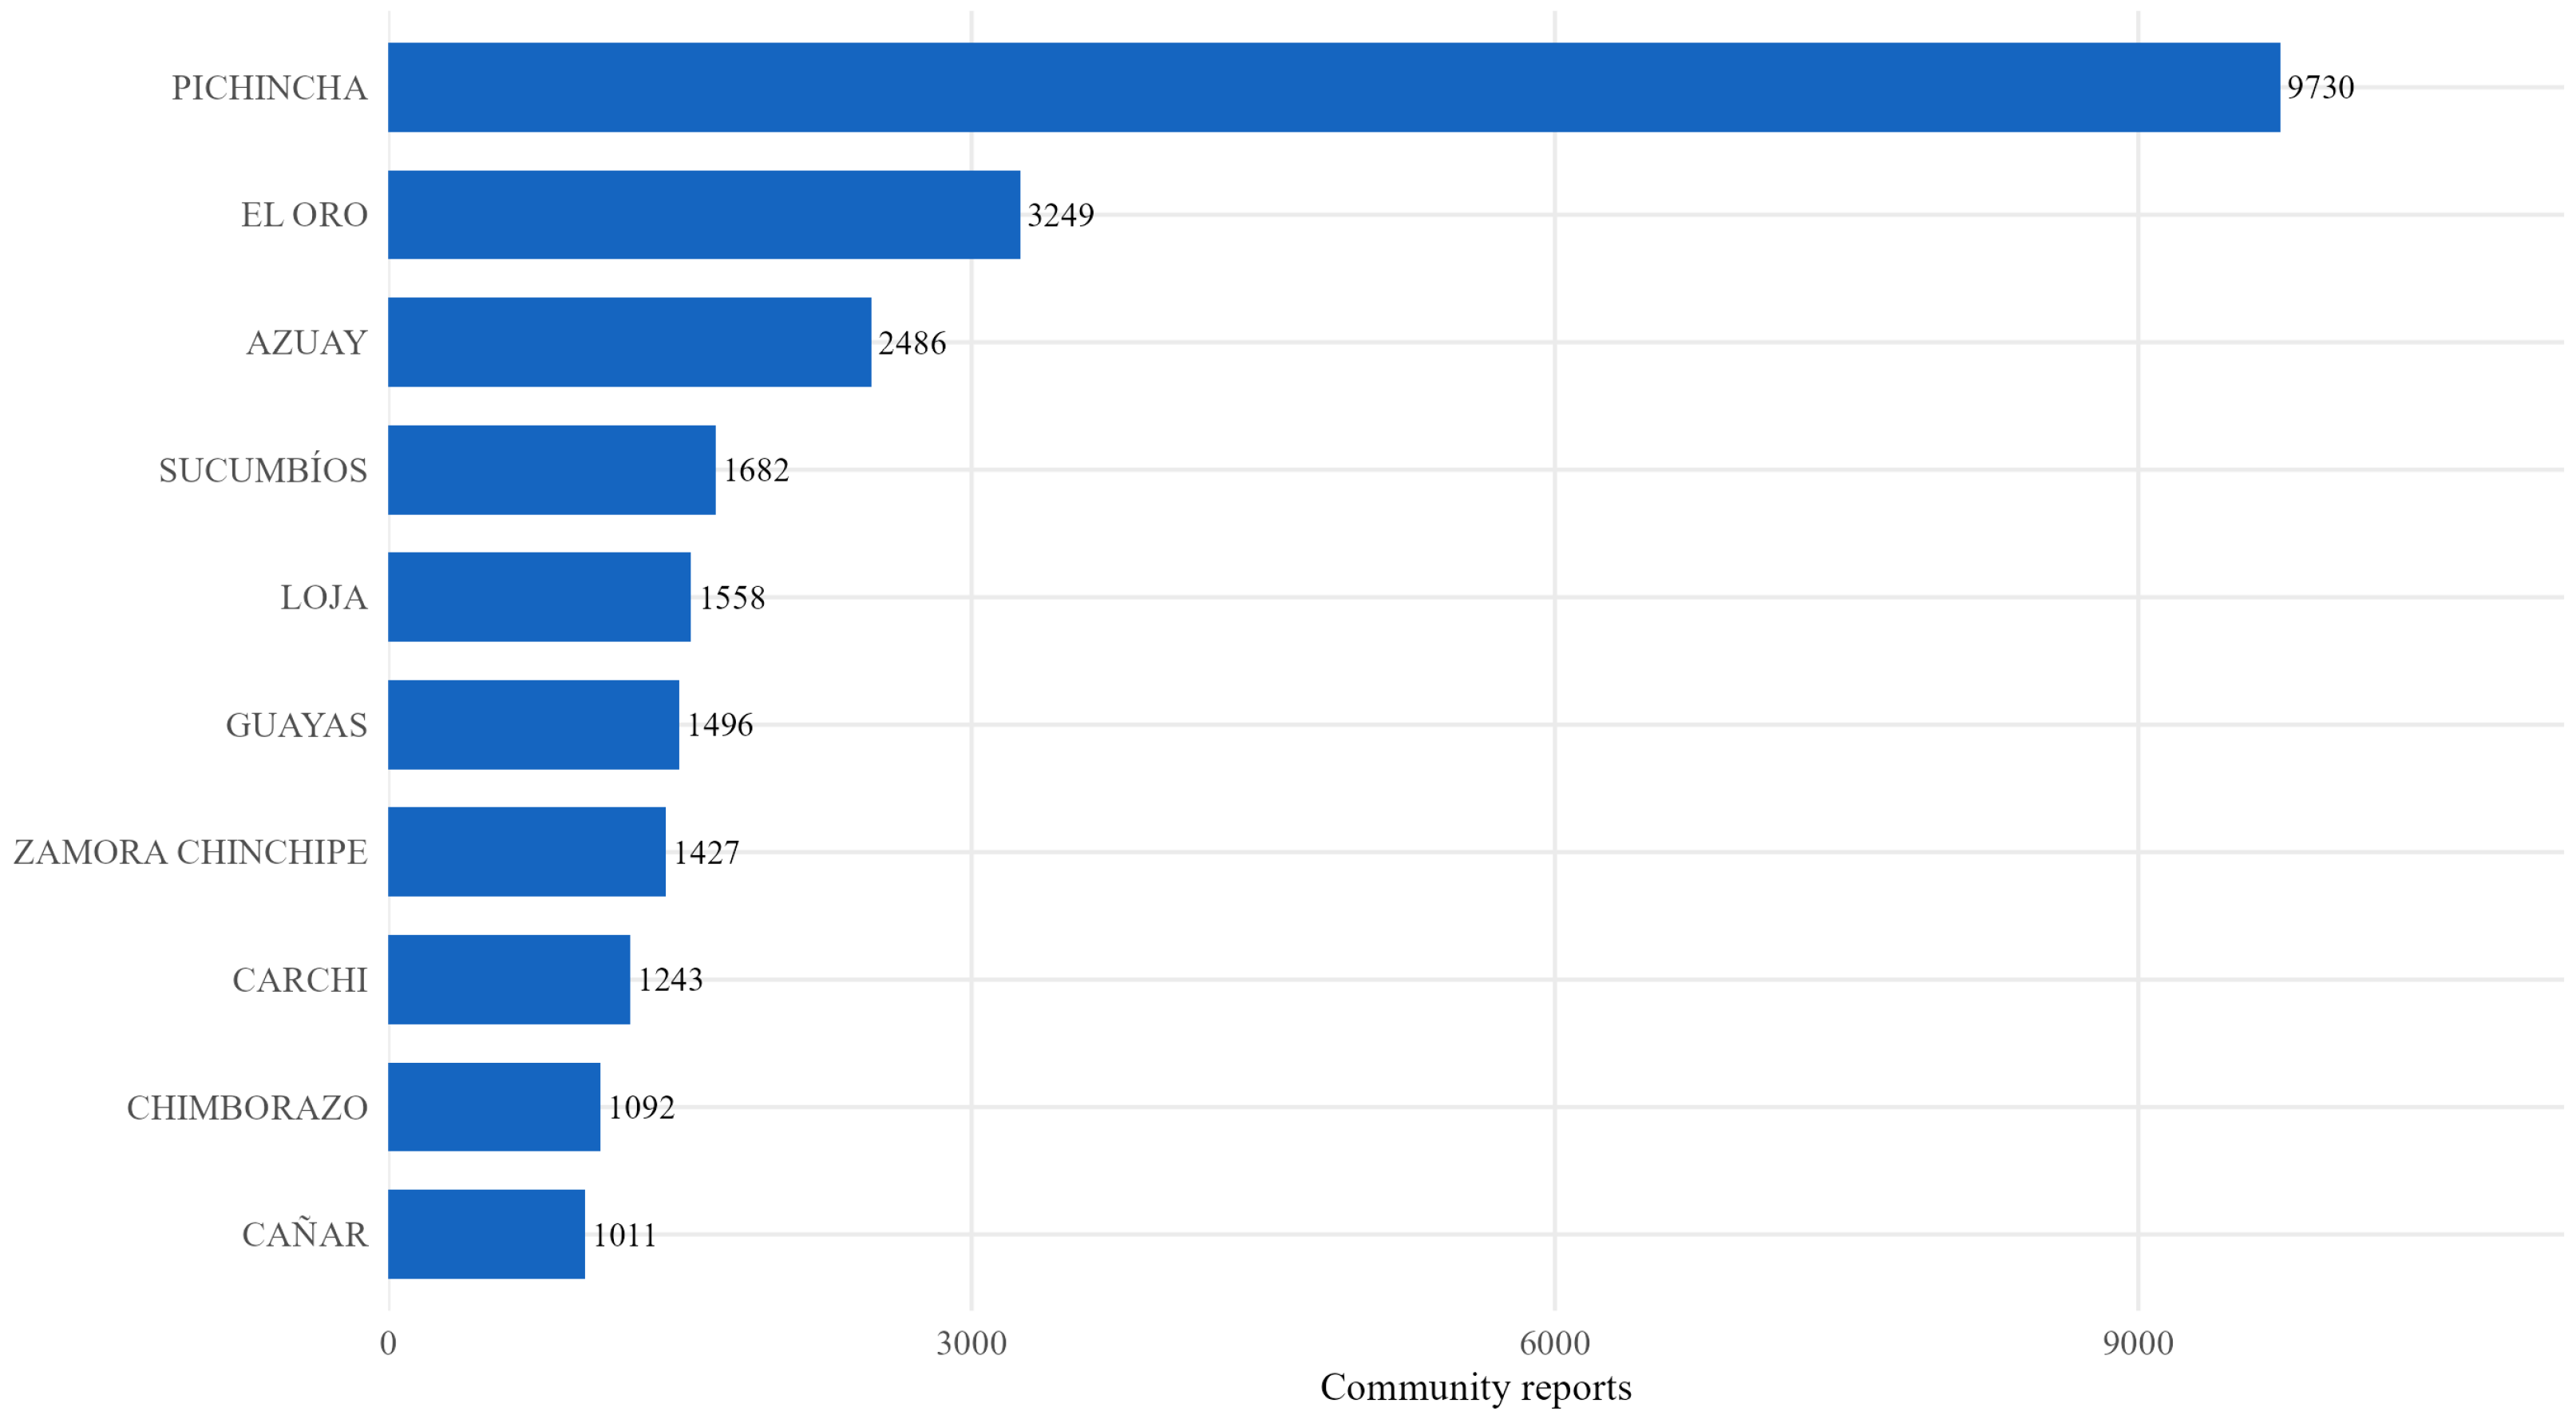
Figure 5). The initiative covered 22 of Ecuador’s 24 provinces, 93 cantons, and 181 parishes, indicating the broad territorial reach achievable with the citizen science approach. A relevant finding of the territorial coverage is that reports predominate in rural parishes—18,234 (60.96%) compared to 11,675 in urban parishes (39.04%)—which distinguishes this study from most CS initiatives that tend to concentrate in metropolitan areas. The provinces with the highest concentration of reports were Pichincha (32.2%), El Oro (10.7%) and Azuay (8.2%), as detailed in
Figure 6. This distribution primarily shows the geographical location of the 57 participating students, who were assigned to data collection in their provinces of residence and do not represent an intrinsically higher prevalence of urban problems in these territories. Pichincha’s predominant participation is also explained by it being the second most populated province in Ecuador (approximately 3.1 million inhabitants), which increased the number of available citizens to report. This sampling characteristic is typical of CS projects since it depends on geographically distributed volunteer networks, which is recognized as a limitation in
Section 5.
At the opposite end, the twelve provinces outside the Top 10 collectively accumulated 4935 reports (16.3%), with a mostly heterogeneous distribution. Tungurahua (3.2%), Orellana (2.3%) and Cotopaxi (1.7%) maintained a moderate representation, while Esmeraldas (0.01%), Los Ríos (0.02%) and Imbabura (0.3%) presented practically null coverage. Bolívar and Pastaza are two provinces that did not register any reports; the main reason for this is the absence of students assigned to those territories during the period of citizen report collection. This unequal distribution reinforces the need, noted in
Section 5, to design an explicit and balanced territorial allocation of collectors in future interactions, guaranteeing minimum coverage in all provinces of the country.
The descriptive analysis is organized into three complementary dimensions. First, the distribution of reports by ISO 37120 category is examined (
Section 4.1.1) in order to identify which problems attract the most citizen attention and how the key indicators of severity, impact and consistency are distributed within each category. Secondly, the perceived severity and demographic profile of the reporters are analyzed (
Section 4.1.2), since the dependent variable of the study (severity) must be characterized before any inferential analysis. Finally, the urban–rural dimension is incorporated (
Section 4.1.3) as a territorial variable, because the heterogeneity between urban and rural parishes constitutes a differentiating finding of this study regarding the previous CS literature in the Global South.
4.1.1. Distribution of Reports by Category ISO 37120
Using data from 22 standardized categories,
Table 3 presents the complete distribution of citizen reports.
As can be seen in
Table 3, citizen safety leads with the highest number of reports, followed by transport, water and sanitation, and environment and solid waste; this comprises 52.9% of the total, which shows that safety and basic services dominate the citizen perception.
A joint analysis of the categories shown in
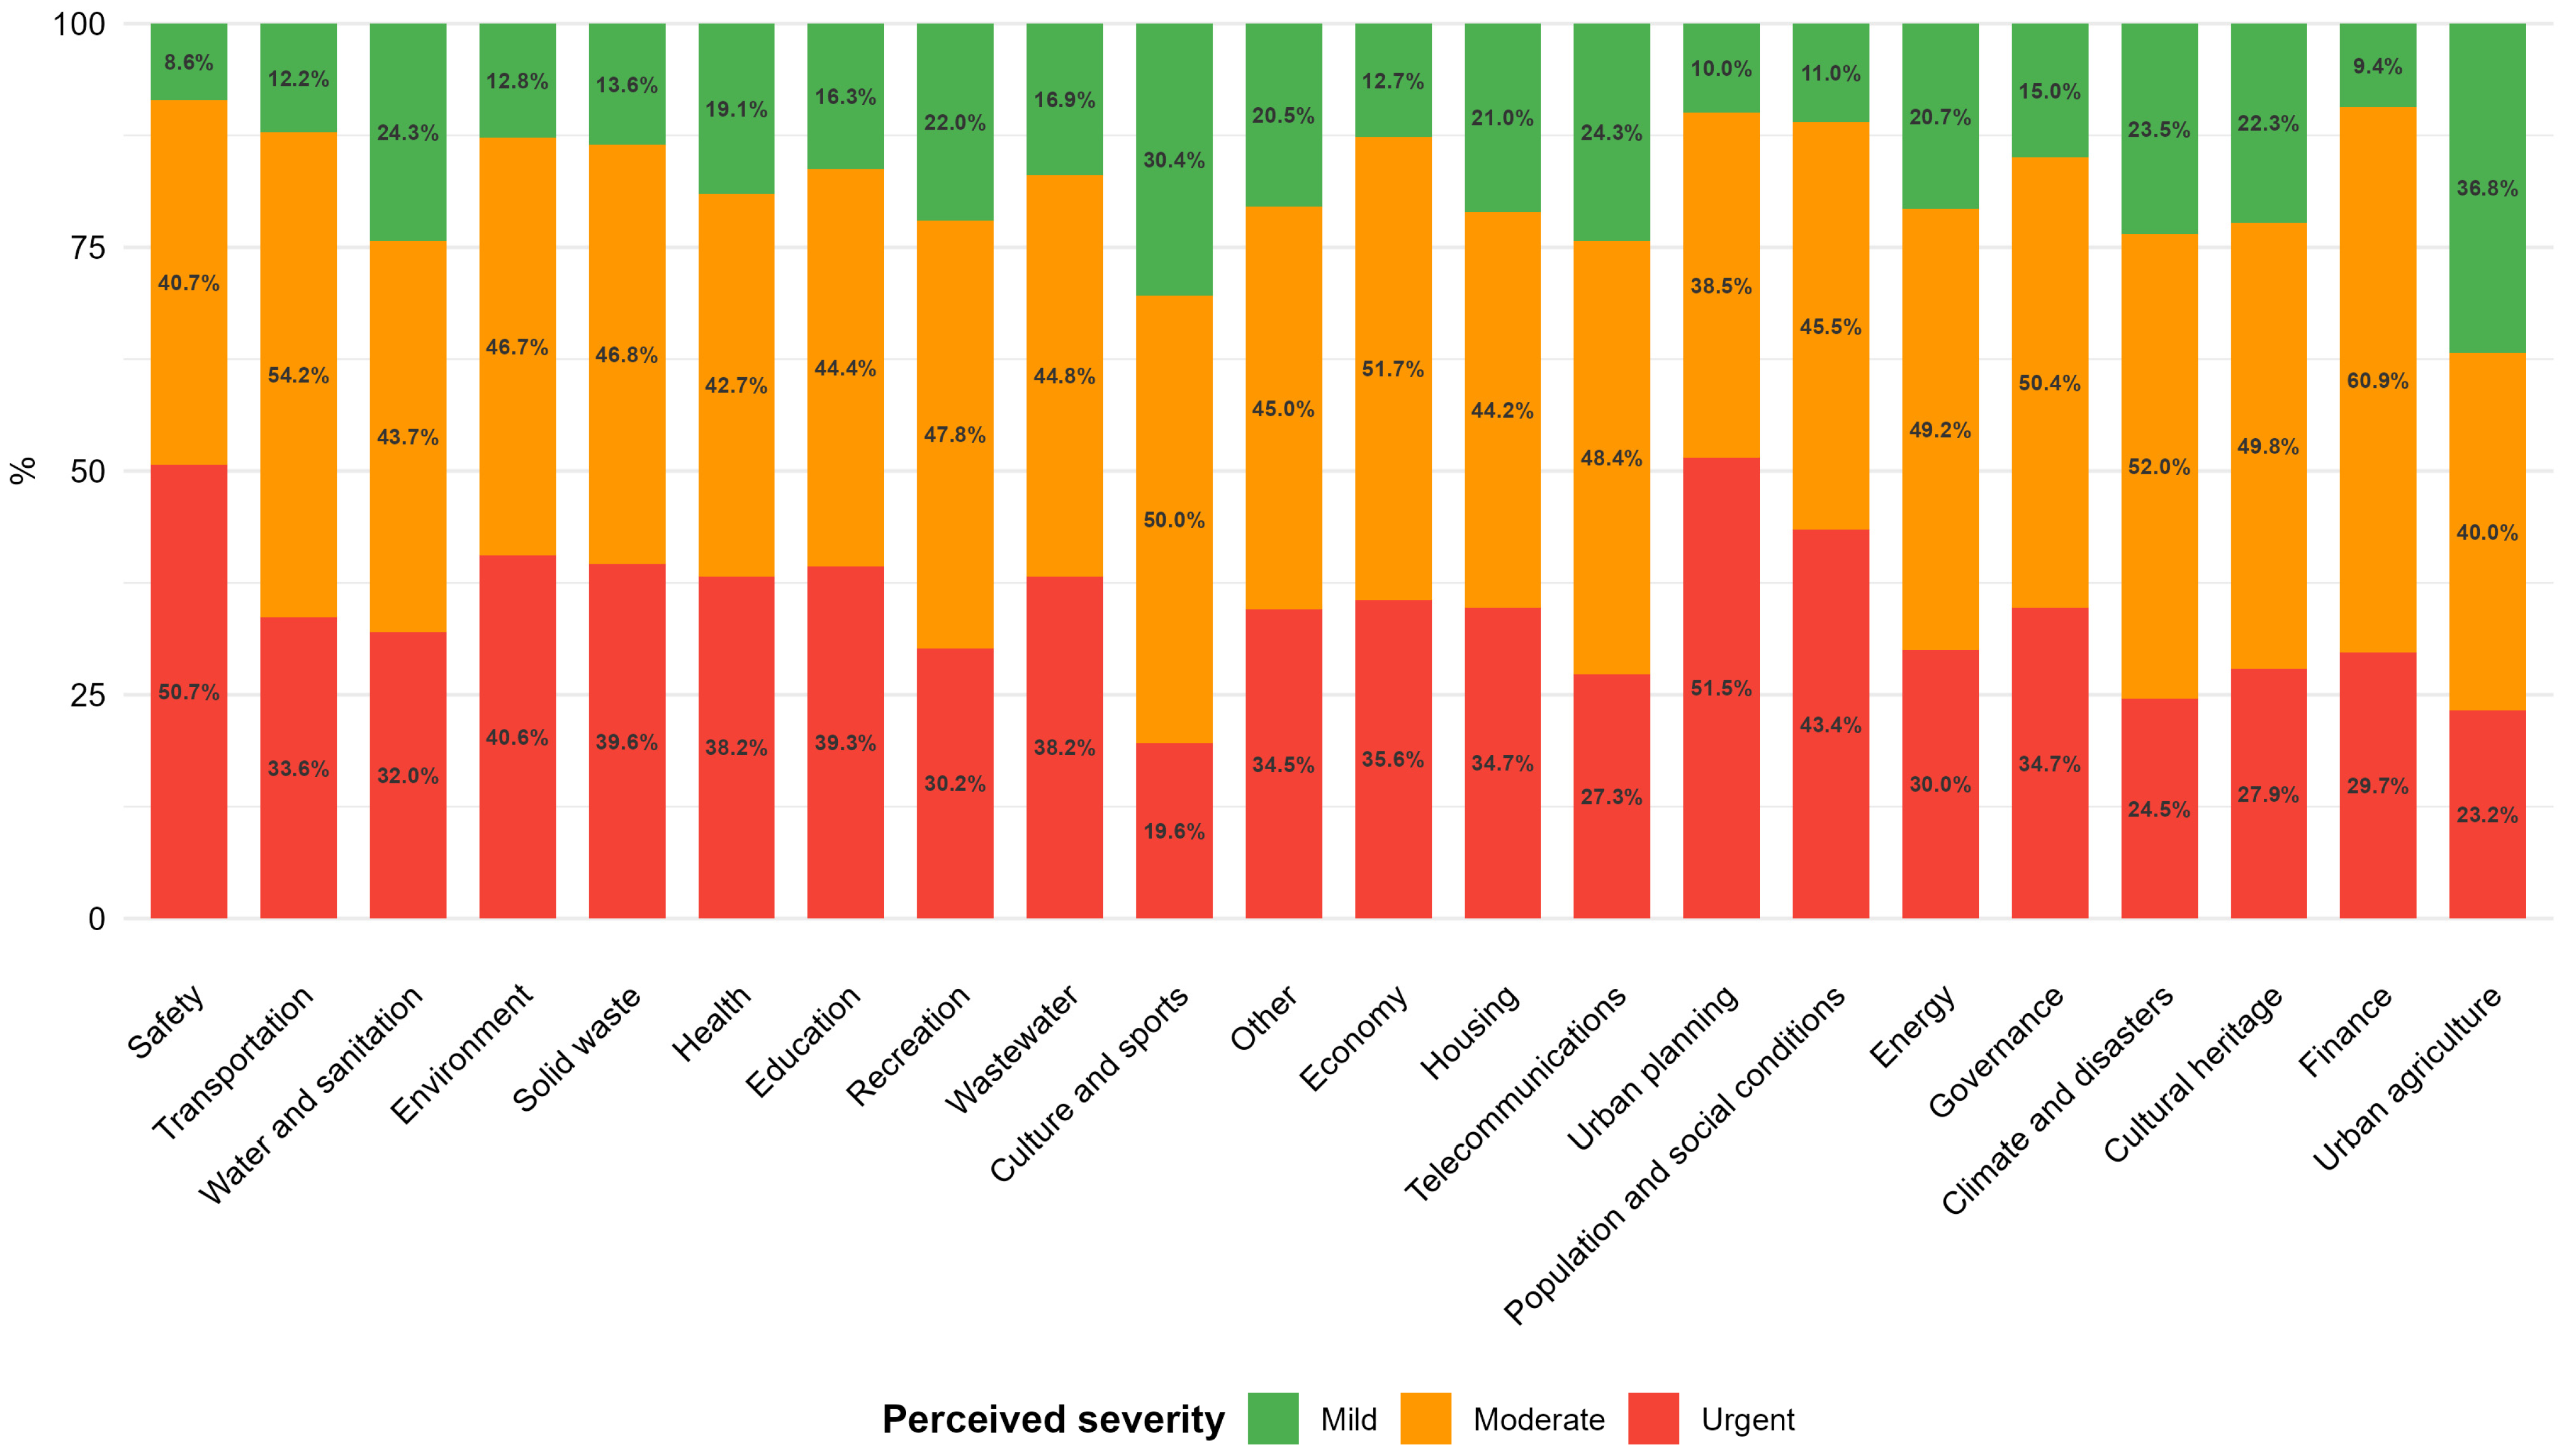
Table 3 reveals patterns that go beyond the number of reports. In citizen safety terms, the majority of reporters declare they are directly affected (87.5%), perceive the problem as urgent (50.7%) and describe it as constant (51.6%), constituting the most critical profile of this study: a frequent problem that affects people personally and does not receive a timely solution.
Additionally, in this same category, 61.4% of the reports come from rural parishes (only 38.6% urban); this indicates that insecurity is not a predominantly urban phenomenon, but there is a gap in attention in rural areas. Transportation shows the second highest level of personal impact (87.2%), comparable to safety, but with a notably lower urgency (33.6%), suggesting that citizens perceive it as a significant but tolerable or non-emergent problem. Environment, although fourth in volume, has the second highest average severity (M = 2.28) and the highest proportion of constant problems, along with safety (51.7%), showing that environmental deterioration is perceived as a chronic and unresolved problem. Solid waste is the category with the highest percentage of urban reports in the Top 10 (46.3%), consistent with the greater waste generation in areas of high population density. At the opposite end, culture and sport register the lowest values in urgency (19.6%), personal impact (70.2%) and consistency (31.0%), confirming that citizens perceive it as a need that can be postponed compared to problems with a greater daily impact. Finally, education concentrates 72.1% of its reports in rural parishes (only 27.9% urban), the highest rural percentage in the entire table, reflecting a deficit in educational services in territories far from urban centers.
4.1.2. Distribution of Perceived Severity and Demographic Profile of Reporters
Across the full set of 30,253 reports, the perceived-severity distribution showed a higher frequency at the moderate level (13,915; 46.0%), followed by urgent (11,492; 38.0%) and mild (4846; 16.0%), as shown in
Figure 7; 84.0% of the reports were classified as moderate or urgent. This concentration at the higher levels of the scale is not attributable to the instrument design but reflects the profile of the problems reported: 81.6% of the reporters state that they are personally affected by the problem they report, and 45.5% describe it as constant, with a further 43.5% describing it as occurring occasionally. Both factors, detailed in
Table 1, operate as amplifiers of perceived severity, since a problem that directly affects the reporter and occurs constantly tends to be classified as moderate or urgent.
Regarding the demographic profile of the reporters, the age distribution was concentrated in the working-age brackets: 35–49 years (9650; 31.9%) and 25–34 years (8928; 29.5%), followed by 15–24 years (5551; 18.3%), 50–64 years (4740; 15.7%), and 65 years or older (1384; 4.6%). Looking at their relationship to the place of the report, the majority were residents (16,781; 55.5%), followed by visitors (5669; 18.7%), students (3845; 12.7%), local vendors (2764; 9.1%), and other roles (1194; 3.9%). Notably, students, who acted as the main data collectors, accounted for only 12.7% of the reports, confirming that the large majority (87.3%) were contributed by non-student citizens.
4.1.3. Urban–Rural Dimension: A Differentiating Finding
The incorporation of the type of parish (urban/rural) constitutes a distinctive analytical dimension of this study. Out of the 29,909 reports with territorial information, 60.96% came from rural parishes and 39.04% from urban parishes.
Table 4 presents the key differences between both contexts.
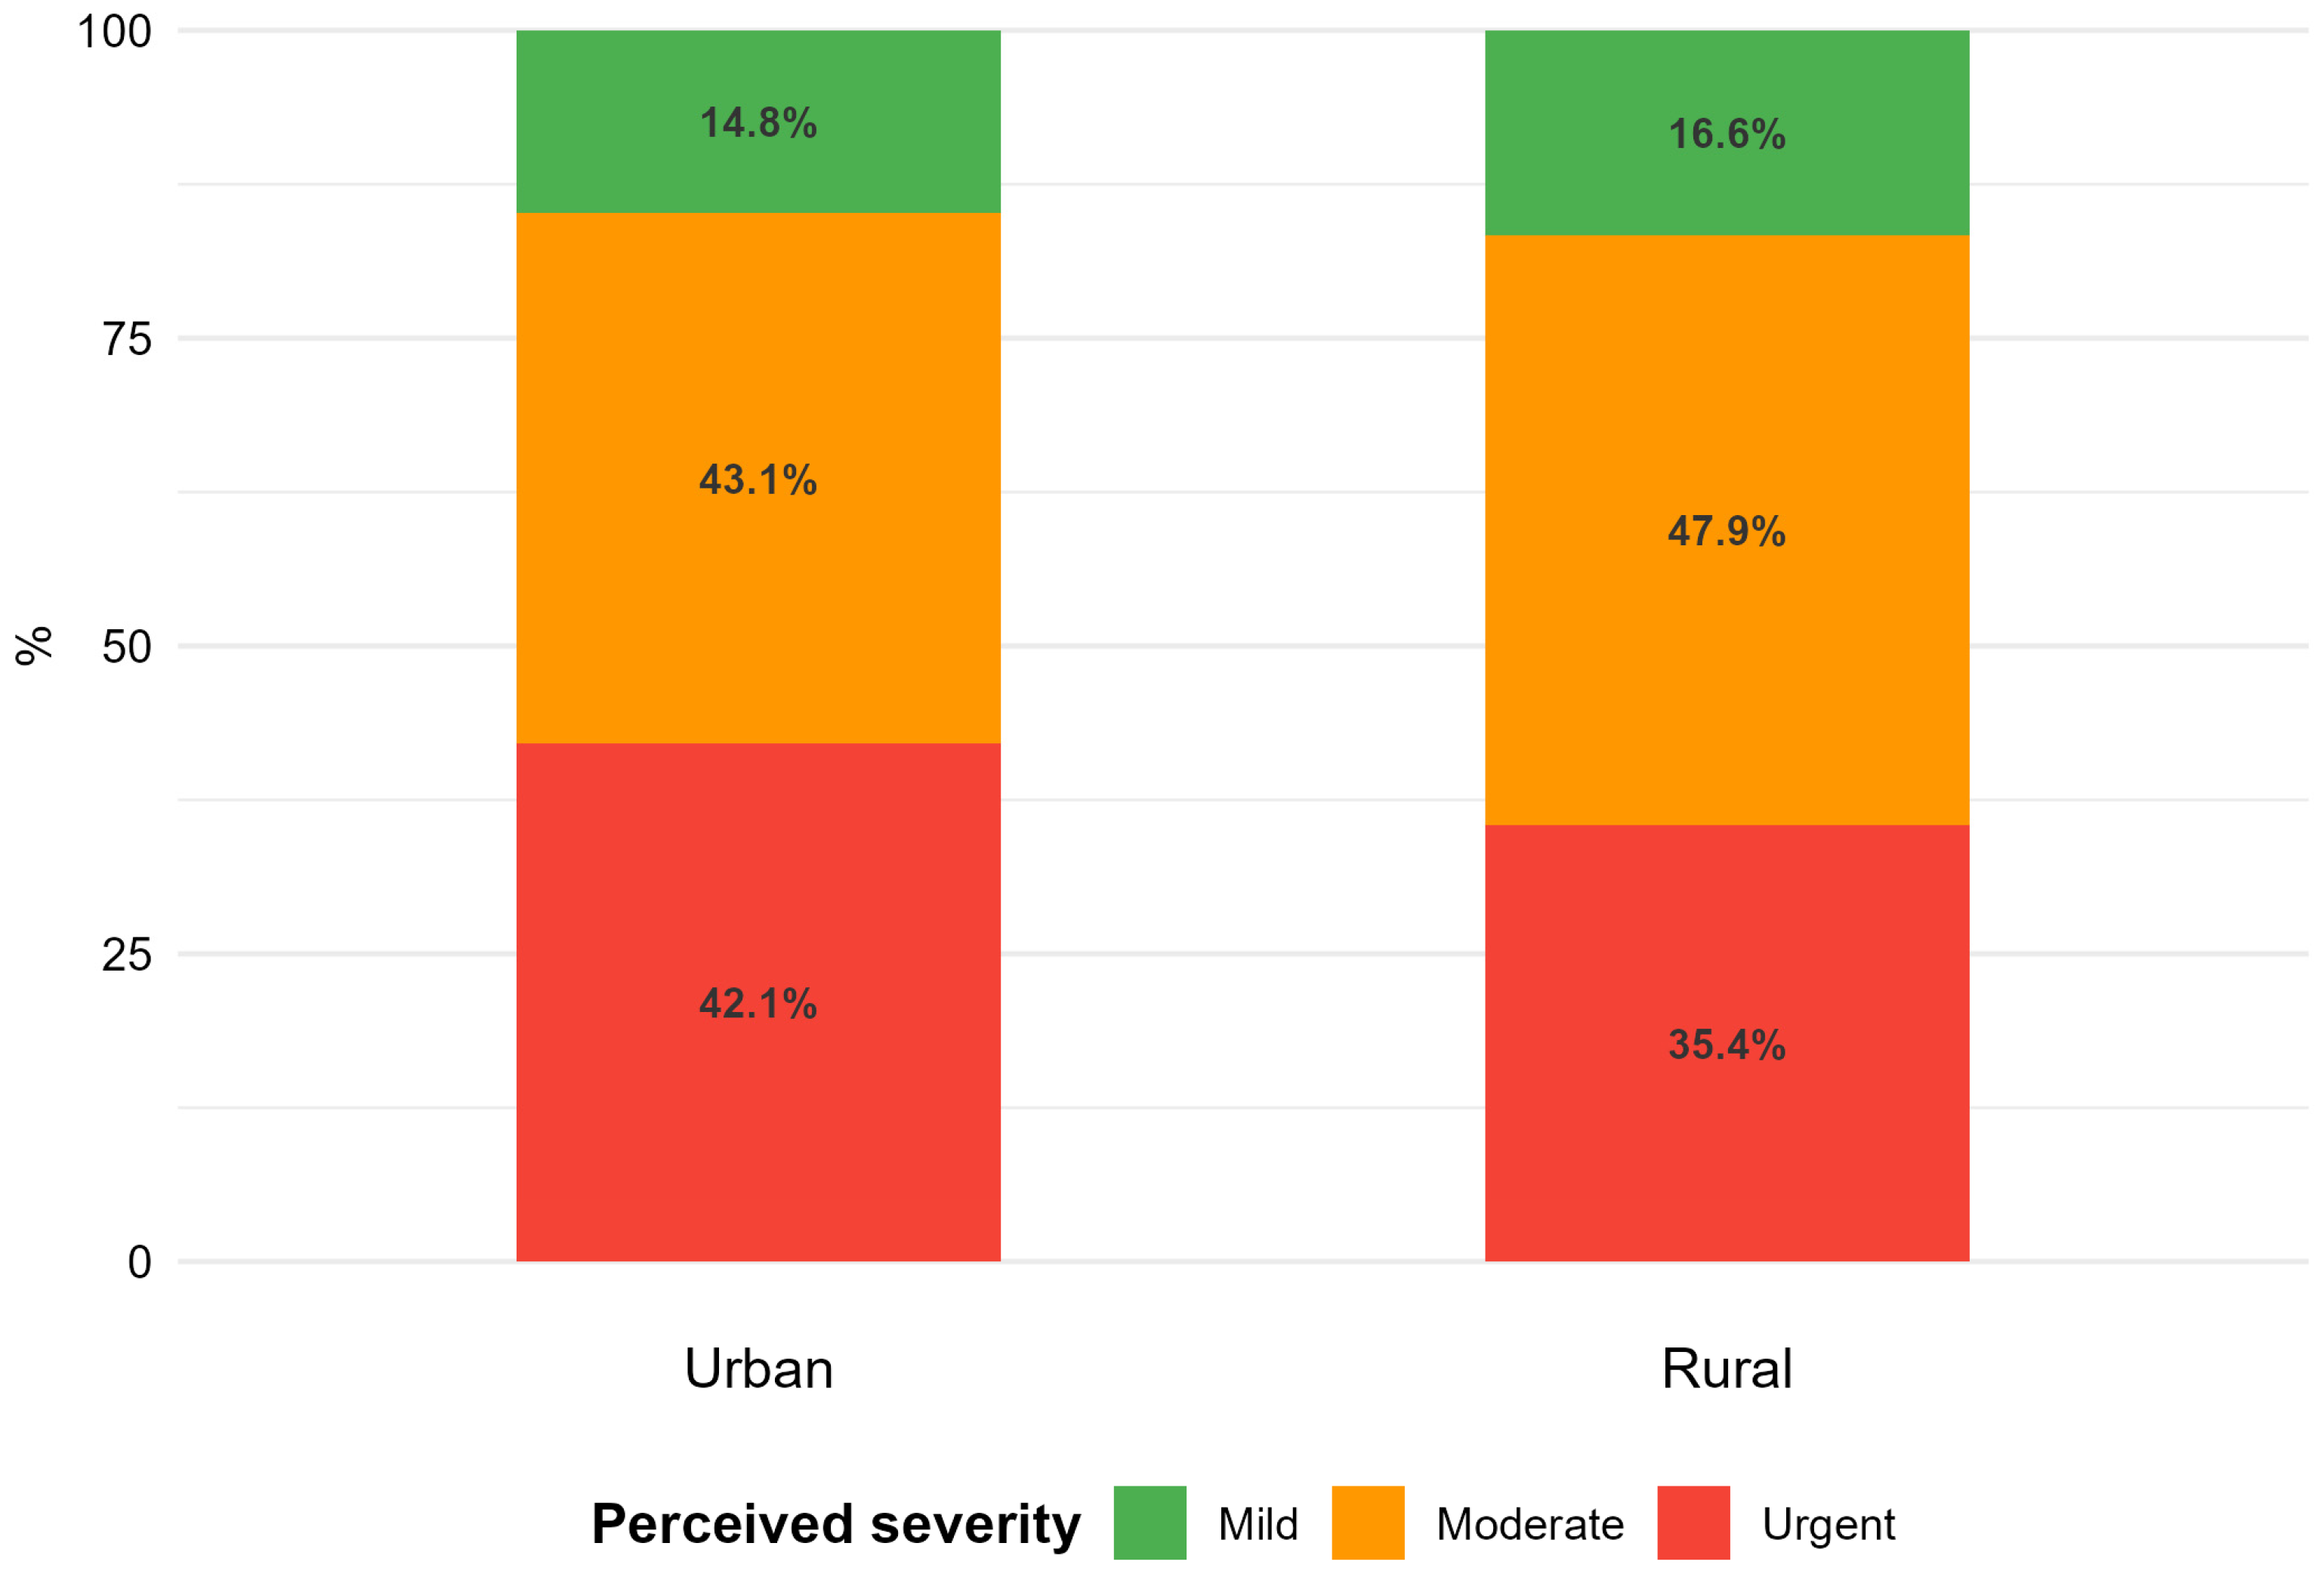
Urban parishes show a higher average severity (2.27 vs. 2.19), a higher proportion of urgent reports (42.1% vs. 35.4%) and a greater perception that the problem remains unsolved (52.2% vs. 41.3%), (see
Figure 8). These differences, although statistically significant according to the Wilcoxon test (W = 113,573,273,
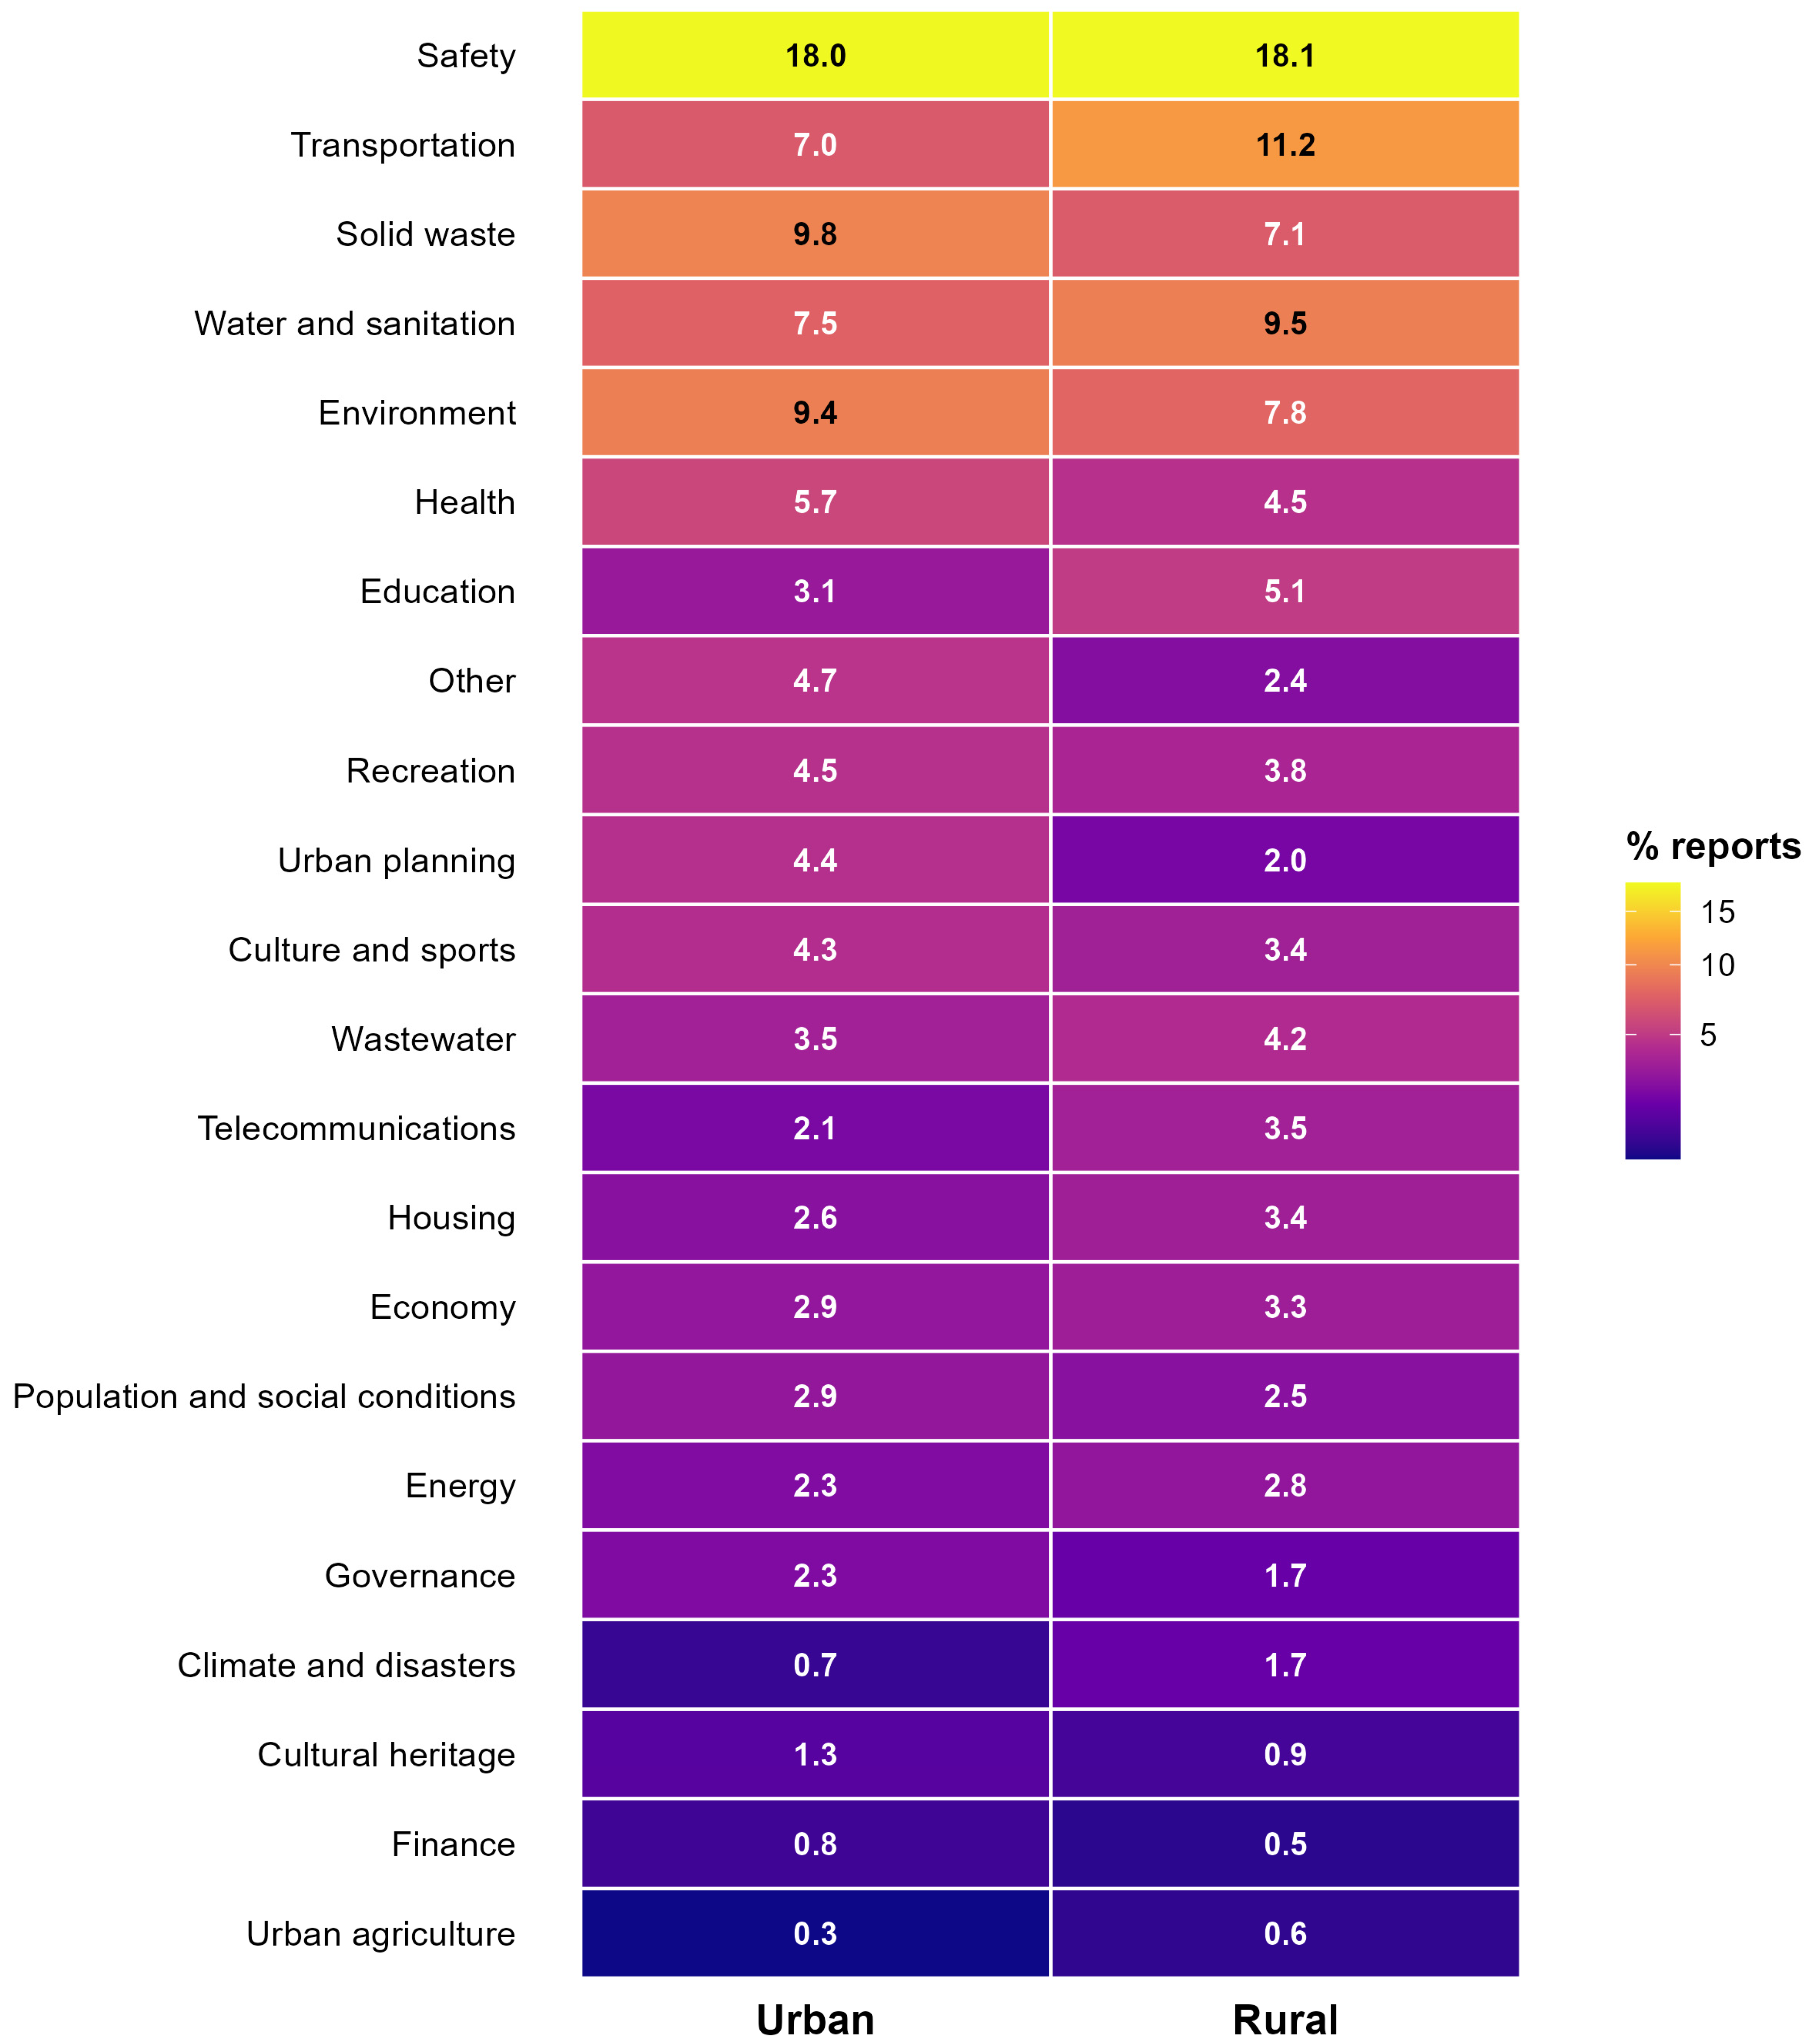
p < 0.001), present a small effect size (Cramer’s V = 0.067); this suggests that the urban–rural gap exists, but is moderate. A relevant finding is that the five main categories coincide in both contexts (safety, transport, water and sanitation, environment, solid waste), but with different ordering: in urban areas, solid waste occupies second place, while in rural areas it is transport, reflecting differentiated territorial priorities (see
Figure 9).
The urban planning category shows the greatest tendency towards urban parishes (58.0% of its reports are urban), while climate and disasters (only 20.6% are urban reports) and urban agriculture (25.2% are urban reports) are concentrated in rural areas. This differentiated distribution has direct implications for the targeting of public policies by the DAG.
4.2. Association Analysis
To answer RQ1 about the structure of citizens’ priorities and the factors associated with severity, 11 statistical tests were performed on the 29,909 complete records. As a result, seven chi-square tests with Cramer’s V were used to evaluate associations between categorical variables and their effect size, three Kruskal–Wallis tests to compare severity distributions between groups, and one Wilcoxon test for the urban/rural binary comparison.
Table 5 presents the statistics, degrees of freedom,
p-values, Cramer’s V, and effect size for each test.
The strongest association in the study was observed between the severity and frequency of the problem (V = 0.418, large effect), providing evidence for H1. The association between parish type and category (V = 0.162) confirms that citizen priorities are structured differently according to the territorial context (RQ2).
All the associations were significant (
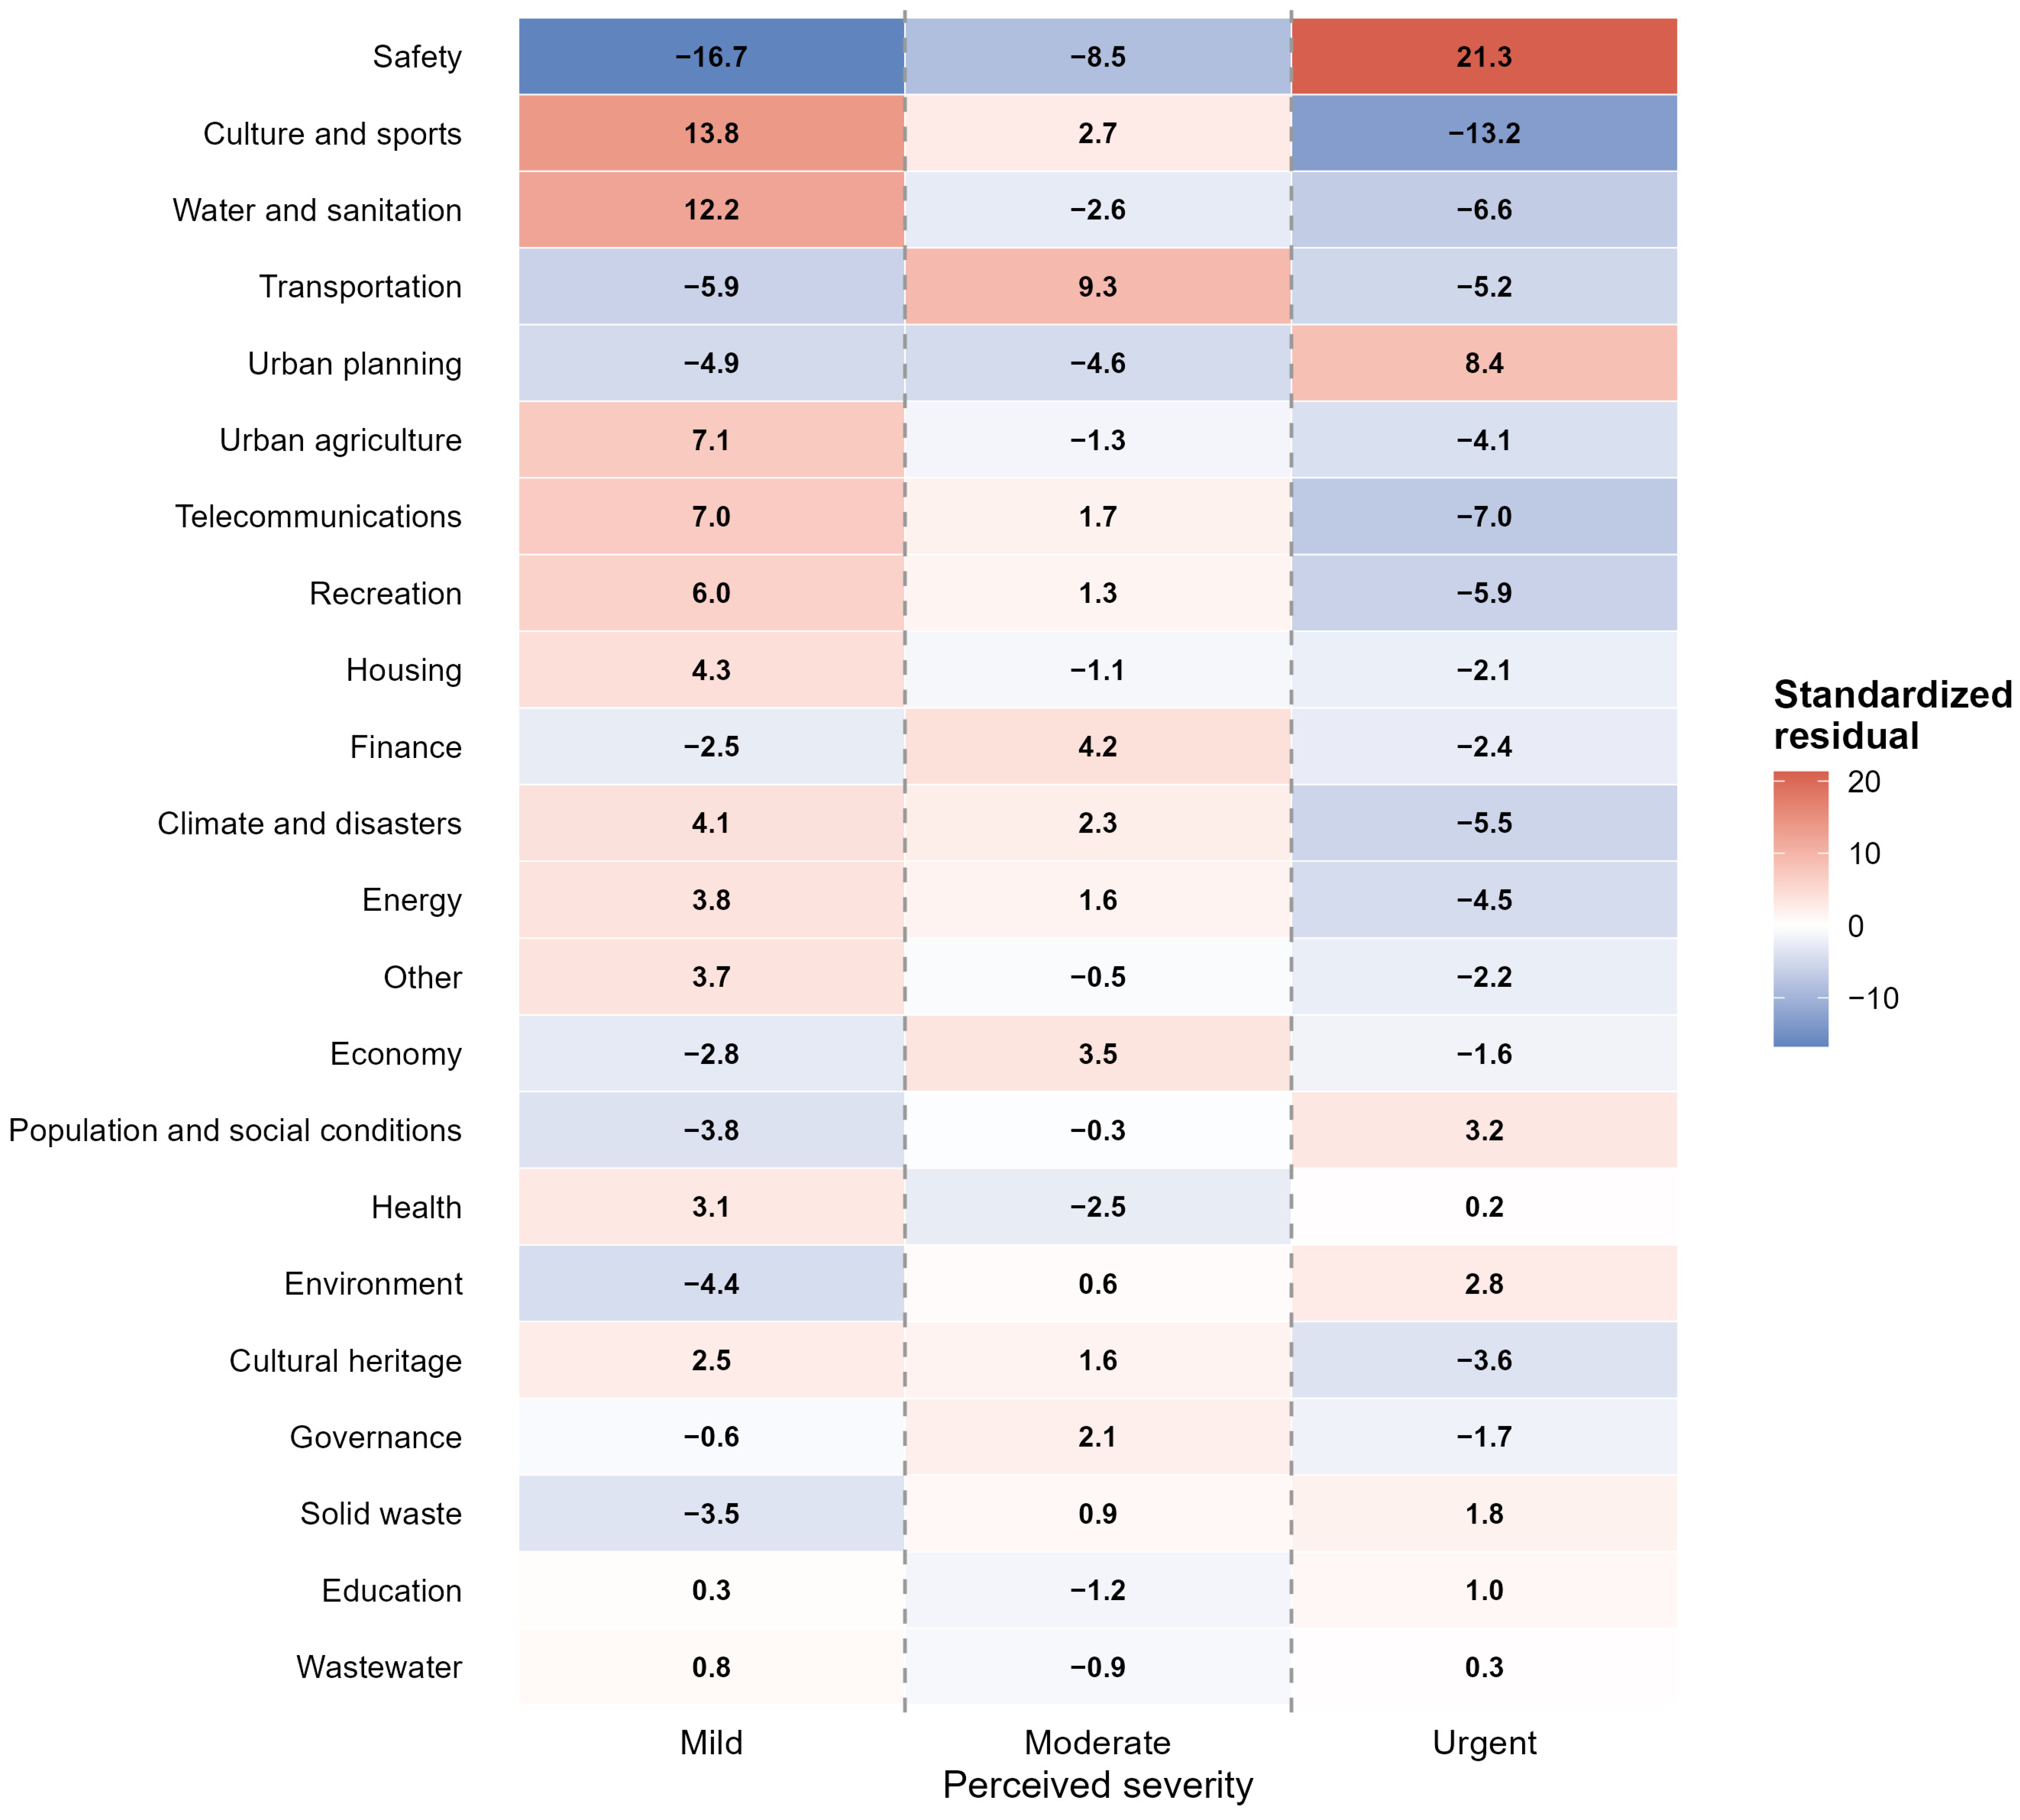
p < 0.001), although effect sizes considerably vary. Additionally, standardized residuals derived from Pearson’s Chi-square test for Category × Severity were calculated, with the objective of identifying local deviations between observed and expected frequencies under the assumption of independence. These residuals allow us to assess which specific combinations significantly contribute to the global statistic, indicating patterns of overrepresentation or underrepresentation. A standardized residual greater than ±3.0 is considered evidence of statistically relevant deviation. The standardized residuals from the Category × Severity test revealed the most extreme deviations in the contingency table. Safety presented a residue of +21.3 for urgent and −16.73 for mild, confirming a disproportionate concentration of urgent reports. Urban planning showed a similar pattern (+8.41 for urgent), while culture and sport (−13.21 for urgent, +13.79 for mild) and telecommunications (−7.02 for urgent, +6.95 for mild) showed the opposite pattern. Transport showed a singular profile: a residual of +9.34 for moderate, but −5.18 for urgent, suggesting that citizens perceive it as important but not emerging.
Figure 10 presents the complete heatmap of standardized waste for all combinations of category and severity level. Blank values indicate deviations with |z| > 3.0, the threshold from which the association between category and severity level is statistically relevant. The color gradient allows for visual identification of the dominant patterns: safety shows the most intense overrepresentation in urgent (+21.3) and the most pronounced underrepresentation in mild (−16.73), while culture and sport show the opposite pattern (+13.79 in mild; −13.21 in urgent). These asymmetries confirm that the ISO 37120 categories are not equivalent in their severity profile, and that citizen perception is structured differently according to the type of reported problem.
4.3. Predictive Model
To answer RQ1 and verify H1, an ordinal logistic regression model (proportional odds) was fitted with perceived severity as the dependent variable and six predictors: category, age, role, frequency, personal impact, and parish type. The model was estimated based on 29,909 completed observations.
4.3.1. Goodness of Fit
The three fit criteria defined in the methodology (McFadden’s pseudo-R
2, AIC and LR) generated the following results. The complete model showed a significant improvement in the overall fit compared to the null model according to the likelihood ratio test (LR = 9956.7; with 33 degrees of freedom;
p < 0.001). McFadden’s pseudo-R
2 was 0.164, considered acceptable for perception models with a range of 0.10 to 0.20 [
42]. The AIC of the full model (50,965.1) was substantially lower than the null model (60,855.7), confirming that the inclusion of the six predictors improves the fit without overfitting. As a verification of the simplicity of the model, backward selection based on the AIC was applied, which retained the original six predictors (AIC stepwise = 50,965.1 = full AIC), confirming that the initial theoretical specification presented an optimal balance between fit and complexity, with no variable being dispensable. The overall classification accuracy was 64.55% (19,307 of 29,909 records). Because the classification is not the central objective of this analysis, this indicator is reported as a complement to the formal fit measures (pseudo-R
2, AIC, and LR test), consistent with the recommendation of [
43] that the classification table serve as a complementary performance measure when ranking is not the explicit objective of the study. The confusion matrix (
Table 6) revealed an ordinally structured pattern: recall was 74.7% for urgent (8491 of 11,373 actual), 72.0% for moderate (9915 of 13,775 actual), and 18.9% for mild (901 of 4761 actual). Misclassifications were concentrated in adjacent severity levels: 97.07% of predictions fell within one ordinal level of the actual value, and only 2.93% were two-level errors (mild predicted as urgent, or urgent as mild). Among the mild reports that were not correctly classified, 82.1% were assigned to the adjacent moderate category and only 17.9% to urgent. This concentration of errors at the mild/moderate boundary is consistent with the ordinal nature of the outcome, in which the distinction between consecutive levels is least sharp in subjective perception.
The proportional odds assumption underlying the model was formally assessed with the Brant test. The omnibus test was significant (χ2 = 1850.2; df = 33; p < 0.001), which would indicate a departure from the assumption. However, the Brant test is known to be highly sensitive to sample size; rejecting the assumption on the basis of trivial departures when the sample is large, as is the case here (N = 29,909). To determine whether this departure compromises the substantive conclusions, a multinomial logistic regression, which does not impose the proportional odds constraint, was estimated as a robustness check. The multinomial model produced only a marginal improvement in fit (McFadden’s pseudo-R2 = 0.191 versus 0.164; classification accuracy = 65.4% versus 64.6%) and, more importantly, preserved the predictor hierarchy: the frequency (recurrence) of the problem remained the dominant predictor of perceived severity in both specifications. Because the ordinal model yields the same substantive conclusions while offering a more parsimonious and directly interpretable set of odds ratios, it was retained as the main model.
4.3.2. Problem Recurrence as a Dominant Predictor
Based on the results presented in
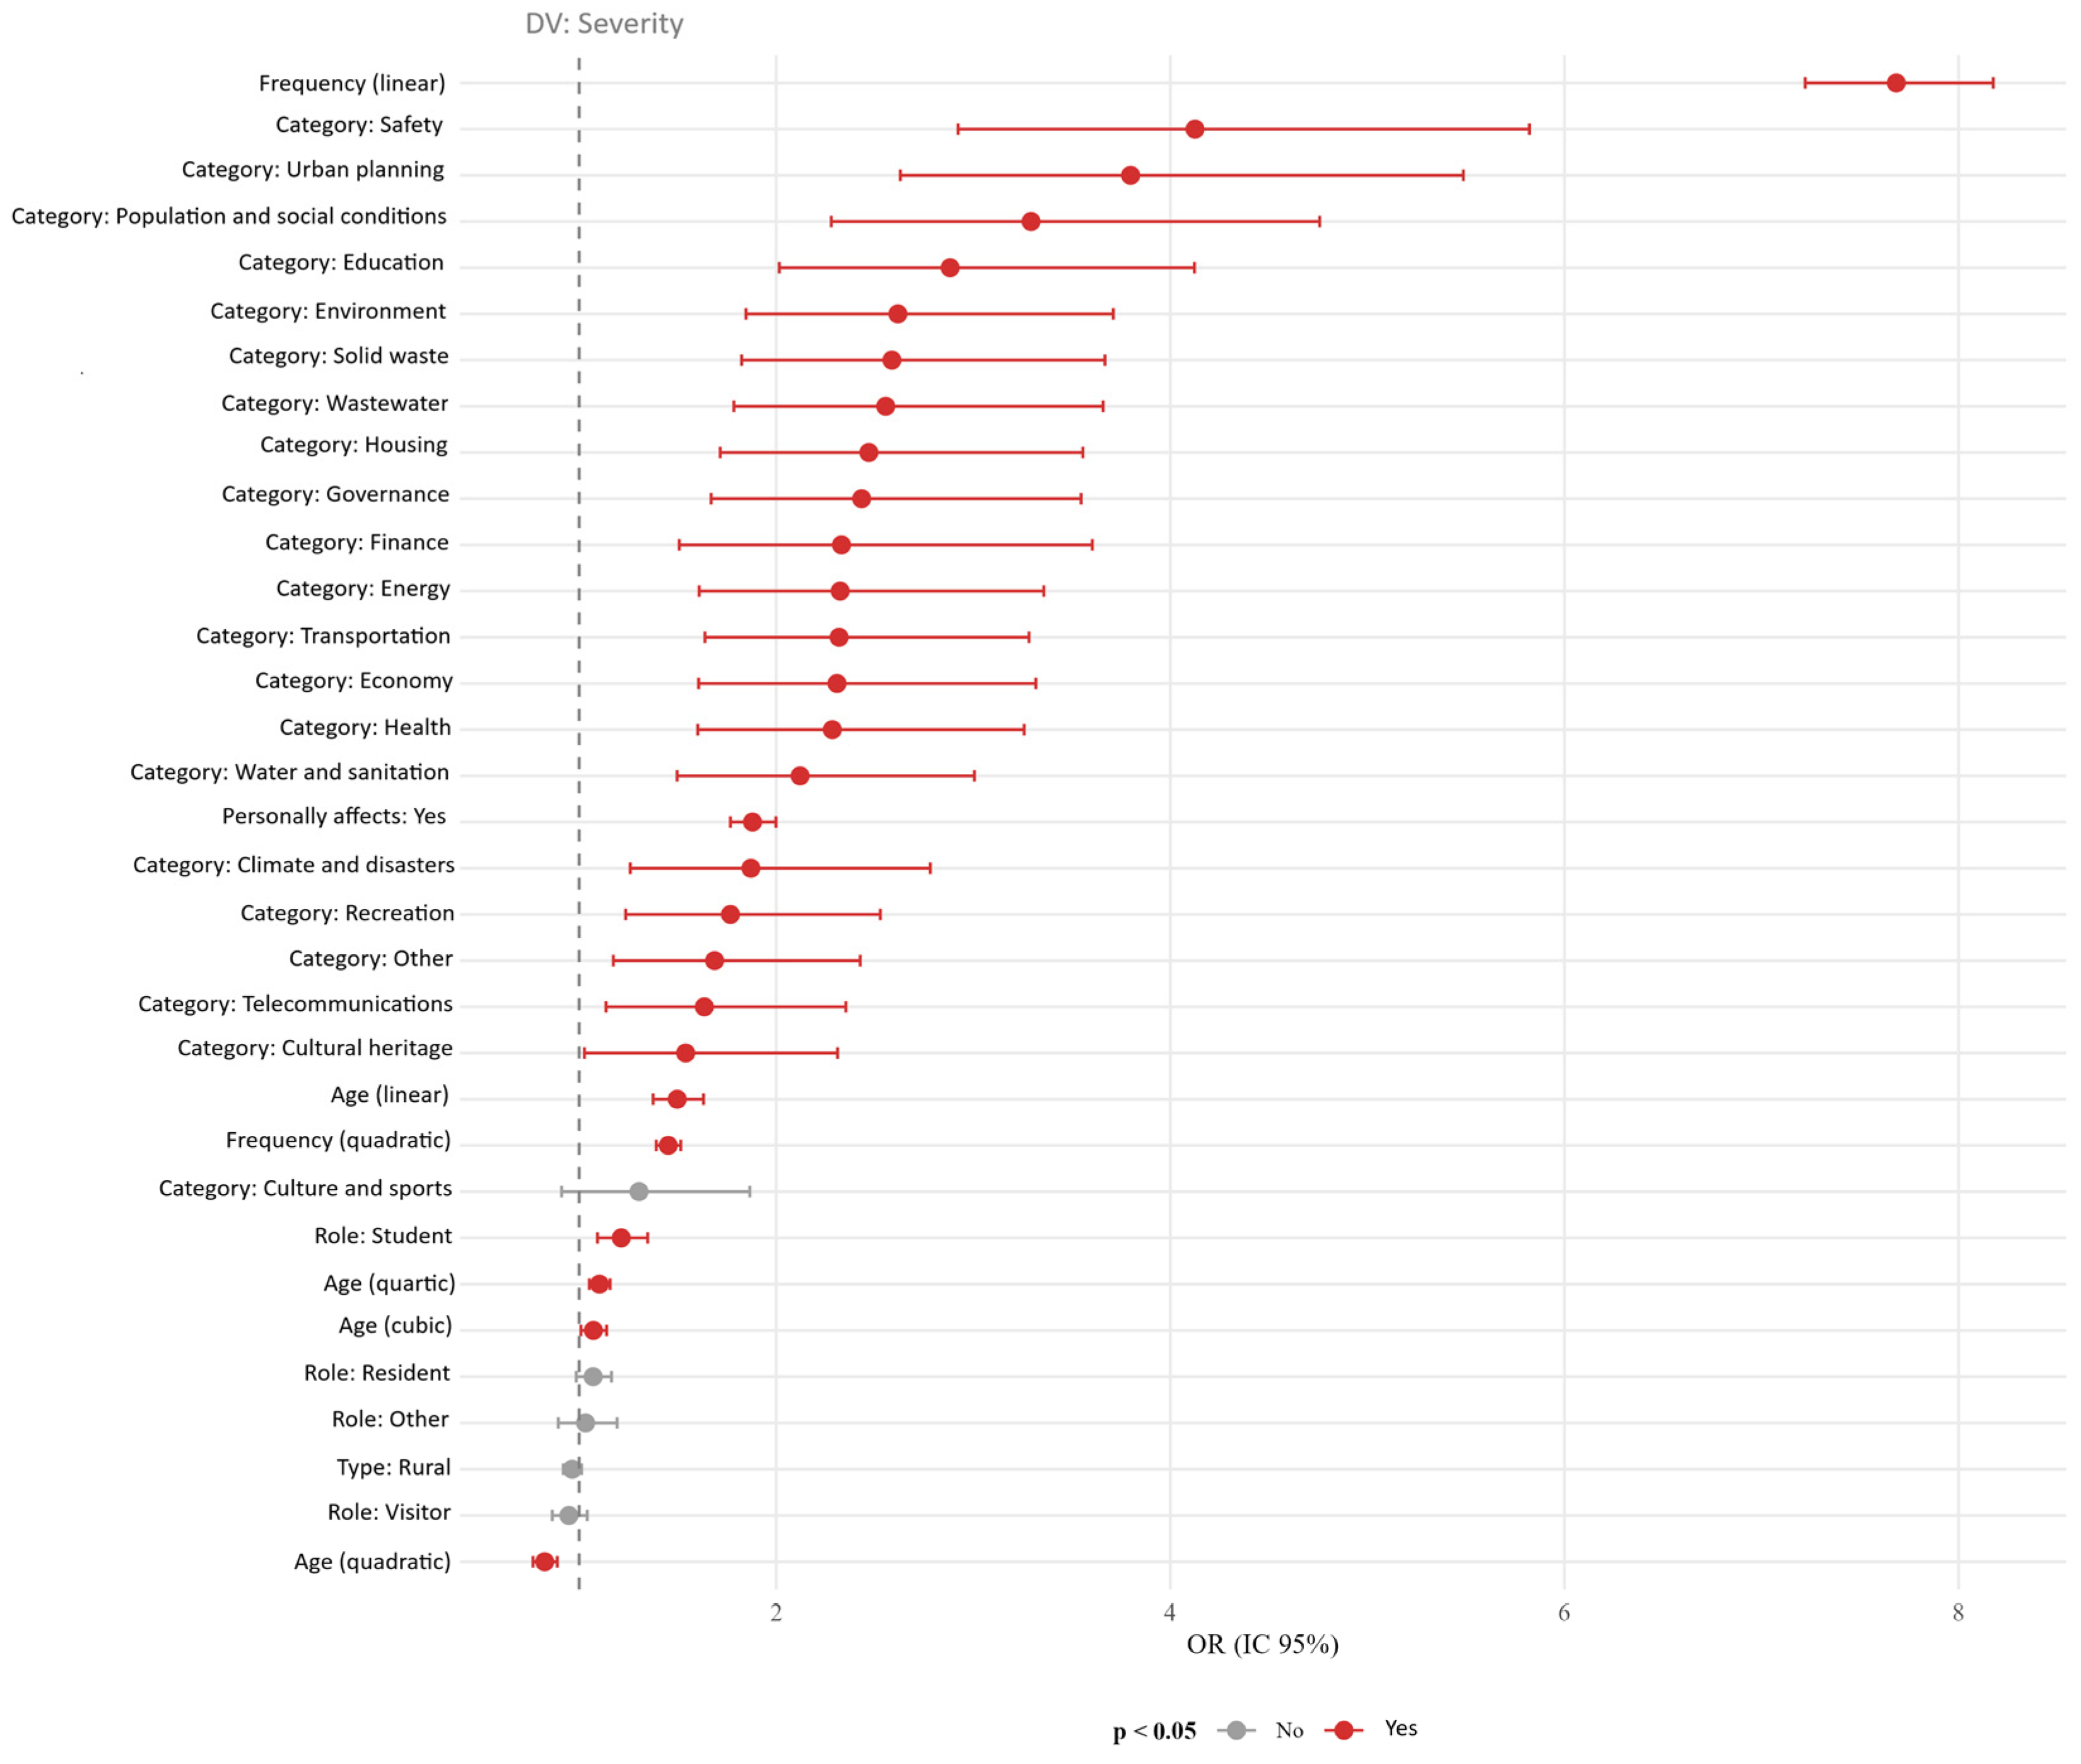
Table 7, it can be seen that the OR (Odds Ratios) of the linear frequency component (OR = 7.684; 95% CI: 7.222–8.176) far exceeds the highest OR of any category (safety, OR = 4.125; 95% CI: 2.923–5.822) and any other demographic variable (linear age, OR = 1.498). Confidence intervals do not overlap. The odds of reporting higher severity increase markedly along the linear trend of frequency, with the linear contrast showing a multiplicative effect of approximately 7.7.
Figure 11 presents the forest plot of all model predictors ordered by OR magnitude. The visual separation between linear component of frequency (OR = 7.684) and the rest of the predictors illustrates the dominant nature of recurrence as an explanatory factor of perceived severity. The predictors in gray (Type: rural; Role: visitor; Role: resident; Role: other; Category: culture and sport) do not reach statistical significance (
p ≥ 0.05), which confirms that the urban/rural territorial context and certain roles of reporting citizens do not independently contribute to the prediction once other variables are controlled.
Personal impact was the second strongest individual predictor (OR = 1.880; 95% CI: 1.768–1.999; p < 0.001): those who report being directly affected have 88% greater odds of assigning higher severity. Age has a significant linear component (OR = 1.498): older citizens tend to perceive greater severity. Notably, the type of parish (Rural, OR = 0.965) did not reach significance (p = 0.141) in the multivariate model; this indicates that the urban–rural differences observed in the bivariate analysis are better explained by the other variables of the model (frequency, category, impact).
4.4. Citizen Safety as the Most Urgent Perceived Category
Three evidence sources can describe the severity profile of the citizen safety category. First, the standardized residual for the urgent level was +21.3 (
Figure 10), the highest value in the entire contingency table and far exceeding the threshold of statistical relevance of +3.0. Second, in the ordinal logistic regression model, safety had the highest OR among all categories (OR = 4.125; 95% CI: 2.923–5.822;
p < 0.001). Third, this is the only category where more than half of the reports were classified as urgent (50.7%), as shown in
Figure 7. However, post-hoc pairwise comparisons of Kruskal–Wallis with Bonferroni correction revealed that citizen safety does not differ significantly from urban planning in its severity distribution. This last category contains 51.5% of urgent reports and its standardized residual for the urgent level reached +8.4, also higher than the threshold of +3.0. Both categories therefore share a statistical profile of high perceived urgency that distinguishes them from the rest of the ISO 37120 categories.
4.5. Spatial Analysis
To answer RQ2, the spatial distribution of 29,977 georeferenced reports was analyzed using the DBSCAN algorithm with the following configuration: eps = 0.12; minPts = 15; identifying 34 clusters and 85 noise points (0.28%).
Table 8 presents 34 identified clusters. The largest cluster (
n = 9728) corresponds to the Quito metropolitan area, dominated by safety reports with a severity average of 2.20. The second cluster (
n = 2466) is located in Machala area, El Oro province, also led by safety, with a rural predominance. A notable finding is cluster 20 (
n = 501, rural area of Guayas/Balao) where environment reaches an average severity of 2.76 with 77.6% of urgent reports; this constitutes a hot spot of greatest severity in the study. Another relevant case is cluster 13 (
n = 503, the rural area of Cotopaxi/Latacunga) where safety presents 89.1% of urgent reports, the highest value for this category. This heterogeneity confirms that citizen prioritization is not uniform, but responds to specific territorial dynamics.
The quality of the cluster solution was evaluated by using the Kaufman & Rousseeuw’s silhouette coefficient [
44], calculated on the total of the 29,892 points not classified as noise without the need for sampling. The overall average silhouette obtained was 0.769, which indicates a strong structure according to the Kaufman & Rousseeuw interpretation scale, who set the threshold of ≥0.71 as an indicator of strong clustering. Only 153 observations (0.51% of the total clustered) showed negative values. This suggests potentially incorrect assignments of a marginal nature and without significant impact on the overall quality of the cluster. At the individual cluster level, 31 of the 34 clusters obtained silhouettes greater than 0.70, and the two largest clusters, cluster 2 (
n = 9728; silhouette = 0.6080) and cluster 19 (
n = 2466; silhouette = 0.5175), presented lower values, consistent with its larger territorial extension, which incorporates greater internal variability among coordinates. These results confirm that the selected parameterization produces a statistically robust and geographically interpretable spatial partition.
A sensitivity analysis was additionally conducted to verify that this partition is not an artifact of the specific parameter values. A grid combining five values of eps (0.08, 0.10, 0.12, 0.15, 0.20) and four values of minPts (10, 15, 20, 25) was evaluated for a total of 20 configurations. Across the grid, the mean silhouette coefficient was 0.730 (SD = 0.045; coefficient of variation = 6.2%) and the number of clusters ranged from 25 to 42. A stable high-quality plateau was observed for eps between 0.10 and 0.15, where the silhouette remained between 0.758 and 0.771 regardless of minPts, and the reported configuration lies within this plateau. The low coefficient of variation and the persistence of a strong silhouette across this plateau confirm that the clustering solution is robust to reasonable variations in both parameters.
5. Discussion
5.1. Results Interpretation
In response to RQ1, the results demonstrate that citizen perception, channeled through ISO 37120 categories, is statistically structured and predictable. The ordinal regression model (pseudo-R
2 = 0.164; LR = 9956.7;
p < 0.001) identified that the recurrence of the problem is the dominant predictor of perceived severity (OR = 7.684), followed by personal impact (OR = 1.880) and the problem category (safety, OR = 4.125). This finding has direct implications for DAG: Problems that remain unsolved not only persist, but the perception of their urgency escalates over time. This suggests that early intervention in problems in their initial phase is more efficient than a late response to problems that have become constant. This result provides empirical evidence for the literature on citizens’ perceptions of urban problems: repeated exposure to a problem amplifies its perceived severity, regardless of its category. Unlike [
7], whose reviewed projects integrate real-time AI during collection, this study intentionally adopts a separation of roles, with the citizen as an autonomous sensor that reports community problems and AI as a tool for subsequent analysis, thus prioritizing the independence of the data collected and aligning with the principles of the Copenhagen Framework on Citizens’ Data [
14]. Likewise, while Pateman et al. [
4] and Fritz et al. [
3] map potential contributions of CS to the SDG, this investigation demonstrates how ISO 37120 can be used as a citizen data collection tool and not just as an urban monitoring standard. In middle- and low-income countries like Ecuador, where gaps persist in the needed data to monitor the SDG [
4], this finding reinforces the need for DAG to implement early-response mechanisms that prevent an increase in perceived urgency when problems become frequent.
Regarding RQ2, the DBSCAN analysis identified 34 clusters with differentiated patterns by category and territorial context (urban/rural). Citizen safety covers 9 of the 15 clusters with the most reports but with heterogeneous profiles: the average severity ranges from 2.69 in Santa Elena/La Libertad (with 71.7% urgent reports) to 1.99 in Loja/Calvas (5.1% urgent), indicating that the same category generates different urgency levels depending on the territory. The fact that rural parishes concentrate the 60.96% of total reports and 11 of the 15 clusters with the most reports expands the spatial coverage of CS to territories along the country, where traditional data sources do not usually capture local variations [
3], a particularly relevant result considering that the distribution of CS projects in low-income countries is limited and geographically uneven [
4]. The scale of the dataset (30,253 reports, 22 provinces, 181 parishes) provides statistical power for multivariate analysis that smaller projects do not allow. These patterns provide DAG with information for territorial planning oriented towards sustainable development.
The principal contribution of this study is the proposed monitoring framework, which provides a standardized mechanism for integrating citizen-generated data into local governance. By combining Citizen Science, ISO 37120, KoboToolbox, geospatial analysis, and artificial intelligence, the framework enables Decentralized Autonomous Governments (DAGs) to transform dispersed citizen observations into structured, comparable, and actionable evidence for territorial planning. Its modular design facilitates adaptation to local priorities while preserving methodological consistency across jurisdictions. Operationally, the framework supports continuous monitoring, the prioritization of interventions, and resource allocation through standardized workflows for data collection, validation, analysis, and visualization, thereby strengthening evidence-based urban management and participatory decision-making.
In summary, the results allow us to identify four main findings: (F1) citizen perception is statistically structured and modellable when channeled through ISO 37120 categories; (F2) the recurrence of the problem is the dominant predictor of perceived severity, surpassing the category of the problem and the demographic attributes included in the model (age and role); (F3) citizen safety concentrates the most perceived urgency, sharing this profile with urban planning; and (F4) spatial patterns vary between urban and rural contexts, with local variations that are not explained by the territorial context but by the frequency and category of the problem.
These findings can be situated within the broader smart-cities and citizen-science literature. Whereas previous studies such as that by Pateman et al. [
4] map the contributions of citizen science to the SDGs in cities in low- and middle-income countries, the present study shows that structuring citizen reports through ISO 37120 yields a statistically tractable representation of perceived priorities (F1), thereby adding analytical structure to participatory urban data. Our finding that safety and urban planning concentrate the highest perceived urgency (F3) reflects priorities that are specific to our national-scale, perception-based setting. Other urban citizen-science studies, working at different scales and with different instruments, identify different priorities, such as the predominance of uneven sidewalk surfaces among the pedestrian-accessibility problems detected by Plata-Salinas et al. [
26] in their Zacatenco campus case study in Mexico City. This divergence suggests that perceived urban priorities are strongly shaped by the scale, method, and local context of each study rather than being universal. The territorial heterogeneity observed between urban and rural parishes (F4) is consistent with the emphasis of Pateman et al. [
4] and Elias et al. [
20] on the value of citizen science for generating high-resolution spatial data in Global South contexts, where official sources often fail to capture local variation. Finally, the identification of problem recurrence as the dominant predictor of perceived severity (F2) has, to our knowledge, no direct equivalent in the reviewed literature and constitutes one of the study’s distinctive empirical contributions.
5.2. Hypothesis Verification
Regarding H1, the frequency of the problem turned out to be the most powerful predictor of perceived severity (OR = 7.684; 95% CI: 7.222–8.176; p < 0.001), surpassing the highest OR of any ISO 37120 category (safety, OR = 4.125; 95% CI: 2.923–5.822) with non-overlapping confidence intervals and the strongest demographic component (linear age, OR = 1.498). This result confirms H1: the recurrence of a problem predicts the perceived severity to a greater extent than the category of the problem or the profile of the reporting citizen.
With respect to H2, three sources are considered: (1) the standardized safety residue for urgent was +21.3, the highest in the entire contingency table; (2) the security variable presented the highest OR among all categories (OR = 4.125); and (3) the safety variable is the only category where more than half of the reports are urgent (50.7%). However, post-hoc Kruskal–Wallis comparisons with Bonferroni correction did not detect a significant difference between safety and urban planning (which has a similar severity profile, with 51.5% urgent and a standardized residual of +8.41).
H2 is partially confirmed: citizen safety leads in perceived urgency, but it shares the high-severity profile with urban planning, which indicates that citizens’ urgent priorities are not focused exclusively on safety. The emergence of urban planning as a high-urgency category is consistent with the Ecuadorian context, where urban growth in many cantons has outpaced territorial planning capacity, producing visible and persistent problems, such as inadequate road infrastructure, informal land occupation, and insufficient public spaces, that citizens experience in their daily lives. Because territorial planning is an explicit competence of the DAG, these problems are perceived to be the responsibility of the local authority, which, combined with their persistent and unresolved nature, amplifies their perceived urgency, consistent with the risk perception framework adopted in this study [
45]. This pattern is reinforced by the predominantly urban distribution of urban planning reports (58.0% urban), indicating that the perceived urgency of this category is concentrated where urban pressures are most acute.
Regarding H3, the spatial analysis confirms that the perceived severity of a given category varies substantially across territories. For citizen safety, the category with the most clusters, the average severity ranged from 2.69 in Santa Elena/La Libertad (71.7% urgent) to 1.99 in Loja/Calvas (5.1% urgent), and comparable heterogeneity was observed across the 34 clusters. This confirms H3: the same type of problem exhibits heterogeneous urgency levels depending on its geographic location, which indicates that perceived urgency is territorially contingent and cannot be inferred from the problem category alone.
An unanticipated finding is that parish type (urban/rural) was not significant in the multivariable model (OR = 0.965; p = 0.141), indicating that the urban–rural differences observed in the bivariate analysis are explained by the other variables in the model (frequency, category, impact). This implies that the perceived severity is not directly determined by the territorial context, but by the citizen’s lived experience of the problem.
5.3. Contribution to the SDG
The proposed CS–AI framework contributes to the Sustainable Development Goals (SDGs) by transforming citizen-generated observations into standardized, georeferenced, and actionable information aligned with the ISO 37120 taxonomy. Rather than directly measuring SDG achievement, the framework provides local governments with evidence to monitor urban conditions and prioritize interventions through internationally comparable indicators.
The framework makes its strongest contribution to SDG 11 (Sustainable Cities and Communities), particularly Target 11.3, by supporting participatory and evidence-based territorial planning. Through the adaptation of the 22 ISO 37120 categories, citizens reported 30,253 georeferenced urban events across 22 provinces and 93 cantons, generating disaggregated information on mobility, environment, safety, housing, public services, and governance. Spatial clustering and severity analysis enabled local governments to identify priority intervention areas and allocate resources according to territorial needs rather than administrative assumptions.
The contribution to SDG 16 (Peace, Justice and Strong Institutions) is associated with Target 16.7, which promotes responsive, inclusive, and participatory decision-making. The framework establishes a standardized mechanism through which citizens systematically communicate community problems, while local governments receive structured information compatible with ISO 37120 indicators. This process strengthens transparency, citizen participation, and the incorporation of community evidence into public decision-making.
For SDG 9 (Industry, Innovation and Infrastructure), the framework contributes to Target 9.5 by integrating Citizen Science, KoboToolbox, geospatial technologies, and artificial intelligence into a low-cost digital infrastructure for urban monitoring. This technological ecosystem enables local governments with limited statistical resources to generate reliable territorial data and apply AI-based analytical methods to support infrastructure planning and service management.
Finally, the framework supports SDG 17 (Partnerships for the Goals), particularly Target 17.17, through collaboration among universities, Decentralized Autonomous Governments, community representatives, and citizens. This multi-stakeholder partnership enabled nationwide data collection, methodological standardization, and knowledge transfer, demonstrating that sustainable urban monitoring can be achieved through coordinated academic–government–community collaboration while strengthening institutional capacity for evidence-based governance.
5.4. Reliability and Validity
Several procedures were adopted to support the reliability and validity of the citizen-reported data. Content validity was addressed at the instrument-design stage, where the correspondence of the subcategories with the ISO 37120 indicators and the clarity of the response scales were assessed by experts in urban and sustainable development. The reliability of the data-collection process was supported through standardized reporting protocols, the training of the 57 student collectors, and quality-control procedures including expert review, duplicate detection, and validation of GPS coordinates. Construct validity is supported by the internal coherence of the results: the predictors behave in the theoretically expected direction, with recurrence and personal impact amplifying perceived severity, and the ordinal structure of the classification errors is consistent with the ordinal nature of the construct. It should nonetheless be acknowledged that citizen-generated data of this kind are subject to reporter bias, since the citizens who choose to report may differ from those who do not, and to collector bias, since the distribution of reports reflects the residence and social networks of the participating students rather than a probabilistic sample. These biases, discussed among the limitations, mean that the coverage should be interpreted as the expression of an engaged citizen network and not as a statistically representative sample of the Ecuadorian population.
5.5. Limitations
This study has limitations that should be considered. First, the main collectors are university students, which may introduce access and perspective biases, although 87.3% of the reports come from citizens with other roles. Second, the instrument captured a limited set of demographic attributes, namely age and role; other attributes, such as socioeconomic status, identity, and lifestyle, were not measured, which bounds the demographic interpretation of the results. Third, the geographical distribution is not uniform: Pichincha concentrates 32.2% of the reports. Fourth, the five-month period limits the assessment of temporal trends. Fifth, machine learning was used only for post-processing, not for real-time classification. Sixth, the class imbalance of the outcome (the moderate and urgent levels jointly account for 84% of reports) lowers the classification recall of the minority mild class. No class-balancing techniques were applied, because they would bias the odds-ratio estimates that constitute the study’s inferential objective; this limitation affects the argmax classification of individual reports but not the inferential conclusions, which rest on the odds-ratio estimates and the standardized-residual analysis. Furthermore, although the framework was designed to be transferable, its replicability in other countries was not empirically tested; the evidence provided pertains to the Ecuadorian context, and transference to other Global South settings would require validating the local relevance of the ISO 37120 categories and the data-collection conditions. Finally, the study’s core variables, perceived severity, problem recurrence, and personal impact, are based on citizens’ subjective self-reports rather than on objective measurements. This is inherent to the citizen-perception approach adopted here and does not invalidate the findings, but it does bound their interpretation: the regression models identify predictors of perceived severity, that is, of how citizens experience and prioritize urban problems, and not of the technical severity that would be established by official indicators. Perceived and technical severity are complementary but distinct constructs, and the value of citizen perception for participatory planning lies precisely in capturing the community’s own prioritization, which official indicators do not reflect. On the other hand, the use of a three-point Likert-type scale to assess perceived severity may reduce the sensitivity of the system to capture subtle differences in citizens’ perceptions of urban problems. In future, research could investigate whether a five-point scale provides additional analytical value while maintaining response reliability in citizen science applications.
This framework was designed for use by local governments, but its validation with government users in real decision-making settings was beyond the scope of this study and remains an important direction for future work; assessing how the generated data influence territorial planning decisions would require a dedicated follow-up study with the participating DAG.
Finally, it should be acknowledged that the proposed framework is part of an ongoing university-led community engagement project. Therefore, the evidence reported in this study reflects the current stage of implementation and focuses mainly on the methodological coherence and applicability of the framework. Although preliminary evidence suggests its potential value for structuring citizen participation, integrating machine-learning-supported analysis, and aligning community-generated information with ISO 37120 indicators, the actual impact on the community has not yet been fully assessed. A longitudinal evaluation will be required to determine the extent to which the framework produces measurable benefits for participants and local stakeholders.
6. Conclusions and Future Work
This study demonstrates the feasibility of an integrated framework of Citizen Science, ISO 37120 and artificial intelligence for participatory community monitoring in low- and middle-income country contexts. In response to objective 1 (O1), it is evident that citizen perception is statistically structured and predictable when is channeled through ISO 37120 categories: the recurrence of the problem constitutes the dominant predictor of perceived severity, above the category of the problem and the reporter’s demographic profile. Regarding objective 2 (O2), spatial analysis using DBSCAN revealed heterogeneous and territorially differentiated patterns: the same category generates different urgency levels according to the canton and the urban–rural context, providing the DAG with territorialized information for territorial planning oriented towards sustainable development.
The main contribution is a low-cost model with a replicable design that articulates three theoretical frameworks [
7,
9,
13] in a complete operating cycle: from the identifying the community problem to the dashboard delivery to those who make decisions in the DAG. Additionally, the study provides empirical evidence on citizen perception of community problems in Ecuador: with 30,253 reports distributed in 22 provinces and 181 parishes, it demonstrates that distributed CS through university students is able to achieve significant territorial coverage in the Global South, constituting a viable alternative to traditional data collection methods for participating territorial planning.
Beyond these contributions, the study has both theoretical and practical implications. From a theoretical standpoint, it extends the citizen science literature by showing that a standardized urban taxonomy such as ISO 37120 can serve not only as a benchmarking tool for inter-city comparison, but also as a structuring instrument for participatory data generation. It also provides empirical support, grounded in risk perception theory, for the finding that problem persistence is a stronger determinant of perceived severity than either the problem category or the reporter’s profile. From a practical standpoint, the framework offers local governments an operational and low-cost mechanism to obtain territorially disaggregated data on citizen priorities. Moreover, the finding that perceived urgency increases as problems persist provides a concrete criterion for decision-making: recurrent problems should be prioritized early, before they become constant and more difficult to address. Finally, the territorialized identification of high-urgency clusters enables local governments to target interventions where perceived urgency is most acute, supporting a more evidence-based and spatially informed allocation of resources. As future work, we propose to (a) scale the framework to other DAGs in Ecuador and the Andean region; (b) develop a dedicated mobile application that incorporates real-time AI during collection AI-CS; (c) conduct longitudinal studies with pre-measurement–post to evaluate the impact of monitoring in participatory governance and institutional trust; (d) compare citizen priorities with the official diagnoses contained in the development and territorial planning plans (PDOT) of the DAG to identify gaps between community perception and institutional planning; and (e) involve additional actors, such as the association of Ecuadorian municipalities (AME), the Consortium of Provincial Autonomous Governments of Ecuador (CONGOPE), the National Council of Rural Parishes governments of Ecuador (CONAGOPARE) and higher education institutions, to strengthen the sustainability of the model.