Article

Mapping the Affordability of Campus Digital Twin Implementation in the United States

1
Department of Landscape Architecture and Urban Planning, Center for Geospatial Sciences, Applications and Technology, Texas A&M University, College Station, TX 77840, USA
2
Department of Geography and the Environment, Alabama Center for the Advancement of AI, The University of Alabama, Tuscaloosa, AL 35401, USA
3
Department of Geography, University of South Carolina, Columbia, SC 29208, USA
4
Center for Geographic Analysis, Harvard University, Cambridge, MA 02138, USA
*
Author to whom correspondence should be addressed.
Smart Cities 2026, 9(8), 122; https://doi.org/10.3390/smartcities9080122

Submission received: 4 April 2026 / Revised: 26 June 2026 / Accepted: 27 July 2026 / Published: 29 July 2026
(This article belongs to the Collection Digital Twins for Smart Cities)

Highlights

This study introduces an initial exploratory scenario-based Campus Digital Twin Affordability Index to systematically evaluate the financial feasibility of campus digital twin implementation across 1872 U.S. higher education institutions, combining spatial and sensitivity analyses with multi-source datasets.
What are the main findings?
  • Most U.S. campuses show moderate-to-high affordability with spatial clusters concentrated in coastal and metropolitan regions, while nearly one-quarter remain unaffordable or marginally affordable, with clusters located in the Midwest.
  • Private institutions, especially for-profit campuses, demonstrate relatively greater affordability than public institutions, while states with strong economic and educational infrastructures, such as California, show higher adoption capacity.
What are the implications of the main findings?
  • Standardized cost models, public cost databases, and targeted policy mechanisms are needed to reduce spatial and institutional disparities in affordability.
  • Multi-stakeholder collaboration among policymakers, institutional leaders, and industry partners is essential to promote equitable and cost-effective digital twin adoption in higher education.

Abstract

Digital Twin technologies hold significant promise for advancing smart campus initiatives by enabling data-driven management of facilities, sustainability planning, and safety monitoring. Despite this potential, affordability remains a critical barrier to widespread adoption across higher education institutions. This study introduces an initial exploratory scenario-based affordability index for campus digital twin and maps the affordability of implementing campus digital twin across 1872 U.S. higher education institutions using spatial analysis techniques. Sensitivity analysis is also conducted to evaluate the robustness of the results. Our analysis yields three key findings: (1) Under the baseline scenario, most campuses show moderate-to-high affordability with spatial clusters concentrated in coastal and metropolitan regions, while nearly one-quarter remain unaffordable or marginally affordable, with clusters located in the Midwest. (2) Private institutions demonstrate relatively greater affordability than public institutions, with for-profit private institutions exhibiting higher affordability than their non-profit counterparts. Spatial aggregation patterns further reveal heterogeneity in affordability between these sectors. (3) States with strong economic and educational infrastructures, such as California, contain a greater number of affordable campuses for digital twin implementation, while resource-constrained states face significant barriers. These findings remain generally robust and consistent across the baseline and sensitivity scenarios. The results underscore the need for standardized cost models, public cost databases, targeted policy guidance, and multi-stakeholder collaboration to promote equitable adoption. By positioning digital twins as strategic tools for campus resilience, efficiency, and innovation, this study advances the conceptual understanding of their role in higher education and provides exploratory yet actionable insights for institutional leaders and policymakers to support inclusive digital transformation.

1. Introduction

A Digital Twin (DT) is a real-time virtual representation of a physical process or system [1]. With advances in information technology and computing, DT has been increasingly applied across diverse domains, including industrial manufacturing [2], civil engineering [3], transportation [4], and urban planning [5]. Urban digital twins have been developed across multiple scales, ranging from city centers [6] and residential communities [7] to individual buildings [8].
Despite this momentum, Campus Digital Twin (CDT) remains underexplored as both a concept and a practice. University campuses represent micro-urban environments that face growing demands for space efficiency, sustainable operations, mobility management, infrastructure renewal, and data-informed decision-making [9,10]. CDT can serve as an integrative platform for enhancing operational performance, supporting academic and administrative decision-making, and fostering innovation in student experience and research environments. For instance, students and faculty can use CDT applications to query real-time study space availability [11], schedule adaptive course timetables [12], visualize heat stress conditions, and receive personalized walking route recommendations [13]. In this sense, campuses are not only potential beneficiaries of digital twin technologies but also valuable testbeds for advancing digital transformation at a manageable scale.
However, CDT deployment faces significant challenges, particularly affordability. High development costs, interoperability issues, and data integration complexity remain persistent barriers [11], while the computational demands associated with real-time sensor data and predictive modeling often require substantial upfront investment to deliver meaningful returns [14]. For example, the Virtual Singapore project, one of the most comprehensive DT initiatives, received an investment of approximately SGD 73 million (USD 55 million), and required the integration of more than 50 terabytes of heterogeneous data, including more than three million images and 600 million LiDAR points [15]. At the campus scale, the University of Cambridge’s West Cambridge DT covered more than 20 university buildings, residential areas, main roads, parking, and restaurants, relying on UAV point cloud scanning, localized laser scanning, and photogrammetry [16]. The scale and complexity of such projects underscore the financial and technical barriers to broader adoption, particularly in higher education, where budgets are often constrained.
In response, this study introduces an initial exploratory scenario-based Campus Digital Twin Affordability Index to systematically evaluate the financial feasibility of CDT implementation across U.S. higher education institutions. Using quantitative and spatial analytical methods together with sensitivity analysis, we assess the extent, variation, and geographic distribution of CDT affordability at a national scale and evaluate the sensitivity of the results. Specifically, this study addresses three research questions:
  • Is the implementation of CDT financially feasible for U.S. institutions?
  • How does affordability vary across public and private institutions?
  • What are the spatial patterns of affordability at regional and local levels?
By positioning affordability as a critical factor in CDT adoption, this study advances conceptual understanding of why digital twins matter for campus contexts. These exploratory findings contribute to the scholarly discourse on digital transformation and offer valuable insights for the equitable and cost-effective deployment of CDT in higher education.

2. Related Work

2.1. Campus Digital Twin

The concept of digital twins can be traced back to the 1990s [17]. In 2002, Michael Grieves formally introduced digital twins as a model for product lifecycle management at the University of Michigan [18]. Subsequently, it was widely used in industrial design and manufacturing fields, including applications at NASA [19]. In recent years, the concept and implementation of DT have been increasingly extended to the operational management of university campuses [11]. Despite growing interest, there remains no unified definition or conceptual framework for CDT, leading to divergent scholarly interpretations and research trajectories. Given the inherent complexity of campus environments as large-scale and multi-functional systems, the development of DT at this scale poses significant challenges in terms of both system integration and resource investment. Consequently, existing studies have tended to apply DT to various campus subsystems, including curriculum management [12], energy and waste systems [20], heat stress monitoring [13], water supply networks [21], and traffic simulation [22]. However, few studies have approached CDT from a holistic systems perspective. An illustrative example is the CDT that was developed for the Missouri University of Science and Technology [23]. Leveraging a detailed 3D model, their platform integrates multiple functional domains, including building and infrastructure planning, structural condition assessment, construction management, and environmental planning related to flood-zone sustainability, demonstrating the potential of CDT as a multifunctional decision-support system.
The development of CDT usually includes the following components: (1) 3D campus models: These include information about campus buildings, terrain, roads, and other relevant features, constituting the most critical component. Light Detection and Ranging (LiDAR) technology has been extensively employed to generate large-scale 3D models at relatively low cost [24]. (2) Device hardware: It primarily includes data collection, storage, simulation analysis platforms, IoT devices, and sensors. To facilitate the collection and simulation of real campus data, various sensors need to be installed in the physical environment [23]. (3) Interactive visualization interfaces: These mainly include visual dashboards and related mobile applications [11], which can enhance collaboration and interaction among users, including teachers, students, and administrators.

2.2. Affordability Index

An affordability index is typically used to evaluate the ability of an average individual to afford a specific item or service [25]. It is primarily applied to essential utility services needed by individuals or households, including housing [26], transportation [27], healthcare [28], electricity [29], and water supply [30]. In urban studies, the housing and transportation affordability indices represent some of the most prominent and extensively examined topics. Furthermore, scholars have argued that conventional measures of housing affordability are incomplete and that more accurate assessments should incorporate both housing and transportation expenditures. In response, a location affordability index has been proposed to evaluate the combined cost burden of housing and travel, enabling spatial comparisons of household affordability across different locations [31,32,33]. Similarly, some scholars have extended the application of the affordability index to the operation of public infrastructure and systems such as Information and Communications Technology (ICT) and public transportation. For example, some researchers measured the concentration and affordability of ICT infrastructure in Australia using disaggregated spatial units [34]. Also, an adapted affordability index has been used to measure spatial inequalities in the access to station-based bike-sharing public cycling infrastructure in Barcelona [27].
Regarding the calculation of the affordability index, the conventional method typically employs an expenditure-to-income ratio to represent residents’ access to public services. This metric may be expressed as a raw ratio or normalized against a designated index value. In the context of housing affordability, the widely adopted income-ratio method applies a threshold or percentile benchmark to the housing cost-to-income ratio [35]. To further investigate spatial patterns in affordability outcomes, spatial analysis techniques have proven effective. For instance, both global and local spatial autocorrelation analyses have been applied to capture the spatiotemporal dynamics of housing affordability at the urban scale [36]. In addition, from a research scope perspective, studies on the affordability index have predominantly focused on the urban level [26], with a smaller but growing body of work extending to macro-scale analyses. Notable examples at the national level include studies conducted in the United States [37], China [38], and Israel [39], reflecting broader spatial applications of affordability assessment frameworks.
Furthermore, existing literature reveals a notable research gap, as virtually no studies have integrated the concepts of CDT and affordability index. While a few scholars have discussed the high development costs and affordability challenges associated with CDT [11], systematic research in this area remains limited. To address this gap, the present study investigates the affordability of CDT implementation across higher education institutions in the United States from a macro-scale perspective, thereby contributing to the diversification and advancement of affordability index research.

2.3. Cost Estimation of CDT Implementation

A key challenge in measuring the affordability of CDT lies in accurately estimating implementation costs. Due to the current lack of systematic research on cost estimation within the context of CDT, we argue that methodological approaches developed in the manufacturing sector, where DT technologies are more mature, may offer valuable insights. These cross-sectoral parallels can inform the development of cost models tailored to the unique spatial, infrastructural, and operational complexities of campus environments. A Cost Constructive Model II has been proposed to assess the cost of DT implementation in the U.S. Air Force [40]. The primary cost factors include computational capability, software tools, and workforce expenses. Previous studies have suggested that DT-related costs primarily encompass investment, implementation, and operational expenses [41]. Implementation costs mainly include labor expenses for installation, development, and training, while consulting fees are categorized as external labor costs. In the metallurgical industry, the costs associated with creating a DT for a small-section wire mill may include labor expenses, equipment costs, payroll costs, and intangible investments [42]. In the construction industry, beyond the initial software and hardware expenses, substantial costs are associated with staff training and the implementation time required for DT deployment [43].
Additional insights can be drawn from current market research on urban digital twin development and emerging industry pricing standards. Enterprise-level assessments suggest that the total cost of DT implementation typically includes expenditures related to system design, software development, deployment, integration with existing infrastructure, and ongoing maintenance. These cost components provide a reference framework for estimating the financial requirements of a campus-scale digital twin, particularly in the absence of academic consensus [44]. Furthermore, implementation costs are influenced by factors such as building size, functional typology, and system complexity [45]. A theoretical cost model estimates that, for university campuses spanning approximately 90,000 m2, a reasonable range for consultant, client, and fixed costs falls between $15/m2 and $21/m2, and the total projected cost for developing a campus-scale DT ranges from approximately $1.4 million to $2 million [45].

3. Methods

3.1. Study Area and Data Sources

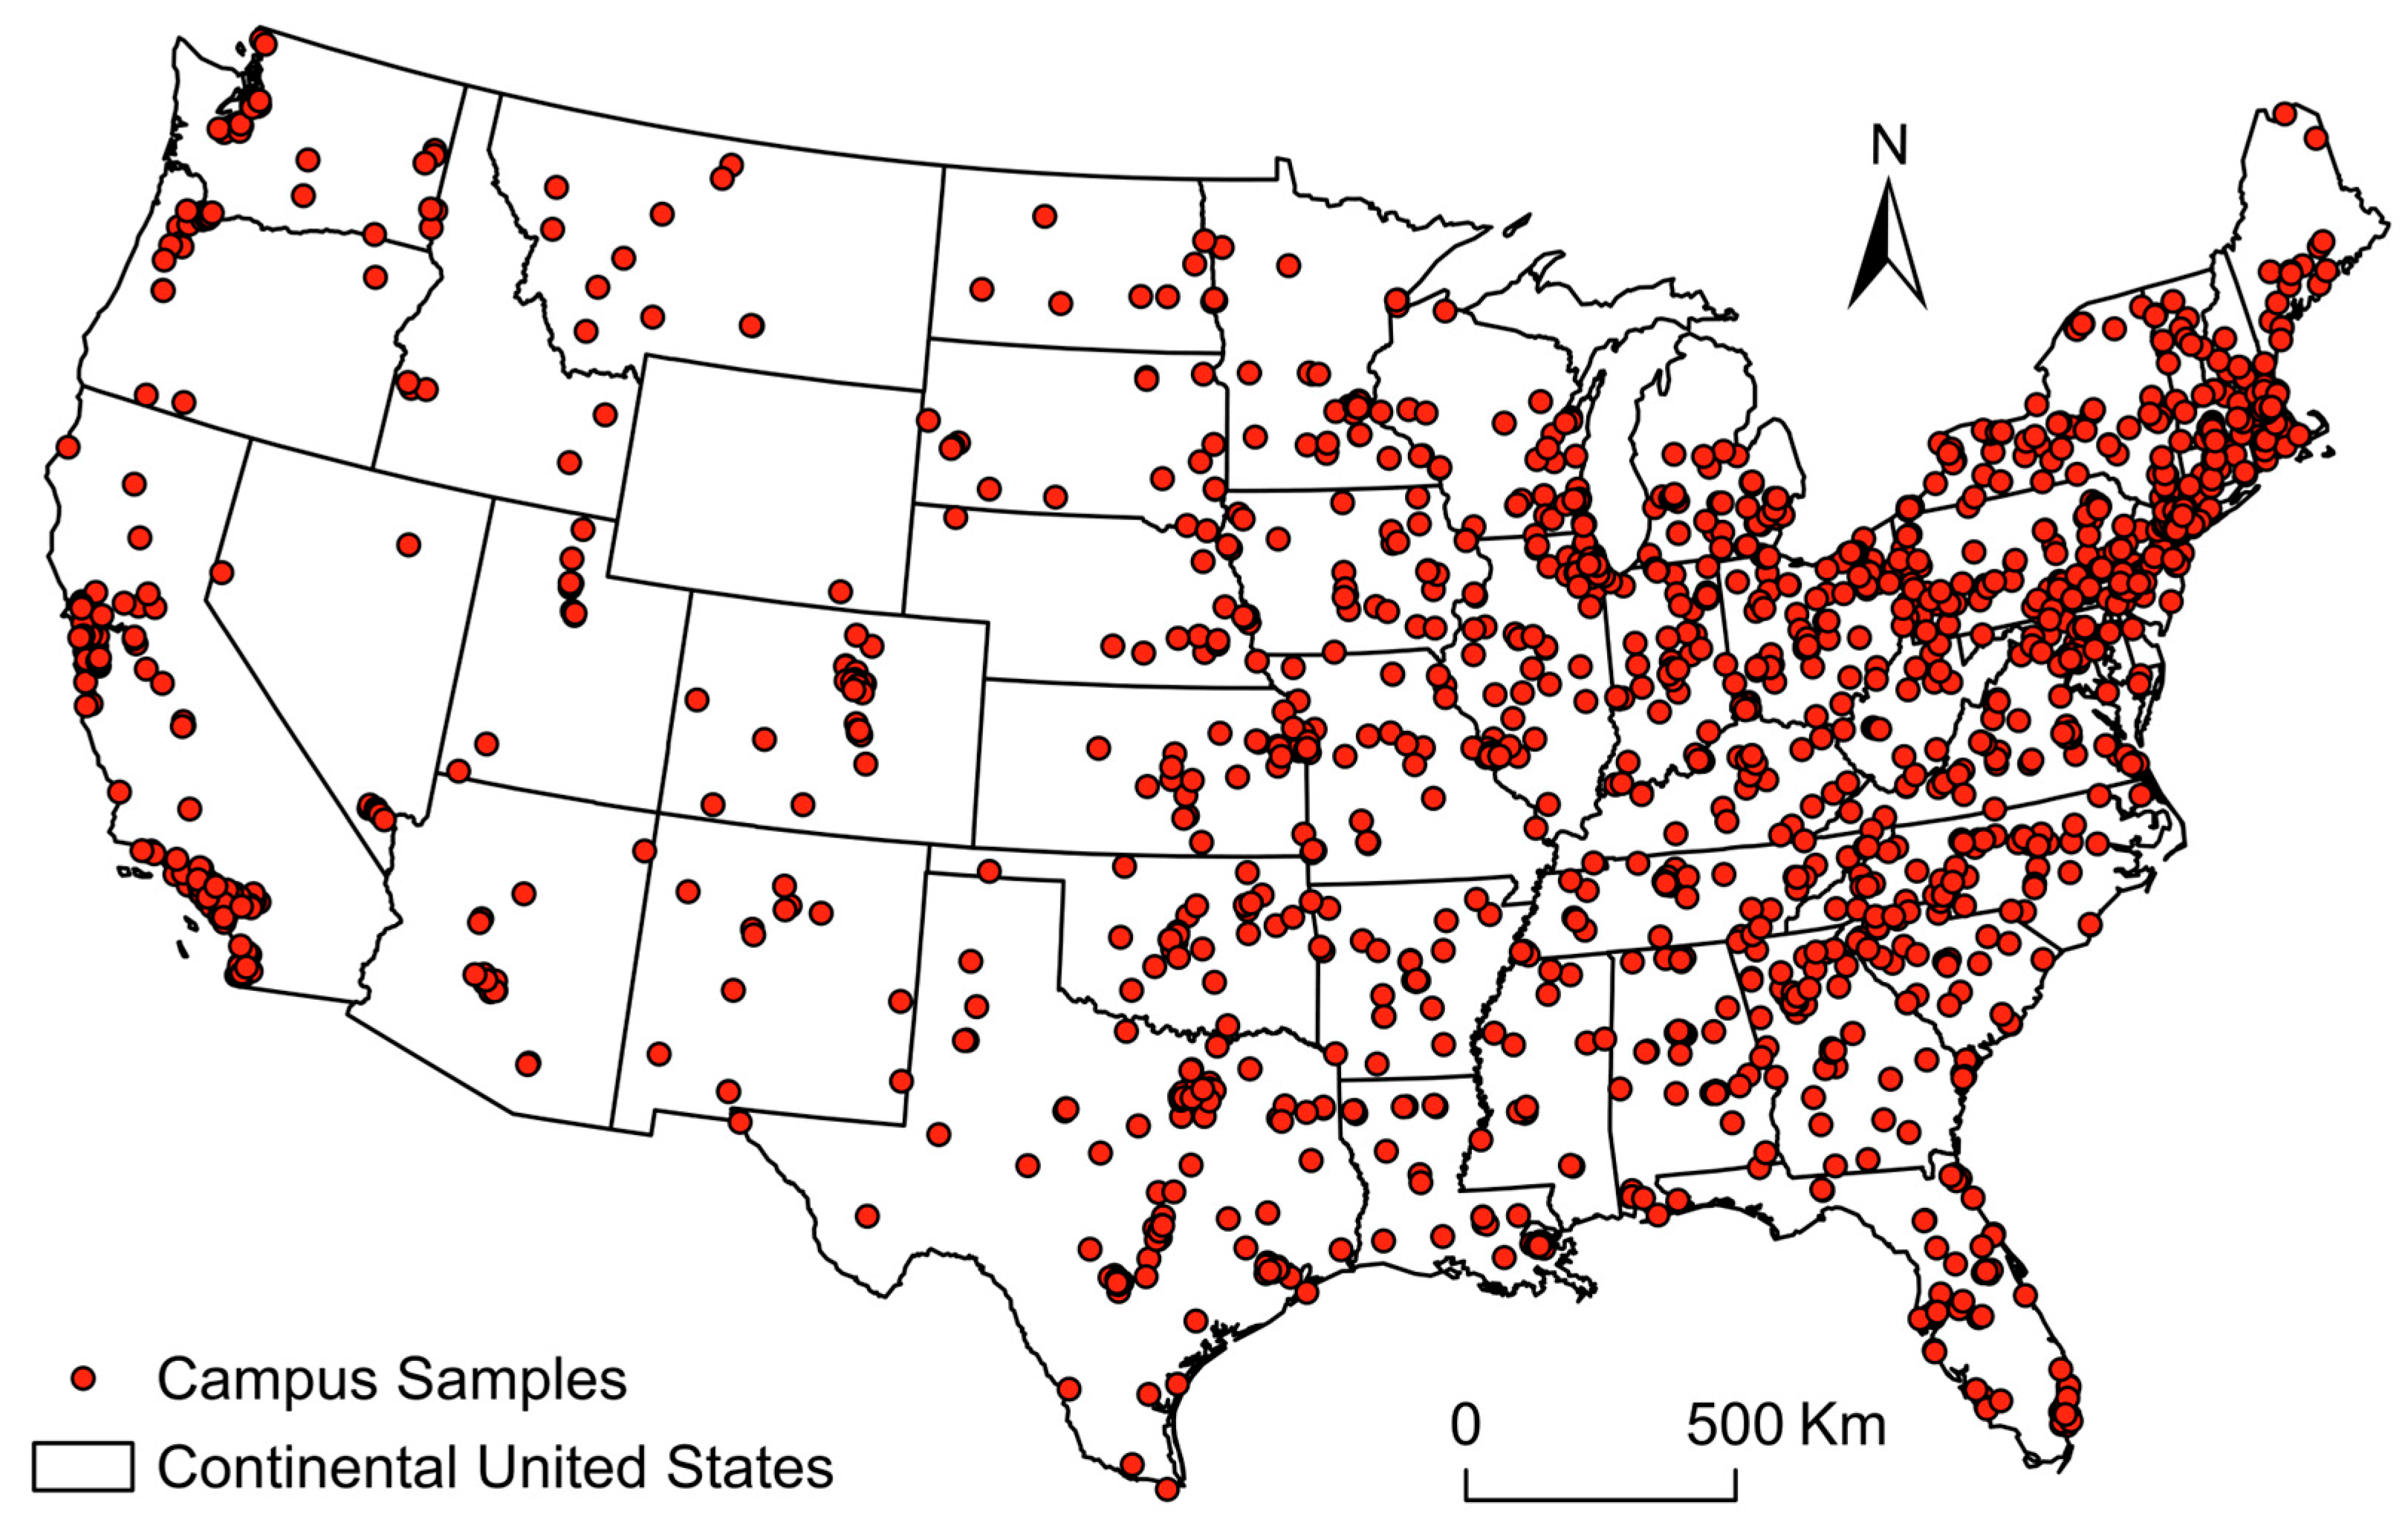
This study focuses on the continental United States, with the research scope limited to higher education institutions, specifically colleges and universities, while excluding primary and secondary educational institutions. Following data collection and cleaning procedures, a total of 1872 valid higher education institution samples were identified. Figure 1 illustrates the spatial distribution of the sampled campuses across the United States.
Table 1 lists the data sources used to compile campus information for this study. Campus point data, campus boundary data, and administrative boundary basemap data were all obtained from the official Homeland Infrastructure Foundation-Level Data (HIFLD) agencies [46,47,48]. Campus institutional attribute data were acquired from the Integrated Postsecondary Education Data System (IPEDS) for the 2022 financial year [49]. The attribute fields include IPEDS ID, institution name, student population, institutional control, degree of urbanization, and institutional support budget. According to NCES definitions, institutional control is categorized as Public, Private Not-for-Profit, or Private For-Profit. The degree of urbanization reflects the geographic context of each campus, classified into Large City, Midsize City, Small City, Suburb, Town, and Rural categories.

3.2. Research Methods

3.2.1. Methodology for Measuring the Campus Digital Twin Affordability Index

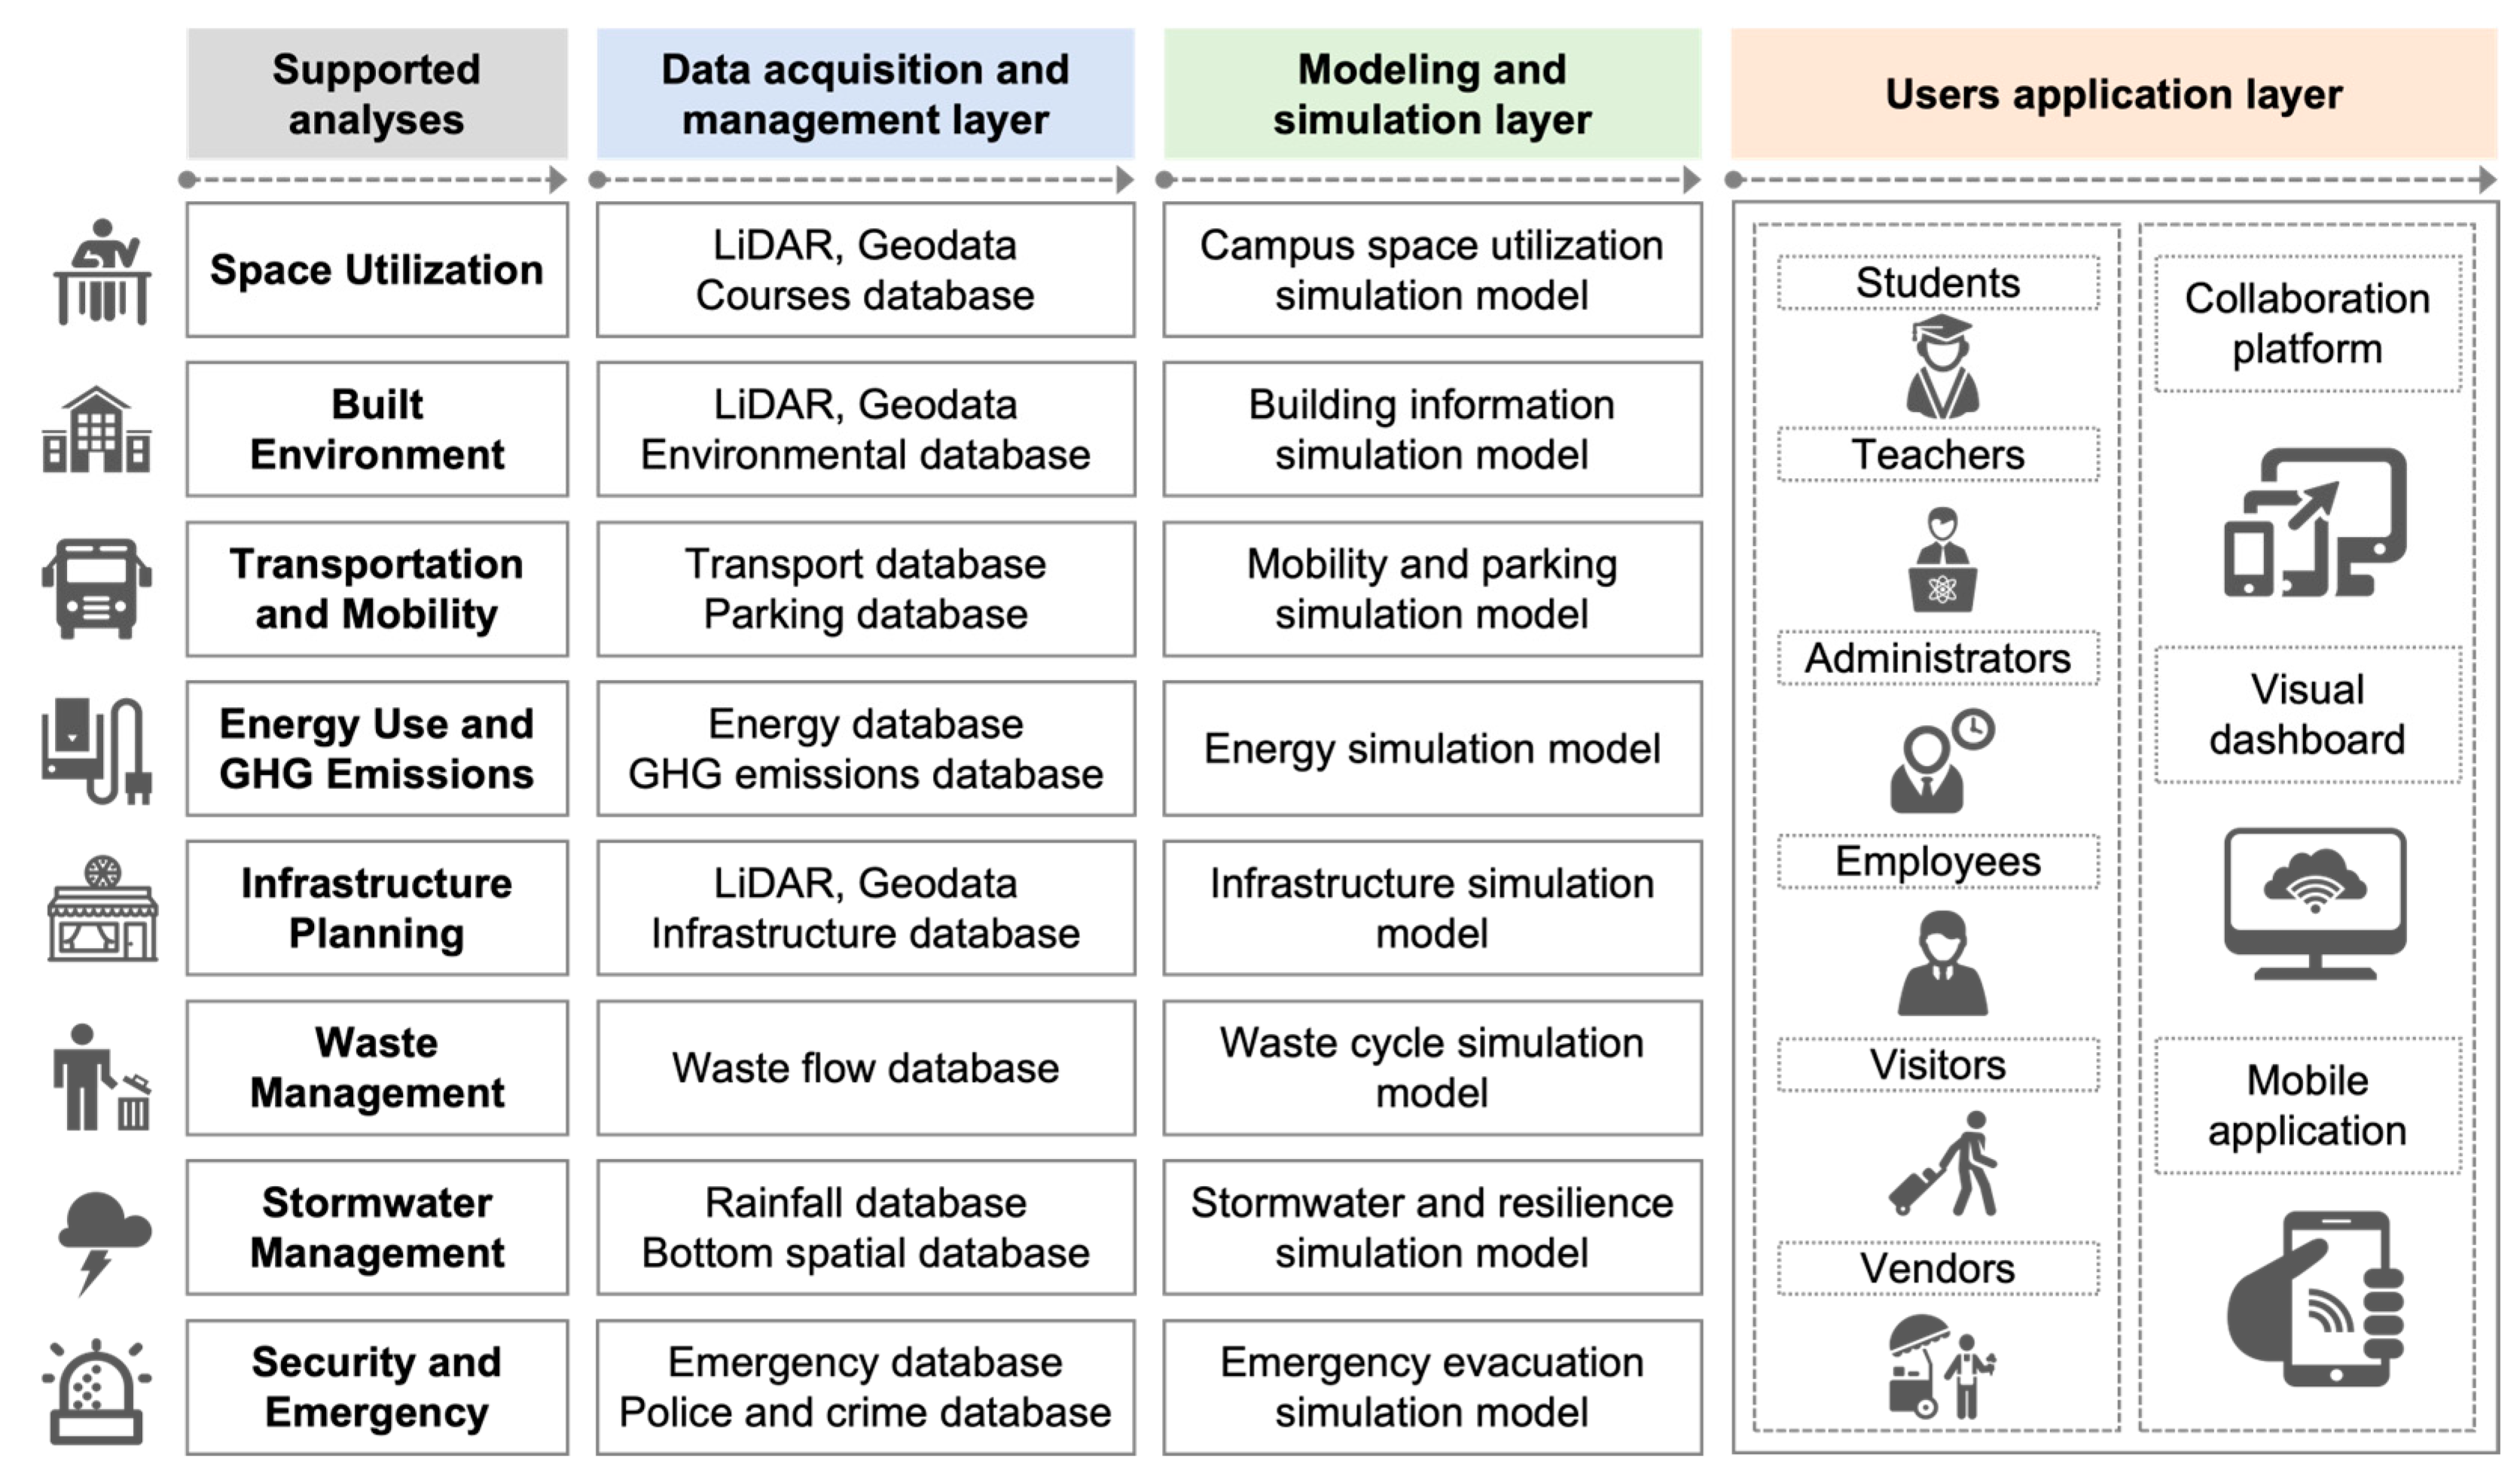
Development Structure of Campus Digital Twin. The implementation depth of CDT varies across institutions and is often shaped by campus-specific challenges and corresponding resource constraints, which in turn influence implementation costs. In the United States, universities and colleges are increasingly confronted with sustainability pressures, particularly those related to the limitations of physical space and infrastructure. CDT is positioned as a critical tool for advancing sustainable development and improving operational efficiency. For instance, the 2024 Capacity Study Report from Texas A&M University highlights a growing demand for enhanced campus mobility, more effective space utilization, and accelerated facility renewal in response to rising student and faculty populations [9]. Similarly, the university’s 2018 Sustainability Master Plan identifies key sustainability objectives centered on five physical space-related domains: energy use and greenhouse gas (GHG) emissions, stormwater management, campus mobility, built environment and site design, and waste management [50]. In response to these multifaceted challenges and objectives, this study proposes a feasible development framework for Campus Digital Twin (Figure 2).
As illustrated in Figure 2, a CDT is conceptualized as comprising three core layers: (1) the data acquisition and management layer, responsible for collecting, storing, and integrating multisource data; (2) the modeling and simulation layer, which enables dynamic representation and predictive analysis of campus systems; and (3) the user application layer, which is tailored for various campus stakeholders, including students, teachers, administrators, employees, visitors, and vendors. Applications such as collaborative platforms, visual dashboards, and mobile tools are developed to support decision-making and facilitate user interaction and collaboration, thereby achieving a seamless and interactive user experience. In response to campus sustainability guidelines, this study also identifies eight primary application domains of CDT, each supported by targeted analytical capabilities designed to enhance operational efficiency and promote sustainable development outcomes:
(1)
Space Utilization: By integrating LiDAR, geospatial data, individual activity data, and course-related information databases, CDT can optimize the utilization of interior spaces, such as classrooms and conference rooms, to improve space operation efficiency.
(2)
Built Environment: Using LiDAR, geospatial data, building data, and outdoor environmental information databases, CDT can predict and inform interventions to enhance the conditions of the built environment, such as campus microclimates and building lighting conditions.
(3)
Transportation and Mobility: Traffic flow data, parking information, and video monitoring systems are used to track usage patterns of campus roads and parking lots, effectively addressing congestion and parking challenges in critical areas and informing data-driven strategies to promote sustainable mobility, including walking, cycling, and public transit.
(4)
Energy Use and GHG Emissions: Drawing on energy databases and carbon emissions and sinks databases, CDT supports building energy management and contributes to campus decarbonization goals, particularly in electricity consumption, heating, and cooling systems.
(5)
Infrastructure Planning: Spatial databases of campus facilities are combined to simulate and plan infrastructure construction and renewal projects.
(6)
Waste Management: Integration of waste volume and flow data facilitates efficient waste transfer and treatment processes on campus.
(7)
Stormwater Management: By combining rainfall data and spatial terrain databases, CDT can support campus resilience and stormwater management during extreme events, such as rainstorms or flooding.
(8)
Security and Emergency: Using emergency databases, police and crime databases, and video surveillance data, CDT can simulate and predict evacuation routes during emergencies, such as fires, earthquakes, storm floods, and terrorist crimes.
Additionally, the development depth and scale of CDT play important roles in implementation costs. Not all application domains discussed above require the same spatial resolution or Level of Detail (LOD). For example, building environment and infrastructure applications mainly rely on LiDAR- or photogrammetry-based 3D models, whereas energy or waste management applications primarily depend on sensor systems and require less detailed geometric information. Moreover, Building Information Modeling (BIM) is important for monitoring precise indoor conditions, such as indoor thermal environments and temperature control. However, integrating comprehensive BIM systems across campuses may increase costs for CDT adoption.
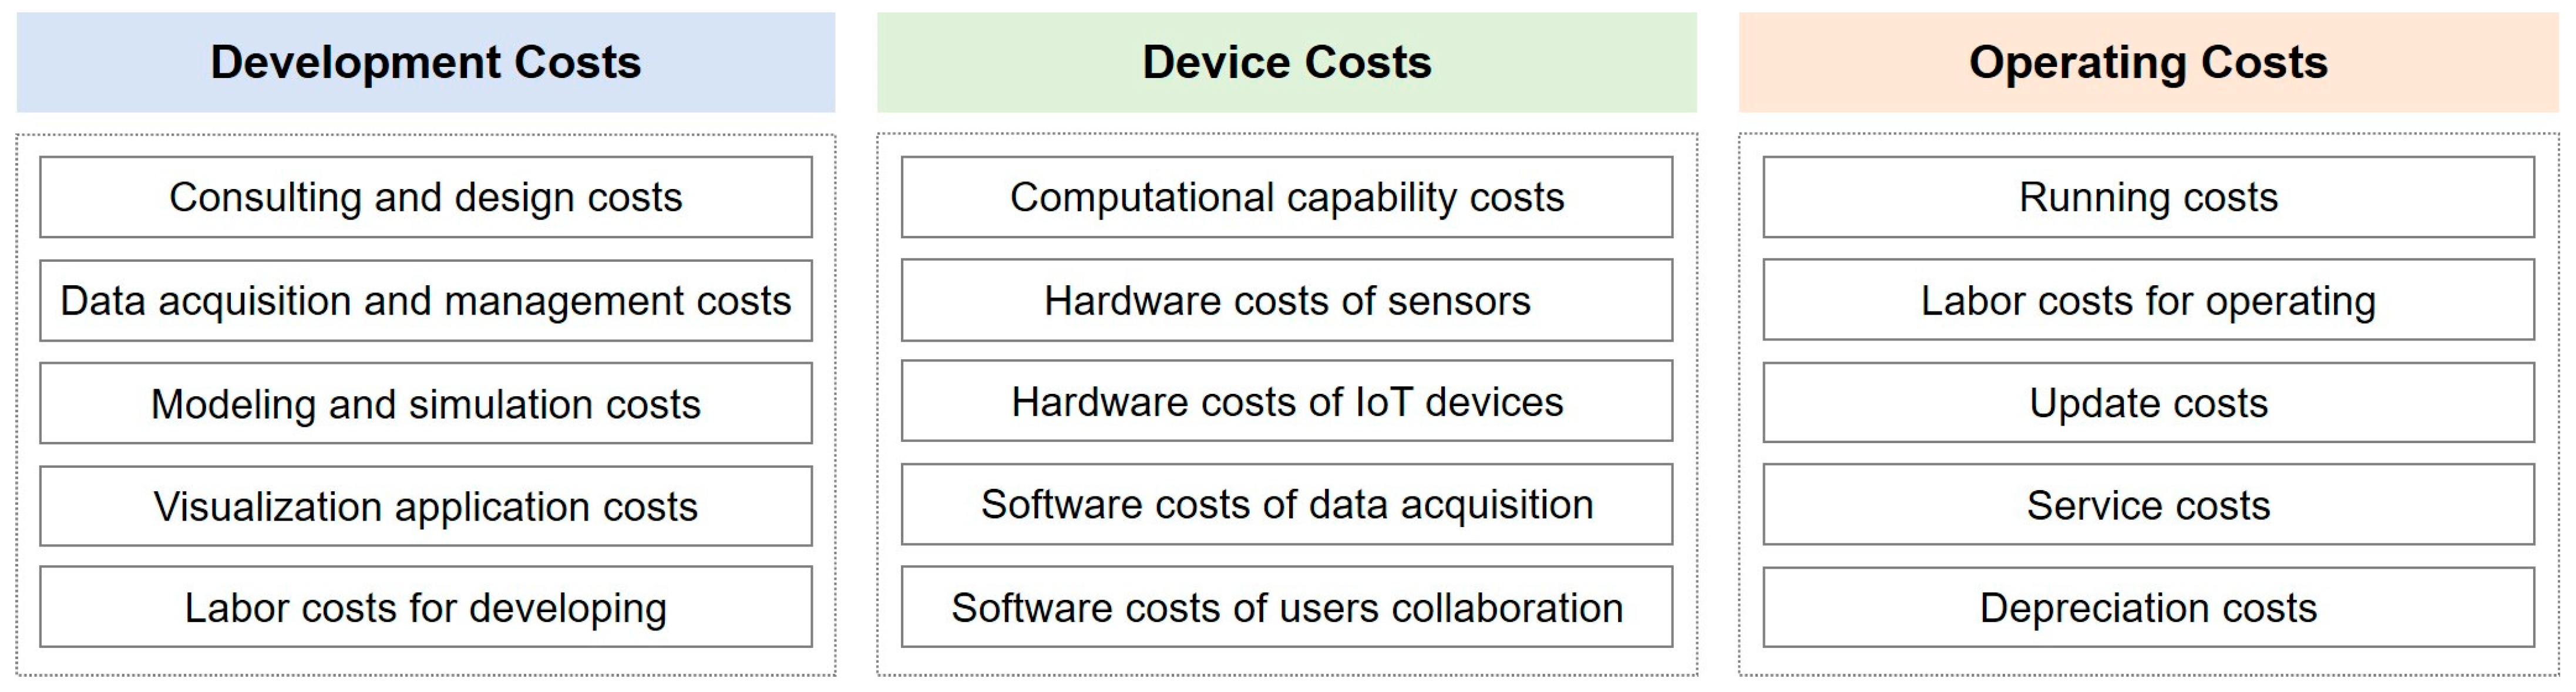
Cost Components of Implementing Campus Digital Twin. Building upon the proposed development framework for Campus Digital Twin, this study conceptualizes the total implementation cost as comprising three primary components (Figure 3):
(1)
Development Costs: These encompass all expenses incurred throughout the DT development lifecycle, including initial project consultation and design, data acquisition and management, modeling and simulation, visualization and application development, as well as related labor costs.
(2)
Device Costs: This category covers expenditures on essential hardware and software. Hardware costs include the procurement of monitoring sensors (e.g., for temperature and air quality), Internet of Things (IoT) devices, and computational resources such as CPUs and GPUs. Software costs comprise investments in early-stage data acquisition tools and platforms (e.g., visual dashboards, mobile applications) that facilitate end-user collaboration.
(3)
Operating Costs: These represent the ongoing expenses required for system operation and maintenance, including labor, system updates, technical support services, and equipment depreciation throughout the implementation period.
Affordability Index for Campus Digital Twin. To enable large-scale comparative assessment of CDT affordability, this study adopts a standardized analytical framework that abstracts from institution-specific implementation details. Campuses are modeled under a common CDT development structure with comparable functional scope and operational depth. Rather than representing actual deployment conditions, this standardized framework serves as a simplified analytical baseline for national-scale analysis. Given the inherent complexity and heterogeneity of campus systems, precise cost estimation for CDT implementation at a large regional scale remains challenging. This study introduces a simplified approximation in which CDT development and maintenance costs are modeled as scaling with campus land area and floor area. Under this approximation, larger campuses are expected to have higher development, device, and operational costs due to greater spatial extent and infrastructural complexity. This assumption is supported by existing literature from both academic [43,51,52] and industry sources [44,45]. For example, one study proposes theoretical DT cost models, estimating costs per square meter under conditions of data uncertainty [45]. Larger campuses also tend to possess more complex infrastructure, requiring extensive data acquisition, integration, and real-time monitoring systems, which significantly increase overall costs [51]. At the same time, it should be noted that campus academic and operational characteristics, including research intensity, student and faculty population, and building typology, may influence CDT implementation details and associated costs. For example, engineering, physics, medical, or laboratory-intensive campuses may require more advanced sensing and simulation infrastructure than campuses focused primarily on social sciences or administrative activities. More broadly, even if campuses have similar physical dimensions, they may require substantially different digital twin architectures depending on their operational objectives, existing infrastructure, and technical maturity. However, standardized data on these institutional characteristics at the national scale are not systematically available in the existing IPEDS and HIFLD datasets, and their incorporation would not be appropriate for this initial exploratory national-scale benchmarking study.
Building on prior analyses and foundational studies on the affordability index [26,31,32], we introduce an initial exploratory scenario-based CDT Affordability Index to evaluate the economic feasibility of CDT implementation. We emphasize that this index reflects relative financial affordability rather than a comprehensive measure of CDT implementation feasibility. The latter also depends on factors beyond its scope, such as existing institutional digital infrastructure, technological maturity, staffing, and governance. The index is defined as the percentage ratio of total implementation cost to the campus’s annual institutional support budget (Formula (1)). The total implementation cost comprises development, device, and operational expenditures specific to each campus (Formula (2)).
A i = C i B i × 100 %
C i = S i   × F A R i   × C 0
  • Ai is the CDT affordability index of campus i.
  • Bi is the institutional support budget of campus i.
  • Ci is the total cost of CDT implementation of campus i.
  • C0 is the cost of CDT implementation on campus i per unit floor area, including development, device, and operating/maintenance costs.
  • Si is the land area of campus i.
  • FARi represents the floor area ratio (FAR) of campus i, which is the ratio of floor area to land area.
The Ai value is expressed as a percentage. When the Ai value exceeds 100, meaning that the implementation costs meet or exceed the institutional support budget, the campus is considered unaffordable for CDT implementation. The smaller the Ai value, the more affordable the CDT implementation on the campus. For campuses with Ai values below 100, we applied the Jenks natural breaks method, which identifies natural groupings by minimizing within-class variance and maximizing between-class variance, to classify campuses into three affordability categories for further quantitative and spatial analysis. This classification approach has been widely used in geographic and affordability-related studies [53,54], demonstrating its effectiveness.
The Bi value can be obtained from the Integrated Postsecondary Education Data System (IPEDS) dataset [49]. This value refers to the campus institutional support budget, which captures total operational expenditures related to administrative functions, space management, long-range planning, and other general support services essential to institutional operations. We selected this value as the denominator because it directly reflects institutional capacity for infrastructure management and operations, which are closely related to the application domains and objectives of CDT deployment. As institutions are unlikely to allocate the entire budget to CDT deployment, other budget indicators related to research, public service, and student services are not appropriate for this study. In addition, financial factors such as endowment and capital reserves may also influence affordability; however, these data are not available from IPEDS for consistent nationwide comparison and exploratory analysis.
The C0 value is set to $15/m2 in the baseline model, based on the literature and market pricing standards [44,45]. This model represents a moderate-cost scenario in which the LOD includes campus outdoor spatial data acquisition, building 3D modeling, and essential sensor deployment. This technical scope is also consistent with the documented implementation scope of campus-scale CDT cases [16,23]. Additionally, to evaluate the sensitivity of C0, we conducted a sensitivity analysis and further examined lower- and higher-cost scenarios.
In terms of FAR, significant differences in campus building density and form are often observed between urban and suburban or rural areas. Therefore, we assumed that campuses located in different urbanized settings exhibit different FAR values. According to the National Center for Education Statistics and related campus planning materials [49,55,56,57,58], representative campuses and their corresponding FAR values are presented in Table 2. For example, the University of Minnesota-Twin Cities and Wayne State University are located in large cities, with FAR values of 1.13 and 1.21, respectively. The University of Michigan-Ann Arbor and Princeton University are located in a midsize city and a small city, with FAR values of 0.58 and 0.60, respectively. In contrast, Stanford University and Clemson University are situated in suburban settings, with FAR values of 0.34 and 0.22, respectively. These results indicate clear differences in FAR values across campuses located in large cities, midsize and small cities, and suburban areas.
Although actual FAR values frequently vary across regions and institutional types, we adopted the approximate average FAR values for these three settings, derived from empirical campus cases, to establish a standardized quantitative benchmark. Based on the above discussion, we divided university campuses into three categories: (1) campuses in large cities (FAR = 1.0), (2) campuses in midsize and small cities (FAR = 0.5), and (3) campuses in suburbs, towns, and rural areas (FAR = 0.3). In addition, different scenarios, including 20% increases and decreases in FAR, were introduced to evaluate sensitivity to FAR.

3.2.2. Spatial Analysis Methods for National-Scale Patterns

While the affordability index methodology is established at the campus level in the preceding section, this study further applies spatial analytical techniques, including the Global Spatial Autocorrelation Tool and the Local Moran’s I Clustering and Outlier Analysis Tool, to examine the affordability patterns at the national scale. In addition, to mitigate potential density artifacts and ensure each campus contributes equally to the spatial cluster assessment, we adopted a K-nearest neighbor approach with weights matrix (K = 8) and 999 conditional permutations in both spatial analytical techniques.
Global Spatial Autocorrelation Tool. This tool is commonly employed to measure the clustering distribution across an entire study area. The global Moran’s I index is calculated to assess the degree of interdependence between neighboring locations. A higher value of Moran’s I index indicates a more substantial level of spatial correlation. The calculation formula can be found in the study [59].
Local Moran’s I Clustering and Outlier Analysis Tool. This method determines whether spatial autocorrelation exists in a local area by calculating the degree of correlation for a specific attribute between each spatial unit and its neighboring units. The specific formula can be found in these studies [60,61]. This tool yields four types of aggregation results. (1) High/High clustering: High-value units are surrounded by other high-value units. (2) High/Low outlier: High-value units are surrounded by low-value units. (3) Low/High outlier: Low-value units are surrounded by high-value units. (4) Low/Low clustering: Low-value units are surrounded by other low-value units.

3.2.3. Sensitivity Analysis Methods

To further assess the robustness of the results under the parameter assumptions, we conducted a sensitivity analysis by adjusting two parameters: the CDT implementation cost per unit floor area on each campus (C0) and the Floor Area Ratio (FAR).
Sensitivity of C0. Real-world implementation costs of digital twins vary to some extent depending on configurations, Level of Detail, data granularity, sensor density, and system interoperability requirements, resulting in substantial cost differences. Given this uncertainty, we set the C0 value to $15/m2 as the baseline model, as discussed before, and tested three implementation cost scenarios: (1) Low-cost scenario (C0 = $10/m2). This scenario refers to a CDT that adopted basic 3D model integration with limited sensor deployment. (2) High-cost scenario (C0 = $20/m2). This scenario represents integrating more sensors, IoT monitoring, and simulation capabilities. (3) Higher-cost scenario (C0 = $25/m2). This scenario represents a fully functional CDT integrating real-time simulation and prediction, as well as indoor and outdoor modeling.
Sensitivity of FAR. For the baseline model, FAR values were set to 1.0, 0.5, and 0.3 for campuses in large cities; midsize and small cities; and suburbs, towns, and rural areas. Due to uncertainty across locations, a uniform 20% increase and decrease were applied simultaneously to all three FAR values, resulting in two additional scenarios: a high-density scenario (FAR = 1.2/0.6/0.36) and a low-density scenario (FAR = 0.8/0.4/0.24). The high-density scenario is particularly important for suburban and rural campuses, where sprawling spatial extent and outdoor assets such as landscapes, underground utilities, and road networks may lead to additional data acquisition costs and potential cost underestimation.

4. Results

4.1. Overall Results Analysis

Based on the measurement methods described above, the CDT affordability index results are summarized in Table 3. We categorized the affordability of CDT into four groups. If the affordability index value A exceeds or equals 100, the campus is classified as unaffordable. For campuses with an A value less than 100, we applied the Jenks natural breaks method to further divide affordability into three categories: high affordability (0 < A ≤ 21.74), moderate affordability (21.74 < A ≤ 53.06), and low affordability (53.06 < A < 100). Based on this classification, 792 campuses are classified as high affordability, accounting for 42.31% of the total sample, and 615 campuses are classified as moderate affordability, representing 32.85% of the total. Campuses with high and moderate affordability collectively account for 75.16%. This suggests that, under the baseline assumptions, most campuses are relatively affordable for CDT implementation. In contrast, campuses with low affordability and unaffordable campuses collectively account for 24.84%. This indicates that many campuses still face challenges in affording the cost of CDT implementation.
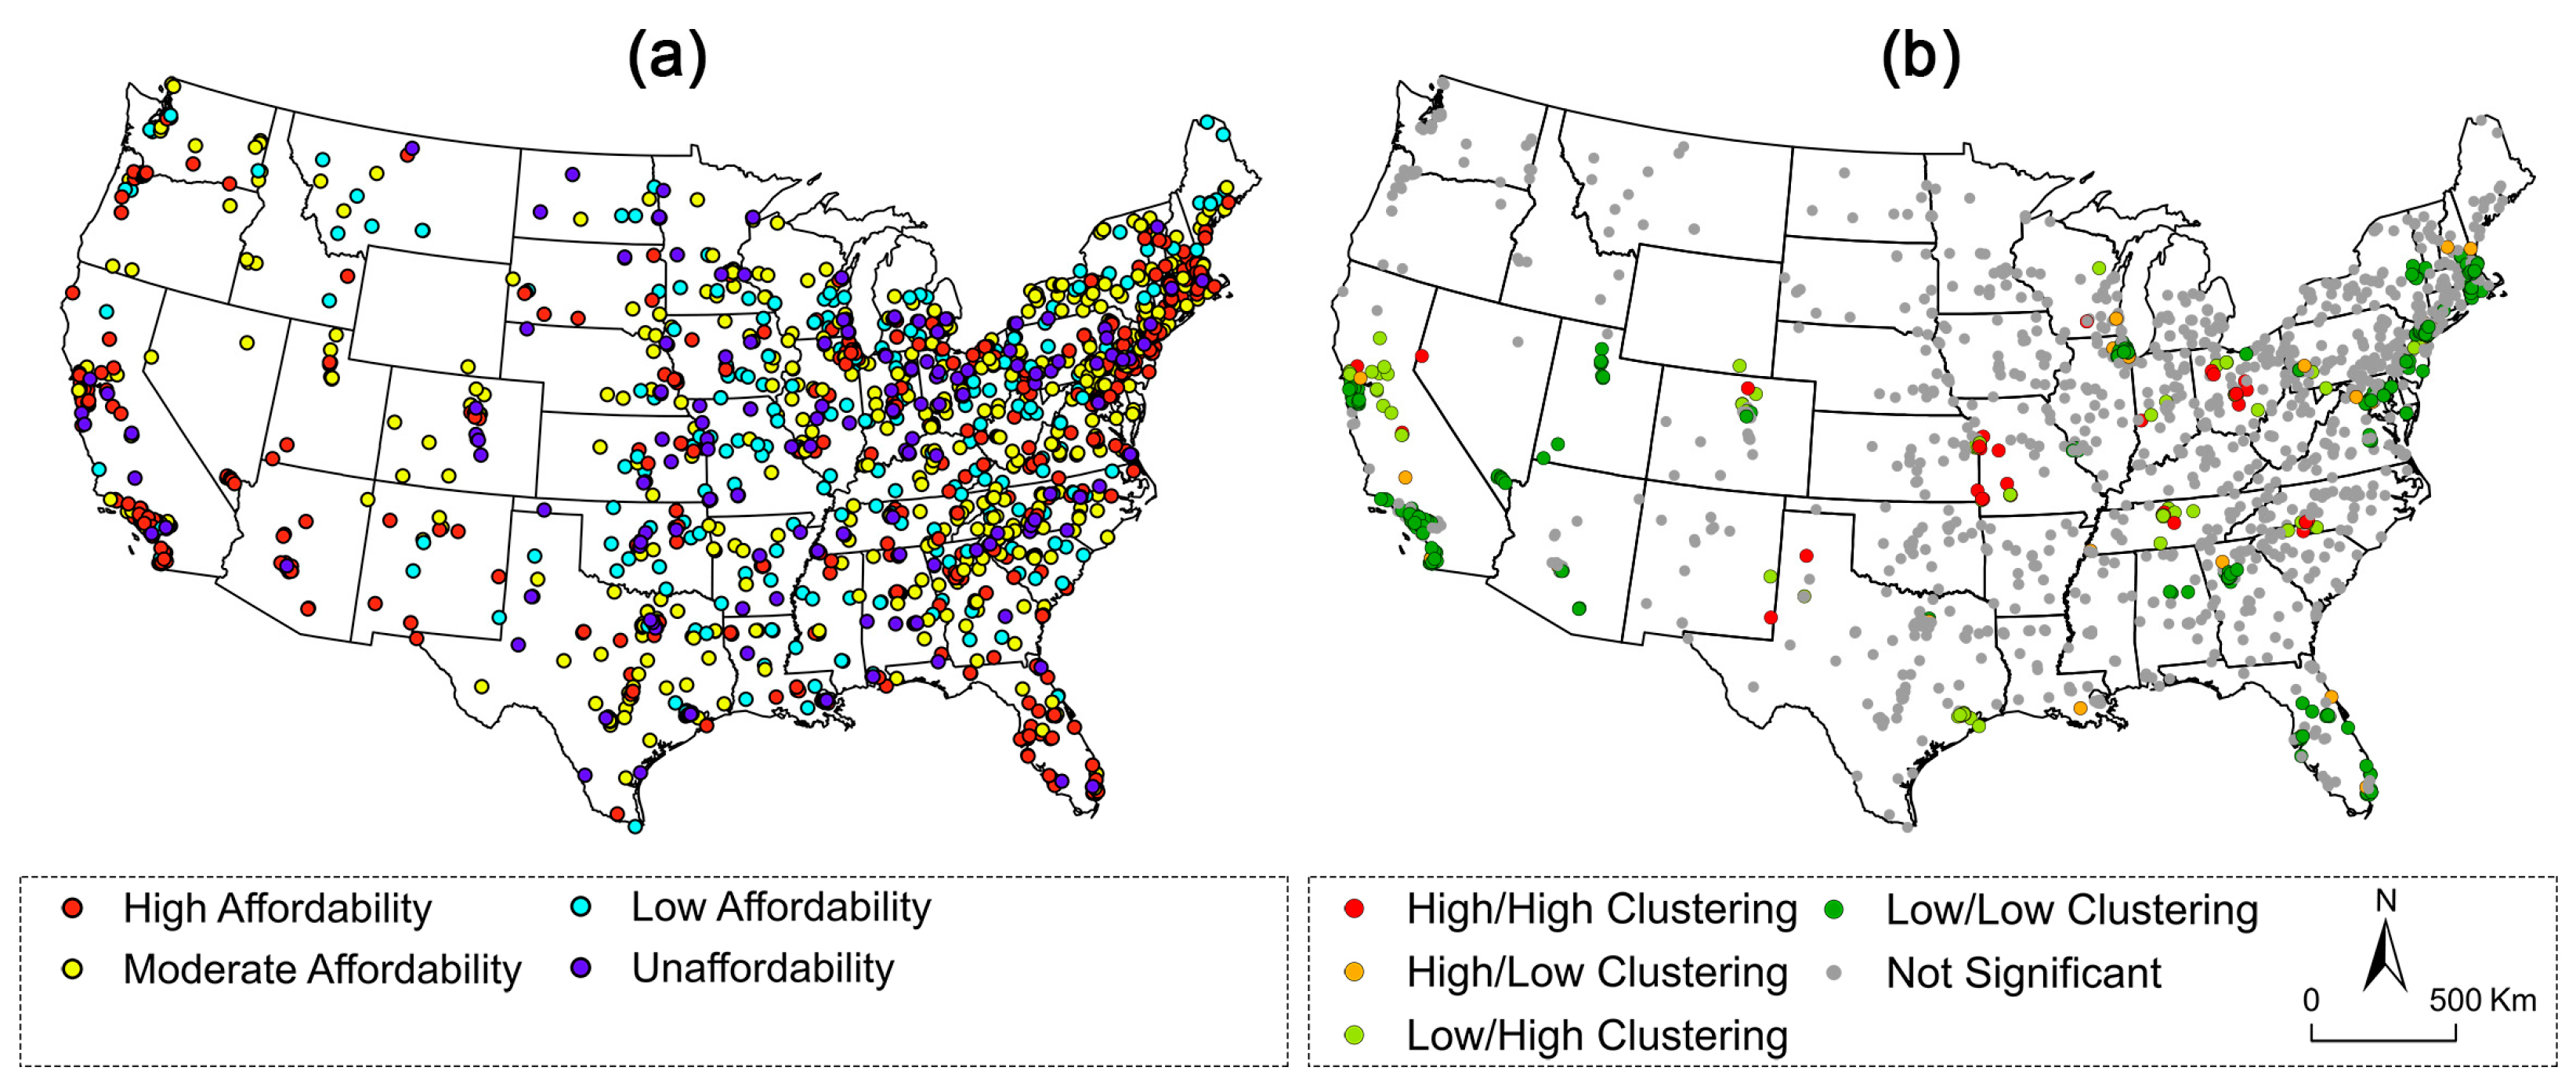
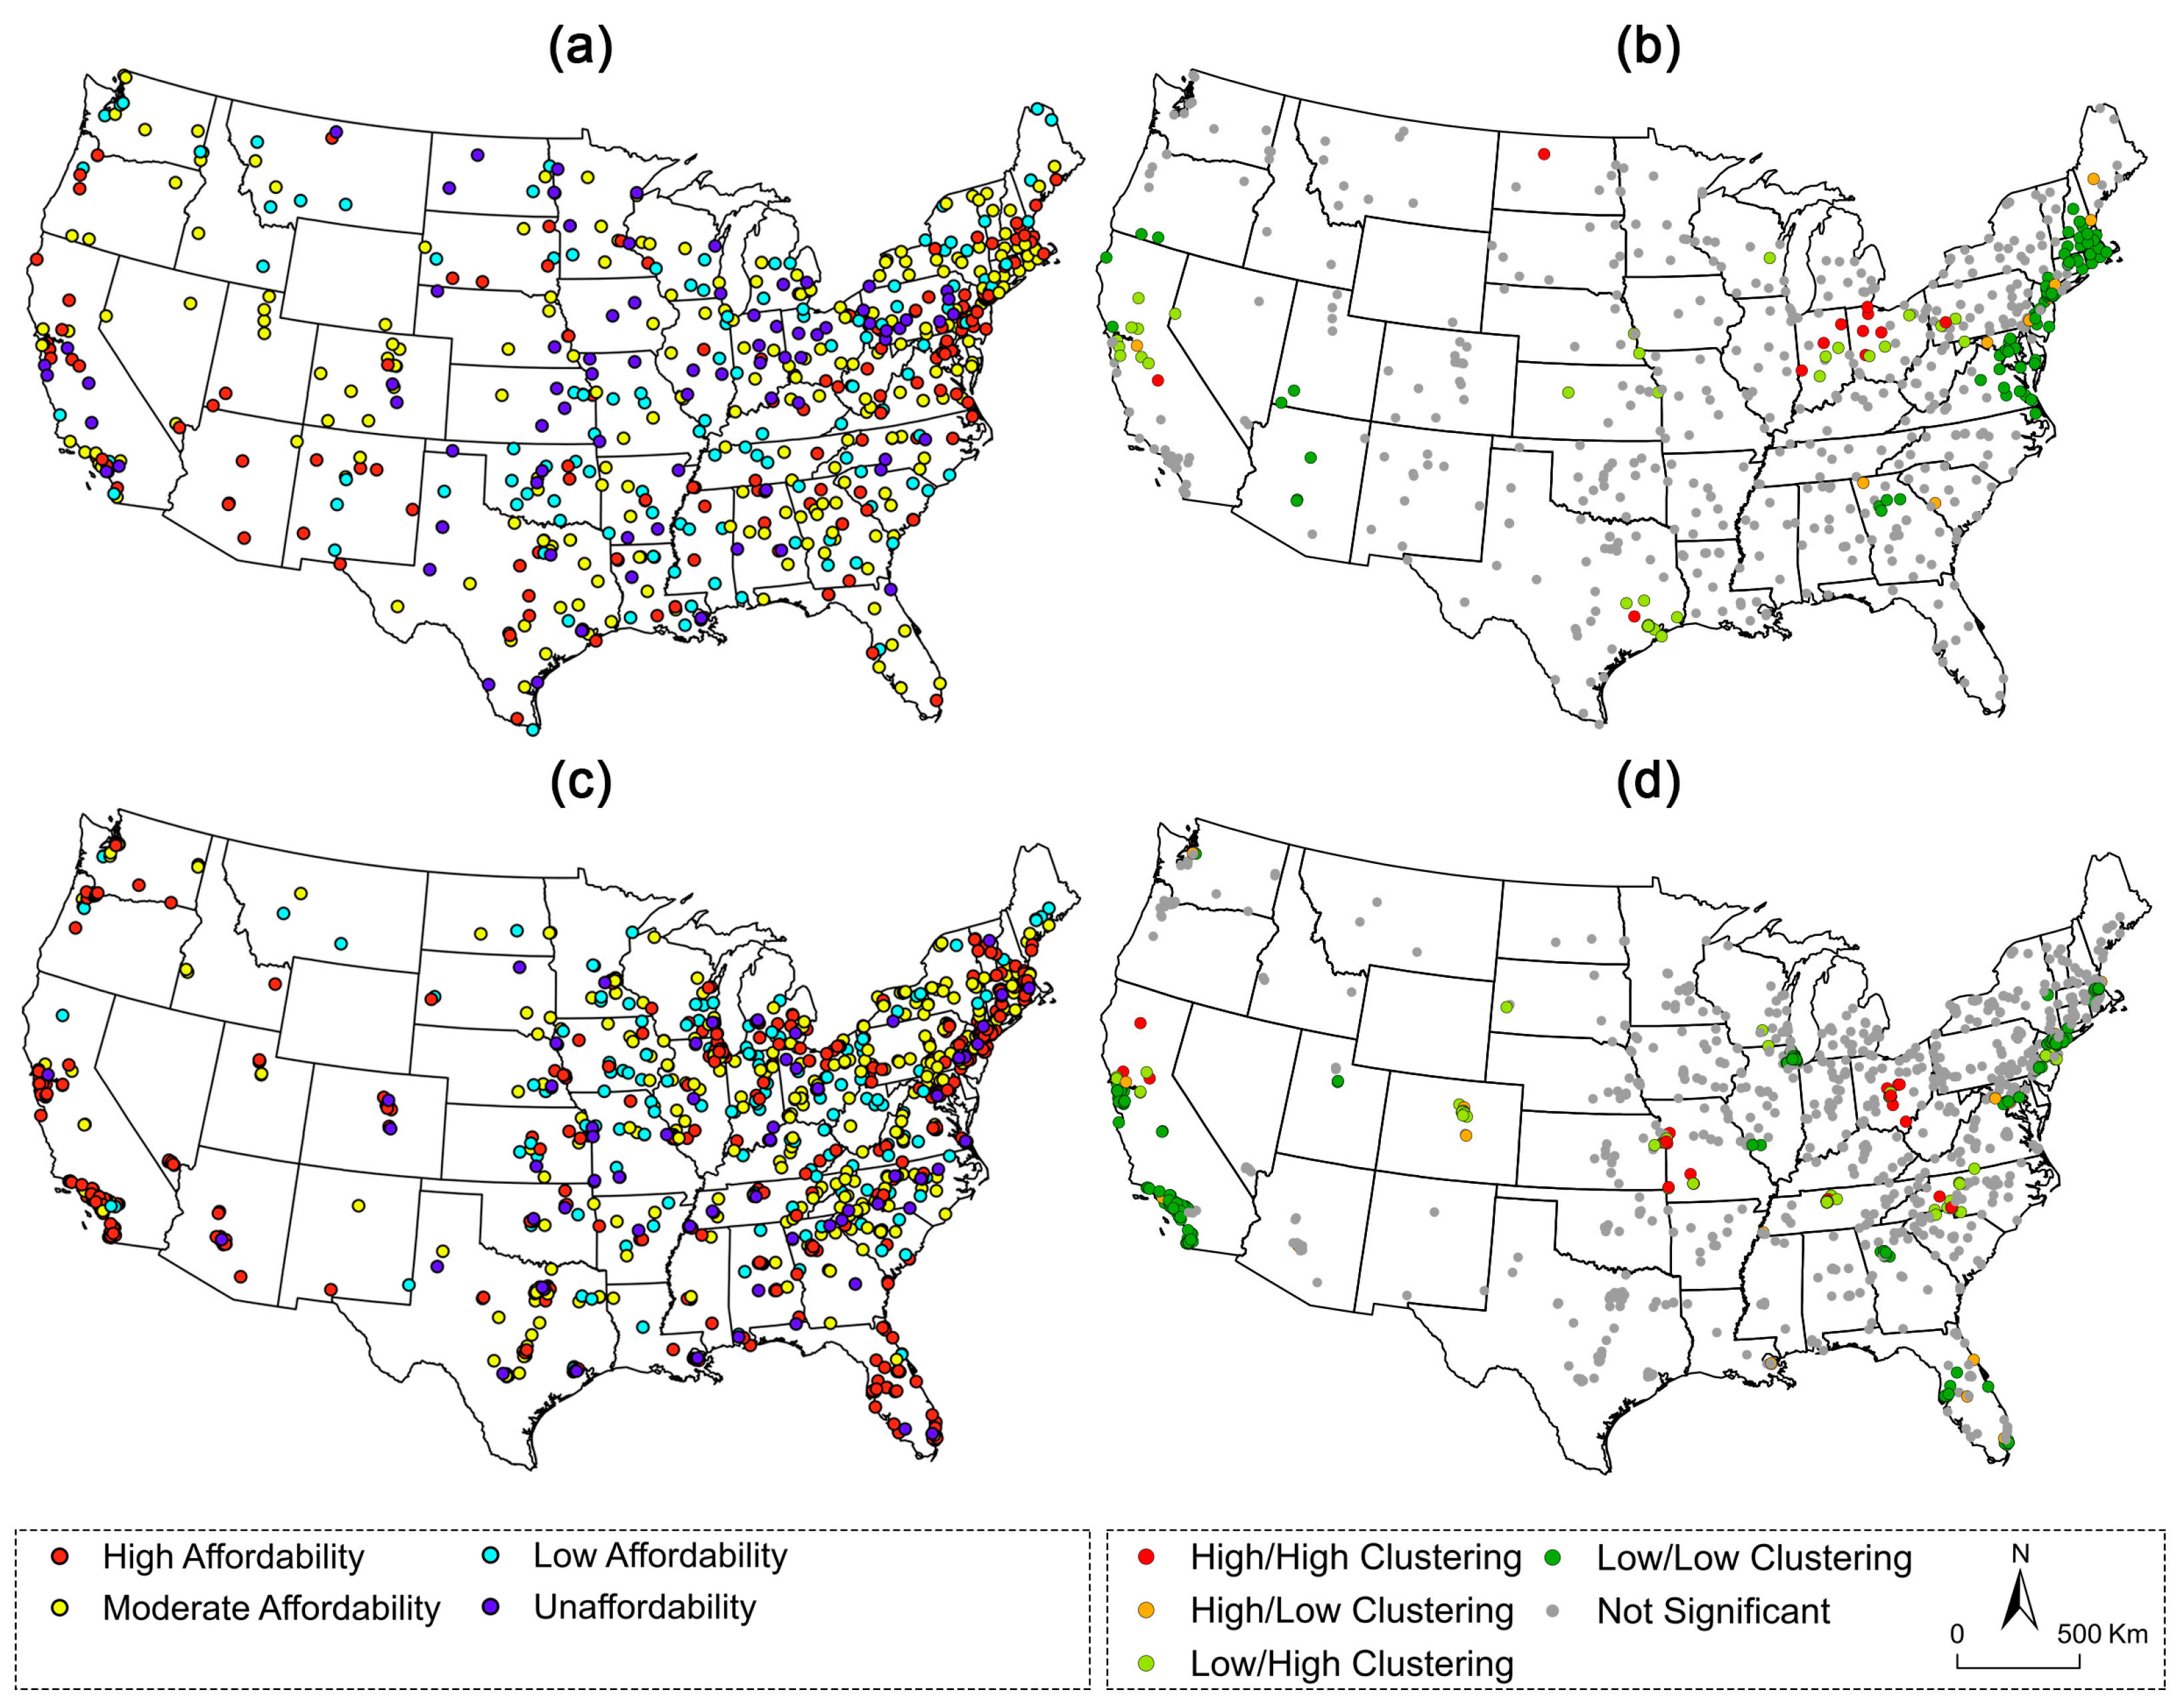
In addition, the measurement results were visualized using ArcGIS Pro 3.1. As shown in Figure 4a, campuses with high and moderate affordability tend to be in coastal and major urban areas, such as Los Angeles on the southwestern coast and highly inland urbanized areas like Atlanta and Dallas. In contrast, campuses with low affordability and unaffordability are primarily scattered across the central Great Plains, including South Dakota, Nebraska, and the Great Lakes region, in states such as Minnesota, Wisconsin, Michigan, Illinois, and Indiana. Many of these campuses are also found in smaller cities or towns, such as Wooster, Lima, and Marion in Ohio.
To investigate the spatial clustering characteristics of the overall campus sample, we first applied the Global Spatial Autocorrelation Tool in ArcGIS Pro 3.1. The Moran’s I value for the overall campus sample was 0.007, with a Z-score of 0.919 and a p-value of 0.358, indicating no significant global spatial autocorrelation. To further explore local-level patterns, we employed the Clustering and Outlier Analysis to assess the local clustering characteristics of the affordability index and visualize the results in Figure 4b.
The local analysis reveals pronounced clustering within several specific regions. High-affordability campuses, along with Low/Low clusters, are primarily concentrated in two regions: (1) the West Coast cluster centered on Los Angeles and San Francisco in California, and (2) the Northeastern belt extending from Boston, Massachusetts, through Connecticut, Rhode Island, New York City, Trenton (New Jersey), Philadelphia (Pennsylvania), Baltimore (Maryland), and Washington, D.C. In contrast, low-affordability campuses, together with High/High clusters, are concentrated in the Central cluster region, particularly around Kansas City.
These regional patterns broadly correspond to variations in economic and educational development across states. For example, California and the Northeastern states possess stronger economic foundations and richer educational resources compared to Central states such as Kansas and Missouri, and these differences are also reflected in their relative affordability for CDT implementation.

4.2. Results Analysis by Institutional Control

To assess differences in CDT affordability between public and private campuses, institutions were classified into three groups based on control type: Public, Private Not-for-Profit, and Private For-Profit. Based on the previously discussed affordability index results, the number and proportion of institutions in each category were calculated and summarized in a quantitative statistical table (Table 4).
The results show that 166 of 604 public campuses are highly affordable, accounting for 27.48%. Among the 1117 private not-for-profit campuses, 44.94% are highly affordable, while those with low affordability or unaffordability collectively account for 22.02%. Although private for-profit campuses constitute a relatively small sample, 82.12% fall within the high affordability category. These findings suggest that under our exploratory affordability framework, private institutions have relatively greater affordability for CDT implementation than public institutions, with private for-profit campuses exhibiting greater affordability than private not-for-profit campuses.
Furthermore, using ArcGIS Pro 3.1, we analyzed the spatial characteristics of public and private campuses, with the results visualized in Figure 5a,c. The results show that both public and private campuses with high and moderate affordability are predominantly located along the eastern and western coastal regions. However, the distribution of public campuses is more dispersed, with most states hosting public institutions that maintain high or moderate affordability. In contrast, private campuses are more spatially concentrated, primarily clustered in the Great Lakes region and along the Atlantic Coastal Plain, with relatively few institutions located in the central Great Plains.
Applying the Global Spatial Autocorrelation Tool to public and private campuses yielded Moran’s I values of 0.002 and 0.003, with corresponding Z-scores of 0.241 and 0.608 and p-values of 0.809 and 0.543, respectively, indicating no significant global spatial autocorrelation for either category. To further explore local spatial characteristics, we employed the Clustering and Outlier Analysis tools. Figure 5b,d illustrate that, for high-affordability areas (Low/Low Clustering), public and private campuses are both primarily concentrated in the Northeastern Belt cluster (e.g., Boston and New York City), whereas private campuses extend into the West Coast cluster (e.g., Los Angeles). For low affordability areas (High/High Clustering), public campuses are primarily distributed around the northern cluster near Lake Erie, while private campus clusters additionally extend into the Central cluster region such as Kansas and Missouri.

4.3. Results Analysis by State

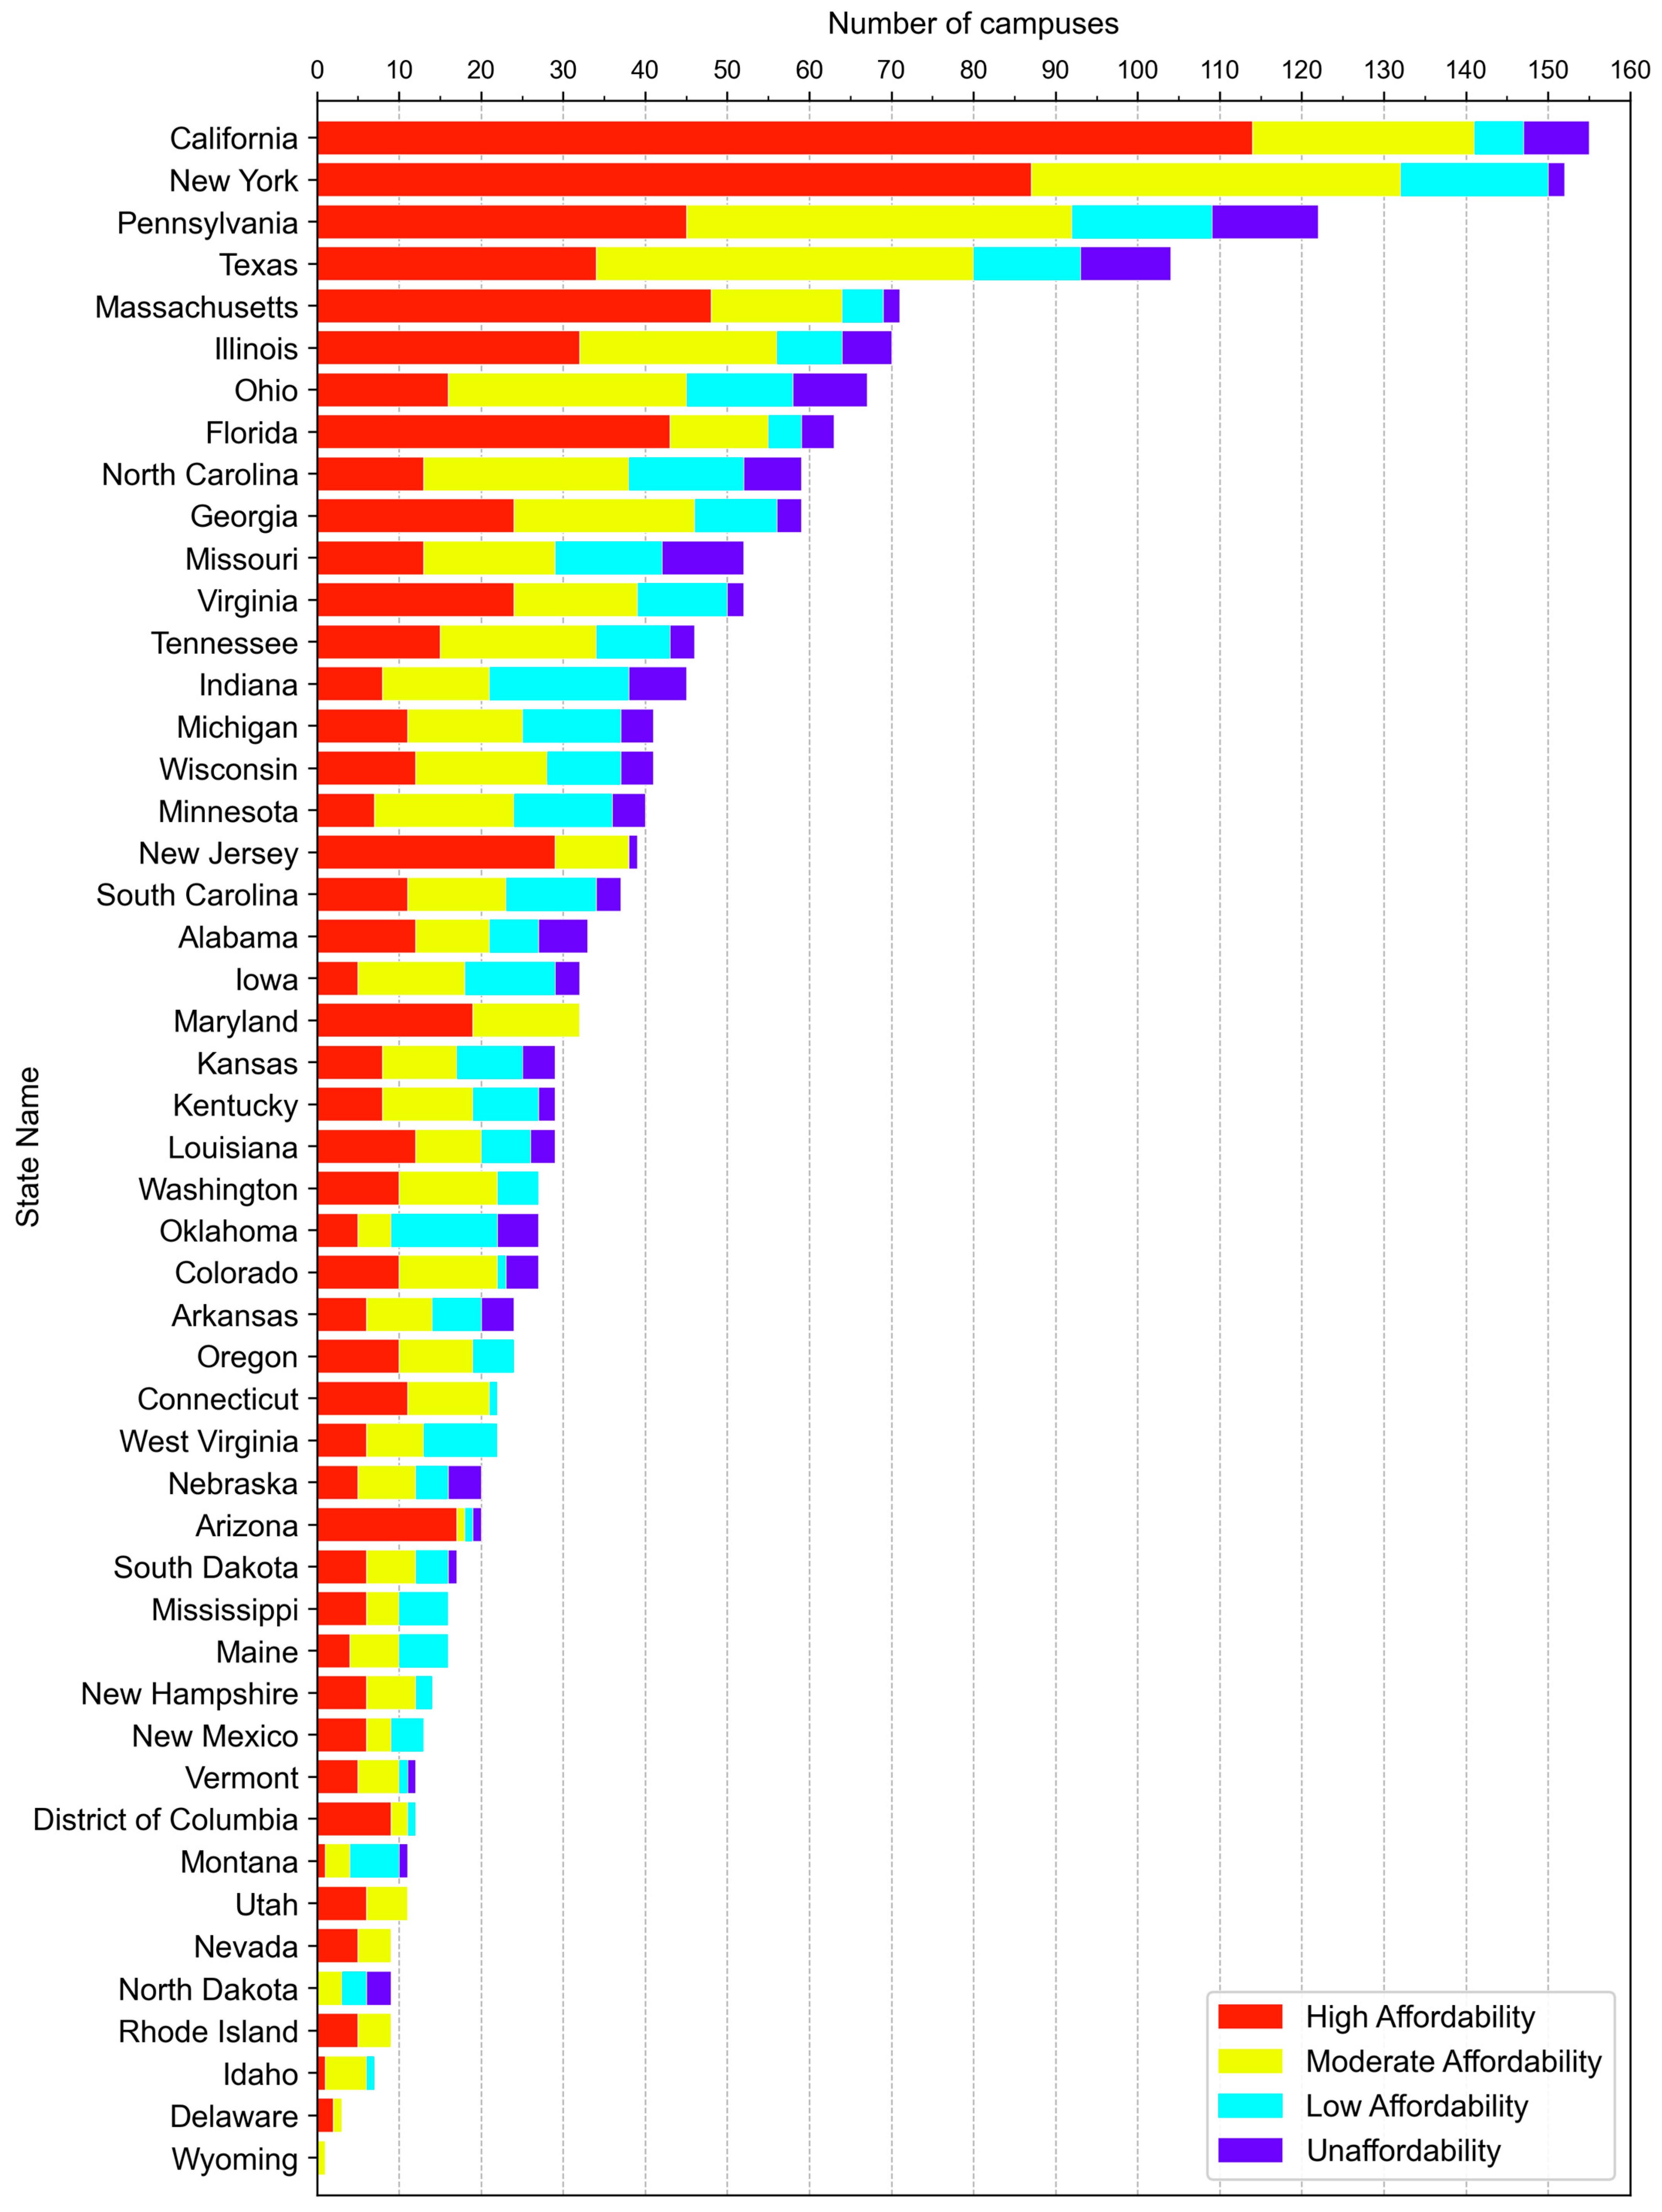
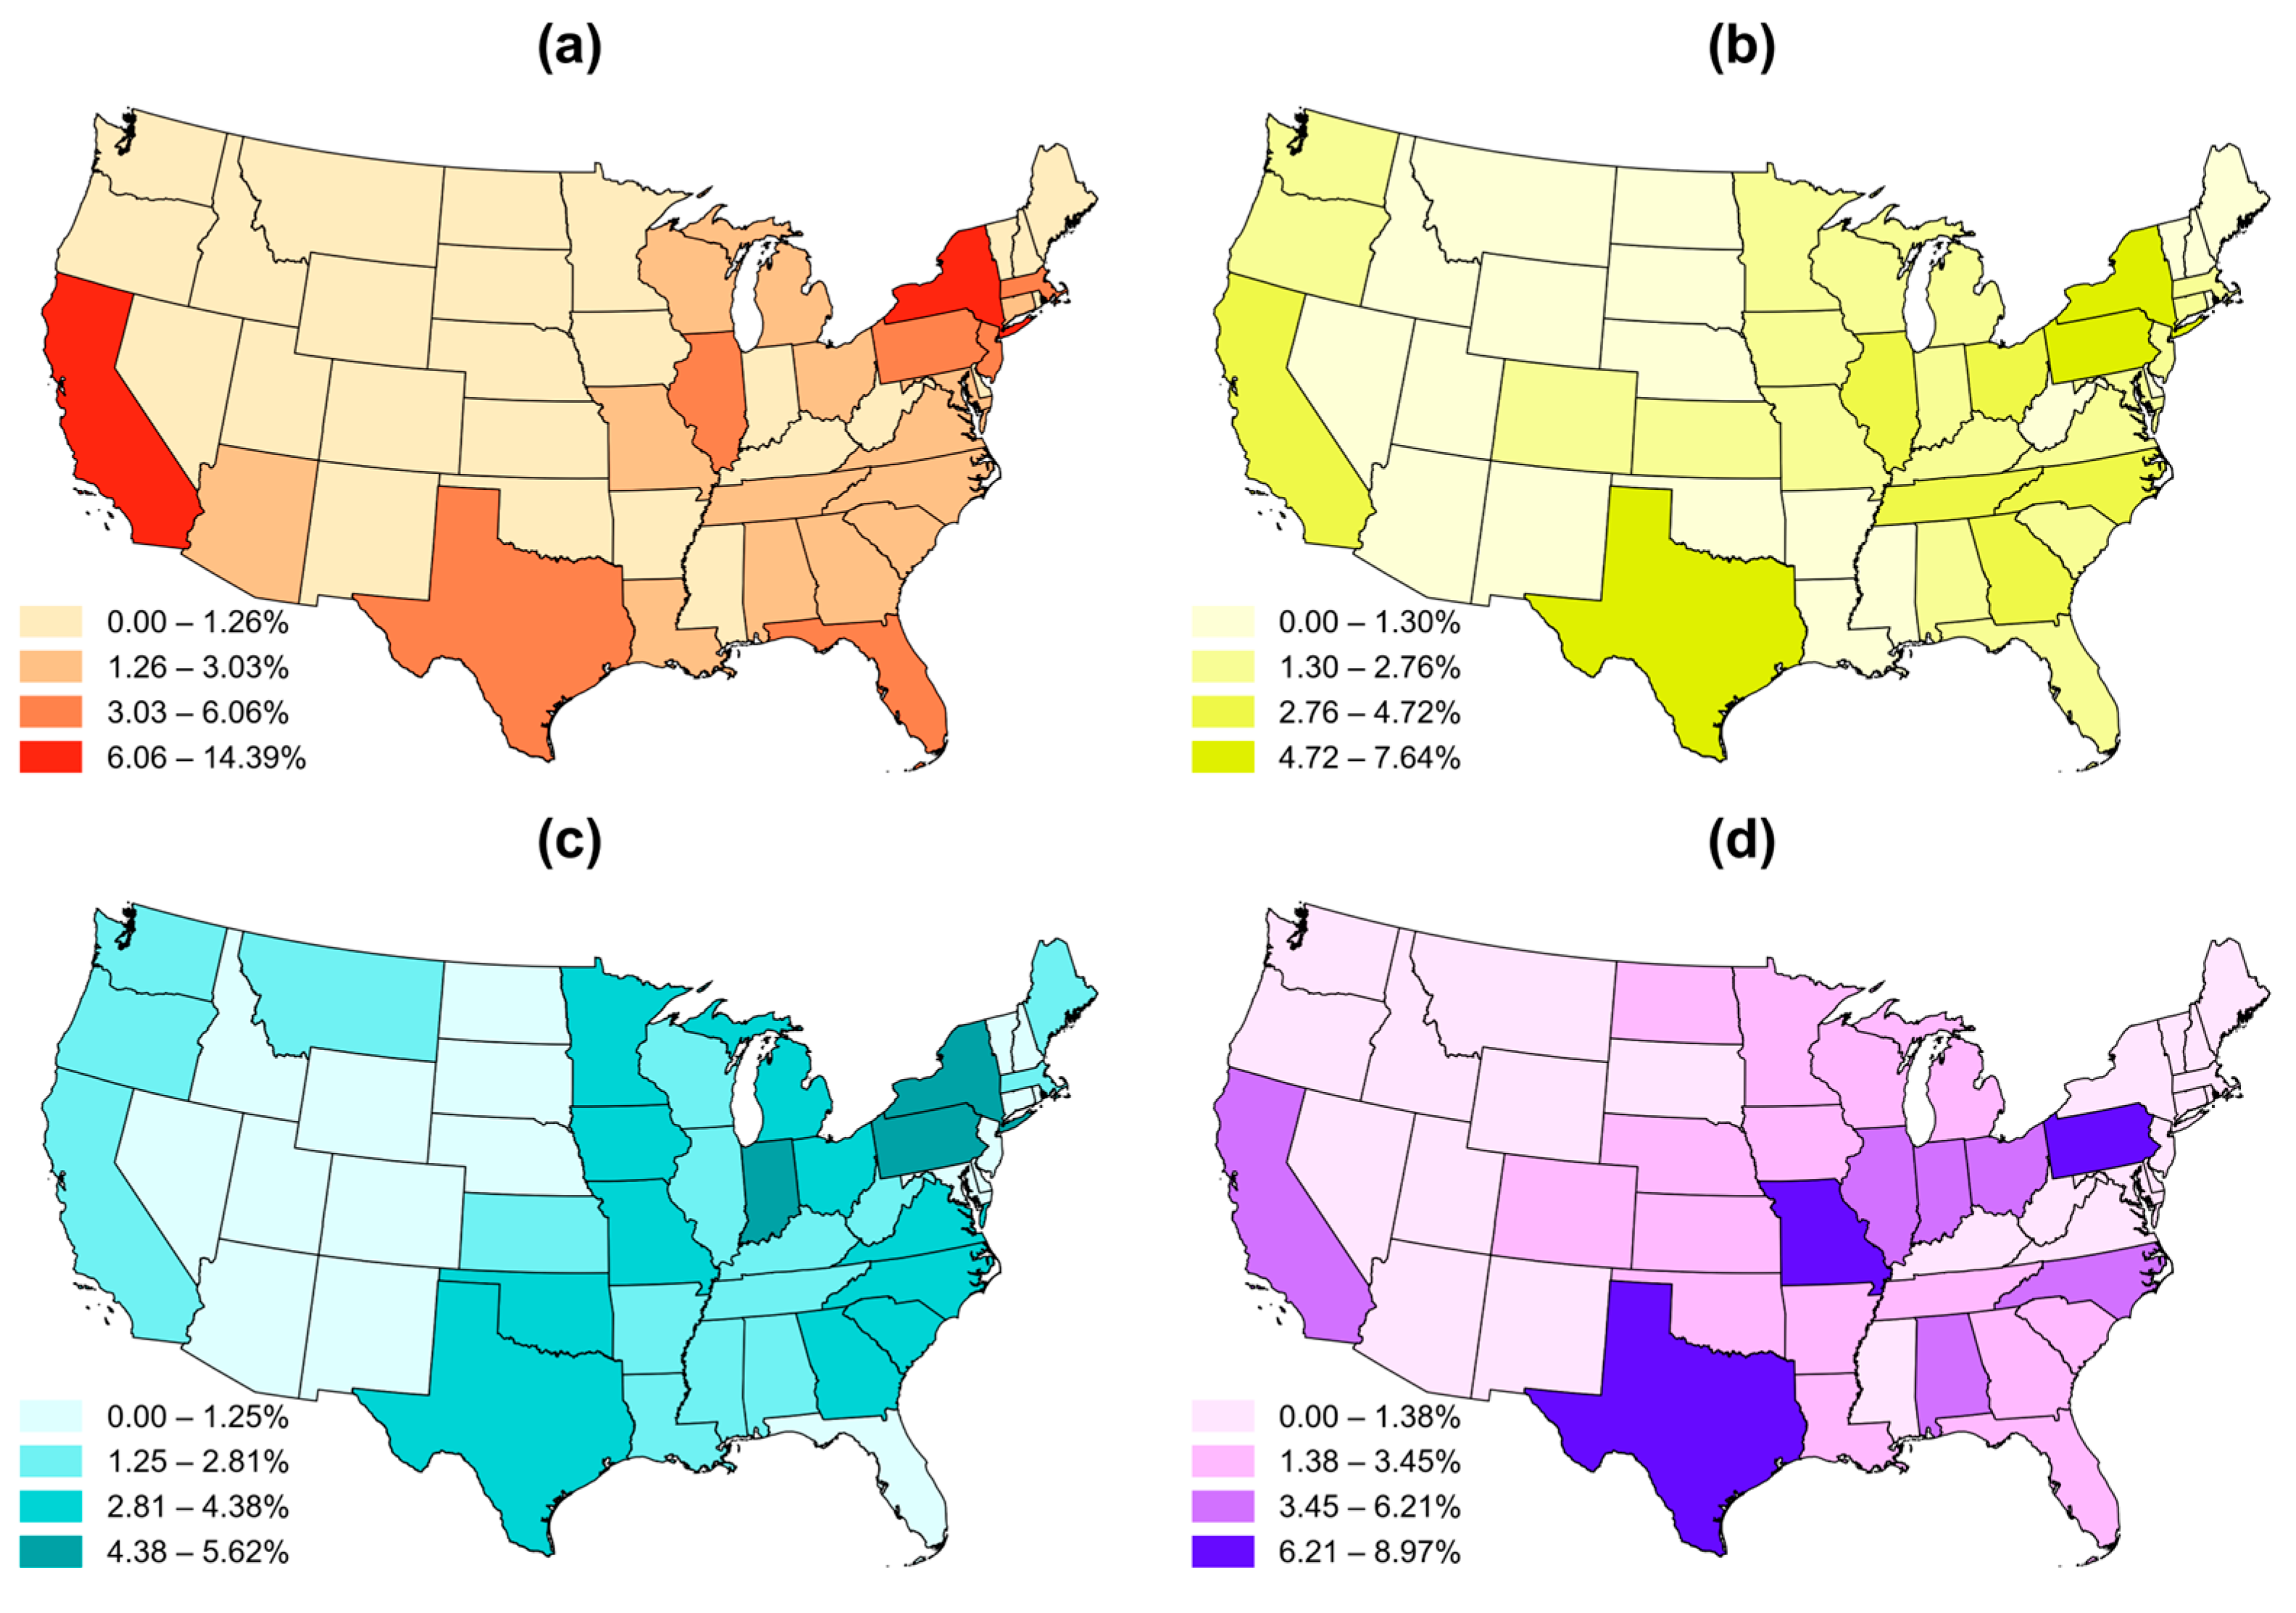
To analyze the quantitative and spatial characteristics of campuses with different affordability categories across different states, we counted the number of campuses in each state and visualized the measurement results and spatial distribution patterns at the state level (Figure 6 and Figure 7).
Figure 6 reveals significant differences in the number of campuses with varying affordability levels across states. The five states with the largest numbers of campuses are California (155), New York (152), Pennsylvania (122), Texas (104), and Massachusetts (71). The number and proportion of campuses with high affordability in these states are as follows: California (114, 73.55%), New York (87, 57.24%), Pennsylvania (45, 36.89%), Texas (34, 32.69%), and Massachusetts (48, 67.61%). Notably, California leads the other states in the number and proportion of campuses with high affordability, suggesting that its higher education institutions possess greater financial capacity for CDT implementation. This can be attributed to California’s robust economic and educational infrastructure.
In contrast, although Pennsylvania has many campuses, the proportion of campuses with high affordability is only 36.89%. This indicates that if CDT were implemented, most campuses in Pennsylvania might face challenges in affording the associated costs. Additionally, states in which more than 70% of campuses are classified as highly affordable include New Jersey (74.36%), the District of Columbia (75.00%), and Arizona (85.00%). Conversely, the states with the highest proportions of campuses with low affordability or unaffordability are North Dakota (66.67%), Oklahoma (66.67%), Montana (63.64%), Indiana (53.33%), Missouri (44.23%), and Iowa (43.75%). These states may face economic constraints that limit their capacity to afford CDT implementation.
Figure 7 shows that the spatial distribution of campuses by affordability type varies considerably across U.S. states. Campuses with high affordability are largely concentrated in California in the West, New York and Pennsylvania in the Northeast, Florida in the Southeast, Illinois in the Midwest, and Texas in the South. In contrast, campuses with low affordability or unaffordability are more dispersed, appearing across Texas in the South, Kansas, Missouri, Ohio, Indiana, and Illinois in the Midwest.

4.4. Sensitivity Analysis

Drawing on the parameter values of C0 and FAR across baseline and sensitivity scenarios, we evaluated whether the findings are sensitive to parameter assumptions at three levels: overall results, results by institutional control, and results by state. To ensure comparability and consistency, the same affordability classification thresholds used in the baseline model were applied across all sensitivity scenarios. Additionally, we tracked the number and proportion of campuses classified as high affordability in the sensitivity analyses by institutional control and state.

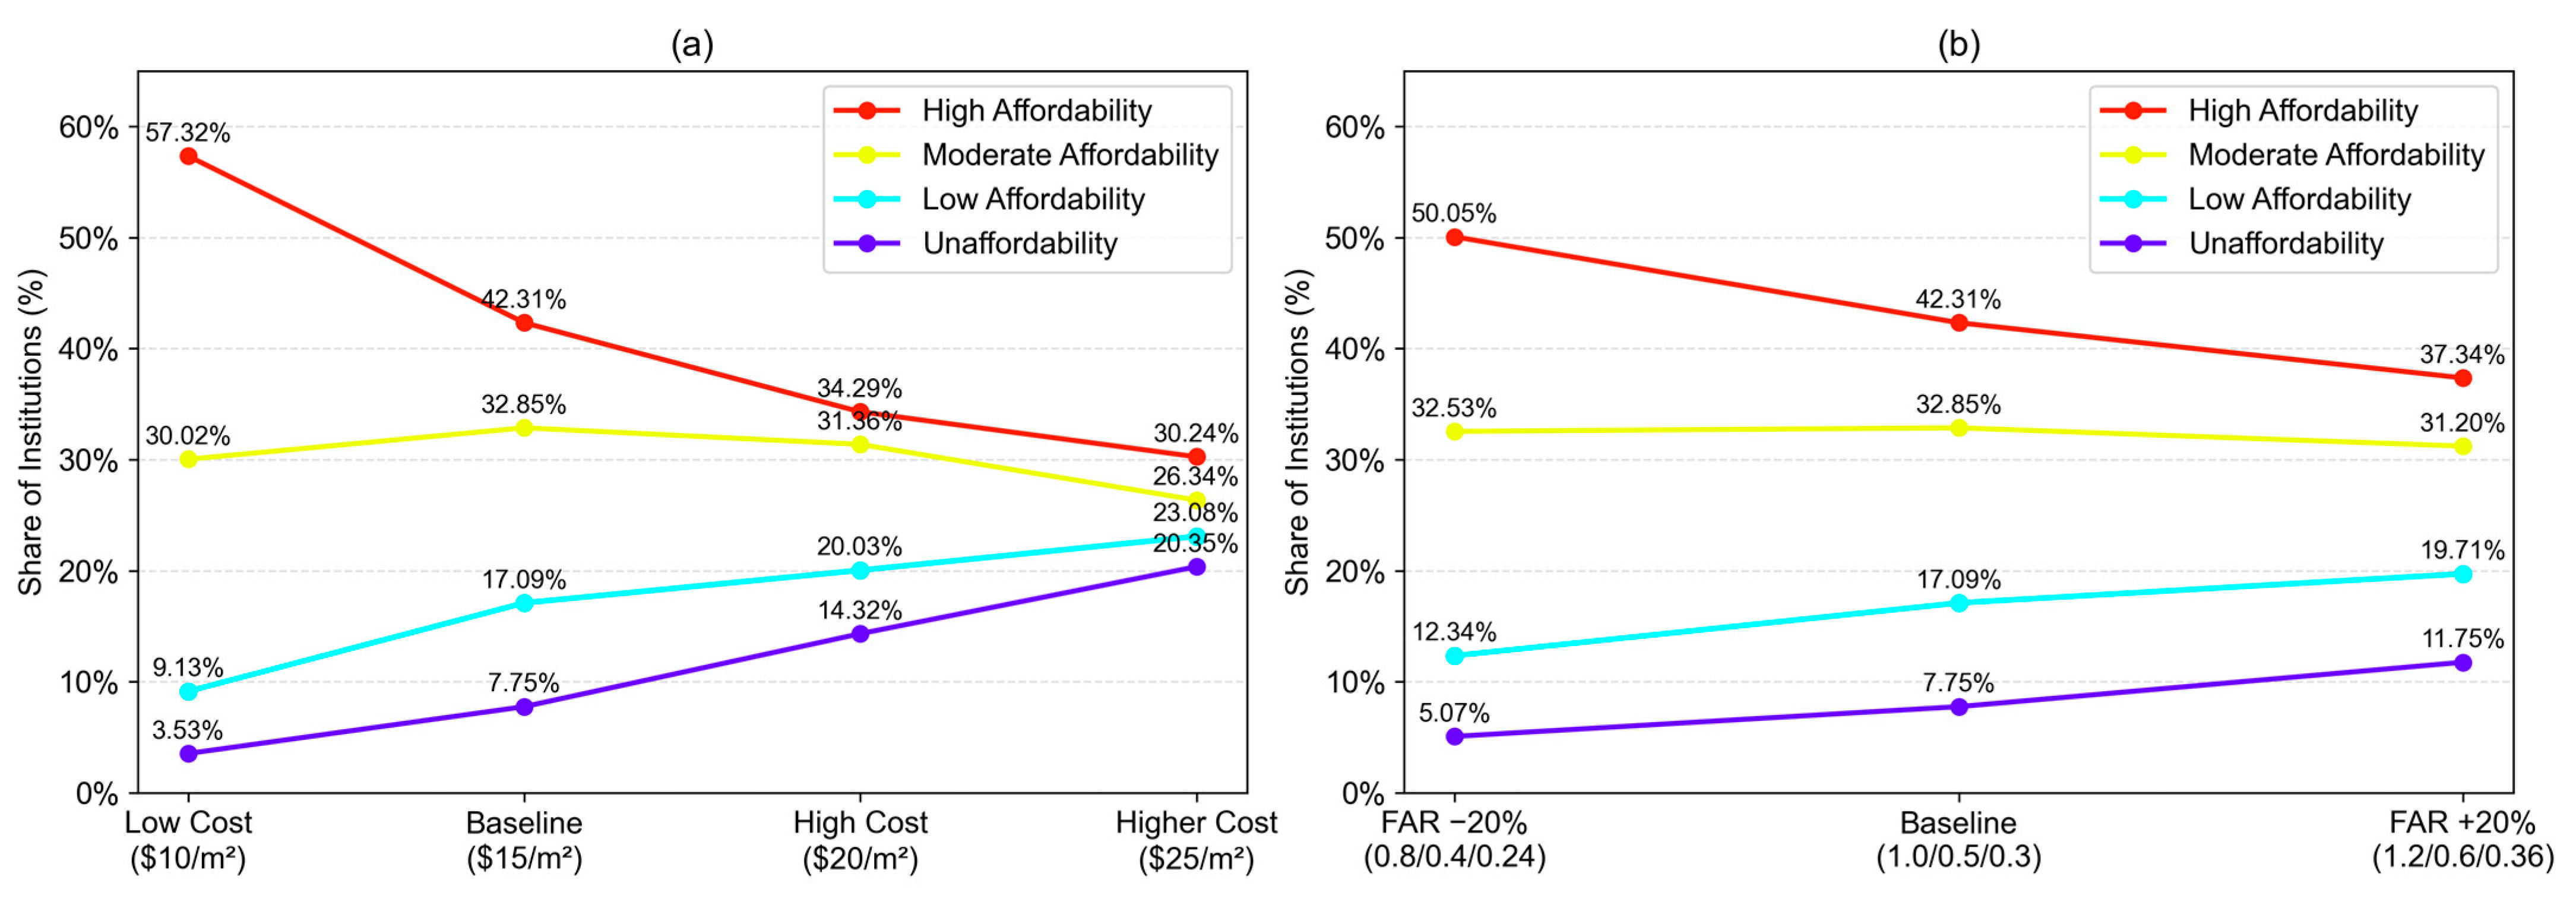
4.4.1. Sensitivity Analysis for Overall Results

Figure 8 presents the proportions of the four affordability categories of institutions across baseline and sensitivity scenarios. In terms of sensitivity to C0 (Figure 8a), the share of institutions with high affordability gradually decreases from 57.32% to 30.24%, while the share classified as unaffordable increases from 3.53% to 20.35% as C0 increases from $10/m2 to $25/m2. However, when high and moderate categories are combined, the share remains substantial at 56.58% even under the higher-cost scenario (C0 = $25/m2). Similarly, for the sensitivity to FAR in Figure 8b, increasing FAR by 20% decreases the share of institutions with high affordability to 37.34%, whereas reducing FAR by 20% increases the share to 50.05%. Although changes in C0 and FAR shift the distribution of institutions, the overall rank ordering remains unchanged. This supports the finding that most campuses can afford to implement digital twins under various cost scenarios.

4.4.2. Sensitivity Analysis for Results by Institutional Control

Table 5 presents the number and within-group proportion of public and private institutions with high affordability across baseline and sensitivity scenarios. When we set C0 to $10/m2, the shares of campuses with high affordability are 86.09%, 60.79%, and 43.71% for private for-profit, private not-for-profit, and public institutions, respectively. With C0 increasing to $25/m2, these proportions decline to 78.15%, 32.23%, and 14.57%. In addition, a 20% increase in FAR decreases the high affordability shares to 80.13%, 39.75%, and 22.19%, while a decrease in FAR increases the shares to 83.44%, 53.63%, and 35.10% for private for-profit, private not-for-profit, and public institutions, respectively. The differential sensitivity across institutional types indicates that public campuses are more sensitive to C0 and FAR than private campuses. Moreover, high affordability shares in private campuses, especially for-profit ones, are consistently higher than those in public campuses, supporting our earlier observation that private institutions, particularly for-profit ones, are relatively more affordable than public institutions.

4.4.3. Sensitivity Analysis for Results by State

Table 6 shows the number and within-group proportions of institutions with high affordability across baseline and sensitivity scenarios in the top five states with the largest numbers of campuses. With C0 increasing from $10/m2 to $25/m2, the high-affordability shares in all states decline. Among the five states examined, California and Massachusetts show greater robustness, with high-affordability shares decreasing from 80.00% to 62.58% and from 80.28% to 52.11%, respectively. In contrast, Pennsylvania and Texas show higher sensitivity, with high-affordability shares declining to 24.59% and 23.08%, respectively. The sensitivity results for FAR also show a similar pattern. A 20% increase in FAR leads to moderate declines in high-affordability shares in California and Massachusetts, to 68.39% and 63.38%, respectively. However, regardless of how C0 and FAR vary, California’s high affordability numbers and shares remain the highest among these states. These results are consistent with the strong educational and economic resources of California and Massachusetts and show greater capacity for CDT implementation.

5. Conclusions and Discussion

This study introduced an initial exploratory scenario-based Campus Digital Twin Affordability Index to systematically evaluate the financial feasibility of CDT adoption across U.S. higher education institutions. By integrating multi-source datasets with spatial and sensitivity analyses, we identified key affordability patterns across institutional types and geographic regions. Three findings stand out: (1) Under the baseline scenario, most campuses show moderate-to-high affordability with spatial clusters concentrated in coastal and metropolitan regions, while nearly one-quarter remain unaffordable or marginally affordable, with clusters located in the Midwest. (2) Private institutions, particularly for-profit campuses, tend to be relatively more affordable than public institutions, reflecting structural differences in campus footprints, financing, and governance. (3) States with stronger economic and educational infrastructures, such as California, show greater capacity for CDT adoption, whereas resource-constrained states face significant affordability challenges. These findings remain generally robust and consistent across the baseline and sensitivity scenarios.
Beyond these empirical insights, the study advances the conceptual understanding of why digital twins matter in campus contexts. Unlike city-scale digital twins, which primarily support urban planning and infrastructure management, CDT operates at a distinct scale in which universities function as micro-urban environments. Campuses integrate diverse facilities, complex mobility systems, and large populations, all of which create increasing needs for space efficiency, sustainability, safety, and data-informed decision-making. In this sense, CDT is not simply a technical add-on but a strategic enabler of institutional resilience and innovation, supporting operational optimization, enhancing student and faculty experience, and providing testbeds for advancing digital transformation research. Positioning campuses as both beneficiaries and laboratories for digital twin technologies further underscores their conceptual relevance in higher education.
At the same time, affordability remains an important constraint. Although our index provides an initial exploratory framework for benchmarking relative affordability, real-world deployment involves uncertainties in cost estimation, interoperability challenges, and evolving computational demands. This highlights the need for policy guidance and standardized cost models to reduce uncertainty and support evidence-based decision-making. National and regional strategies could help address spatial and institutional disparities in CDT affordability, potentially supporting more equitable patterns of smart campus development.
More importantly, the benefits of CDT should also be considered in practice, whereas this study primarily focuses on the cost dimension. Over the long term, CDT adoption may reduce operational costs by improving energy efficiency and space utilization, with these positive effects likely to increase over time. Campus decision-makers should further evaluate the return on investment (ROI) associated with CDT implementation. In this sense, the CDT Affordability Index proposed in this study should be understood as a measure of initial exploratory financial feasibility rather than an economic analysis. Therefore, a comprehensive economic assessment should be conducted for each future specific CDT implementation case.
This study also has several limitations. First, the analysis focuses on affordability outcomes within a standardized analytical framework and does not explicitly distinguish among different CDT configurations, LOD complexity, and campus academic and operational characteristics. DT systems span a broad continuum, ranging from basic spatial data integration to advanced real-time simulation; however, capturing this full range is beyond the scope of a national-scale comparative assessment. Second, the affordability index estimated in this study may introduce certain biases as a trade-off for achieving large-scale measurement. For example, institutional support budget data are used as a proxy for institutional capacity, which may underestimate affordability for wealthier institutions with substantial endowments but relatively smaller operating budgets. In addition, floor area ratio (FAR) estimation may also result in bias to some extent. Although using building footprint data from OpenStreetMap may provide a better approach for estimating campus floor area, this remains constrained by limitations in data coverage and completeness, particularly regarding building-level attributes and data completeness in rural areas.
Third, the analysis focuses on affordability outcomes without systematically examining the underlying drivers of affordability, such as governance structures, funding models, existing digital infrastructure, staffing capacity, technology adoption, or long-term operational strategies. In addition, smaller or atypical institutions are underrepresented to maintain national comparability. Finally, because no fully operational and deployed CDT project has publicly reported detailed cost components to date, it remains difficult to validate the proposed cost model using external existing CDT cases to further support the findings, in addition to using sensitivity analysis. Future research should address these limitations by developing explanatory models of CDT affordability, incorporating more advanced data sources, assessing institutional readiness, exploring region-specific strategies, and establishing public CDT cost databases to improve cost-effectiveness and promote equitable CDT adoption. The proposed index should also be validated against real-world CDT deployments and investment records as such data become available.
Finally, based on these exploratory findings, we suggest several preliminary directions for multi-stakeholder collaboration to advance a nationwide and equitable CDT ecosystem. Policymakers could establish clear standards and funding mechanisms; institutional leaders could integrate CDT into digital transformation agendas; and industry-academic partnerships could pursue cost-effective and interoperable solutions. Such coordinated action could help campuses better realize the conceptual and practical potential of digital twins, supporting the transformation of higher education into a more sustainable, efficient, and inclusive environment.

Author Contributions

Y.W.: Data curation, Formal analysis, Investigation, Software, Visualization, Writing—original draft, Writing—review & editing. X.Y.: Conceptualization, Funding acquisition, Methodology, Project administration, Resources, Supervision, Validation, Writing—original draft, Writing—review & editing. S.W.: Validation, Writing—review & editing. D.J.: Validation, Writing—review & editing. All authors have read and agreed to the published version of the manuscript.

Funding

This research was funded by the National Science Foundation under grants 2401860, 2430700, and 2526487; NASA under grant 80NSSC22KM0052; and Texas A&M University.

Data Availability Statement

The data presented in this study were derived from the following resources available in the public domain: institutional attribute data from the Integrated Postsecondary Education Data System (IPEDS), National Center for Education Statistics, reference [49], https://nces.ed.gov/ipeds (accessed on 17 May 2026); campus boundary data from HIFLD OPEN Colleges and Universities Campuses, reference [46], https://www.datalumos.org/datalumos/project/238998/version/V1/view (accessed on 17 May 2026); campus point data from HIFLD OPEN Colleges and Universities, reference [47], https://www.datalumos.org/datalumos/project/238951/version/V1/view (accessed on 17 May 2026); and administrative boundary data from HIFLD OPEN US County Boundaries, reference [48], https://www.datalumos.org/datalumos/project/240942/version/V1/view (accessed on 17 May 2026).

Acknowledgments

Any opinions, findings, and conclusions or recommendations expressed in this material are those of the authors, and the funders had no role in the study design, data collection, analysis, or preparation of this article. During the preparation of this work, the authors used ChatGPT (GPT-4o) for language and grammar checks. After using this tool, the authors reviewed and edited the content as needed and take full responsibility for the content of the published article.

Conflicts of Interest

The authors declare no conflicts of interest.

References

  1. Batty, M. Digital Twins. Environ. Plan. B Urban Anal. City Sci. 2018, 45, 817–820. [Google Scholar] [CrossRef]
  2. Kritzinger, W.; Karner, M.; Traar, G.; Henjes, J.; Sihn, W. Digital Twin in Manufacturing: A Categorical Literature Review and Classification. IFAC-Pap. 2018, 51, 1016–1022. [Google Scholar] [CrossRef]
  3. Jiang, F.; Ma, L.; Broyd, T.; Chen, K. Digital Twin and Its Implementations in the Civil Engineering Sector. Autom. Constr. 2021, 130, 103838. [Google Scholar] [CrossRef]
  4. Feng, H.; Lv, H.; Lv, Z. Resilience Towarded Digital Twins to Improve the Adaptability of Transportation Systems. Transp. Res. Part A Policy Pract. 2023, 173, 103686. [Google Scholar] [CrossRef]
  5. Batty, M. Digital Twins in City Planning. Nat. Comput. Sci. 2024, 4, 192–199. [Google Scholar] [CrossRef] [PubMed]
  6. Schrotter, G.; Hürzeler, C. The Digital Twin of the City of Zurich for Urban Planning. PFG J. Photogramm. Remote Sens. Geoinf. Sci. 2020, 88, 99–112. [Google Scholar] [CrossRef]
  7. Ye, X.; Du, J.; Han, Y.; Newman, G.; Retchless, D.; Zou, L.; Ham, Y.; Cai, Z. Developing Human-Centered Urban Digital Twins for Community Infrastructure Resilience: A Research Agenda. J. Plan. Lit. 2023, 38, 187–199. [Google Scholar] [CrossRef] [PubMed]
  8. Khajavi, S.H.; Motlagh, N.H.; Jaribion, A.; Werner, L.C.; Holmström, J. Digital Twin: Vision, Benefits, Boundaries, and Creation for Buildings. IEEE Access 2019, 7, 147406–147419. [Google Scholar] [CrossRef]
  9. Texas A&M University. 2024 Capacity Study Report. Available online: https://president.tamu.edu/_files/_documents/2024-capacity-report-jan-2025.pdf (accessed on 17 May 2026).
  10. Lei, B.; Su, Y.; Biljecki, F. Humans as Sensors in Urban Digital Twins. In Proceedings of the Recent Advances in 3D Geoinformation Science; Kolbe, T.H., Donaubauer, A., Beil, C., Eds.; Springer Nature: Cham, Switzerland, 2024; pp. 693–706. [Google Scholar]
  11. Ye, X.; Jamonnak, S.; Van Zandt, S.; Newman, G.; Suermann, P. Developing Campus Digital Twin Using Interactive Visual Analytics Approach. Front. Urban Rural Plan. 2024, 2, 9. [Google Scholar] [CrossRef] [PubMed]
  12. Wu, K.; Ye, X.; Jamonnak, S.; Feng, X. Human Mobility Reimagined: Digital Twin Intelligence for Adaptive Campus Course Timetabling. arXiv 2025, arXiv:2503.06109. [Google Scholar]
  13. Gong, W.; Ye, X.; Wu, K.; Jamonnak, S.; Zhang, W.; Yang, Y.; Huang, X. Integrating Spatiotemporal Vision Transformer Into Digital Twins for High-Resolution Heat Stress Forecasting in Campus Environments. J. Plan. Educ. Res. 2025, 0739456X251391121. [Google Scholar] [CrossRef]
  14. Goodchild, M.F.; Connor, D.; Fotheringham, A.S.; Frazier, A.; Kedron, P.; Li, W.; Tong, D. Digital Twins in Urban Informatics. Urban Inf. 2024, 3, 16–24. [Google Scholar] [CrossRef]
  15. Prime, G.W. Virtual Singapore—Building a 3D-Empowered Smart Nation. Available online: https://geospatialworld.net/prime/case-study/national-mapping/virtual-singapore-building-a-3d-empowered-smart-nation/ (accessed on 14 April 2025).
  16. Lu, Q.; Parlikad, A.K.; Woodall, P.; Ranasinghe, G.D.; Xie, X.; Liang, Z.; Konstantinou, E.; Heaton, J.; Schooling, J. Developing a Digital Twin at Building and City Levels: Case Study of West Cambridge Campus. J. Manag. Eng. 2020, 36, 05020004. [Google Scholar] [CrossRef]
  17. Gelernter, D. Mirror Worlds: Or the Day Software Puts the Universe in a Shoebox…How it Will Happen and What it Will Mean; Oxford University Press: Oxford, UK, 1993; ISBN 0-19-534485-5. [Google Scholar]
  18. Grieves, M.; Vickers, J. Digital Twin: Mitigating Unpredictable, Undesirable Emergent Behavior in Complex Systems. In Transdisciplinary Perspectives on Complex Systems: New Findings and Approaches; Kahlen, F.-J., Flumerfelt, S., Alves, A., Eds.; Springer: Cham, Switzerland, 2017; pp. 85–113. ISBN 978-3-319-38756-7. [Google Scholar]
  19. Piascik, R.; Vickers, J.; Lowry, D.; Scotti, S.; Stewart, J.; Calomino, A. Technology Area 12: Materials, Structures, Mechanical Systems, and Manufacturing Road Map; NASA Office of the Chief Technologist: Washington, DC, USA, 2010; pp. 15–88. [Google Scholar]
  20. Teke, İ.; Teke, O.; Kılınç, M. The Future of Smart Campuses: Combining Digital Twin and Green Metrics. Acta Infologica 2023, 7, 384–395. [Google Scholar] [CrossRef]
  21. Singh, A.; Maheshwari, A.; Singh, S. Digital Twin Framework for Leakages Detection in Large-Scale Water Distribution Systems: A Case Study of IIT-Jodhpur Campus. IFAC-Pap. 2024, 57, 280–285. [Google Scholar] [CrossRef]
  22. Azfar, T.; Weidner, J.; Raheem, A.; Ke, R.; Cheu, R.L. Efficient Procedure of Building University Campus Models for Digital Twin Simulation. IEEE J. Radio Freq. Identif. 2022, 6, 769–773. [Google Scholar] [CrossRef]
  23. Chen, G.; Alomari, I.; Taffese, W.Z.; Shi, Z.; Afsharmovahed, M.H.; Mondal, T.G.; Nguyen, S. Multifunctional Models in Digital and Physical Twinning of the Built Environment—A University Campus Case Study. Smart Cities 2024, 7, 836–858. [Google Scholar] [CrossRef]
  24. Jovanović, D.; Milovanov, S.; Ruskovski, I.; Govedarica, M.; Sladić, D.; Radulović, A.; Pajić, V. Building Virtual 3D City Model for Smart Cities Applications: A Case Study on Campus Area of the University of Novi Sad. ISPRS Int. J. Geo-Inf. 2020, 9, 476. [Google Scholar] [CrossRef]
  25. Kenton, W. Affordability Index: Overview and Examples. Available online: https://www.investopedia.com/terms/a/affordability-index.asp (accessed on 10 May 2026).
  26. Fisher, L.M.; Pollakowski, H.O.; Zabel, J. Amenity-Based Housing Affordability Indexes. Real. Estate Econ. 2009, 37, 705–746. [Google Scholar] [CrossRef]
  27. Anaya-Boig, E.; Cebollada, À.; Castelló Bueno, M. Measuring Spatial Inequalities in the Access to Station-Based Bike-Sharing in Barcelona Using an Adapted Affordability Index. J. Transp. Geogr. 2022, 98, 103267. [Google Scholar] [CrossRef]
  28. Emanuel, E.J.; Glickman, A.; Johnson, D. Measuring the Burden of Health Care Costs on US Families the Affordability Index. JAMA 2017, 318, 1863–1864. [Google Scholar] [CrossRef] [PubMed]
  29. Ganguli, S.; Anderson, D.M.; Moore, M.L. On the Measurement and Quantification of Electricity Affordability in the Commercial and Industrial Sectors—A Cost Burden Approach. Electr. J. 2022, 35, 107081. [Google Scholar] [CrossRef]
  30. Garcia-Valinas, M.A.; Martinez-Espineira, R.; Gonzalez-Gomez, F. Affordability of Residential Water Tariffs: Alternative Measurement and Explanatory Factors in Southern Spain. J. Environ. Manag. 2010, 91, 2696–2706. [Google Scholar] [CrossRef] [PubMed]
  31. Ganning, J.P. It’s Good but is It Right? An Under-the-Hood View of the Location Affordability Index. Hous. Policy Debate 2017, 27, 807–824. [Google Scholar] [CrossRef]
  32. Haas, P.M.; Newmark, G.L.; Morrison, T.R. Untangling Housing Cost and Transportation Interactions: The Location Affordability Index Model—Version 2 (LAIM2). Hous. Policy Debate 2016, 26, 568–582. [Google Scholar] [CrossRef]
  33. Isalou, A.A.; Litman, T.; Shahmoradi, B. Testing the Housing and Transportation Affordability Index in a Developing World context: A Sustainability Comparison of Central and Suburban Districts in Qom, Iran. Transp. Policy 2014, 33, 33–39. [Google Scholar] [CrossRef]
  34. Ali, M.A.; Alam, K.; Taylor, B. Measuring the Concentration of Information and Communication Technology Infrastructure in Australia: Do Affordability and Remoteness Matter? Socio-Econ. Plan. Sci. 2020, 70, 100737. [Google Scholar] [CrossRef]
  35. Ezennia, I.S.; Hoskara, S.O. Methodological Weaknesses in the Measurement Approaches and Concept of Housing Affordability Used in Housing Research: A Qualitative Study. PLoS ONE 2019, 14, e0221246. [Google Scholar] [CrossRef] [PubMed]
  36. Kang, J.Y.; Suo, Z.H.; Liang, L.K.; Mai, Z.; Fang, M. Temporal and Spatial Evolution and Its Affecting Factors of Housing Affordability at Urban Scale in China. Arid Land Geogr. 2019, 42, 1153–1165. [Google Scholar] [CrossRef]
  37. Brooks, M.M. Measuring America’s Affordability Problem: Comparing Alternative Measurements of Affordable Housing. Hous. Policy Debate 2023, 33, 1293–1312. [Google Scholar] [CrossRef]
  38. Pan, J.; Yang, L. Spatial-Temporal Differentiation of Housing Price-to-Income Ratio at Prefecture Level Cities in China. Arid Land Geogr. 2017, 40, 1274–1281. [Google Scholar]
  39. Ben-Shahar, D.; Warszawski, J. Inequality in Housing Affordability: Measurement and Estimation. Urban Stud. 2016, 53, 1178–1202. [Google Scholar] [CrossRef]
  40. West, T.D.; Blackburn, M. Is Digital Thread/Digital Twin Affordable? A Systemic Assessment of the Cost of DoD’s Latest Manhattan Project. Procedia Comput. Sci. 2017, 114, 47–56. [Google Scholar] [CrossRef]
  41. Oettl, F.; Eckart, L.; Schilp, J. Cost Estimation Approach of a Digital Twin Implementation in Industry. Procedia CIRP 2023, 118, 318–323. [Google Scholar] [CrossRef]
  42. Vasilyeva, A.; Kuznetsova, M.; Zinovyeva, E.; Kuznetsova, N.; Ageeva, I. Estimation of the Cost of Developing a Digital Twin Using Virtual Reality Technologies in the Metallurgical Industry. In Proceedings of the Digital and Information Technologies in Economics and Management; Springer: Cham, Switzerland, 2024; pp. 66–77. [Google Scholar]
  43. Abugu, C.T.; Anumba, C.J.; Asare, K.A.B. Investigation of the Costs and Benefits of Digital Twins in Construction. In Proceedings of the Computing in Civil Engineering 2023-Visualization, Information Modeling, and Simulation; Turkan, Y., Louis, J., Leite, F., Ergan, S., Eds.; American Society of Civil Engineers (ASCE): New York, NY, USA, 2024; pp. 544–552. [Google Scholar]
  44. RisingMax How Much Does It Cost to Develop a Digital Twin Application? Available online: https://risingmax.com/blog/digital-twin-development-cost (accessed on 28 October 2024).
  45. Lengthorn, P. How Much to Build a Digital Twin? Available online: https://www.consultengsurvivor.com/cost-to-build-a-digital-twin (accessed on 28 October 2024).
  46. United States Department of Energy; Office of Science; Oak Ridge National Laboratory; United States Department of Homeland Security. HIFLD OPEN Colleges and Universities Campuses. Available online: https://www.datalumos.org/datalumos/project/238998/version/V1/view (accessed on 17 May 2026).
  47. United States Department of Energy; Office of Science; Oak Ridge National Laboratory; United States Department of Homeland Security. HIFLD OPEN Colleges and Universities. Available online: https://www.datalumos.org/datalumos/project/238951/version/V1/view (accessed on 17 May 2026).
  48. U.S. Census Bureau; Geography Division; United States Department of Homeland Security. HIFLD OPEN US County Boundaries. Available online: https://www.datalumos.org/datalumos/project/240942/version/V1/view (accessed on 17 May 2026).
  49. National Center for Education Statistics. Integrated Postsecondary Education Data System (IPEDS). Available online: https://nces.ed.gov/ipeds (accessed on 15 May 2026).
  50. Texas A&M University. 2018 Sustainability Master Plan. Available online: https://sustainability.tamu.edu/_media/documents/pdfs/180829%20FINAL%20Draft%209_20251119.pdf (accessed on 15 May 2026).
  51. Han, X.; Yu, H.; You, W.; Huang, C.; Tan, B.; Zhou, X.; Xiong, N.N. Intelligent Campus System Design Based on Digital Twin. Electronics 2022, 11, 3437. [Google Scholar] [CrossRef]
  52. Roda-Sanchez, L.; Cirillo, F.; Solmaz, G.; Jacobs, T.; Garrido-Hidalgo, C.; Olivares, T.; Kovacs, E. Building a Smart Campus Digital Twin: System, Analytics, and Lessons Learned from a Real-World Project. IEEE Internet Things J. 2024, 11, 4614–4627. [Google Scholar] [CrossRef]
  53. Zhang, L.; Zhang, X.; Huang, H.; Zhang, L.; Li, H. Spatial Accessibility of Multiple Facilities for Affordable Housing Neighborhoods in Harbin, China. Land 2022, 11, 1940. [Google Scholar] [CrossRef]
  54. Chen, J.; Yang, S.; Li, H.; Zhang, B.; Lv, J. Research on Geographical Environment Unit Division Based on the Method of Natural Breaks (Jenks). Int. Arch. Photogramm. Remote Sens. Spat. Inf. Sci. 2013, 40, 47–50. [Google Scholar] [CrossRef]
  55. Sheyner, G. Study: Stanford Can Triple Its Density. Available online: https://www.paloaltoonline.com/uncategorized/2018/09/07/study-stanford-can-triple-its-density-2/ (accessed on 15 May 2026).
  56. Princeton University. 2026 Campus Plan. Available online: https://www.urbanstrategies.com/project/princeton-university-campus-plan/ (accessed on 15 May 2026).
  57. Wayne State University. 2020 Campus Master Plan. Available online: https://campusplan.wayne.edu/documents/2020_campus_master_plan.pdf (accessed on 15 May 2026).
  58. Clemson University. 2002 Campus Master Plan. Available online: https://cufacilities.sites.clemson.edu/documents/departments/pdc/planning/Design%20Principles%20Guidelines%20and%20Planning%20Standards.pdf (accessed on 15 May 2026).
  59. Getis, A. Spatial Autocorrelation. In Handbook of Applied Spatial Analysis: Software Tools, Methods and Applications; Springer: Berlin/Heidelberg, Germany, 2009; pp. 255–278. [Google Scholar]
  60. Getis, A. Local Spatial Statistics: An Overview. In Spatial Analysis: Modelling in a GIS Environment; GeoInformation International: Cambridge, UK, 1996; pp. 261–277. [Google Scholar]
  61. Sánchez-Martín, J.-M.; Rengifo-Gallego, J.-I.; Blas-Morato, R. Hot Spot Analysis Versus Cluster and Outlier Analysis: An Enquiry Into the Grouping of Rural Accommodation in Extremadura (Spain). ISPRS Int. J. Geo-Inf. 2019, 8, 176. [Google Scholar] [CrossRef]
Figure 1. Research Area Diagram. Spatial distribution of the higher education institutions examined in this study across the United States.
Smartcities 09 00122 g001
Figure 2. Proposed development framework of Campus Digital Twin.
Smartcities 09 00122 g002
Figure 3. Cost components of implementing campus digital twin.
Smartcities 09 00122 g003
Figure 4. Spatial distribution and clustering analysis visualization of overall affordability index results. (a) Spatial distribution results. (b) Spatial clustering and outlier analysis results.
Smartcities 09 00122 g004
Figure 5. Spatial characteristics analysis of affordability index results between public and private campuses. (a) Spatial distribution of public campuses. (b) Spatial clustering and outlier analysis results of public campuses. (c) Spatial distribution of private campuses. (d) Spatial clustering and outlier analysis results of private campuses.
Smartcities 09 00122 g005
Figure 6. Statistical plot of CDT affordability results by States.
Smartcities 09 00122 g006
Figure 7. Spatial distribution map of normalized affordability results by States. (a) Proportion of campuses with high affordability. (b) Proportion of campuses with moderate affordability. (c) Proportion of campuses with low affordability. (d) Proportion of campuses with unaffordability.
Smartcities 09 00122 g007
Figure 8. Proportion of four affordability types of institutions across baseline and sensitivity scenarios. (a) Sensitivity to C0. (b) Sensitivity to FAR.
Smartcities 09 00122 g008
Table 1. Data sources. List of data sources used to compile campus information.
TypeData Source
Campus attribute dataNational Center for Education Statistics [49]
Campus point dataHomeland Infrastructure Foundation-Level Data (HIFLD) [47]
Campus boundary dataHomeland Infrastructure Foundation-Level Data (HIFLD) [46]
Administrative boundary dataHomeland Infrastructure Foundation-Level Data (HIFLD) [48]
Table 2. FAR and related details of representative campuses.
NameInstitutional ControlCampus SettingFAR
University of Minnesota-Twin CitiesPublicCity: Large1.13
Wayne State UniversityPublicCity: Large1.21
the University of Michigan-Ann ArborPublicCity: Midsize0.58
Princeton UniversityPrivate not-for-profitCity: Small0.60
Stanford UniversityPrivate not-for-profitSuburb: Large0.34
Clemson UniversityPublicSuburb: Midsize0.22
Table 3. Affordability index based on classification threshold range and quantity statistics.
Affordability ClassificationThreshold RangeNumber of CampusesProportion (%)
High affordability0 < A ≤ 21.7479242.31
Moderate affordability21.74 < A ≤ 53.0661532.85
Low affordability53.06 < A < 10032017.09
UnaffordabilityA ≥ 1001457.75
Total 1872100.00
Table 4. Statistical summary of results by institutional control.
Affordability
Classification
Public CampusPrivate Campus
(Not-for-Profit)
Private Campus
(for-Profit)
High Affordability166 (27.48)502 (44.94)124 (82.12)
Moderate Affordability237 (39.24)369 (33.03)9 (5.96)
Low Affordability122 (20.20)191 (17.10)7 (4.64)
Unaffordability79 (13.08)55 (4.92)11 (7.28)
Total604 (100.00)1117 (100.00)151 (100.00)
Notes: Values are reported as n (%).
Table 5. Number and proportion of institutions with high affordability across baseline and sensitivity scenarios, by institutional control.
Institution TypeLow Cost
(C0 = $10/m2)
Baseline
(C0 = $15/m2)
High Cost
(C0 = $20/m2)
Higher Cost
(C0 = $25/m2)
FAR −20%
(C0 = $15/m2)
FAR +20%
(C0 = $15/m2)
Public Campus264 (43.71)166 (27.48)115 (19.04)88 (14.57)212 (35.10)134 (22.19)
Private Campus
(Not-for-Profit)
679 (60.79)502 (44.94)408 (36.53)360 (32.23)599 (53.63)444 (39.75)
Private Campus
(For-Profit)
130 (86.09)124 (82.12)119 (78.81)118 (78.15)126 (83.44)121 (80.13)
Notes: Values are reported as n (%). Proportions present the share of institutions with high affordability within each institution type category. FAR +20% and FAR −20% denote a 20% increase and decrease relative to the baseline, respectively.
Table 6. Number and proportion of institutions with high affordability across baseline and sensitivity scenarios, by top five states.
StateLow Cost
(C0 = $10/m2)
Baseline
(C0 = $15/m2)
High Cost
(C0 = $20/m2)
Higher Cost
(C0 = $25/m2)
FAR −20%
(C0 = $15/m2)
FAR +20%
(C0 = $15/m2)
California124 (80.00)114 (73.55)104 (67.10)97 (62.58)119 (76.77)106 (68.39)
New York111 (73.03)87 (57.24)81 (53.29)73 (48.03)99 (65.13)82 (53.95)
Pennsylvania69 (56.56)45 (36.89)36 (29.51)30 (24.59)60 (49.18)39 (31.97)
Texas54 (51.92)34 (32.69)28 (26.92)24 (23.08)41 (39.42)30 (28.85)
Massachusetts57 (80.28)48 (67.61)40 (56.34)37 (52.11)53 (74.65)45 (63.38)
Notes: Values are reported as n (%). Proportions present the share of institutions with high affordability within each state. FAR +20% and FAR −20% denote a 20% increase and decrease relative to the baseline, respectively.
Disclaimer/Publisher’s Note: The statements, opinions and data contained in all publications are solely those of the individual author(s) and contributor(s) and not of MDPI and/or the editor(s). MDPI and/or the editor(s) disclaim responsibility for any injury to people or property resulting from any ideas, methods, instructions or products referred to in the content.