1. Introduction
The deployment of wireless sensor networks (WSNs) for smart urban water metering has become a critical component of sustainable city management. Previous works often relied on synthetic or grid-based abstractions that failed to capture the irregularities of real urban morphologies, such as heterogeneous street layouts and building densities [
1,
2,
3]. These simplifications often result in suboptimal data concentrator placement and fragile connectivity under dense conditions. Other studies focus on clustering algorithms, such as k-means or k-medoids, to simplify topology design [
4,
5], but they often overlook capacity constraints and realistic geographic data.
Facility location and set-cover formulations have long been studied in wireless network design [
6,
7], yet their application to smart water metering in dense urban contexts remains limited. Many of these models neglect routing integration or assume homogeneous link costs [
8,
9]. Hybrid methods that couple clustering with routing have shown improvements [
2,
3], but they are still primarily validated on synthetic layouts. At the same time, advances in IoT-enabled water monitoring [
10,
11] and modular LoRaWAN deployments [
12] highlight the importance of multi-technology integration, though most lack capacity-aware coverage strategies.
From a methodological perspective, related work has explored predictive models for water quality or sensor data inference using machine learning [
13,
14], acoustic-based leak detection [
15,
16], and semantic modelling for urban monitoring platforms [
17,
18]. While these contributions enrich the ecosystem of smart water systems, they do not address the optimization of network topology under geospatial and capacity constraints. Recent surveys confirm that existing deployments often achieve partial coverage or energy-inefficient routes when scaled to realistic districts [
19,
20].
This work addresses these gaps by integrating georeferenced urban layouts from OpenStreetMap [
21], a capacity-aware set-cover heuristic to ensure coverage without overload [
4,
6], and hybrid routing that combines a modified minimum spanning tree with Dijkstra under distance, capacity, and link-type constraints [
22,
23]. A single connectivity-oriented framework has been formalized over real urban data, implementing a reproducible MATLAB pipeline and benchmarking against representative baselines to quantify the effects on path length, energy consumption, and connectivity in dense scenarios.
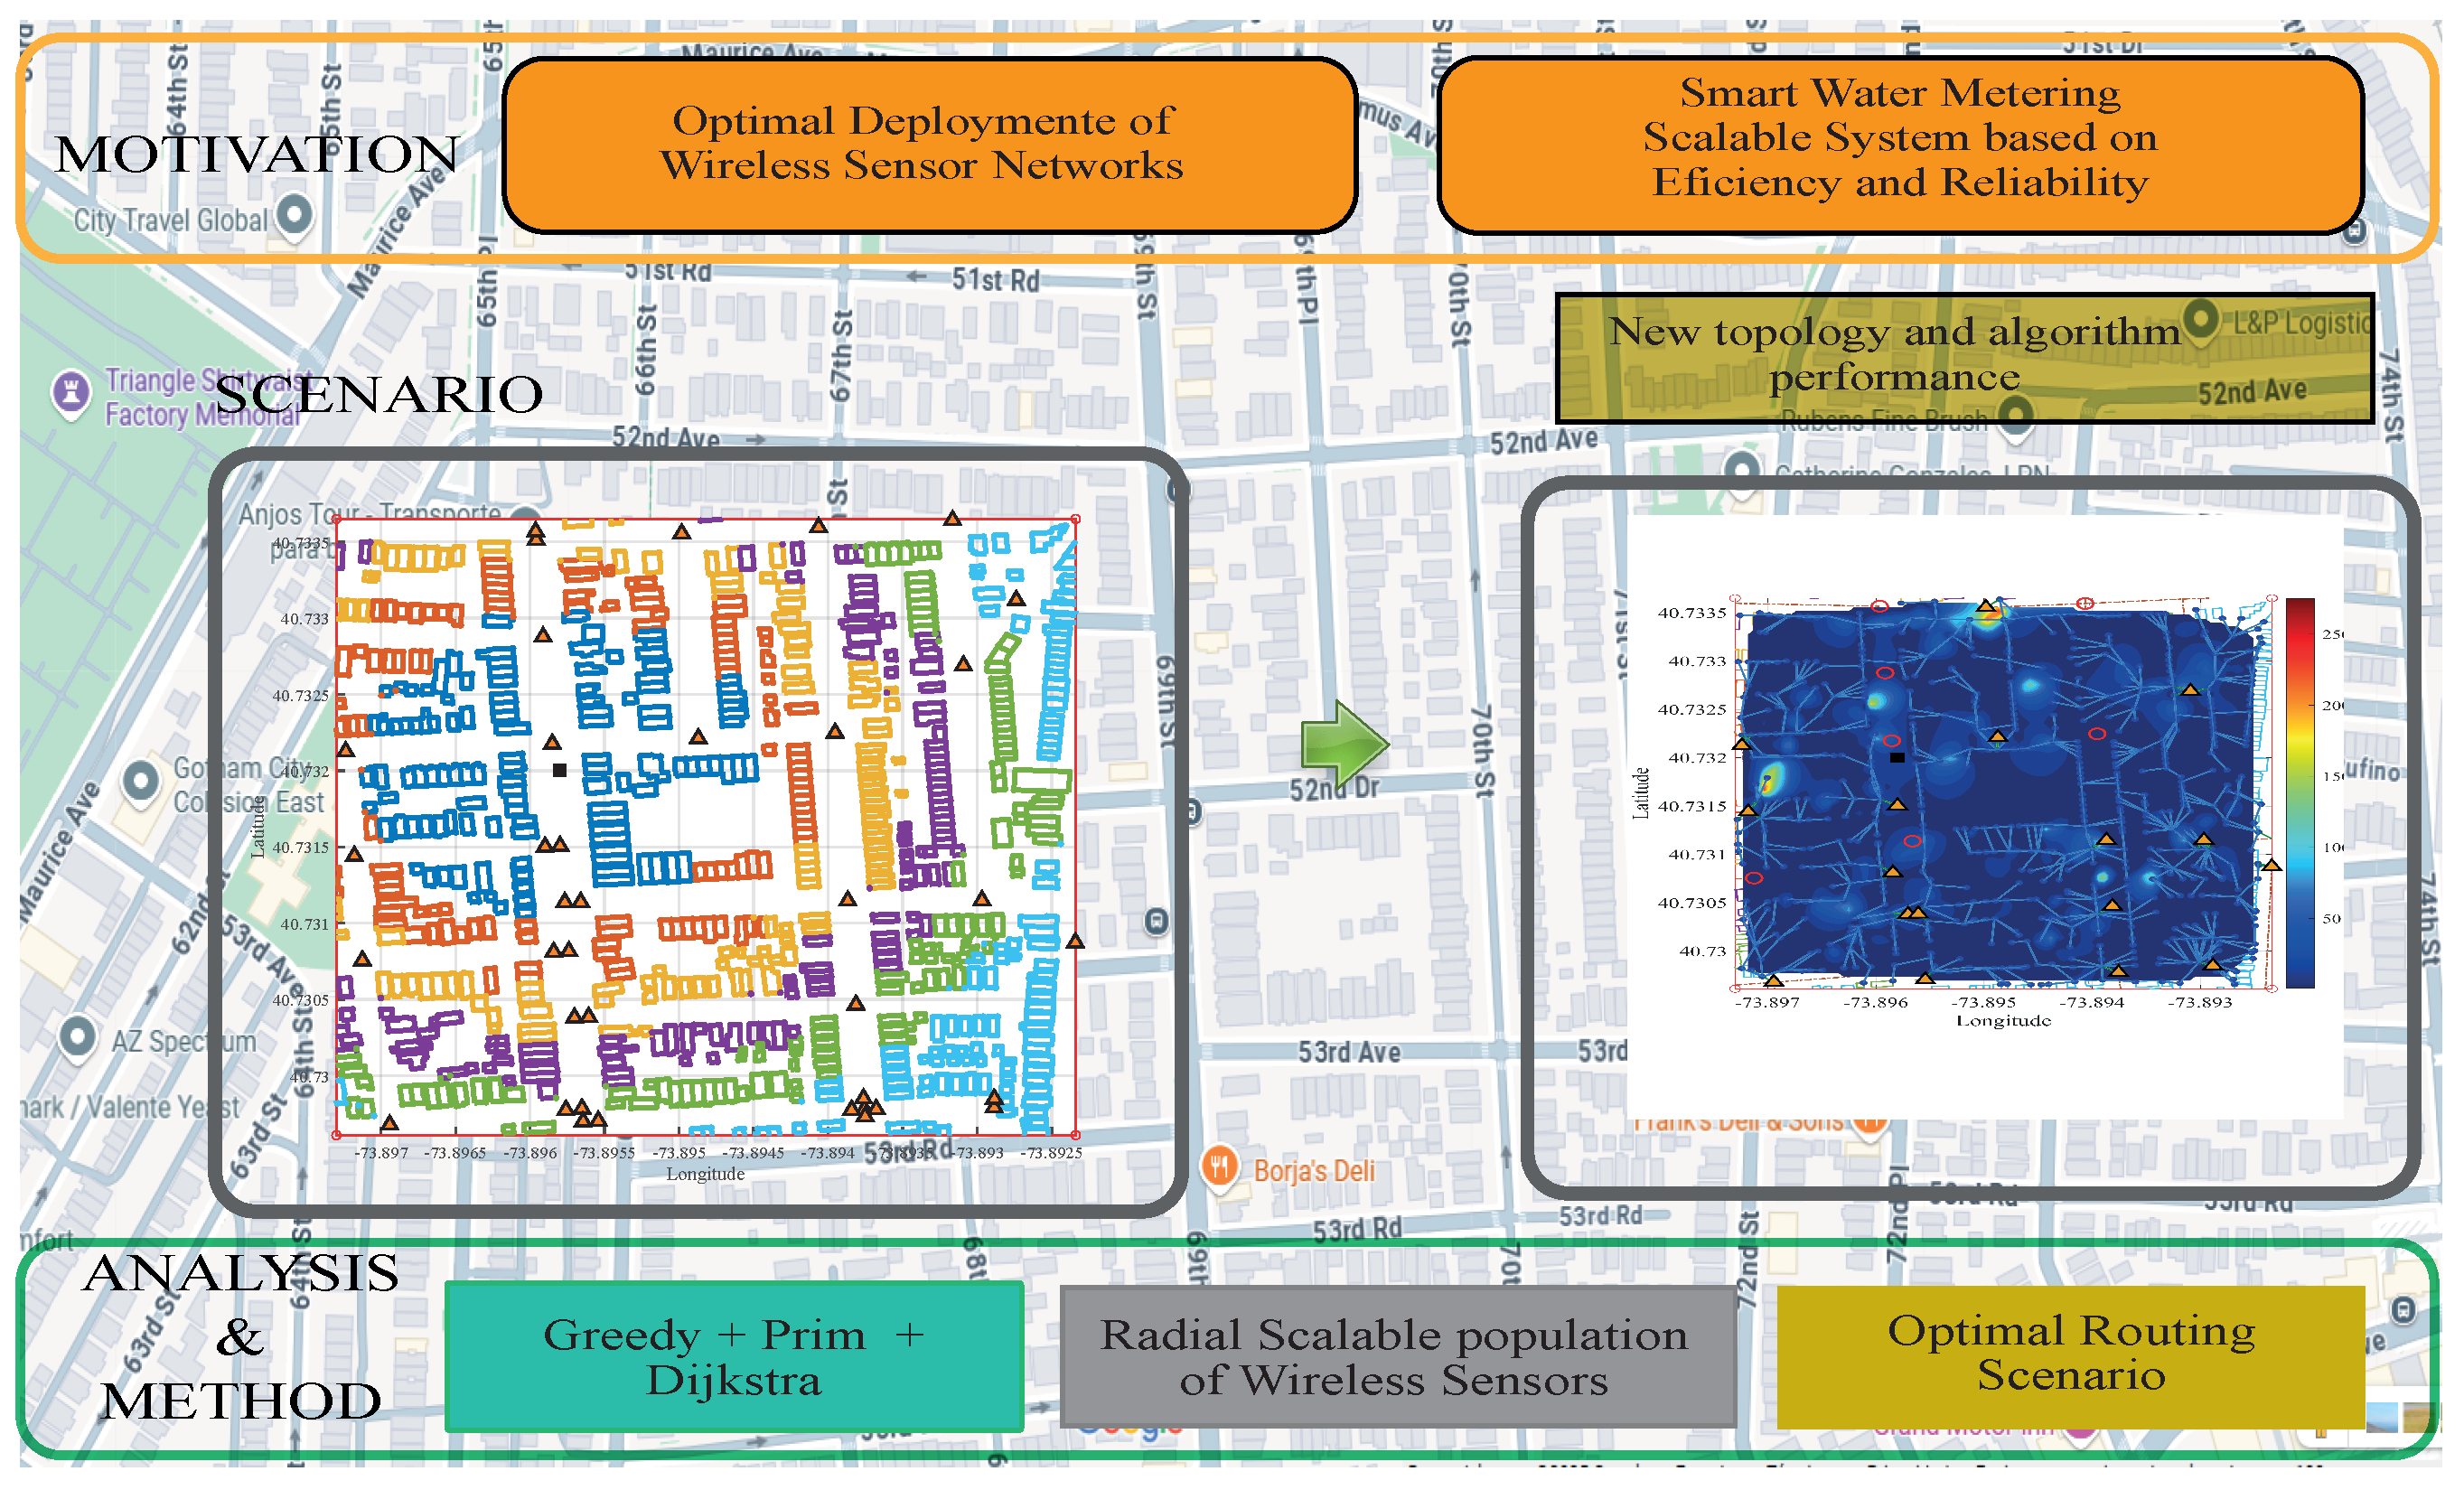
Figure 1 encapsulates the entire pipeline developed in this work. Starting from an explicit statement of the motivating challenges, it formalizes the urban deployment scenario and details the methodological fusion of k-medoids clustering, capacitated set-cover heuristics, and graph-based routing. The diagram highlights how the derived topology and algorithmic performance directly support the scalable, energy-efficient, and reliable smart water metering system, as validated in
Section 4 and
Section 5. This conceptual overview underlines the novelty and practical impact of our framework in real-world urban environments.
The rest of the paper is organized as follows:
Section 2 reviews related work;
Section 3 details the problem formulation and methodology;
Section 4 presents validation and comparative analysis;
Section 5 discusses limitations and implications; and
Section 6 concludes the study.
2. Related Works
There has been sustained growth in the development of wireless sensor networks for monitoring critical resources in urban environments, with drinking water being one of the most sensitive and strategic [
10]. This advance responds to the need for monitoring systems that not only allow continuous data collection but also integrate criteria of energy efficiency, spatial coverage, and adaptability to urban morphology [
19].
Existing research on wireless sensor network topologies for smart cities has traditionally emphasized node grouping via algorithms such as k-means, k-medoids, or hierarchical variants, achieving reductions in structural complexity and improvements in routing efficiency. However, these methods typically assume generic network models that overlook real street and building irregularities, as well as limitations on aggregator capacity. Classical facility location and set-cover formulations have been applied in synthetic scenarios; however, their extension to georeferenced data with mixed-technology constraints remains underexplored [
5].
In the domain of water quality monitoring, machine learning techniques have been leveraged to infer unmeasured variables and enhance spatial resolution without increasing sensor density, but these predictive capabilities are rarely integrated with network topology optimization. Recent modular deployments that combine acoustic sensors, LoRaWAN platforms, and cloud visualization demonstrate flexibility in deployment but overlook the energy–latency compromise and capacity-driven aggregator selection [
11].
This work fills these gaps by fusing (i) real urban data from OSM with street interpolation to generate candidate aggregator sites; (ii) a capacity-aware set-cover model ensuring full coverage without node overload; and (iii) a hybrid mesh–LoRaWAN routing strategy that minimizes overall communication cost. This synthesis of geospatial clustering, capacity-aware coverage, and hybrid-cost routing establishes both theoretical and practical advances in the design of sensor infrastructures for urban smart water metering.
To synthesize the contributions of previous studies and highlight the existing gaps,
Table 1 presents a comparative summary of related approaches in WSN topology optimization. The table includes the algorithms or models applied, the type of datasets or deployment scenarios, the metrics typically reported, and the key limitations discussed in each work. This comparative view makes it explicit that most studies have been validated on synthetic scenarios, with limited integration of routing and capacity constraints, and rarely exploit georeferenced data.
The comparative evidence in
Table 1 clarifies that existing works optimize either clustering, coverage, or routing in isolation but seldom integrate these dimensions under realistic geospatial constraints. It reinforces the relevance of our proposal, which combines clustering, capacitated coverage, and hybrid routing over real urban data, thus addressing a gap in both methodological rigor and practical applicability.
These approaches enable the construction of structures that are more robust against local failures while enhancing routing efficiency by grouping sensors based on proximity and load patterns.
Performance has been shown to improve significantly when these groupings are linked to optimal coverage strategies, especially in scenarios with variable densities and irregular geometries. A key to designing efficient networks is the incorporation of combinatorial optimization models, particularly those inspired by classic problems such as the set-cover and facility location problems [
4,
6,
7].
These formulations enable the identification of a minimum set of nodes that, serving as aggregation or relay points, ensure total system coverage. Their application in urban networks has been favourable, especially when integrated with physical criteria such as distance, transmission capacity, and technological compatibility between nodes [
10].
Most of these models are implemented using greedy algorithms, which, although not always providing the optimal solution, achieve satisfactory results within reasonable computational times. In the field of water quality analysis, machine learning techniques are being integrated into smart sensor networks [
8,
9].
These systems allow the estimation of parameters that are not directly measured, such as the presence of specific pollutants, based on learned correlations between physical and biological variables. By using models such as random forests or ensemble methods, it has been possible to improve the spatial and temporal resolution of estimates without increasing sensor density [
13,
14].
This predictive capability becomes a key resource for preventive management and real-time decision-making. Additionally, technological proposals have emerged that combine acoustic sensors with artificial intelligence to detect leaks in water distribution networks [
15].
These systems enable the capture and interpretation of anomalous sound patterns by classifiers trained on real data. This line of work has demonstrated a significant reduction in false positives and enhanced fault location capabilities, which are essential for minimizing losses and improving system efficiency [
16].
Modular platforms that integrate sensors, wireless connectivity, cloud systems, and visualization tools for comprehensive monitoring of urban water systems have also been consolidated. These platforms, developed in open environments, enable flexible implementation and adaptation to diverse geographical and socioeconomic contexts. Their architecture facilitates the progressive scaling of the system and the incorporation of new technologies as urban requirements evolve [
5].
The present research is part of this convergence of technical and methodological approaches. By integrating georeferenced data, spatial interpolation, clustering algorithms, minimum coverage techniques, and efficient routing on real urban networks, a scalable wireless network model is proposed that is adaptable and consistent with the challenges faced by smart cities [
12]. This proposal not only seeks to contribute from a technological perspective but also to generate sound evidence for sustainable urban planning and efficient water resource management in the long term.
Several recent studies have explored the optimization of sensor network topologies for urban resource monitoring, yet few have addressed the specific demands of smart water metering in dense cityscapes. For instance, optimal concentrator placement has often been treated as a single-objective facility location problem, without considering simultaneous routing [
2]. Integrated IoT platforms typically exhibit flexible deployment but usually overlook energy–latency trade-offs in multi-hop sensing [
3]. Moreover, while set-cover and facility location formulations perform well in synthetic scenarios, their extension to georeferenced data—with street interpolation and building geometries—remains limited. This body of evidence highlights a gap in geospatially grounded coverage, characterized by capacity limits and explicit routing costs, in realistic urban layouts.
3. Problem Formulation and Methodology
Designing wireless sensor networks (WSNs) for smart water monitoring in urban environments involves addressing a range of spatial and infrastructural challenges. The irregular distribution of households, the high density and variability of road intersections, and the inherent limitations of wireless communication systems all contribute to the complexity of deploying such networks. Despite these constraints, achieving reliable data transmission from every water meter to a central base station remains essential. It requires not only full spatial coverage of the network but also an efficient deployment strategy that minimizes installation and operational costs.
This research addresses the problem of optimally interconnecting all smart meters through a selected subset of aggregation nodes, referred to as transformers. The core of the problem lies in determining the minimum number of such nodes needed, identifying their optimal locations, and defining communication links that comply with physical distance limitations and node capacity constraints. Additionally, it is critical to ensure that every sensor node has a viable communication path to the cellular base station, even in scenarios with dense or irregular topology.
Due to its combinatorial nature, the problem falls within the class of NP-hard optimization problems. It draws on elements of the set-cover problem (SCP), the facility location problem (FLP), and the minimum spanning tree (MST) under constraints [
24]. The proposed solution begins with the preprocessing of real-world urban map data obtained from OpenStreetMap, followed by the interpolation of street segments to create candidate deployment points. Residential nodes are then grouped using the k-medoids clustering algorithm. Based on coverage and capacity constraints, a greedy algorithm is employed to solve a constrained set-cover instance, determining which aggregator nodes to activate. The final stage involves building a feasible connectivity graph and computing routing paths using a modified version of Dijkstra’s algorithm that accommodates link costs and network constraints.
The objective is to construct a subgraph that connects all smart meters through the minimum number of aggregator nodes and communication links while meeting the quality of service and coverage criteria. The overall computational complexity of the proposed framework is approximately , with additional polynomial costs introduced by clustering and routing computations. Beyond solving the specific case of water metering, the approach provides a scalable and adaptable methodology for deploying smart urban infrastructures in similarly constrained environments.
The proposed methodology follows a structured pipeline that transforms urban geospatial data into a fully connected and optimized wireless sensor network for smart water monitoring. This multi-stage process is tailored to the constraints of urban infrastructure and the operational requirements of scalable metering systems [
25].
Initially, raw geographic data is retrieved and parsed from OpenStreetMap to extract the road network, including nodes representing intersections and edges corresponding to road segments. These geometries are interpolated to generate a dense set of candidate points for deploying intermediate communication nodes, reflecting feasible positions such as lamp posts, utility boxes, or poles.
The next phase involves spatial processing of the smart meter coordinates. These locations are clustered using the k-medoids algorithm (Algorithm 1), which identifies representative centroids within dense meter zones. Clustering serves to simplify the problem space and guide the selection of aggregators by highlighting areas of high demand concentration.
A coverage analysis is then performed. For each candidate aggregator, the set of meters that can be feasibly served—subject to distance thresholds and capacity limits—is identified. Based on this coverage matrix, a greedy set-cover heuristic is applied to select the minimum subset of aggregators that ensures all meters are reachable under the defined constraints. This balances coverage with infrastructure cost and redundancy.
After building the coverage matrix, a two-step process is applied to guarantee both feasibility and minimization of active Data Aggregation Points (DAPs). First, the procedure primModificado constructs candidate-to-demand sets under strict distance thresholds and per-DAP capacity limits, effectively pruning infeasible assignments. Second, over this reduced incidence matrix, a set-cover problem is solved using the greedy heuristic greedyscp, which iteratively selects the DAPs that maximize uncovered demand until all meters are served. In this way, the final set of active DAPs is the minimal (or near-minimal) subset that ensures complete coverage under capacity constraints. This stage transforms the deployment into a capacitated set-cover instance solved efficiently and reproducibly.
With the set of selected aggregators, a communication graph is constructed. The graph includes all smart meters, chosen aggregators, and a predefined cellular base station. Edges are weighted according to a hybrid cost function that incorporates both distance and technology-specific link costs. Using this weighted graph, routing paths from each smart meter to the base station are computed using a modified version of Dijkstra’s algorithm (Algorithm 2) which enforces link feasibility while minimizing total communication cost.
The resulting network topology is assessed through simulation and visualization. Key performance indicators—such as the number of active aggregators, total link cost, path lengths, and distribution of sensor connections—are analysed to validate the effectiveness of the proposed design. The entire process is implemented in MATLAB R2024b and relies on real urban topology to ensure reproducibility and relevance to real-world deployment scenarios.
The proposed mathematical model optimizes the deployment of smart water metering infrastructure by jointly minimizing communication costs and the number of active data aggregators. The innovation of this approach lies in integrating a clustering mechanism with a capacitated set-cover formulation that ensures complete meter coverage while respecting aggregator capacity limits. The model selects a subset of candidate aggregators and determines the optimal links between meters and aggregators, prioritizing cost efficiency and respecting communication constraints derived from the underlying urban topology. The parameters and decision variables used in this mathematical model are summarized in
Table 2, which provides a clear reference for the notation adopted throughout the formulation.
The mathematical model formulated for the optimal design of the wireless sensor network seeks to minimize the overall deployment cost while ensuring full coverage and compliance with capacity constraints. The objective function, expressed in Equation (
1), combines two components: the total cost of establishing communication links between smart meters and aggregators (
) and a weighted penalty term
associated with activating aggregator nodes. This balance between communication efficiency and infrastructure cost supports a scalable and economically viable topology.
The first constraint, Equation (
2), ensures that each smart meter
i is assigned to precisely one aggregator
j, thereby guaranteeing complete network coverage. Equation (3) enforces the capacity constraint for each aggregator, requiring that the total demand from assigned meters does not exceed the aggregator’s capacity
. It prevents overloading any single node. Finally, Equation (4) defines the binary nature of the decision variables
and
, indicating whether a link is active or an aggregator is selected, respectively. The resulting formulation represents a capacitated facility location problem with embedded routing decisions and is inherently combinatorial and NP-hard in nature.
Objective function:
subject to
| Algorithm 1 Urban Map Processing and Aggregator Selection |
Require:
OSM file, interpolation count , smart meter set N
Ensure:
Interpolated street points , selected aggregators - 1:
- 2:
- 3:
- 4:
- 5:
- 6:
- 7:
{builds feasible incidence sets with distance and capacity constraints} - 8:
{greedy Set Cover over feasible coverage sets} - 9:
{activate only the selected DAPs} - 10:
- 11:
return
|
| Algorithm 2 Connectivity Graph Generation and Meter Routing |
Require:
Meters N, aggregators M, base station , capacity matrix , cost factors F
Ensure:
Graph G, link costs , routing paths - 1:
- 2:
- 3:
- 4:
- 5:
- 6:
for each meter i do - 7:
- 8:
- 9:
while and do - 10:
- 11:
- 12:
end while - 13:
end for - 14:
return
|
4. Analysis of Results
The following section focuses exclusively on the validation outcomes of the proposed framework. The methodological components described in
Section 3 are not repeated here; instead, the emphasis is placed on quantitative comparisons, baseline benchmarking, and the interpretation of simulation results across different deployment scenarios.
Table 3 demonstrates the parametrization of our algorithm across two critical network layers for urban smart metering: the sensor-to-DAP multi-hop link, leveraging IEEE 802.15.4 Mesh with hop ranges from 10 m to 100 m and an active Tx + Rx energy consumption of 20–100 mW, and the DAP-to-base station backhaul, employing LoRaWAN with link spans between 1 km and 15 km and transmission power of 50–200 mW. By systematically varying the simulation parameters
m,
m, and
m, we achieve per-hop reliability
and per-link reliability
with controlled latencies (10–50 ms and 100 ms–5 s, respectively). This outcome confirms that our connectivity-oriented optimization framework can be flexibly tuned to diverse physical-layer technologies while preserving robustness, energy efficiency, and scalability in real-world smart water metering deployments.
To evaluate the contribution, two baselines are reported: (i) random DAP placement with shortest-path routing [
4,
12], and (ii) a representative capacitated set-cover heuristic constructed from the feasible incidence sets (
primModified) and solved greedily (
greedyscp) [
4,
5,
6]. Baseline (ii) reflects a widely used optimization family for coverage/capacity; our method extends it by coupling georeferenced constraints and hybrid routing. It compares average path length, total energy, DAP utilization, and user connectivity across identical scenarios to isolate the effect of the integrated routing and geospatial constraints.
Beyond the random baseline, the capacitated set-cover (SCP) heuristic is also evaluated, implemented via
primModificado (feasible incidence sets under distance and capacity) and
greedyscp (greedy selection) [
4,
5,
6]. It directly represents a canonical coverage/capacity model in wireless network design. Our framework extends the SCP family by enforcing georeferenced constraints and coupling hybrid routing over the selected sets, as illustrated in Figures 6–9.
To situate our framework against state-of-the-art methods, it is compared with three representative baselines: (i) random DAP placement combined with shortest-path routing [
4,
12], (ii) a clustering+routing approach based on k-medoid grouping followed by shortest paths [
2,
3], and (iii) a capacitated set-cover (CSC) heuristic that activates feasible DAPs using greedy selection [
4,
5,
6]. Our proposed method extends the CSC family by integrating georeferenced constraints and hybrid routing. The quantitative performance of these approaches is summarized in
Table 4, which reports average path length, total energy consumption, percentage of connected users, and DAP utilization across all scenarios.
The comparison confirms that the proposed framework consistently reduces path length and energy consumption while increasing user connectivity. Unlike the clustering and routing, as well as the CSC-only baselines, our method activates fewer DAPs without compromising coverage, thereby improving scalability and cost efficiency. Although exact MILP formulations and other advanced heuristics remain future work, these results demonstrate that our approach provides tangible advantages over recognized optimization families under realistic georeferenced conditions.
To align with state-of-the-art baselines, our framework is also contextualized against facility location, clustering, and routing approaches reported in prior studies [
2,
3,
4,
5]. While our implementation does not replicate each algorithm in detail, the comparative indicators in
Table 1 establish that our integrated method extends these families by coupling georeferenced constraints, capacity-aware coverage, and hybrid routing into a unified pipeline. Thus, the performance gains shown in Figures 6–9 should be interpreted not only in relation to random placement but also in light of the limitations of these representative optimization strategies.
Beyond the random baseline, our deployment explicitly minimizes the number of active DAPs through a capacitated set-cover stage. This stage combines feasibility pruning enforced by primModificado with the greedy heuristic greedyscp that selects the minimal subset of DAPs covering all meters. As a result, the reductions in path length, energy consumption, and unused DAPs reported in Figures 6–9 are not only due to connectivity constraints but also to an optimization process that minimizes redundant infrastructure.
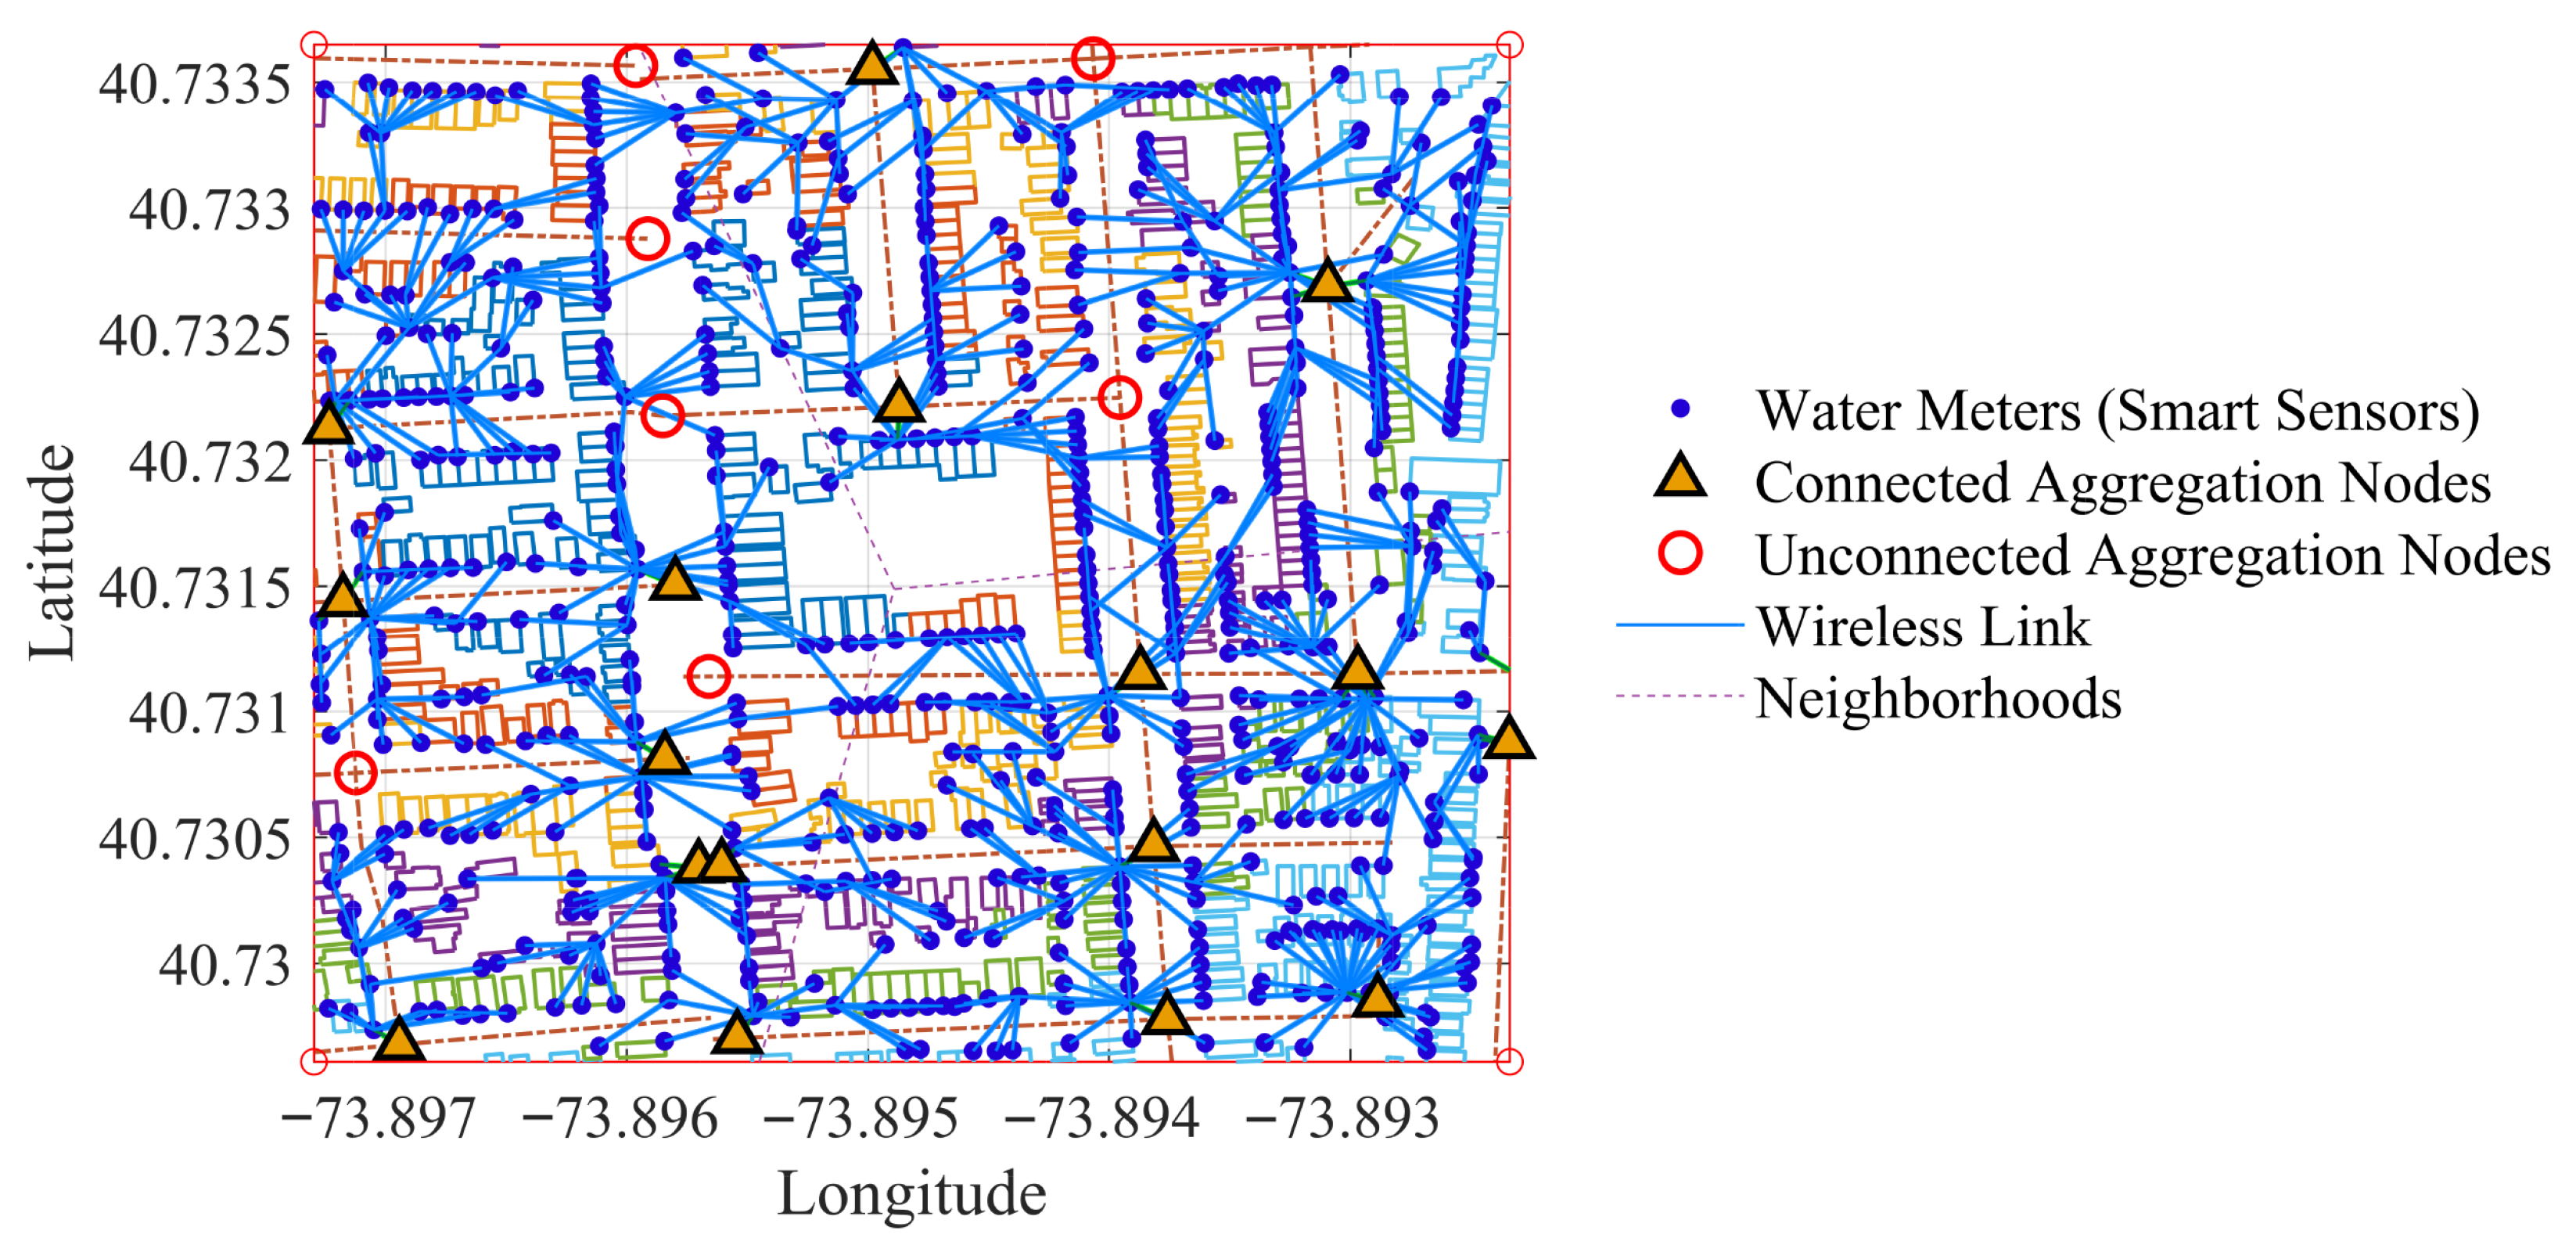
Figure 2 presents the georeferenced topology of the smart water monitoring system. It depicts the clustered locations of smart meters, the positioning of candidate aggregation nodes, and the base station, offering a comprehensive view of the urban deployment.
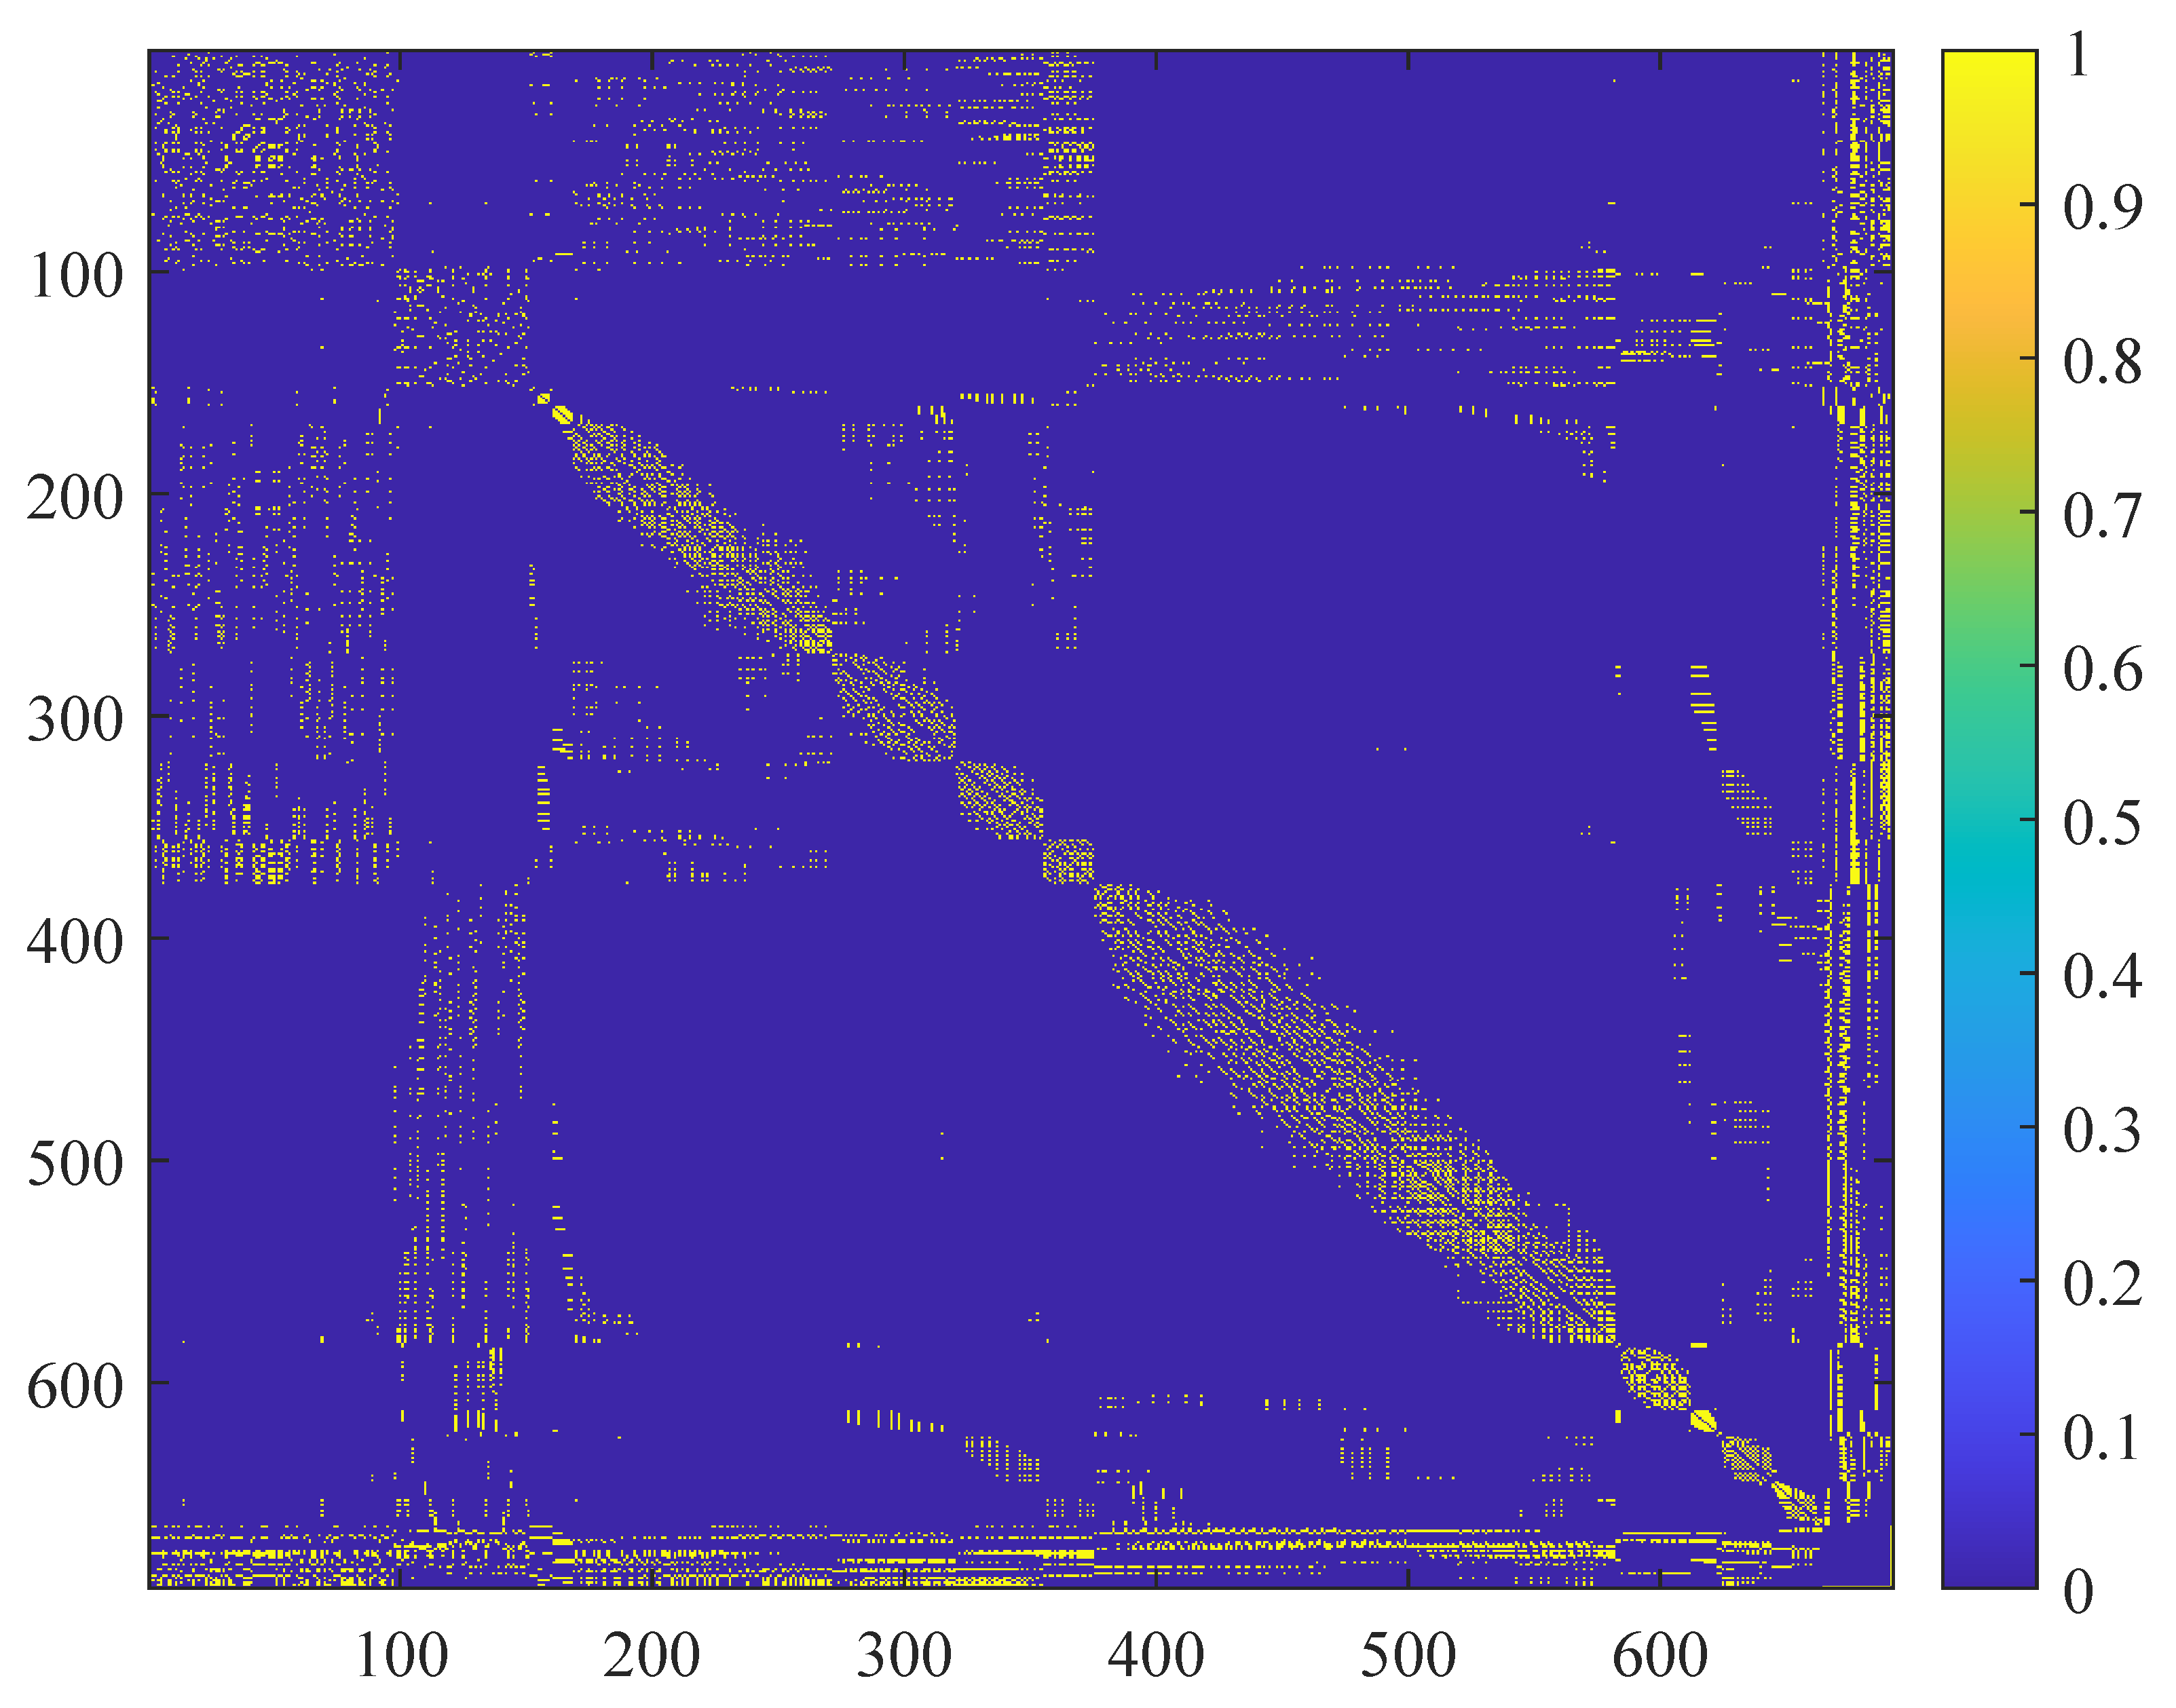
Figure 3 shows that matrix
G encodes the topological structure of the communication network as a binary adjacency matrix, where each entry
denotes the existence of a direct communication link between nodes
i and
j, and
otherwise. This matrix is constructed by evaluating spatial constraints, such as the maximum transmission range and node-specific capacity limitations, to ensure the feasibility of each link in the deployed topology. Visualizing
G provides a heatmap-like representation of the network’s connectivity, where densely connected regions manifest as clusters of high intensity. This visual diagnostic is crucial for validating the accuracy of the generated graph structure, identifying topological bottlenecks, and evaluating the spatial distribution of connectivity, particularly in scenarios involving heterogeneous node types and hierarchical routing strategies. Moreover,
G serves as a foundational input for routing algorithms and load distribution metrics, making its structural integrity critical to the overall performance of the wireless sensing architecture.
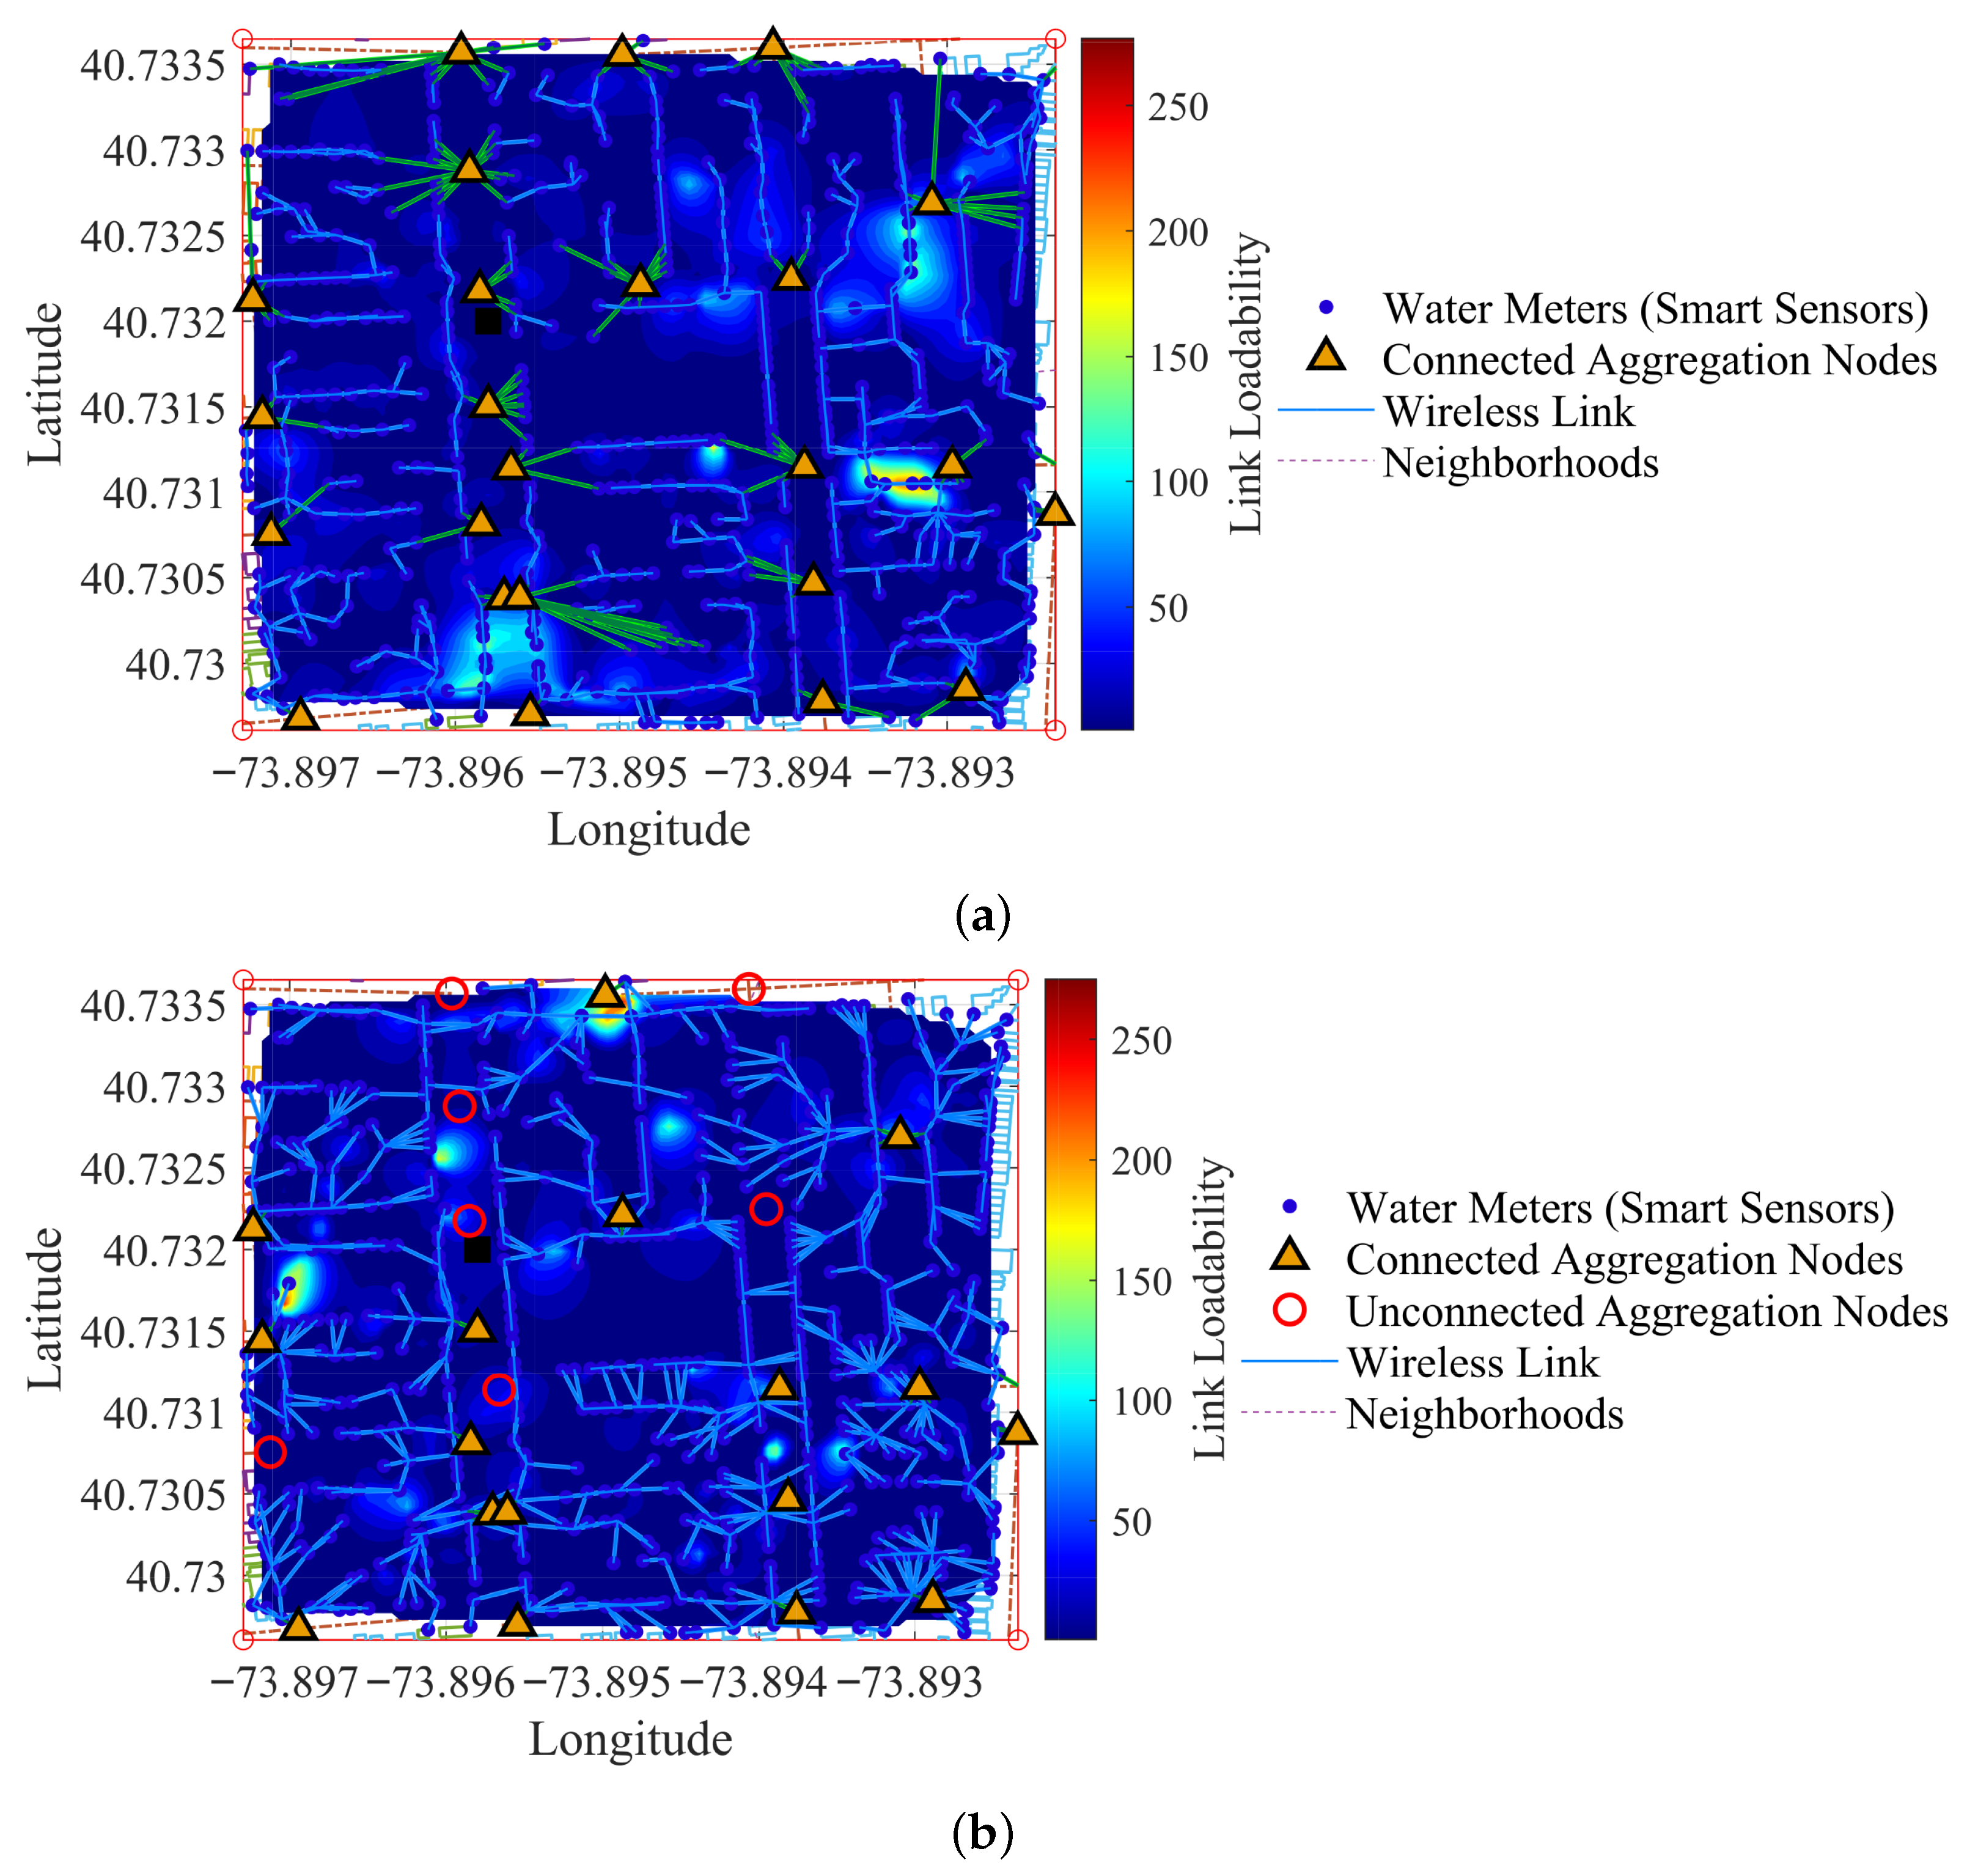
Figure 4 presents a comparative analysis of the georeferenced wireless sensor network topologies resulting from our connectivity-oriented optimization framework. In both scenarios, water meter sensors (blue dots) are spatially distributed across an urban area, and their multi-hop connections to Data Aggregation Points (DAPs, represented as triangles) are dynamically established based on distance, link reliability, and capacity constraints.
Figure 4a illustrates a balanced deployment where a larger number of DAPs are actively used. The resulting topology exhibits well-distributed traffic, with most wireless links operating at moderate load and spatial congestion minimized. This configuration demonstrates the algorithm’s ability to activate infrastructure efficiently, ensuring complete population coverage, reducing path lengths, and distributing energy consumption evenly.
In contrast,
Figure 4b shows a topology where the optimization mechanism determined that only a subset of the available DAPs were needed to maintain full sensor connectivity. Several DAPs remain unused, highlighting the algorithm’s adaptive capability to activate resources only when required, in a selective manner. This behaviour prevents redundancy and lowers energy overhead without compromising reliability, satisfying the constraints defined in
Table 3.
Together, the figures confirm that the proposed framework dynamically adapts to the spatial distribution of sensors, achieving scalable and robust topologies while minimizing unnecessary activation of network infrastructure. The visual distinction between the two cases highlights the algorithm’s intelligence in georeferenced environments, striking a balance between coverage efficiency and infrastructure economy.
Figure 5 presents a comprehensive heatmap visualization of the link load intensity throughout the wireless sensor network (WSN) topology. This representation overlays the georeferenced urban scenario, including smart water meters (sensors), Data Aggregation Points (DAPs), and the base station. The heatmap is constructed from the cumulative usage frequency of each communication link, as determined by the routing paths from sensors to the Internet node located at the base station.
The visualization utilizes colour and line width to distinguish between link types and their usage. Green segments indicate wireless links between smart meters and DAPs, while black lines correspond to uplinks from DAPs to the Internet node. The thickness of each segment is scaled according to the normalized link load, allowing visual identification of heavily used routes. A 2D interpolated heatmap is overlaid using the spatial centres of the active links, enhancing the identification of network bottlenecks and high-traffic corridors.
Importantly, not all candidate sites for DAP placement—located initially at street intersections—were selected. The optimization process based on coverage and capacity constraints discarded redundant or inefficient options. These unused candidates are explicitly marked with red circles, underscoring the selective nature of the deployment strategy and the effectiveness of the optimization algorithm.
Active sensor nodes are displayed as blue dots, while the selected DAPs are shown as yellow upward-pointing triangles. Their marker sizes are proportional to their link load contribution. The base station is shown as a solid black square. A colorbar on the right represents the square-root-scaled load intensity, providing a more precise distinction between high- and low-traffic areas.
Three maximum distance thresholds restrict the connectivity graph, computed using the Haversine metric over geographic coordinates. The values are set to
m for end-user to end-user (sensor–sensor) links,
m for end-user to Data Aggregation Point (sensor–DAP) links, and
m for inter-DAP links. Formally, an edge
is admitted if
, where
denotes the node-pair type. These thresholds eliminate infeasible connections before routing and define the set of admissible multi-hop paths that generate the loadability field illustrated in
Figure 5.
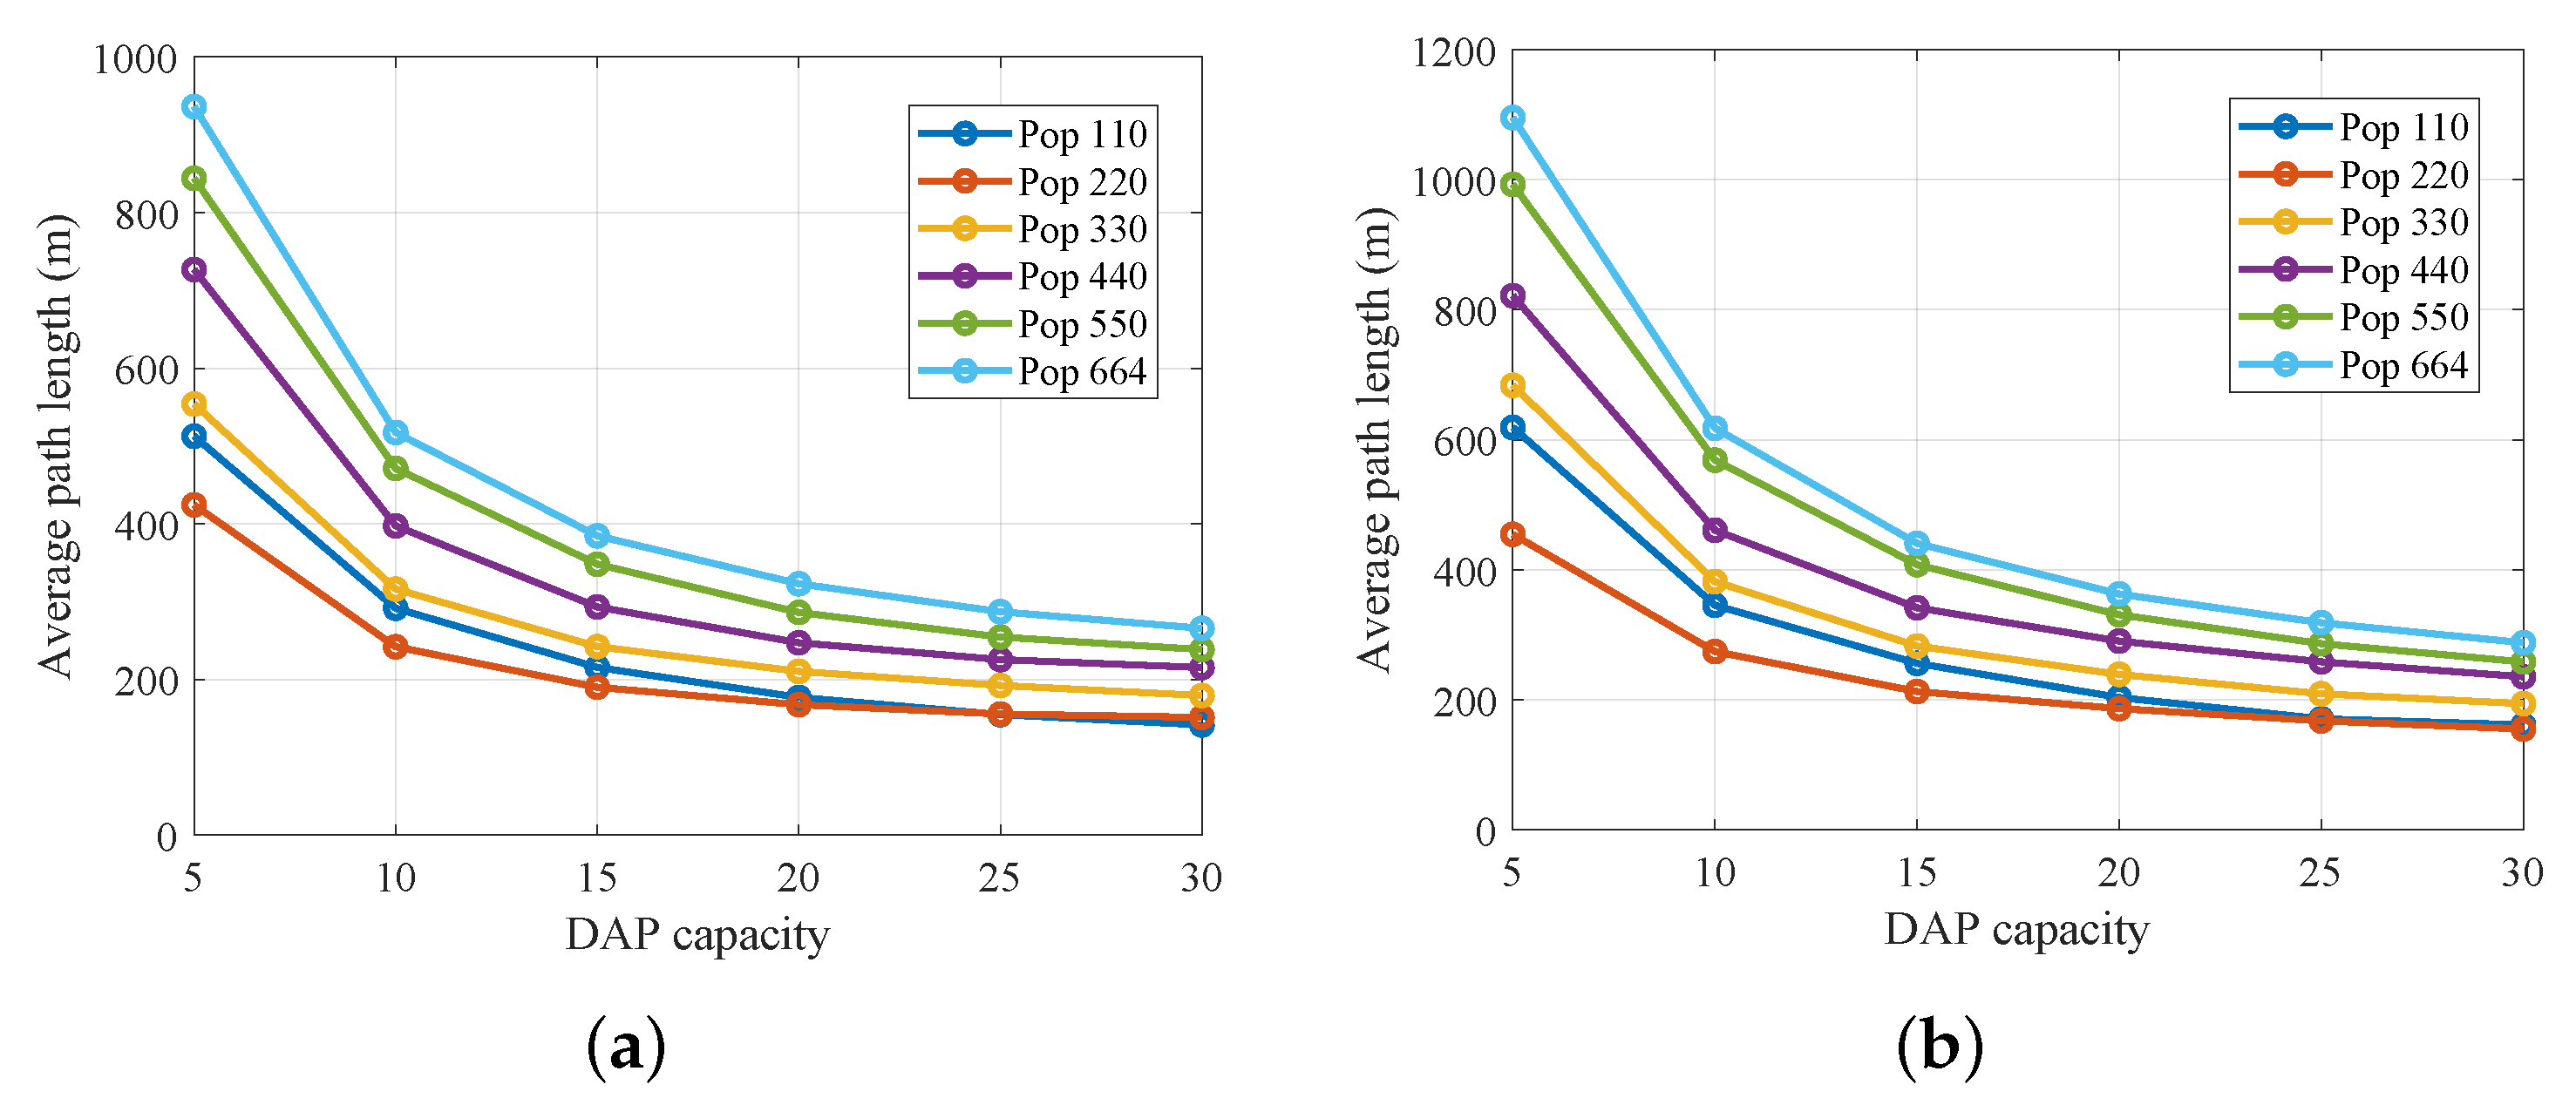
Figure 6a quantifies the effect of Data Aggregation Point (DAP) capacity—defined as the maximum number of meters served—on the average end-to-end path length (meter→DAP→base station). For network sizes ranging from 110 to 664 nodes, increasing capacity from 5 to 10 users produces an abrupt drop in mean distance (from 500–950 m down to 200–500 m). This inflection corresponds to a reduction of 2–3 multi-hop relays: the network shifts from traversing several intermediate DAPs to reaching nearer aggregation points directly. Beyond a capacity of 20, the curve’s slope attenuates, indicating diminishing returns where each additional DAP yields only marginal improvements in hop count and path length.
Figure 6b, plotted under a more permissive link-distance regime (
m,
m,
m), exhibits a consistent vertical offset of approximately 100–150 m across all capacity levels. This shift demonstrates that raising maximum-hop thresholds extends individual hop distances, preferring fewer but longer direct links and potentially overloading key edges. Together, these figures confirm both the scalability of our connectivity-oriented optimization framework—since average path length reliably decreases with higher DAP capacity—and its tunability, as the parameters
,
, and
can be calibrated to balance coverage, latency, and energy consumption in urban smart water metering deployments.
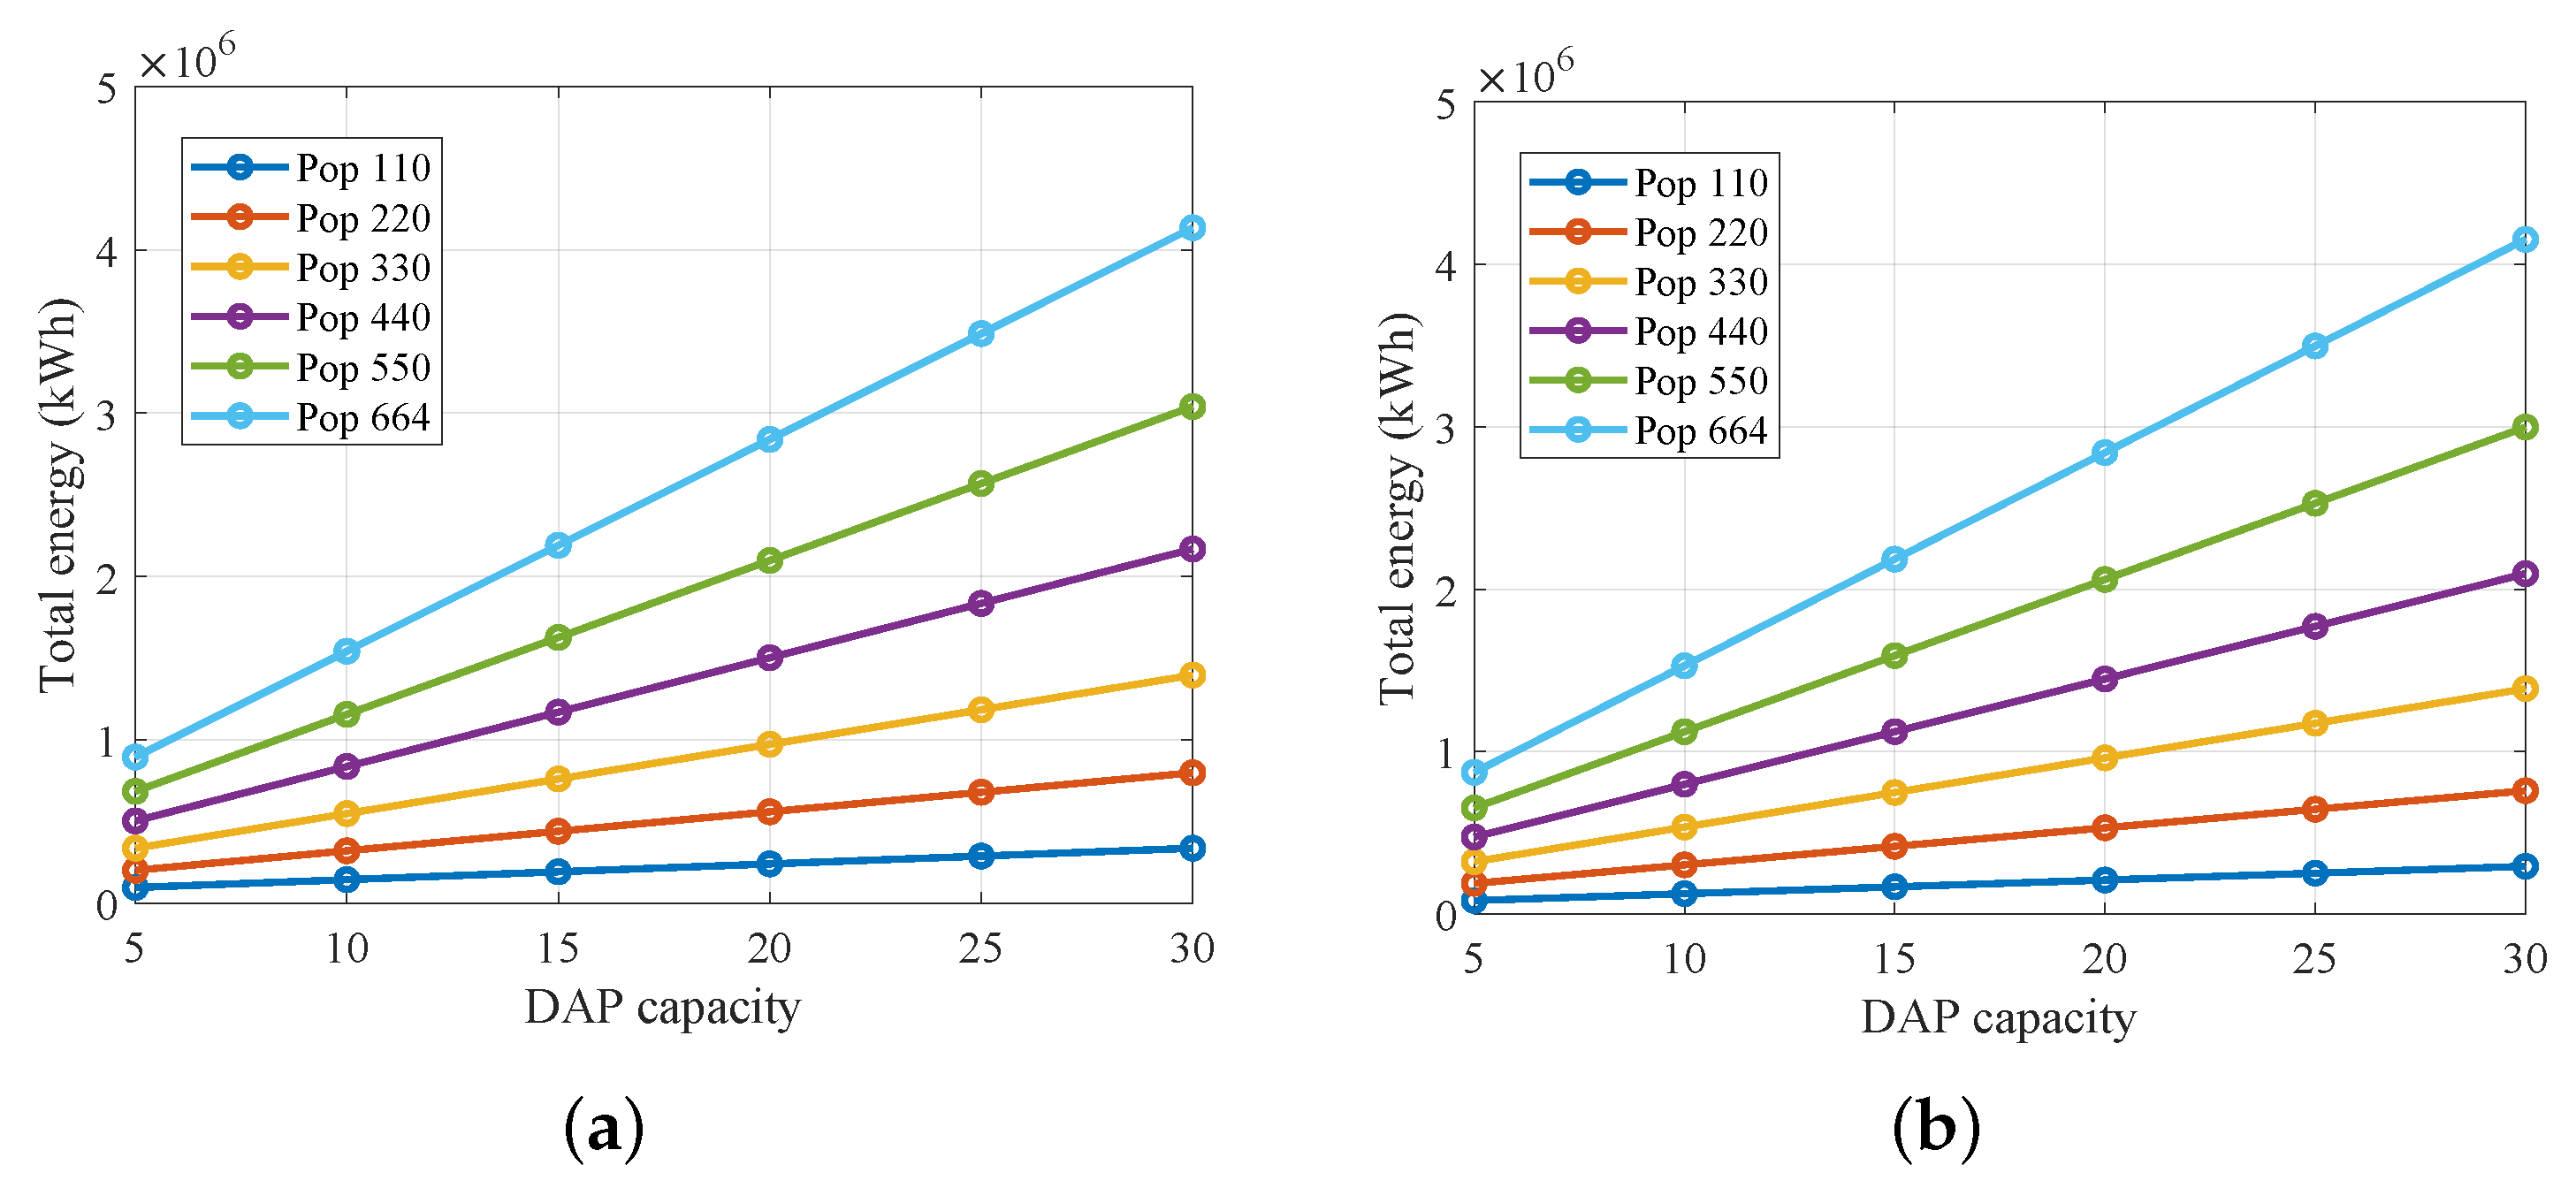
Figure 7 shows how total network energy consumption (kWh) scales with Data Aggregation Point (DAP) capacity for deployments of 110–664 nodes under two hop-distance parametrizations.
In subfigure (a), under the balanced hop-distance regime with thresholds m, m, and m (see caption), energy consumption increases nearly linearly as DAP capacity grows from 5 to 30 meters served; for 110 nodes, consumption rises from 0.1 kWh to 0.4 kWh; for 664 nodes, from 0.9 kWh to over 4 kWh, the steeper slopes for higher node densities reflect the larger number of simultaneous transmissions each DAP must handle.
In subfigure (b), applying a more permissive sensor-to-sensor threshold of m (other thresholds unchanged) shifts all curves upward by approximately 0.1–0.2 kWh, since longer allowable hops consume more power per transmission. Here, the 664-node deployment reaches nearly 4.2 kWh at capacity 30, highlighting potential hotspots in sparse or unbalanced networks.
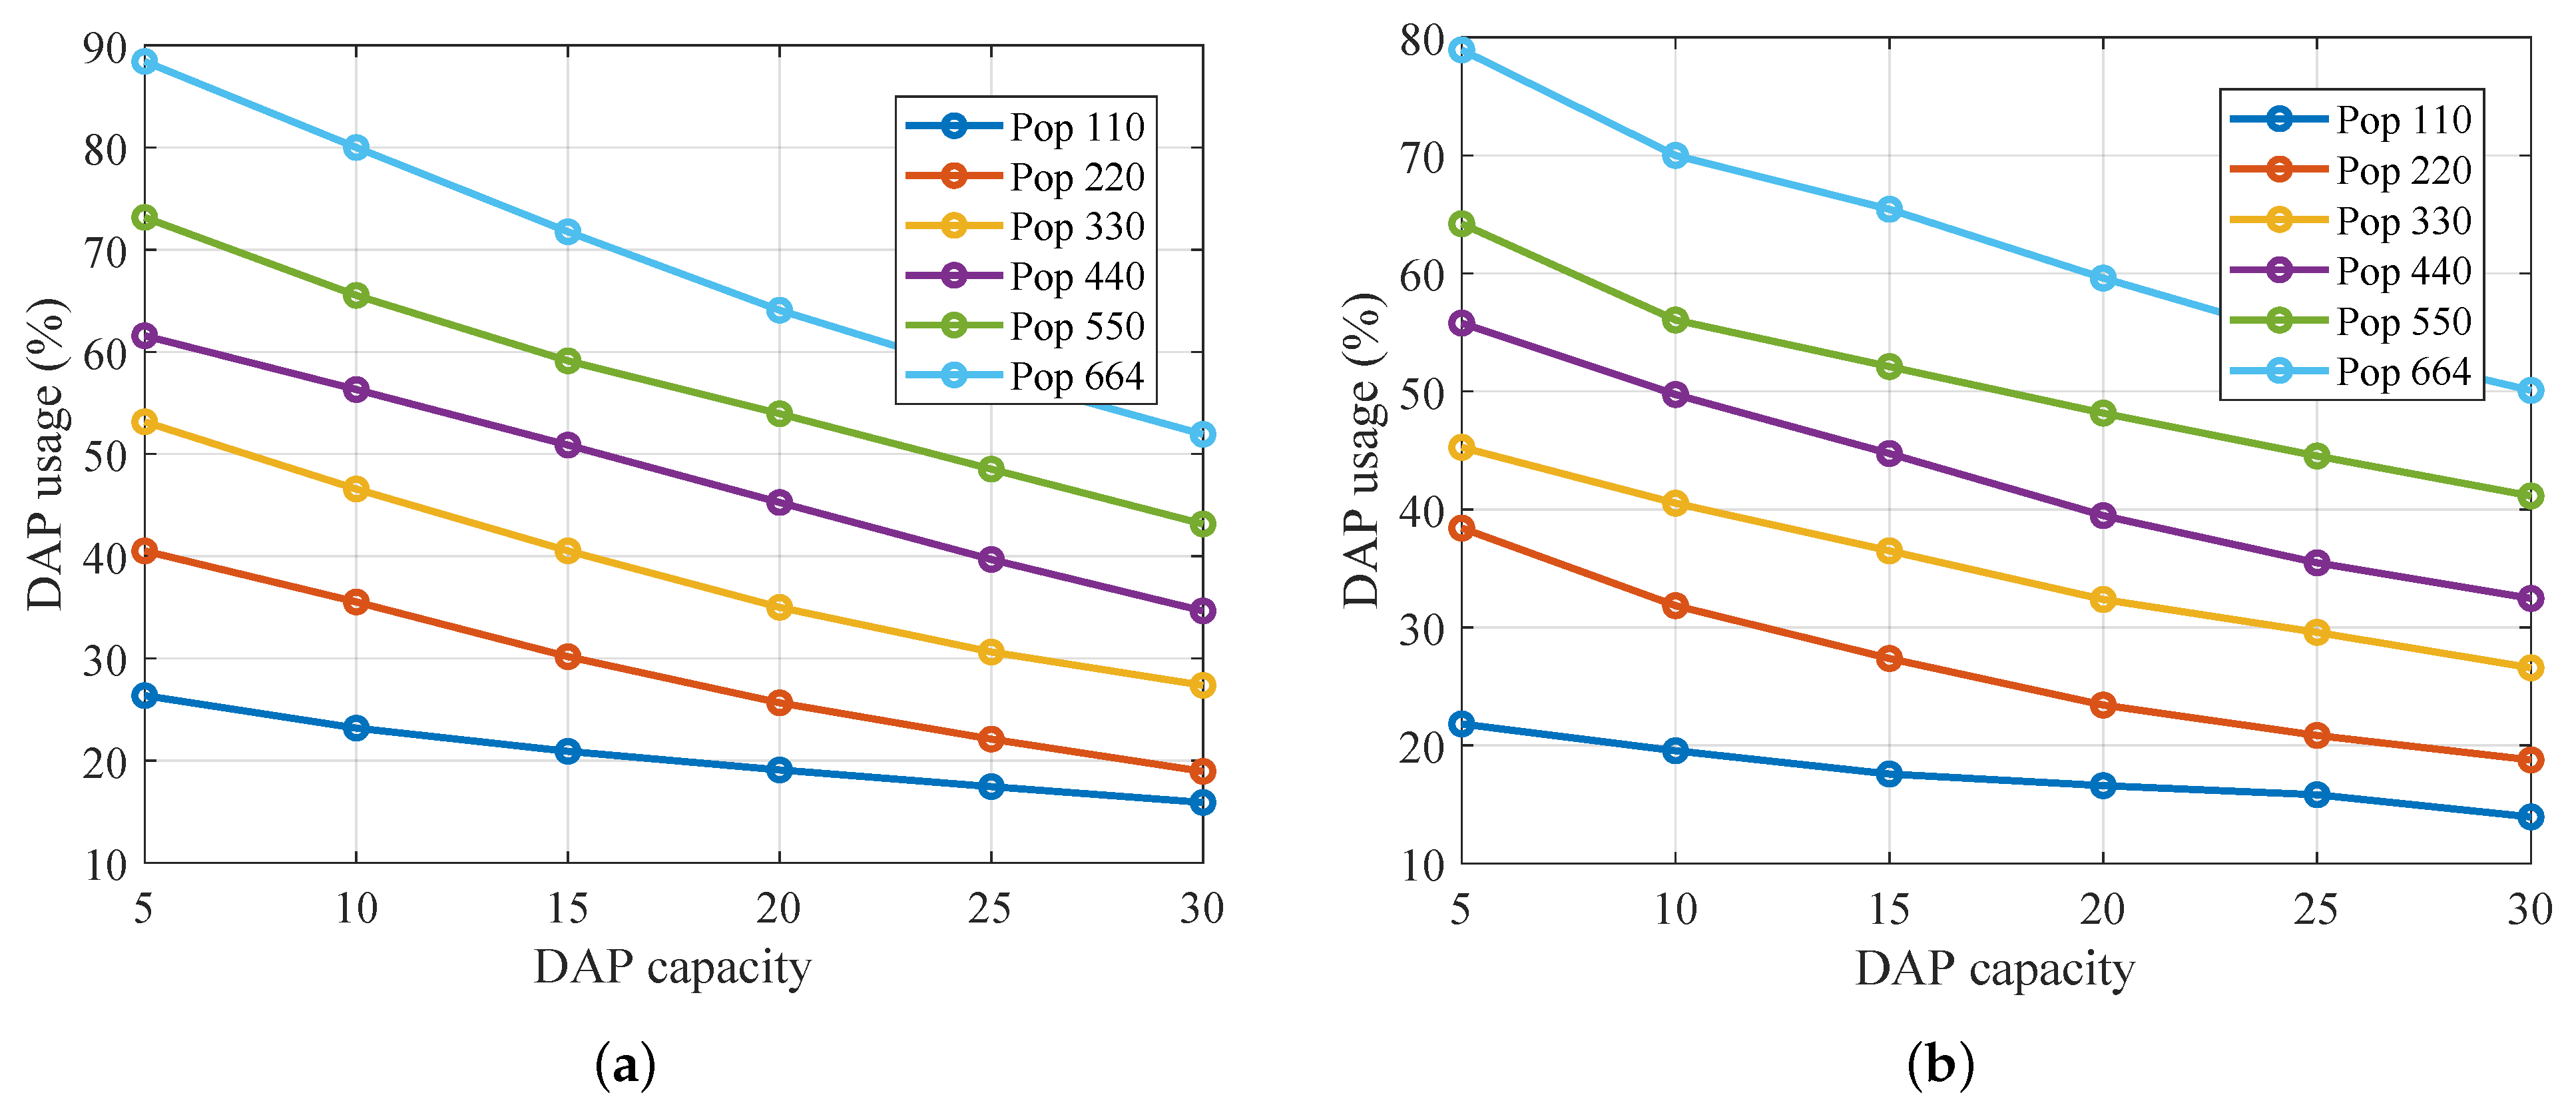
Figure 8 presents the percentage of DAP utilization as a function of DAP capacity for network sizes of 110–664 nodes under two hop-distance parametrizations.
In subfigure (a), using the balanced hop-distance thresholds ( m, m, m; see caption), DAP utilization decreases monotonically as capacity increases. For the 110-node network, utilization drops from approximately 26% at capacity 5 to 15% at capacity 30. In contrast, the 664-node scenario begins at around 88% and falls to 52% over the same range. This behaviour reflects fewer sensors per DAP at higher capacity, thereby reducing the per-device load while maintaining overall coverage.
In subfigure (b), under the more permissive hop-distance regime ( m, m, m), the utilization curves exhibit a similar downward trend but start at slightly lower values—e.g., 22%→14% for 110 nodes and 79%→50% for 664 nodes—because longer allowable hops distribute traffic across more DAPs. These results confirm that our framework not only scales with capacity but can also be tuned via hop-distance parameters to adjust the DAP load distribution.
Figure 9 depicts the percentage of connected users as a function of DAP capacity for networks of 110–664 nodes under two hop-distance parametrizations.
In subfigure (a), under the balanced hop-distance regime ( m, m, m; see caption), the proportion of connected users increases steeply with capacity; at capacity 5, only 25–35% of users are connected, rising to 90–98% at capacity 30. Denser networks require higher capacity to reach equivalent coverage, reflecting contention for aggregation points in multi-hop relays.
In subfigure (b), using the permissive hop-distance regime ( m, m, m), all curves shift upward by 2–3 percentage points. Longer allowable hops improve connectivity at low capacities—e.g., 110-node coverage increases from 22% to 24% at capacity 5—and accelerate the climb to full coverage. It demonstrates the framework’s tunability: by adjusting hop-distance thresholds, operators can trade off relay distance against user reachability.
The collective results depicted in
Figure 6,
Figure 7,
Figure 8 and
Figure 9 confirm the effectiveness of the proposed framework across multiple performance dimensions. Notably, the optimization approach scales efficiently with increasing network density, provides energy-aware connectivity strategies under strict topological constraints, and adapts its structure based on DAP capacity and link feasibility. These outcomes demonstrate the model’s ability to balance trade-offs between infrastructure cost, energy usage, and user connectivity, reinforcing its practical value for real-world urban deployments of smart metering systems.
5. Discussion
While the proposed methodology demonstrates improvements in connectivity, scalability, and energy efficiency, certain limitations must be recognized. Validation is restricted to Jackson Heights, which may not capture the variability of other cities [
10,
20]. The comparison against a capacitated set-cover heuristic addresses a canonical optimization baseline and its known limitations and scalability trade-offs [
4,
5,
6], but broader comparisons remain future work. Claims on generalizability are therefore limited to the studied morphology, with external validity to be tested in additional districts [
11,
19].
In addition to the random baseline, it is compared against a capacitated set-cover heuristic that reflects a recognized coverage/capacity approach [
4,
5,
6]. The present framework builds on this family by integrating georeferenced constraints and hybrid routing over the selected sets. While exact MILP formulations and clustering–routing hybrids remain future comparisons, the current evidence situates our method within an established optimization lineage without overstating generality.
A further limitation of this work is that the validation was conducted exclusively in the Jackson Heights district of Queens, New York. Although this area represents a dense and irregular urban morphology, it may not fully capture the diversity of conditions encountered in other metropolitan contexts. To strengthen generalizability, our framework is explicitly parametrized with distance thresholds, DAP capacity, and link-cost factors that can be tuned for other cities with different densities or layouts. Future applications will test this adaptability in urban centres with contrasting grid-like or radial structures, thereby complementing the present case study [
11,
20].
The algorithm developed in this research addresses the design of wireless sensor networks for water telemetry, taking into account real spatial constraints and a georeferenced infrastructure. Unlike approaches that operate on synthetic simulations with dimensionless variables, the proposed methodology is built from urban data obtained directly from OpenStreetMap layers [
21], allowing node layout, communication routes, and aggregator node selection to respond to the physical conditions of the territory.
The process integrates clustering, coverage, and routing techniques within a coherent framework that reflects the deployment conditions of smart monitoring systems [
26]. Clustering using k-medoids enables the adequate management of the spatial density of meters, while the selection of aggregators using a greedy set-cover heuristic reduces redundancy and optimizes resource utilization. Route calculation using a modified minimum path algorithm ensures that transmission paths respect both capacity constraints and distance limits, ensuring efficient and reliable data flow [
22,
23].
This strategy focuses on realistic deployments, identifying where aggregators should be located, which meters they connect to, and how routes reach the base station.
From an applied standpoint, platforms for smart water monitoring that couple LoRaWAN backhaul, gateway management, and cloud visualization demonstrate the operational context in which connectivity-oriented topologies are deployed [
11,
18,
27]. Within such contexts, our results inform where to activate aggregation points, how to balance multi-hop routes under capacity and distance constraints, and how to identify high-load corridors for phased rollouts. It focuses the discussion on implications and applicability (deployment planning, cost phasing, and bottleneck diagnosis) rather than restating claims about novelty [
19,
20].
An additional consideration relates to the external validity of the results. The present validation was carried out exclusively in the Jackson Heights district, which captures the characteristics of a dense and irregular morphology but does not necessarily represent other urban layouts. Differences in street topology, block size, or building density could affect cluster compactness, feasible distances between Data Aggregation Points (DAPs), and the performance of multi-hop links. These factors introduce threats to validity that must be explicitly recognized when interpreting the findings.
To make the framework transferable, it outlines a protocol that requires no modifications to the code base, but only reparametrization of inputs. The steps are as follows: (i) ingest city-specific OpenStreetMap layers and regenerate the street interpolation with an adequate spacing ; (ii) re-cluster meters with k selected so that the median cluster radius remains below 0.5–0.8 of the intended ; (iii) set DAP capacity according to local utility constraints, typically between 10 and 30 meters per DAP; (iv) calibrate hop-distance thresholds, starting from m and adjusting them in proportion to average block length; (v) run the capacitated set-cover and routing stages; and (vi) validate the resulting topology against acceptance bands of path length below 300–400 m, connectivity above 90%, DAP utilization between 50 and 70%, and feasible energy use.
The scope of our claims is therefore limited to morphologies comparable to Jackson Heights. While the proposed methodology is parametrizable and adaptable, its empirical performance in grid-like or radial cities remains to be confirmed through future applications [
11,
20].
6. Conclusions
A connectivity-oriented optimization framework for urban smart water metering has been evaluated, which integrates clustering, a capacitated set-cover stage, and routing over OpenStreetMap geospatial data. In the Jackson Heights case study, the framework achieved consistent gains in connectivity, energy efficiency, and scalability under realistic constraints.
Simulation results across populations ranging from 110 to 664 sensor nodes demonstrate sustained improvements in network efficiency. The average end-to-end routing distance was reduced from over 700 m to below 300 m as Data Aggregation Point (DAP) capacity increased from 5 to 30, while the percentage of connected users rose from approximately 25% to more than 95%. Additionally, total energy consumption remained within feasible limits, reaching a maximum of 4.2 kWh under permissive routing regimes. The system’s adaptive behaviour—where active DAP utilization drops from 88% to 52% as capacity increases—confirms its suitability for gradual and cost-effective deployments.
The model is parametrizable for various communication standards, including IEEE 802.15.4 and LoRaWAN, and offers tunable thresholds for link distance, capacity, and technology-specific constraints. Georeferenced visualizations further enable the identification of bottlenecks, high-traffic corridors, and unused infrastructure, supporting informed decisions in progressive network rollouts.
From a practical perspective, the results indicate that utilities could achieve cost savings by activating only the necessary subset of DAPs, thereby avoiding redundant infrastructure. The framework also supports phased deployment strategies, where capacity can be progressively increased as user demand grows. Compared to conventional approaches [
4,
12], this adaptability enhances feasibility for real operators facing budgetary or spatial constraints, positioning the methodology as a viable alternative for incremental modernization of urban water services [
18].
Future research directions include extending this framework to hybrid multi-technology environments, incorporating end-to-end latency metrics and real-time reliability constraints, and developing predictive modules for overload detection and fault anticipation. Moreover, its applicability can be explored in other urban domains such as power distribution, mobility analytics, or environmental monitoring, where adaptive, scalable, and cost-efficient network topologies remain critical.
Overall, the proposed framework demonstrates robustness within the studied urban morphology and practical deployment constraints. While the results are promising for Jackson Heights, their applicability to other city layouts remains to be confirmed through further validation. These findings suggest that the approach is a viable option for phased, cost-aware smart water metering deployments, provided that future studies corroborate its performance in diverse urban morphologies.
Therefore, it is possible to emphasize that the conclusions drawn in this study are restricted to dense and irregular morphologies similar to Jackson Heights. Although the framework is designed to be tunable and transferable, confirming its performance in grid-like or radial urban structures is left for future validation efforts.
