Highlights
What are the main findings?
- The global mobility network of smart-city researchers (2000–2020) is dense yet asymmetric, dominated by a few high-volume bilateral corridors.
- The system shifts from a largely U.S.-centric structure to a more multipolar configuration involving Europe, East Asia, and rising South–South exchanges (particularly within Asia).
- Mobility reflects a dual logic: territorial clustering and transregional innovation corridors, indicating geographic and institutional embeddedness.
- Spatial models show that urban “smart” performance depends on internal capacities, international inflows, and spatial spillovers across cities.
What are the implication of the main findings?
- Researcher mobility is central to shaping global knowledge hierarchies and urban innovation systems.
- Multipolar corridors broaden participation in smart-city knowledge production and redistribute influence across regions.
- Recognizing spatial spillovers underscores the interdependence of cities; policies that strengthen international collaboration and regional connectivity can enhance innovation outcomes.
Abstract
This study examines the global mobility of researchers in the smart city domain from 2000 to 2020, using inter-country and intercity affiliation data from the Web of Science. Employing network analysis and spatial econometric models, the paper maps the structural reconfiguration of scientific labor circulation. The results show that the international mobility network is dense yet asymmetric, dominated by a small set of high-frequency corridors such as China–United States, which intensified markedly over the two decades. While early networks were fragmented and polycentric, the later period reveals a multipolar configuration with significant growth in South–South and intra-European exchanges. At the city level, Beijing, Shanghai, Wuhan, and Nanjing emerged as central nodes, reflecting the consolidation of East Asian hubs within the global knowledge system. Mesoscale community detection highlights the coexistence of territorially embedded ecosystems and transregional corridors sustained by thematic and reputational affinities. Growth decomposition indicates that high-income countries benefit from both talent retention and international inflows, while upper-middle-income countries rely heavily on inbound mobility. Spatial regression and quantile models confirm that economic growth and baseline scientific visibility remain robust drivers of urban smart city performance. In contrast, mobility effects are context-dependent and heterogeneous across city positions. Together, these findings demonstrate that researcher mobility is not only a vector of knowledge exchange but also a mechanism that reinforces spatial hierarchies and reshapes the geography of global smart city innovation.
1. Introduction
With the accelerating pace of urbanization and industrialization, cities worldwide are grappling with increasingly complex and interdependent challenges. Demographic pressures, population aging, environmental degradation, traffic congestion, energy insecurity, and governance fragmentation are no longer isolated issues but part of an interwoven set of urban crises [1,2,3,4,5]. These pressures have exposed the structural limits of expansion-led development models and underscored the urgent need for innovation-oriented, integrated forms of governance. Against this backdrop, the “smart city” paradigm has emerged as a forward-looking framework to strengthen resilience, sustainability, and efficiency through digital technologies, data infrastructures, and collaborative governance [6,7,8,9]. Yet contemporary scholarship increasingly emphasizes that smart cities are not simply technological systems but socio-technical knowledge ecosystems whose vitality depends as much on human capital and cross-disciplinary expertise as on infrastructure [10].
Within this broader understanding, researcher mobility acquires particular significance. Beyond its contribution to scientific productivity, mobility intersects with fundamental debates over what constitutes “smartness” in urban contexts. It does so in at least three ways. First, mobility enables knowledge co-production by facilitating the circulation of tacit expertise, experimental practices, and applied solutions across urban and national boundaries, thereby reinforcing collaborative innovation ecosystems [11,12]. Second, the movement of researchers underpins participatory governance, as mobile expertise contributes to open data initiatives, policy experimentation, and stakeholder engagement that foster more adaptive and inclusive governance [13,14]. Third, the diversity and redundancy generated by cross-city researcher flows enhance urban resilience, equipping cities with the cognitive and institutional resources to confront external shocks such as pandemics or climate change [15,16]. Taken together, these perspectives position researcher mobility not merely as a mechanism for producing knowledge but as an essential component of the wider innovation paradigm that defines the smart city.
Highly skilled professionals—scientists, engineers, planners, data specialists, and policy designers—are central to this process [17,18,19]. Their ability to work across disciplinary and institutional boundaries directly shapes urban capacity to respond to complexity and uncertainty [20,21]. As both generators and carriers of knowledge, their geographic mobility determines how ideas, practices, and norms diffuse across urban systems. Mapping these flows is therefore indispensable for understanding the spatial organization of smart city expertise and for identifying how mobility reinforces or reconfigures global patterns of knowledge production.
Despite these insights, the human dimension of smart urbanism remains underdeveloped. As Han and Hawken argue [22], most smart city studies privilege infrastructure and performance metrics, often overlooking the social and institutional underpinnings of knowledge circulation. Conversely, the growing literature on scientific mobility has revealed essential patterns of concentration, stratification, and core–periphery dynamics [23,24,25,26,27], but it has typically been discipline-agnostic or focused narrowly on STEM fields. This leaves critical gaps in understanding how applied, interdisciplinary expertise—particularly in smart city research—circulates globally, which actors gain most from mobility, and how institutional prestige, regional capacity, and governance openness condition these flows. Moreover, little is known about whether mobility in this field mitigates or reproduces global hierarchies of knowledge production.
To address these gaps, this study constructs a global directional mobility network of researchers active in smart city scholarship by tracing inter-institutional affiliation chains. Using a multi-scalar analytical framework, we (1) characterize the stratified and directional structure of researcher mobility at the national scale; (2) identify mesoscale communities embedded in global mobility flows; (3) examine how these patterns shape geographic disparities in the growth of scientific output; and (4) assess whether structural shifts in international mobility contribute to advancing smart city development across urban systems worldwide. By highlighting both the “spatial winners” and those left behind in the circulation of expertise, the study contributes to debates on urban innovation policy and the geography of knowledge production, while offering a novel perspective on how the mobility of human capital underpins the diffusion and consolidation of emerging innovation paradigms in cities.
2. Materials and Methods
2.1. Data Source and Pre-Processing
This study draws on bibliometric data retrieved from the Web of Science (WoS) Core Collection to analyze the spatial mobility of researchers in the field of smart cities. A domain-specific topic filter was constructed to identify relevant publications, combining core urban concepts with functional smart technologies. The exact query applied to the topic field (TS)—which searches titles, abstracts, and author keywords—was as follows: TS = (“smart city” OR “smart cities” OR “smart urban” OR “intelligent city” OR “digital city” OR “ubiquitous city” OR “connected city” OR “resilient city”) AND (“smart grid” OR “smart mobility” OR “smart transport” OR “smart building” OR “urban IoT” OR “urban sensing” OR “digital twin” OR “cyber-physical systems” OR “urban big data” OR “urban AI” OR “urban data analytics” OR “smart governance” OR “urban governance” OR “smart planning” OR “e-governance” OR “urban infrastructure” OR “intelligent infrastructure” OR “smart environment” OR “urban sustainability” OR “climate-smart city”).
This study utilizes a curated global publication dataset retrieved from the Web of Science Core Collection, encompassing journal articles and reviews published between 2000 and 2023. To ensure comprehensive disciplinary coverage, records indexed in SCI-Expanded, SSCI, and ESCI were included, resulting in a total of 4373 publications explicitly related to the smart city domain. The search strategy employed thematic keyword filtering and retained only documents with complete author-affiliation metadata, thus ensuring traceability of institutional and spatial transitions. Although the data retrieval was conducted up to 2023 to provide comprehensive coverage of bibliographic records, the analytical window was deliberately restricted to 2000–2020. This cut-off was chosen to maintain consistency with the Smart City Innovation Index (available for 2010 and 2021) and to avoid distortions introduced by the COVID-19 pandemic after 2020, which substantially disrupted patterns of international researcher mobility.
To identify individual researchers and track their career mobility, a multi-step author disambiguation process was implemented. This involved the integration of persistent identifiers (e.g., ORCID, ResearcherID) when available, supplemented by heuristic name-matching algorithms that accounted for co-authorship patterns, publication sequences, and institutional co-occurrence. Ambiguities in name variants were resolved through temporal continuity and co-author overlap. Following disambiguation, a total of 52,751 unique researchers were identified.
Affiliation data were standardized using authoritative institutional registries, including the Global Research Identifier Database (GRID), ROR, and RINGGOLD. This ensured consistency across spelling variants, multilingual naming, and abbreviation patterns. A tiered rule-based matching procedure was used for affiliations lacking persistent identifiers, incorporating email domains, publication counts, and city-level address parsing.
Career trajectories were reconstructed by chronologically linking authors to their institutional affiliations over time. A mobility event was defined as a change in the primary institutional affiliation across successive years, subject to three filtering conditions: (1) affiliations shorter than one year were excluded to reduce noise; (2) parallel affiliations were resolved by assigning the most frequently occurring institution; and (3) only one transition per year was retained to ensure comparability across individuals. This approach enables the construction of time-sliced global mobility networks, with directed edges representing cross-border institutional transitions in the periods 2000–2010 and 2010–2020.
All affiliations were geo-referenced to the city and country level using standardized global gazetteers, enabling the construction of multi-scale intercity and intercountry mobility networks for subsequent spatial analysis.
The dependent variable, Smart City Rank Change, was derived from the Innovation Cities™ Index published by 2thinknow in 2010 and 2021. This index ranks over 500 global cities based on indicators related to innovation infrastructure, digital readiness, governance, and cultural capacity. The change in rank between the two periods serves as a proxy for long-term shifts in cities’ smart development performance.
2.2. Complex Network Analysis
Based on the extracted affiliation transition data, we construct a directed mobility network of researchers in the smart city field, capturing mobility at the institutional, city, and country levels. To characterize the hierarchical structure and nodal influence within the mobility network, we employed PageRank centrality—a widely adopted algorithm for assessing the relative importance of nodes in a directed network. Unlike degree-based measures, PageRank accounts not only for the quantity of incoming links but also for the quality of the sources from which they originate, thereby offering a more nuanced estimation of institutional prestige and cumulative attractiveness in researcher flows.
In the context of mobility networks, a node (e.g., a university or country) with a high PageRank is not merely one that receives a large number of incoming researchers, but rather one that attracts researchers from already influential or highly connected nodes. This recursive property aligns well with the cumulative advantage theory of academic prestige and institutional stratification.
The PageRank score PR (i) for node i is computed as follows:
In this formula, represents the total number of nodes in the network, and is the damping factor, commonly set to 0.85, which accounts for the probability that a random walker continues following directed edges rather than jumping to a random node. The set includes all nodes with outbound edges pointing to node iii, and denotes the out-degree of node , that is, the number of outbound links from . The term captures the probability contribution from each upstream node, reflecting how influence is transmitted through the network. This recursive structure allows PageRank to identify institutions that attract many connections and maintain strategic positions within hierarchically structured flows.
To investigate the structural composition of the mobility network, we applied the Louvain community detection algorithm, one of the most widely used and computationally efficient methods for identifying modular structures in large-scale complex networks. This algorithm operates by iteratively grouping nodes to maximize intra-community connectivity and minimize inter-community links, thereby optimizing the modularity score. It enables the detection of cohesive subgroups—such as clusters of institutions or countries—characterized by dense internal mobility and sparse external flows.
In knowledge-intensive domains like smart cities, where research activities and personnel mobility frequently transcend administrative boundaries, community detection provides critical insights into meso-scale clusters and regional mobility regimes [28,29]. These meso-level structures offer a valuable lens through which to interpret decentralized patterns of talent exchange and collaborative concentration beyond national hierarchies.
The modularity index (Q) is commonly used to evaluate the quality of the resulting partition. A value of Q approaching 1 indicates a strong and well-defined community structure, whereas values near 0 suggest a more random or unstructured network. The modularity index is defined as follows:
In the formula, represents the total number of edges in the network, is the network’s adjacency matrix, and and are the degrees of nodes, respectively. The Kronecker delta function equals 1 if nodes are in the same community; otherwise, it is 0. By optimizing this modularity function, the Louvain method reveals emergent structures in researcher mobility that may correspond to regional innovation ecosystems, institutional alliances, or mobility corridors in the smart city domain.
2.3. Decomposing Scientific Output Growth by Researcher Mobility
To analyze the structural drivers of national scientific output growth, this study employs a decomposition framework that attributes changes in output to three key mobility groups: stationary, domestic mobile, and international mobile researchers. This approach builds upon prior studies that emphasize the role of cross-border and internal mobility in shaping national research capacities [30,31]. Similarly to classical growth accounting logic, such decomposition allows us to isolate the contributions of different researcher flows to overall output expansion.
To evaluate how different types of researcher mobility contribute to the growth of scientific output at the national or institutional level, we apply a growth accounting framework that decomposes the change in scientific productivity into four components related to mobility. This approach enables us to isolate the marginal contributions of stationary, domestic, and international mobile researchers, as well as account for potential losses due to international outflows. denotes researchers who remain in the same city (or country) across two consecutive periods; represents domestic movers who change their affiliation across cities within the same country; refers to international inflows—researchers who enter from abroad; denotes international leavers who were affiliated with a country in the previous period but moved abroad before the current period.
The total national output in the base period (2000–2010) is given by the following:
The total scientific output of a country or city in the base period (e.g., 2000–2010), denoted as , is expressed as follows:
The output in the subsequent period (2010–2020), , is
The overall scientific output growth rate is then computed as follows:
This expression can be decomposed into four interpretable growth components:
In the formula, represents growth attributable to stationary researchers; represents contributions from researchers who moved between domestic cities; accounts for additional output brought by international inflows; and represents the loss associated with international outflows.
To compare cities of varying initial sizes, we compute a weighted growth decomposition:
where
: this represents the initial shares of each researcher group in the city’s baseline output.
This decomposition approach allows us to interpret which mobility types are the primary drivers of scientific output expansion or contraction in each region.
2.4. Empirical Strategy
This study employs four econometric models to estimate the effects of scientific capacity, economic development, and talent mobility on changes in smart city rankings: ordinary Least Squares (OLS) regression is used as a baseline to estimate average marginal effects under the assumption of spatial independence. Spatial Autoregressive (SAR) and Spatial Error Model (SEM) specifications are estimated to account for spatial dependence in the dependent variable and error term, respectively. The Spatial Durbin Model (SDM) is estimated using the GM-Combo (Generalized Method of Moments) approach to capture both endogenous spatial lags and spillover effects from neighboring cities. Quantile Regression is applied to explore heterogeneous effects across the conditional distribution of ranking change, providing insights into variation across different city tiers.
3. Results
3.1. Multi-Scalar Patterns of Researcher Mobility
The international mobility network of smart-city researchers is dense yet highly asymmetric, with a limited number of high-frequency bilateral corridors accounting for a disproportionate share of global flows (Figure 1a,b). During 2000–2010, the most prominent routes were from China to the United States (215 moves), from the United States to China (175), and from the United States to the United Kingdom (86), underscoring the dual role of the United States as both a principal destination and a key source of mobile scientific talent (Figure 1a). By 2010–2020 these exchanges intensified, with the China–United States corridor rising to 337 moves and the reverse flow to 288. U.S. linkages with the United Kingdom (144), Italy (110), and Germany (104) also expanded, indicating a diversification of transatlantic exchanges beyond the traditional Anglophone axis (Figure 1b). Figure 1c provides a comparative view of the top 15 bilateral flows across decades, with annotated percentage growth, revealing broad increases and particularly rapid expansion along several Europe–U.S. routes.
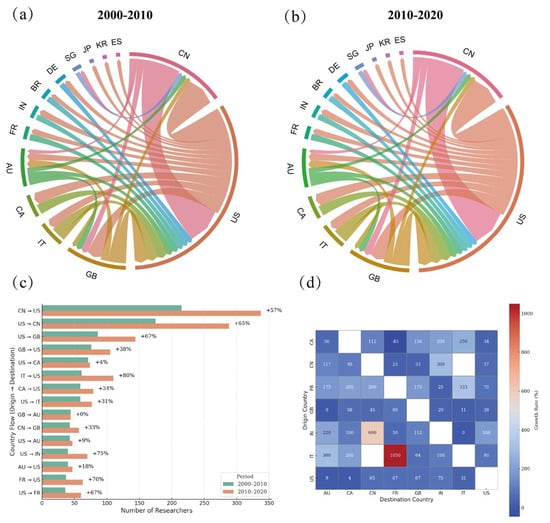
Figure 1.
Global Inter-Country Researcher Mobility in the Smart City Domain. (a,b) Chord diagrams of inter-country researcher flows for 2000–2010 and 2010–2020, respectively; chord thickness indicates flow volume (c). Top 15 bilateral flows by volume in each decade (two bars per pair) with the percentage change annotated (d). Growth-rate heatmap of bilateral flows (row = origin, column = destination): each cell reports the percentage growth from 2000–2010 to 2010–2020. Warmer colors denote faster growth; cooler/negative values indicate declines; diagonal cells are not applicable. Country abbreviations follow ISO Alpha-2 codes (examples used here: AU = Australia; CA = Canada; CN = China; FR = France; GB = United Kingdom; IN = India; IT = Italy; US = United States).
Growth-rate patterns in Figure 1d highlight where structural reconfiguration has been most pronounced. The steepest increases are observed on two axes: from Italy to France (+1050%) and from India to China (+600%). Additional strong gains appear in flows from France to Italy (+333%), from Canada to India (+250%), and from France to China (+200%), reflecting both intra-European consolidation and the emergence of new intercontinental linkages. South–North mobility remains robust, as illustrated by the flow from India to the United States (+188%), while new South–South and hybrid South–North corridors—such as from China to India (+300%), from India to France (+112%), and from India to Canada (+100%)—demonstrate increasing diversification. Mature corridors, including from China to the United Kingdom (+33%), from the United States to India (+31%), and from the United Kingdom to the United States (+38%), display more moderate growth, whereas a small number of connections either contracted or stagnated (e.g., from Canada to France, −45%; from the United Kingdom to Australia, 0%). Collectively, Figure 1a–d signal a transition from a predominantly U.S.-centric arrangement to a more reciprocal and multipolar configuration, with East Asia and continental Europe emerging as increasingly prominent hubs. (It should be noted that very large percentage changes, such as the flow from Italy to France, partly reflect the low baseline of 2000–2010.)
Figure 2a,b illustrate the evolution of global intercity researcher mobility in the smart city domain over two consecutive decades. In the revised Discussion, we explicitly link the persistent low centrality of African, Latin American, and Southeast Asian cities to debates on global knowledge peripheries and uneven geographies of innovation. We draw on recent literature on structural inequalities in science to emphasize how mobility often reproduces, rather than alleviates, global disparities. This framing broadens the implications of our findings from smart city studies to development geography and the political economy of knowledge production.
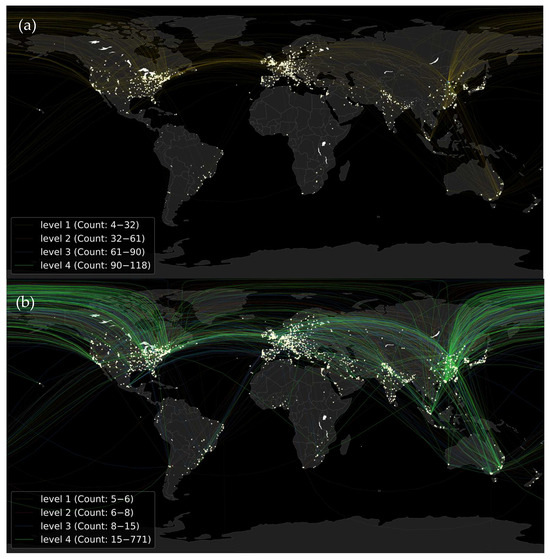
Figure 2.
Evolution of the global mobility network in smart city research: (a) 2000–2010, (b) 2010–2020.
During 2000–2010, the global network remained fragmented and polycentric, with no single region exercising absolute dominance. Although exchanges among major Chinese cities such as Beijing–Shanghai (117 vs. 105), Beijing–Nanjing (118 vs. 115), and Beijing–Wuhan (91 vs. 79) were already highly frequent, comparable bidirectional corridors emerged elsewhere. In the transatlantic sphere, the Paris–Montreal corridor (89 vs. 88) reflected balanced mobility anchored in the French-speaking academic community, while the Mequon–Montreal link (105 vs. 97) indicated active cross-border exchanges within North America. In Asia, flows between Singapore–Beijing (86 vs. 83) and Hong Kong–Beijing/Shanghai (81 vs. 76; 55 vs. 50) highlighted the region’s early role as a connector between Southeast and East Asia. Domestic backbones were also evident in Europe and Oceania, including Barcelona–Madrid (47 vs. 44), Zurich–Lausanne (45 vs. 41), Berlin–Munich (42 vs. 41), and Sydney–Canberra (46 vs. 45), underscoring the significance of national scientific hubs. Overall, the early mobility system was shaped by reciprocal regional exchanges rather than hierarchical dominance, indicating that the global researcher mobility network in this field was still in a formative phase. Despite the emergence of strong bilateral links, the system lacked a clear global core. Instead, multiple regional corridors coexisted, with London–Paris, New York–Toronto (via Montreal), and Tokyo–Seoul forming the principal transnational axes across Europe, North America, and East Asia. Beijing’s rise as both a source and destination city marked China’s initial integration into the global scientific system, though its role remained more regional than global during this period.
By 2010–2020, the global network exhibited signs of reorganization and multipolar expansion. In East Asia, particularly within China, intercity flows such as Beijing–Shanghai (771 vs. 750), Beijing–Nanjing (562 vs. 528), and Beijing–Wuhan (553 vs. 543) dominated the top ranks, reflecting a high level of national integration. Across the Atlantic and within Europe, balanced reciprocal ties persisted—for example, Paris–Montreal (96 vs. 88) continued to anchor the Euro–North American corridor, while Zurich–Lausanne (55 vs. 54) and Barcelona–Madrid (34 vs. 34) sustained the cohesion of Western European networks. In the Asia–Pacific, South Asia–Southeast Asia connections became increasingly prominent, most notably Lahore–Kuala Lumpur (283 vs. 275), reflecting intensified collaboration among emerging economies. Meanwhile, China–ASEAN and China–North America exchanges remained active—such as Singapore–Beijing (280 vs. 251), Beijing–Atlanta (182 vs. 175), Beijing–Los Angeles (71 vs. 66), Beijing–New York (52 vs. 45), and Beijing–London (70 vs. 56)—but their relative prominence was overshadowed by the surge of intra-Asian and South Asia–Southeast Asia corridors. Oceania maintained strong domestic arteries, notably Sydney–Canberra (153 vs. 150) and Sydney–Melbourne (54 vs. 62), while also strengthening links with East Asia (e.g., Sydney–Beijing 75 vs. 84; Sydney–Shanghai 85 vs. 92). Latin America and Africa, by contrast, continued to be characterized by relatively peripheral and fragmented linkages (e.g., Porto Alegre–Rio Grande 45 vs. 44; Rio Grande–Natal 28).
Taken together, the global system in 2010–2020 followed two parallel logics. On the one hand, the traditional Euro–North America–East Asia knowledge backbone continued to operate, increasingly marked by reciprocity. On the other hand, South–South and South–North corridors, such as South Asia–Southeast Asia and ASEAN–China, gained considerable weight, driving the system toward a multipolar, multi-corridor configuration rather than a single core-dominated hierarchy.
Figure 3 illustrates the geospatial distribution of PageRank centrality across cities involved in smart city research during 2000–2010 and 2010–2020. The PageRank metric, applied here at the city level, reflects the structural embeddedness of cities within the global mobility network of researchers, with higher values indicating stronger central positions in researcher circulation flows. A comparison of the two decades reveals a significant reconfiguration in the spatial architecture of global scientific centrality. In the early period (2000–2010), high-centrality cities were relatively dispersed across North America, Western Europe, and East Asia. Only a small number of cities—such as Beijing, London, Hong Kong, Paris, and Shanghai—exhibited strong PageRank values, while most others remained marginally embedded in the global network. The overall structure was fragmented and polycentric, with few dominant clusters.
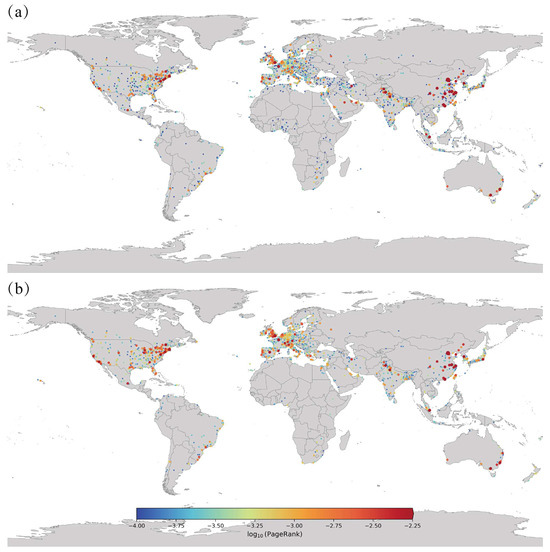
Figure 3.
Spatiotemporal Evolution of City Centrality in the Global Researcher Mobility Network (2000–2020). (a) PageRank distribution of cities from 2000 to 2010; (b) PageRank distribution from 2010 to 2020. Node color indicates log-transformed PageRank scores, with warmer colors representing structurally central cities in the global mobility network.
In contrast, the 2010–2020 period is marked by a clear intensification and regional consolidation of centrality, particularly in East Asia. Four of the top five cities by PageRank—Beijing, Shanghai, Wuhan, and Nanjing—are located in China, highlighting the rapid ascent of Chinese cities in the global knowledge circulation system. Beijing strengthened its dominant position with a PageRank score of 0.0571, significantly higher than any other city, followed by a notable rise in Shanghai and the emergence of inland hubs such as Wuhan and Nanjing. This shift reflects the impact of coordinated national strategies that have expanded research capacity and intercity mobility within China’s urban innovation system.
While cities in the United States and Europe retained their central roles—such as New York, Boston, London, and Paris—their relative centrality remained stable rather than expanding. The distribution of high-ranking cities in these regions did not change as substantially as in East Asia. The U.S. network maintained multiple high-centrality nodes, but there was no comparable emergence of new centers, suggesting a mature but less dynamic centrality structure during this period. The spatial visualization also underscores persistent disparities in global scientific centrality. Cities in Africa, Latin America, and parts of Southeast Asia generally exhibited low PageRank values across both periods. These areas remained weakly embedded in the mobility network, reinforcing a pattern of structural peripheralization in the global production and circulation of smart city knowledge. Despite broader participation, their scientific connections appear functionally limited and asymmetrically integrated into dominant hubs.
From a geographic perspective, the findings indicate a transition from a decentralized and moderately connected network to a more hierarchical, regionally concentrated system. East Asia—particularly China—has emerged as a new global center of smart city research, both absorbing and redistributing international researcher flows. This spatial reorganization aligns with broader patterns of academic agglomeration and reflects the deepening role of national urban systems in mediating global scientific mobility.
3.2. Quantifying the Mesoscale Structure of Researcher Mobility
Figure 4a presents the institutional community structure within the global researcher mobility network, specifically in the field of smart city research. Using the Louvain algorithm, we identify distinct mesoscale communities, each representing cohesive mobility subsystems shaped by thematic focus, regional policy environments, and historical academic ties.
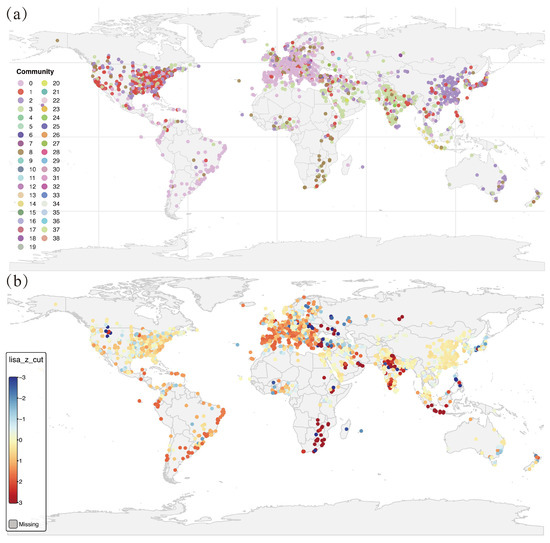
Figure 4.
Network-based and spatial clustering of institutional researcher mobility. (a) Communities of institutions detected by the Louvain algorithm based on inter-institutional researcher flows. Each color indicates a distinct community. (b) Local spatial autocorrelation (LISA Z-scores) of community structure. Red dots indicate significant hotspots (high-high clusters), and blue dots indicate significant coldspots (low–low clusters) at p < 0.05.
Community 0 forms a trans-regional core centered on France, Germany, and Italy, extending to the U.S. and India. This reflects a Euro-Atlantic innovation corridor with expanding South Asian linkages. In the smart city domain, this cluster is likely influenced by mature urban planning traditions in Europe and the increasing digital urbanism agendas of large Indian cities. Community 1, the largest in scale, is primarily U.S.-centric but incorporates key institutions from China, Japan, South Korea, and India. It represents the North America–Asia smart city mobility axis, where the U.S. continues to act as a global anchor, attracting and redistributing talent from technologically advanced and densely urbanized regions in Asia. The strong bilateral flows suggest a co-evolution of smart city technologies across major urban innovation hubs. Community 2 is predominantly composed of Chinese institutions (>85%), forming a nationally embedded mobility system. This reflects China’s centralized investment in smart city development, such as pilot zones and national innovation platforms, which encourage intra-national talent circulation. Despite limited outbound links, the dense internal flows suggest a self-sustaining scientific ecosystem in which talent mobility is domestically structured and policy reinforced. Community 3 connects India and Pakistan with the UK and the U.S., shaped by linguistic, historical, and institutional continuity rooted in Commonwealth systems. In the smart city context, this highlights how former colonial academic infrastructures continue to facilitate South–North knowledge exchange, particularly around urban governance and ICT infrastructure. Other communities, such as Community 8 and 14, exhibit looser structural cohesion. Their inclusion of institutions from Japan, Germany, and the U.S. suggests niche cross-national mobility circuits, possibly formed around specialized urban challenges (e.g., aging societies, resilient infrastructure) and topic-specific research consortia.
To examine whether these modular structures also align geographically, we conducted a LISA-based spatial autocorrelation analysis (Figure 4b). The global Moran’s I value of 0.163 (p < 2.2 × 10⁻¹⁶, Table 1) confirms significant spatial clustering, indicating that institutions in the same community are often geographically proximate. This reflects the territoriality of smart city knowledge systems, where regionally clustered cities share infrastructure standards, policy frameworks, and urban experimentation logics. Hotspot regions (high–high clusters) are observed in South Asia, Eastern Europe, and Southeastern Africa—regions actively promoting smart urban transformation through policy initiatives or donor-led development programs. In contrast, coldspots (low–low clusters) in Western Europe and East Asia reflect institutional differentiation and globally dispersed mobility preferences, typical of competitive, globally networked research environments. These findings reveal a hybrid spatial logic within global smart city research mobility. Some communities are territorially bounded and policy-integrated, while others transcend geography, anchored instead by shared technological paradigms or reputational affinity. This dual structure underscores the importance of both geographical embeddedness and network centrality in shaping the mobility of smart city researchers.

Table 1.
Global Moran’s I Test for Spatial Autocorrelation of Institutional Communities.
3.3. Geographical Patterns of Scientific Growth and Mobility Contributions
Building upon the descriptive analysis of global mobility patterns and institutional structures, this section shifts focus to the mechanisms through which researcher mobility contributes to national and urban scientific growth. To this end, we first decompose research output growth by mobility type—stationary researchers, domestic movers, and international inflows—highlighting cross-country differences in growth reliance (Figure 5). Subsequently, we examine how these structural dynamics influence urban innovation outcomes using a suite of spatial econometric models (Table 2 and Table 3) and quantile regressions (Figure 6). This analytical progression allows us to move beyond structural description and evaluate the causal significance and spatial heterogeneity of researcher mobility in shaping cities’ smart development trajectories.
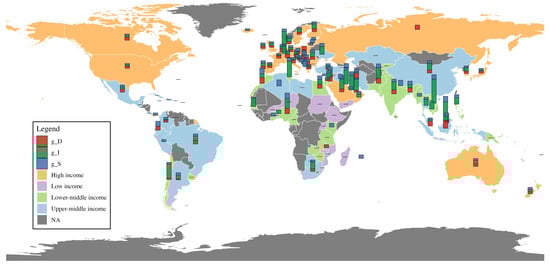
Figure 5.
Global Distribution of Scientific Growth Contributions by Mobility Type and Income Level.
Table 2.
Comparison of Model Fit across OLS, SAR, SEM, and SDM.
Table 3.
Estimated Effects of Scientific and Economic Variables on Smart City Ranking Change: OLS vs. Spatial Models.
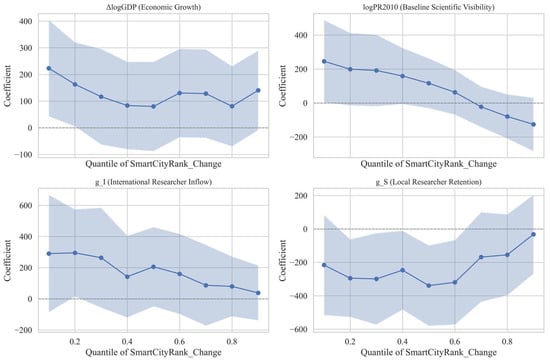
Figure 6.
Heterogeneous effects of key variables on smart city ranking change across quantiles (bootstrap 95% CI).
To examine the structural sources of national scientific output growth, we decompose total growth into three components: contributions from stationary researchers (g_S), domestically mobile researchers (g_D), and international inflows (g_I). The composition of these contributors varies significantly across income groups.
In high-income countries, growth is primarily driven by researcher retention and international recruitment. On average, stationary researchers account for 31.7% of growth, while international inflows contribute 28.9%; domestic mobility plays a relatively minor role (6.5%). For instance, the United States demonstrates a dual-channel growth dynamic, with g_S = 33.2% and g_I = 29.8%, indicating both strong internal stability and global attractiveness. Similarly, Germany and the United Kingdom show high contributions from international inflows (29.1% and 26.5%, respectively), reinforcing their positions as global scientific hubs. In upper-middle-income countries, growth is heavily reliant on international inflows (g_I = 47.8%), whereas stationary (9.7%) and domestic mobile (5.6%) researchers contribute modestly. China exemplifies this pattern with g_I = 48.3%, reflecting its aggressive global recruitment strategy. Brazil and South Africa also display substantial dependence on international talent (g_I = 43.7% and 45.9%, respectively), suggesting that their scientific expansion is externally driven. Lower-middle-income countries exhibit a more constrained structure. Here, stationary researchers contribute an average of 25.1%, while domestic (4.3%) and international mobility (2.9%) remain marginal. For example, India reports g_S = 27.4% but only g_I = 3.1%, indicating an endogenous, retention-based growth trajectory with limited global integration. Similar low-inflow and low-mobility profiles are observed in Vietnam and Nigeria. In low-income countries, scientific development remains severely restricted. Contributions from stationary, domestic, and international mobility are minimal (g_S = 2.3%, g_D = 0.8%, g_I = 0.1%), with countries like Ethiopia and Sudan deriving negligible benefits from researcher mobility. These patterns point to systemic barriers to talent attraction and retention, reinforcing global disparities in scientific capacity.
These results reveal a structural gradient in global research labor dynamics: high-income countries leverage both local stability and global inflows, upper-middle-income countries rely primarily on international recruitment, while lower-income countries depend on the residual retention of local talent with minimal mobility effects. This underscores the pivotal role of talent mobility infrastructure and national attractiveness in shaping long-term trajectories of scientific growth.
To further examine how such structural dynamics translate into differentiated urban innovation outcomes, a series of spatial regression models were estimated. Table 2 presents a comparative evaluation of four model specifications: Ordinary Least Squares (OLS), Spatial Autoregressive Model (SAR), Spatial Error Model (SEM), and the Spatial Durbin Model (SDM). Among them, the SDM outperforms all alternatives, as indicated by the lowest Akaike Information Criterion (AIC = 2600.682) and the highest pseudo-R2 (0.487). This suggests that both spatially lagged dependent variables and explanatory factors play significant roles in explaining changes in cities’ smart development rankings, and that spatial spillovers are integral to the geographic diffusion of innovation-related outcomes.
Economic dynamics emerge as a consistent and robust determinant of smart city ranking improvements. In particular, the coefficient for ΔlogGDP is positive and statistically significant across all model specifications (p < 0.05), indicating that cities experiencing higher levels of economic growth tend to exhibit more pronounced advancements in national smart city rankings. This association persists even after controlling for initial economic scale and spatial externalities. Baseline scientific capacity, captured by logPR2010, also exerts a positive influence on rank change, with significance retained in SAR, SEM, and SDM estimations. This suggests that cities with higher initial research visibility benefit from cumulative institutional advantages and reputational persistence in innovation-oriented evaluations.
The role of internal research labor markets is more ambiguous. While g_S (local researcher retention) consistently yields negative coefficients, none of the estimates attain conventional significance thresholds. This trend may reflect the limited contribution of endogenous talent circulation to outward-looking urban innovation performance. By contrast, g_I (international researcher inflow) is positively associated with ranking improvements, attaining marginal significance in the SAR model and SEM (p < 0.1). These findings point to the relevance of globally mobile talent as a complementary mechanism to enhance urban innovation capacity and reputational reach.
Evidence of spatial dependence is confirmed by the strongly significant spatial lag parameters in the SAR model and SDM (ρ = 0.65–0.84, p < 0.001). These results indicate that changes in smart city rankings are not confined within municipal boundaries but are significantly interdependent across proximate urban areas—likely through regional innovation spillovers, reputational benchmarking, or policy diffusion effects. In contrast, the spatial error model (SEM) performs less favorably, suggesting that spatial clustering in rank trajectories is structurally embedded in explanatory variables rather than merely resulting from residual correlation.
To explore the heterogeneity in the effects of explanatory variables across the distribution of smart city ranking changes, quantile regressions were estimated at nine deciles (0.1 to 0.9), with 1000 bootstrap replications to obtain robust confidence intervals under potential heteroskedasticity.
The estimated coefficients show considerable variation across quantiles, indicating that the impact of different structural factors on ranking improvement is not uniform. Economic growth (ΔlogGDP) is positively associated with rank advancement in the lower quantiles (Q10–Q30), where the effect is statistically significant. The influence declines in magnitude and significance toward higher quantiles. These results suggest that economic expansion plays a greater role in enhancing the ranking of cities at the lower end of the distribution. Baseline scientific visibility (logPR2010) has a significant positive effect in the lower and middle quantiles, but the effect weakens and becomes insignificant in the upper quantiles. This pattern is consistent with reputational path dependence, whereby cities with initial research visibility benefit from institutional recognition, although the marginal effect tapers off once a city reaches a higher status.
Internationally driven research output growth (g_I), which reflects the contribution of internationally mobile researchers to local scientific production, shows positive effects across most quantiles. The influence is more pronounced in the middle range (Q20–Q60), suggesting that international talent plays a role in improving urban research visibility, particularly in cities that are not yet at the top but have already moved beyond the lowest tier. The proportion of output growth driven by stationary researchers (g_S) exhibits consistently negative coefficients across the distribution. While none of the estimates are statistically significant at the 95% level, the direction of the effect may point to limitations faced by cities that rely primarily on locally retained research labor in gaining broader recognition.
Overall, the findings from the quantile regressions highlight the need to consider positional heterogeneity when examining changes in urban smart rankings. The determinants of rank improvement differ depending on a city’s baseline position, with international collaboration and economic growth playing varying roles along the distribution.
4. Discussion
This study offers a multi-scalar and multi-method investigation into the global mobility of researchers in the smart city domain. By integrating analyses of inter-country and intercity flows, PageRank-based centrality, community detection, and growth decomposition, the findings reveal a stratified yet dynamically evolving system of scientific labor circulation. The following discussion situates these results within broader theoretical frameworks and highlights their implications for urban innovation and global science geographies.
4.1. Re-Centralization, Multipolar Corridors and the Global City Network
The evolution of both inter-country (Figure 1) and intercity (Figure 2) mobility networks underscore a global shift from relatively decentralized academic flows toward regionally anchored, hierarchical structures. The dominant role of China—particularly Beijing, Shanghai, Wuhan, and Nanjing—reflects not only the rising scientific output of Chinese institutions but also the intensification of internal circulation within a nationally coordinated innovation system. These dynamics align with theories of urban economic complexity and agglomeration [32], which emphasize that complex knowledge activities increasingly concentrate in large urban hubs. The intensification of Sino–U.S. flows highlights the formation of strategic academic corridors, a pattern that complements—but also modifies—earlier work portraying the United States as the unilateral magnet of international talent [33,34]. Instead, the evidence points to a more reciprocal dynamic, reflecting China’s consolidation within the global science system [24,35].
4.2. Centrality, Peripheralization and Global Inequality
The PageRank-based centrality analysis (Figure 3) reveals an asymmetric landscape of global academic influence. Chinese cities have experienced a dramatic rise, while U.S. and European hubs have retained relatively stable positions. This indicates that national strategies—such as coordinated research investments and talent programs—can reshape global hierarchies of knowledge production. These findings extend theories of agglomeration and global city networks [26,36,37,38], while reinforcing the core–periphery model of global science [39,40].
Yet this rise in East Asia is paralleled by the persistent marginalization of cities in Africa, Latin America, and Southeast Asia, which remain weakly embedded in mobility flows despite gradual increases in research participation. Such patterns resonate with critical perspectives on global knowledge peripheries [41,42,43,44], which stress that mobility often reproduces, rather than alleviates, structural inequalities in science. Researcher mobility thus emerges as a dual mechanism: consolidating influence in established centers while relegating peripheral regions to secondary roles. Theoretically, this underscores that mobility cannot be viewed as a neutral driver of convergence but must be interpreted as a process shaped by institutional capacity, policy alignment, and systemic inequality.
4.3. Spatial Spillovers and Regional Innovation Systems
The spatial regression models confirm strong spillover effects, but their interpretation requires moving beyond statistical description toward geographic mechanisms. Two main channels appear most relevant. First, regional innovation systems (RISs) enable proximate cities to share infrastructure, talent pipelines, and institutional complementarities, generating path-dependent innovation growth [45,46,47]. Second, infrastructure connectivity—from high-speed rail to digital research platforms—reduces spatial frictions and fosters the development of cross-city innovation corridors [48,49,50].
Taken together, these mechanisms produce what Boschma terms relational proximities [51], where geographic and institutional linkages reinforce mobility-driven knowledge diffusion. Recent studies further emphasize that cross-border flows amplify local innovation performance when supported by strong infrastructures [52] and that institutional proximity enhances collaborative knowledge creation. In this light, our findings suggest that spillover effects in smart city research are highly context-dependent: they reinforce advantages where connectivity and complementarities exist, but they remain weak in structurally marginalized regions.
4.4. Limitations and Avenues for Future Research
Despite its contributions, this study has several limitations that should be acknowledged. First, the semantic boundaries of “smart city” research are fluid and evolve over time. Reliance on bibliometric retrieval may result in the inclusion or exclusion of adjacent domains. Future research could refine field delineation by integrating citation-based topic models or funding data to calibrate thematic boundaries more accurately.
Second, while our analysis ends in 2020 to avoid distortions caused by the COVID-19 pandemic, the bibliometric search was extended to 2023 for validation purposes. Future work could explicitly model pandemic-related disruptions to cross-border mobility and assess the trajectories of recovery, thereby capturing short-term shocks alongside long-term structural dynamics.
Third, causal inference remains a challenge. Cities with stronger innovative capacity may simultaneously attract mobile researchers and improve performance, raising concerns of endogeneity. Addressing this issue will require quasi-experimental designs, such as exploiting policy shocks (e.g., visa reforms or funding programs), natural experiments, or longitudinal researcher-level data (e.g., CVs or ORCID records) to identify causal mechanisms with greater precision.
Finally, our dataset does not allow us to distinguish researchers by career stage. As a result, the mobility of doctoral graduates entering employment markets may be conflated with other forms of mobility. Future studies could incorporate individual-level career data to disentangle stage-specific movements and assess their differentiated contributions to urban innovation trajectories.
5. Conclusions
This study has provided a multi-scalar examination of the global mobility of researchers in the smart city domain from 2000 to 2020. By analyzing inter-country and intercity flows, institutional community structures, and city-level centrality, the findings reveal a mobility system that is both stratified and dynamically evolving. The intensification of Sino–U.S. exchanges, the consolidation of Chinese cities as central hubs, and the emergence of intra-European and South–South corridors point to a transition from a predominantly U.S.-centered arrangement toward a more reciprocal and multipolar configuration. These dynamics highlight that smart city knowledge is increasingly co-produced through diversified global corridors rather than being confined to traditional Western hubs.
The results extend theoretical debates on scientific mobility and urban innovation by showing how mobility reinforces and reshapes the hierarchies of knowledge production. Researcher flows function not only as drivers of scientific productivity but also as mechanisms for sustaining innovation ecosystems, fostering collaborative governance, and enhancing resilience. Methodologically, the integration of growth decomposition, network centrality, and spatial econometrics illustrates how mobility operates as both a structural and causal determinant of urban innovation trajectories. Future research could build on these insights by incorporating career-stage-specific data, examining post-pandemic disruptions, and exploring how regional policies and infrastructures mediate global talent circulation. Such work will deepen our understanding of the role of researcher mobility in shaping the evolving geography of smart city innovation.
Author Contributions
Y.N.: Writing—review & editing, Writing—original draft, Visualization, Validation, Software, Methodology, Formal analysis, Data curation, Conceptualization. X.L.: Writing—review & editing, Writing—original draft, Supervision, Resources, Project administration, Funding acquisition, Data curation, Conceptualization. All authors have read and agreed to the published version of the manuscript.
Funding
This work was supported by the National Natural Science Foundation of China (NSFC) [Grant No. 42171455] and the General Research Fund of Hong Kong [Grant No. 15204121].
Data Availability Statement
The bibliometric data used in this study were obtained from the Web of Science Core Collection, which is a subscription-based database. Due to licensing restrictions, the raw data cannot be publicly shared. Researchers with appropriate access to Web of Science may reproduce the results by applying the search strategy and data processing procedures described in the Methods section.
Conflicts of Interest
The authors declare that they have no known competing financial interests or personal relationships that could have appeared to influence the work reported in this paper.
References
- Chang, Y.S.; Lee, Y.J.; Choi, S.S.B. Is there more traffic congestion in larger cities? Scaling analysis of the 101 largest U.S. urban centers. Transp. Policy 2017, 59, 54–63. [Google Scholar] [CrossRef]
- Liang, L.; Wang, Z.; Li, J. The effect of urbanization on environmental pollution in rapidly developing urban agglomerations. J. Clean. Prod. 2019, 237, 117649. [Google Scholar] [CrossRef]
- Lu, J.; Li, B.; Li, H.; Al-Barakani, A. Expansion of city scale, traffic modes, traffic congestion, and air pollution. Cities 2021, 108, 102974. [Google Scholar] [CrossRef]
- Luo, W.; Bai, H.; Jing, Q.; Liu, T.; Xu, H. Urbanization-induced ecological degradation in Midwestern China: An analysis based on an improved ecological footprint model. Resour. Conserv. Recycl. 2018, 137, 113–125. [Google Scholar] [CrossRef]
- Seto, K.C.; Güneralp, B.; Hutyra, L.R. Global forecasts of urban expansion to 2030 and direct impacts on biodiversity and carbon pools. Proc. Natl. Acad. Sci. USA 2012, 109, 16083–16088. [Google Scholar] [CrossRef] [PubMed]
- Bozkurt, Y.; Rossmann, A.; Pervez, Z.; Ramzan, N. Assessing data governance models for smart cities: Benchmarking data governance models on the basis of European urban requirements. Sustain. Cities Soc. 2025, 130, 106528. [Google Scholar] [CrossRef]
- Costales, E. Identifying sources of innovation: Building a conceptual framework of the Smart City through a social innovation perspective. Cities 2022, 120, 103459. [Google Scholar] [CrossRef]
- Huang, Y.; Xiong, N.; Liu, C. Smart city policies and corporate renewable energy technology innovation: Insights from patent text and machine learning. Energy Econ. 2025, 148, 108612. [Google Scholar] [CrossRef]
- Sugandha; Freestone, R.; Favaro, P. Social sustainability, smart cities and the Global South: Learning from the Indian experience. Cities 2025, 165, 106149. [Google Scholar] [CrossRef]
- McFarlane, C.; Söderström, O. On alternative smart cities: From a technology-intensive to a knowledge-intensive smart urbanism. City 2017, 21, 312–328. [Google Scholar] [CrossRef]
- Caragliu, A.; Del Bo, C.; Nijkamp, P. Smart cities in Europe. In Creating Smart-Er Cities; Routledge: Abingdon, UK, 2013; pp. 65–82. [Google Scholar]
- Dameri, R.P. Smart City Implementation; Progress in IS; Springer: Genoa, Italy, 2017. [Google Scholar]
- Meijer, A.; Bolívar, M.P.R. Governing the smart city: A review of the literature on smart urban governance. Int. Rev. Adm. Sci. 2016, 82, 392–408. [Google Scholar] [CrossRef]
- Mora, L.; Bolici, R.; Deakin, M. The first two decades of smart-city research: A bibliometric analysis. J. Urban Technol. 2017, 24, 3–27. [Google Scholar] [CrossRef]
- Batty, M. Inventing Future Cities; MIT Press: Cambridge, MA, USA, 2018. [Google Scholar]
- Meerow, S.; Newell, J.P.; Stults, M. Defining urban resilience: A review. Landsc. Urban Plan. 2016, 147, 38–49. [Google Scholar] [CrossRef]
- Albino, V.; Berardi, U.; Dangelico, R.M. Smart cities: Definitions, dimensions, performance, and initiatives. J. Urban Technol. 2015, 22, 3–21. [Google Scholar] [CrossRef]
- Harrison, C.; Eckman, B.; Hamilton, R.; Hartswick, P.; Kalagnanam, J.; Paraszczak, J.; Williams, P. Foundations for smarter cities. IBM J. Res. Dev. 2010, 54, 1–16. [Google Scholar] [CrossRef]
- Kitchin, R. The real-time city? Big data and smart urbanism. GeoJournal 2014, 79, 1–14. [Google Scholar] [CrossRef]
- Fabregue, B.; Portal, L.; Cockshaw, C. Using Smart People to Build Smarter: How Smart Cities Attract and Retain Highly Skilled Workers to Drive Innovation (Belgium, Denmark, the Netherlands, Poland). SSRN Electron. J. 2023, 7, 9–30. [Google Scholar] [CrossRef]
- Fitsilis, P. (Ed.) Building on Smart Cities Skills and Competences: Human Factors Affecting Smart Cities Development; Internet of Things; Springer: Cham, Switzerland, 2022. [Google Scholar] [CrossRef]
- Han, H.; Hawken, S. Introduction: Innovation and identity in next-generation smart cities. City Cult. Soc. 2018, 12, 1–4. [Google Scholar] [CrossRef]
- Ackers, L. Moving People and Knowledge: Scientific Mobility in the European Union1. Int. Migr. 2005, 43, 99–131. [Google Scholar] [CrossRef]
- Czaika, M.; Orazbayev, S. The globalisation of scientific mobility, 1970–2014. Appl. Geogr. 2018, 96, 1–10. [Google Scholar] [CrossRef]
- Liu, T.; Pei, T.; Fang, Z.; Wu, M.; Liu, X.; Yan, X.; Song, C.; Jiang, J.; Jiang, L.; Chen, J. Spatiotemporal mobility network of global scientists, 1970–2020. Int. J. Geogr. Inf. Sci. 2024, 38, 1991–2018. [Google Scholar] [CrossRef]
- Verginer, L.; Riccaboni, M. Cities and countries in the global scientist mobility network. Appl. Netw. Sci. 2020, 5, 38. [Google Scholar] [CrossRef]
- Na, Y.; Liu, X. Unveiling the core-periphery dynamics and driving factors of intercity scientific mobility in China. Habitat Int. 2025, 163, 103481. [Google Scholar] [CrossRef]
- Blondel, V.D.; Guillaume, J.-L.; Lambiotte, R.; Lefebvre, E. Fast unfolding of communities in large networks. J. Stat. Mech. Theory Exp. 2008, 2008, P10008. [Google Scholar] [CrossRef]
- Fortunato, S.; Hric, D. Community detection in networks: A user guide. Phys. Rep. 2016, 659, 1–44. [Google Scholar] [CrossRef]
- Franzoni, C.; Scellato, G.; Stephan, P. The mover’s advantage: The superior performance of migrant scientists. Econ. Lett. 2014, 122, 89–93. [Google Scholar] [CrossRef]
- Jonkers, K.; Tijssen, R. Chinese researchers returning home: Impacts of international mobility on research collaboration and scientific productivity. Scientometrics 2008, 77, 309–333. [Google Scholar] [CrossRef]
- Balland, P.-A.; Jara-Figueroa, C.; Petralia, S.G.; Steijn, M.P.A.; Rigby, D.L.; Hidalgo, C.A. Complex economic activities concentrate in large cities. Nat. Hum. Behav. 2020, 4, 248–254. [Google Scholar] [CrossRef]
- Kerr, S.P.; Kerr, W.R. Immigrant entrepreneurship. In Measuring Entrepreneurial Businesses: Current Knowledge and Challenges; University of Chicago Press: Chicago, IL, USA, 2016; pp. 187–249. [Google Scholar]
- Franzoni, C.; Scellato, G.; Stephan, P. International mobility of research scientists: Lessons from GlobSci. In Global Mobility of Research Scientists; Elsevier: Amsterdam, The Netherlands, 2015; pp. 35–65. [Google Scholar]
- Wagner, C.S.; Cai, X.; Baas, J. State-Level Representation of Chinese Scholars Mobility to and within the United States, 2009–2018. SSRN Electron. J. 2024. [Google Scholar] [CrossRef]
- Taylor, P.J.; Derudder, B. Porous Europe: European cities in global urban arenas. Tijdschr. Voor Econ. En Soc. Geogr. 2004, 95, 527–538. [Google Scholar] [CrossRef]
- Breschi, S.; Lissoni, F. Mobility of skilled workers and co-invention networks: An anatomy of localized knowledge flows. J. Econ. Geogr. 2009, 9, 439–468. [Google Scholar] [CrossRef]
- Carlino, G.; Kerr, W.R. Agglomeration and innovation. Handb. Reg. Urban Econ. 2015, 5, 349–404. [Google Scholar]
- Wagner, C.S.; Leydesdorff, L. Network structure, self-organization, and the growth of international collaboration in science. Res. Policy 2005, 34, 1608–1618. [Google Scholar] [CrossRef]
- Glass, C.R.; Cruz, N.I. Moving towards multipolarity: Shifts in the core-periphery structure of international student mobility and world rankings (2000–2019). High. Educ. 2023, 85, 415–435. [Google Scholar] [CrossRef]
- Ramos, F.R.; Uitermark, J. Has inequality grown or declined in global south Cities? Trends in occupational structure, education, and living standards. Habitat Int. 2025, 161, 103425. [Google Scholar] [CrossRef]
- Gomez, C.J.; Herman, A.C.; Parigi, P. Leading countries in global science increasingly receive more citations than other countries doing similar research. Nat. Hum. Behav. 2022, 6, 919–929. [Google Scholar] [CrossRef]
- Nielsen, M.W.; Andersen, J.P. Global citation inequality is on the rise. Proc. Natl. Acad. Sci. USA 2021, 118, e2012208118. [Google Scholar] [CrossRef]
- Connell, R. The northern theory of globalization. Sociol. Theory 2007, 25, 368–385. [Google Scholar] [CrossRef]
- Cooke, P. Regional innovation systems, clusters, and the knowledge economy. Ind. Corp. Change 2001, 10, 945–974. [Google Scholar] [CrossRef]
- Asheim, B.T.; Gertler, M.S. The geography of innovation: Regional innovation systems. In The Oxford Handbook of Innovation; Oxford University Press: Oxford, UK, 2006. [Google Scholar]
- Balland, P.-A.; Boschma, R.; Crespo, J.; Rigby, D.L. Smart specialization policy in the European Union: Relatedness, knowledge complexity and regional diversification. Reg. Stud. 2019, 53, 1252–1268. [Google Scholar] [CrossRef]
- Yao, L.; Li, J. Intercity innovation collaboration and the role of high-speed rail connections: Evidence from Chinese co-patent data. Reg. Stud. 2022, 56, 1845–1857. [Google Scholar] [CrossRef]
- Dong, X.; Zheng, S.; Kahn, M.E. The role of transportation speed in facilitating high skilled teamwork across cities. J. Urban Econ. 2020, 115, 103212. [Google Scholar] [CrossRef]
- Momenitabar, M.; Bridgelall, R.; Dehdari Ebrahimi, Z.; Arani, M. Literature Review of Socioeconomic and Environmental Impacts of High-Speed Rail in the World. Sustainability 2021, 13, 12231. [Google Scholar] [CrossRef]
- Boschma, R. Proximity and Innovation: A Critical Assessment. Reg. Stud. 2005, 39, 61–74. [Google Scholar] [CrossRef]
- Crescenzi, R.; Iammarino, S.; Ioramashvili, C.; Rodríguez-Pose, A.; Storper, M. The Geography of Innovation: Local Hotspots and Global Innovation Networks. SSRN Electron. J. 2023. [Google Scholar] [CrossRef]
Disclaimer/Publisher’s Note: The statements, opinions and data contained in all publications are solely those of the individual author(s) and contributor(s) and not of MDPI and/or the editor(s). MDPI and/or the editor(s) disclaim responsibility for any injury to people or property resulting from any ideas, methods, instructions or products referred to in the content. |
© 2025 by the authors. Licensee MDPI, Basel, Switzerland. This article is an open access article distributed under the terms and conditions of the Creative Commons Attribution (CC BY) license (https://creativecommons.org/licenses/by/4.0/).