Article

ENACT: Energy-Aware, Actionable Twin Utilizing Prescriptive Techniques in Home Appliances

by
Myrto Stogia
1,
Asimina Dimara
1,2,3,*,
Christoforos Papaioannou
1,2,
Orfeas Eleftheriou
4,
Alexios Papaioannou
3,*,
Stelios Krinidis
2,3 and
Christos-Nikolaos Anagnostopoulos
1
1
Department of Cultural Technology and Communication, Intelligent Systems Laboratory, University of the Aegean, 81100 Mytilene, Greece
2
Management Science and Technology Department, International Hellenic University, 65404 Kavala, Greece
3
Management Science and Technology Department, Democritus University of Thrace, 65404 Kavala, Greece
4
Code-Flow, 81100 Mytilene, Greece
*
Authors to whom correspondence should be addressed.
Smart Cities 2025, 8(5), 155; https://doi.org/10.3390/smartcities8050155
Submission received: 16 July 2025 / Revised: 12 September 2025 / Accepted: 15 September 2025 / Published: 22 September 2025
(This article belongs to the Section Applied Science and Humanities for Smart Cities)

Abstract

Highlights

What are the main findings?
  • A novel digital twin (DT) framework (ENACT) was developed, integrating real-time sensor data, spatial 3D modeling, and AI-based prescriptive maintenance strategies for household appliances.
  • Deployment across 20 homes over one year demonstrated strong usability (SUS: 80.5), user engagement, and a behavioral shift toward proactive appliance care, with energy savings of up to 30%.
What are the implications of the main finding?
  • Combining spatial visualization with AI-powered recommendations significantly enhances user awareness and engagement, bridging the gap between technical diagnostics and actionable behavior.
  • The ENACT system enables sustainable home appliance management by extending device lifespan, reducing energy consumption, and transforming maintenance into a user-centered, preventive practice.

Abstract

A significant portion of home energy consumption is due to concealed faults and the inefficient usage of home appliances, usually because of user ignorance and a lack of proactive maintenance strategies. In this paper, ENACT, a digital-twin-based system, is proposed as the solution that facilitates better user understanding, encourages sustainable maintenance practices for appliances, and provides prescriptive maintenance recommendations. With the integration of smart plugs, behavioral analysis, and a 3D spatial interface, ENACT offers real-time device monitoring while providing context-aware suggestions. The system was installed in 20 households over a 12-month period, with users engaging with both 2D and 3D models of their surroundings. The quantitative results, including an average System Usability Scale score of 80.5, and qualitative feedback demonstrated intense user engagement, with strong evidence of mindset shifts towards proactive maintenance behavior. The findings confirm that digital twin technologies, when combined with targeted guidance, can significantly improve appliance lifespans, energy efficiency, and user empowerment within homes.

1. Introduction

Buildings and cities are responsible for both our global energy consumption and C O 2 emissions, accounting for approximately 40% of global energy use and 36% of emissions [1]. This impact arises largely from the extensive and uncontrolled operation of home appliances. Addressing this challenge requires advanced technologies and strategies that optimize energy use in the residential sector. Therefore, by monitoring the consumption of devices and transforming the home into a smart home, a range of digital technologies, including the Internet of Things (IoT) and digital twins (DTs), can offer solutions to issues related to sustainability and energy management [2].
By applying a smart home appliance energy management system through maintenance strategies, optimal use is achieved. Regular maintenance of home appliances is essential to ensure their longevity, efficiency, and safety. Preventive actions such as filter cleaning, wear inspection, and scheduling regular inspections can help prevent unexpected breakdowns and unexpected repair costs [3]. Proper maintenance also ensures operation according to the factory specifications; reduces risks such as electrical faults and gas leaks [4]; and ultimately saves costs while promoting safer and more comfortable living environments. However, in practice, most users neglect maintenance, often replacing appliances instead of repairing them when their performance declines [5]. According to a survey of 617 respondents in Western Europe, 60% of them preferred not to have their defective appliance fixed, and the vast majority of household appliances were replaced when they showed performance impairments [6]. Although many users report being aware of maintenance practices, their actual behavior remains reactive, resulting in unnecessary energy losses and shortened appliance lifespans [7]. This gap mainly arises due to the lack of immediate and visual information on potential errors, repair needs, and the general operational history of appliances. In this context, ENACT aims to provide users with real-time, visualized feedback and a device history log to support preventive maintenance and early intervention.
A DT is a virtual representation of a physical object, process, or system that mirrors its real-world counterpart [8]. It is created using real-time data, simulations, and algorithms that allow for monitoring and optimization throughout the lifecycle of the physical entity. In smart homes, DTs integrate structural information, usage behaviors, and historical device data to continuously monitor appliances, predict faults, and maintain the optimal performance. By bridging technical diagnostics with user-facing insights, DTs offer a pathway to transform household maintenance into a proactive, user-centered process.
Despite the increasing deployment of DT technologies in smart home environments and the use of AI for predictive maintenance, current research largely treats user awareness, DT visualization, and prescriptive analytics as isolated modules. Most existing systems either focus on low-level anomaly detection using IoT data [9] or on enhancing user interfaces for smart home control [10]. What remains unresolved is the development of a unified, real-time, user-centered system that translates appliance-level sensor data into context-aware, prescriptive maintenance actions delivered through intuitive 3D environments [11]. Moreover, prior works often assume user compliance without evaluating behavioral changes. The lack of frameworks that close the loop between technical diagnostics and sustained user engagement impedes broader goals of energy efficiency and device longevity in residential settings [12].
Within this context, this work introduces ENACT, a comprehensive, behavior-aware DT framework that not only detects anomalies but also supports decision-making through actionable, personalized, and immersive feedback. ENACT integrates real-time sensor data with prescriptive intelligence and presents it through interactive 3D visualizations, bridging the technical and human layers of smart home maintenance. The key novelties of ENACT are as follows:
  • Hybrid Digital Twin Architecture: A modular DT system that integrates real-time telemetry with spatially contextual 3D models of the home environment;
  • Dual Prescriptive Intelligence Models (PRISM): Two specialized AI-driven models tailored to on-demand and continuous appliance operations, delivering actionable maintenance guidance;
  • An Immersive, User-Centered Feedback Loop: A behavior-aware interface that transforms diagnostics into intuitive 3D overlays and categorized alerts, improving user awareness and decision-making;
  • Contextual Integration of Data and Interaction: Bridging sensor-level insights with user behavior through spatial mapping and interactive prescription delivery.
The remainder of the paper is structured as follows: Section 2 reviews related work on appliance maintenance systems, user engagement in smart home environments, and digital twin technologies. Section 3 presents the architecture and components of the ENACT framework, detailing its integration of smart plugs, 2D/3D interfaces, and prescriptive analytics. Section 4 describes the experimental setup across 20 households, including the system deployment and data collection methodology. Section 4 outlines five representative use cases to illustrate the system behavior under various appliance conditions. Section 5 presents the results of the user evaluation, including quantitative usability metrics and qualitative feedback. Finally, the last section concludes this paper and discusses future directions for extending the framework’s capabilities.

2. Literature Review

The following section examines the existing literature regarding the evolving role of DTs in smart home environments (SHEs), focusing on their integration with IoT and Artificial Intelligence (AI) to improve device maintenance strategies. In addition, it explores the crucial differences between descriptive, predictive, and prescriptive maintenance techniques, emphasizing the advantages of prescriptive analytics in appliance maintenance. Finally, it discusses how AI-based recommendations can improve user awareness and decision-making, leading to more proactive and effective maintenance.

2.1. Digital Twins in Smart Home Environments

To improve the recognition of Activities of Daily Living (ADLs), a smart house DT was created [13]. This technology enables real-time behavior monitoring and analysis by generating a virtual image of the actual home environment. By improving monitoring and assistance for people with SHEs, this DT architecture shows promise for advancing assisted living and customized healthcare technology. Likewise, a vision for the integration of DT technology into smart spaces was created to enhance their functionality and management to propose a generic reference architecture comprising four layers: physical space, sensing infrastructure, network interfaces, and computational infrastructure [14]. To demonstrate its practicality, they presented a DT case study for the TellUs smart space at the University of Oulu in Finland, highlighting potential benefits at different ascendancy levels.
The development of advanced smart lighting systems today is demonstrated by the application of BP network technology to develop a smart home system model that ensures the reliability and integrity of the system while also improving the user experience and lowering costs [15]. A DT framework that mirrors the state and behavior of physical lighting devices was created. Sensors collect real-time data on the environmental conditions and user interactions, which are then processed to update the DTs. A design concept in which DTs are utilized to improve the development, monitoring, and optimization of home lighting solutions is also created by collecting data through IoT devices [10].
A capability-based framework for the development and evaluation of AI-driven DTs for smart homes classifies DTs into six capability levels (0 to 5), defining the level of intelligence, interactivity and autonomy that each DT can achieve [13]. Using AI models, data for diagnostics, predictions, or prescriptions are analyzed while the DT is progressively built from Levels 0 to 5. A framework that integrates Gated Recurrent Unit (GRU) neural networks with DT technology has been designed to optimize the data allocation and storage within IoT-enabled smart home environments to improve the efficiency of data management in smart home networks [16]. Researchers developed a DT model that mirrors physical IoT devices and their data interactions within a smart home. The proposed framework demonstrates significant improvements in managing the vast amounts of data generated by IoT devices in smart homes, contributing to a more responsive and efficient SHE.
More recent studies are in support of this view. Bouchabou created a smart home digital twin simulator for the discovery of activities of daily living [13]. Aghazadeh Ardebili et al. carried out a systematic review of DTs in smart energy grids and presented design and management issues [17]. Very recently, Palley et al. explored the integration of machine learning and DTs for smart building energy management [18]. These articles emphasize the heterogeneity of recent DT practices, against which ENACT moves forward with its prescriptive and user-oriented approach.

2.2. Prescriptive Maintenance Techniques

In recent years, predictive analytics has emerged as a transformative tool for the management and maintenance of home appliances in the context of smart homes and connected devices [19]. To assist consumers in minimizing the energy consumption of their home appliances and energy providers in planning and forecasting future energy demands better to support green urban development, predictive models based on data gathered from multiple sensors are proposed to model the energy usage of appliances in an IoT-based smart home environment [20]. In addition, dynamic changes in energy pricing, the energy output from renewable sources, and the household appliances that can participate in the energy optimization process are all taken into consideration in the proposal to optimize power use [21]. A proposed system was assessed in a Predictive Maintenance of Home Appliances inquiry using high-frequency vibration and current sensors installed in washing machines and refrigerators, able to foresee a machine’s maintenance needs concerning enhancing its efficiency and reducing costs [22].
The traditional reactive and preventive maintenance approaches have evolved into prescriptive maintenance. Traditional anomaly detection methods often struggle with two drawbacks: the variety in appliance behavior and the lack of labeled data for training. The authors suggest an unsupervised method that focuses on detecting extended operating cycles, suggesting possible problems, in order to overcome these restrictions [23]. The technique creates accurate datasets that show unusual patterns of energy use by modeling a variety of error situations, including minor and significant problems. The development of predictive maintenance plans is easier using these datasets, which are useful tools for training and assessing anomaly detection algorithms.
In order to enhance decision-making in the manufacturing process for electrical products, an extensive framework that incorporates demand forecasts and consumer segmentation is also suggested. The aim of this integration is to optimize manufacturing processes and align them regarding customer demands through the transition from traditional reactive techniques toward proactive, data-driven approaches [24]. In fact, traditional maintenance strategies frequently fail to preemptively address equipment failures, resulting in increased downtime and lower operational costs. The Holistic end-to-end Prescriptive Maintenance Framework (HeePMF) seeks to shift maintenance strategies from reactive and predictive approaches to a comprehensive prescriptive model that integrates data analytics, operational insights, and actionable recommendations to optimize maintenance processes [25].
Recent studies have expanded even further with the prescriptive maintenance approach. Mao et al. presented a DT-based approach in which real-time remaining useful life predictions were utilized in a stochastic optimization framework for low-risk dynamic decision-making for the maintenance of sophisticated cluster equipment [26]. Wang et al. proposed a Digital Twin O&M management platform from BIM data for vast underground spaces and achieved increased operational and energy efficiency [27]. Cespedes-Cubides and Jradi performed a systematic review of DT applications in building operations and maintenance and identified some applications in energy optimization, anomaly detection, and predictive maintenance for existing buildings [28]. These works present various prescriptive DT strategies, advancing ENACT’s contribution further as a prescriptive, user-centered DT framework.
In conclusion, prescriptive maintenance extends predictive maintenance by suggesting certain corrective actions in addition to predicting possible problems. It uses cutting-edge analytics, such as ML and AI, to evaluate data and provide the most efficient maintenance schedules. Despite the limitations that may occur, such as the extended complexity of the algorithms integrated with existing systems and the significant demands on computational resources to develop and maintain the analytical models, it is advisable to consider integrating both approaches. By leveraging the predictive capabilities and the actionable insights of prescriptive maintenance, comprehensive home appliance maintenance will be achieved.

2.3. Awareness and Decision-Making in Maintenance

Engaging occupants to make them aware of their energy-related behavior and the condition of their living environment has great potential to reduce the gap between the predicted and actual energy consumption in buildings [29]. By integrating resident involvement with perceptions connected to energy consumption, an approach that emphasizes improving building operations and engaging users to achieve energy efficiency without compromising historical integrity is proposed. Moreover, a user–stakeholder communication platform including a web-based application for reporting failures and damages to the building’s components and devices was developed and tested in the context of a complex university building [30]. Following the above, the researchers propose improvements to this approach based on a user-centered point of view by combining monitoring tasks (space use, occupants’ actions, and flows) with occupant awareness/engagement through management and communication platforms [31].
At the same time, advancements in the field of AI, specifically in the home appliance sector, can eliminate the existing gap in harnessing AI for enduring, multi-stage user engagement. A novel framework aiming to enhance sustainability in the home appliance sector is presented through advanced human–machine interaction aiming to transform appliances into intelligent agents that contribute to energy conservation and user education [32]. Correspondingly, research which emphasizes the transformative potential of combining AI with the IoT in residential settings not only enhances energy efficiency but also contributes to cost savings and environmental sustainability while focusing on more autonomous home optimization [33]. Researchers have proposed an innovative framework that synergizes AI and the IoT to enhance the energy efficiency of consumer devices in order to reduce energy waste, lower operational costs, and contribute to environmental sustainability [34]. For this scenario, the research has focused on a stronger user interface component where users can review and adjust the system recommendations.
By transforming passive users into active participants in maintaining the performance and lifespan of systems and equipment, user engagement is the key to the success of modern maintenance techniques. Through the evaluation of massive amounts of operational data and providing users with personalized, actionable information instantly, AI-driven suggestions improve this interaction. In addition to improving decision-making, these wise recommendations encourage user–technology cooperation and a sense of ownership.
In summary, the aforementioned literature illustrates the potential of DTs to enable real-time monitoring and context-aware simulation in smart homes, the transition from predictive to prescriptive maintenance through advanced analytics, and the crucial role of user awareness in prolonging device lifespans and promoting energy efficiency. However, despite these advances, an integrative framework that seamlessly combines DT, prescriptive analytics, and user-centered interaction strategies remains largely underdeveloped (Table 1). Existing approaches often treat these components in isolation, lacking a unified architecture that bridges operational intelligence with human decision-making in the home environment. This gap highlights the need for a comprehensive solution that monitors and analyzes device behavior while translating the findings into actionable, personalized maintenance recommendations through an intuitive digital interface. The present study aims to address this gap by proposing a hybrid DT-enabled maintenance ecosystem that incorporates real-time data collection, prescriptive insights, and active user participation to optimize household appliance management. Specifically, unlike predictive-only maintenance systems, which primarily forecast possible faults, ENACT’s prescriptive intelligence translates predictions into concrete context-aware maintenance actions. These actionable prescriptions are designed to prevent failures before they occur, changing the system from ‘anticipating errors’ to ‘actively preventing them’ through user-guided intervention.

3. Methodology

This section outlines the design and deployment of the ENACT framework across residential environments. It details the hardware and software components used, including smart sensors, the mobile interface, and the digital twin generation process. The methodology also covers user engagement protocols, data acquisition procedures, and system feedback mechanisms implemented over the course of the one-year field study.

3.1. An Overview of the ENACT Framework

The ENACT framework is a modular system that integrates real-time sensing, DT modeling, prescriptive analytics, and user-centered visualization to enhance appliance maintenance strategies in smart home environments. As depicted in Figure 1, the architecture is designed to close the loop between device operation, intelligent diagnosis, and actionable user guidance. At the core of ENACT is a DT that mirrors both the structural layout of the home and the operational state of individual appliances. The system is initiated through a user-driven modeling process, where the geometry of the home and the types of appliances are defined through a mobile interface. The 2D design, exported in structured JSON format, is then used to generate a spatially accurate 3D model, which serves as the visual layer of the digital twin.
Real-time operational data are collected via smart plugs installed on home appliances. These devices transmit usage metrics (e.g., power consumption, status) to a central processing unit, which synchronizes this information with the virtual twin. This live data stream enables two key capabilities: continuous status monitoring and advanced prescriptive analytics through AI models tailored to each type of appliance. The prescriptive layer is powered by AI tools that classify appliance behavior, detect anomalies, and generate maintenance recommendations based on operational history and deviations from learned patterns. These recommendations are visualized through the 3D interface and delivered to the user via the mobile application in an intuitive, context-sensitive format.
By combining spatial modeling, real-time data streams, intelligent diagnostics, and interactive visualization, ENACT transforms traditional reactive maintenance into a user-managed proactive system that extends the life of the appliance and improves safety and energy efficiency in residential environments.

3.2. The IoT Setup, Floor Plan Design, and Appliance Modeling

This subsection describes the technical setup of the IoT infrastructure, the user-driven 2D floor plan design process, and the spatial modeling of appliances within the ENACT framework. These components form the foundation for generating accurate and interactive digital twins of each household.

3.2.1. Smart Home IoT Infrastructure

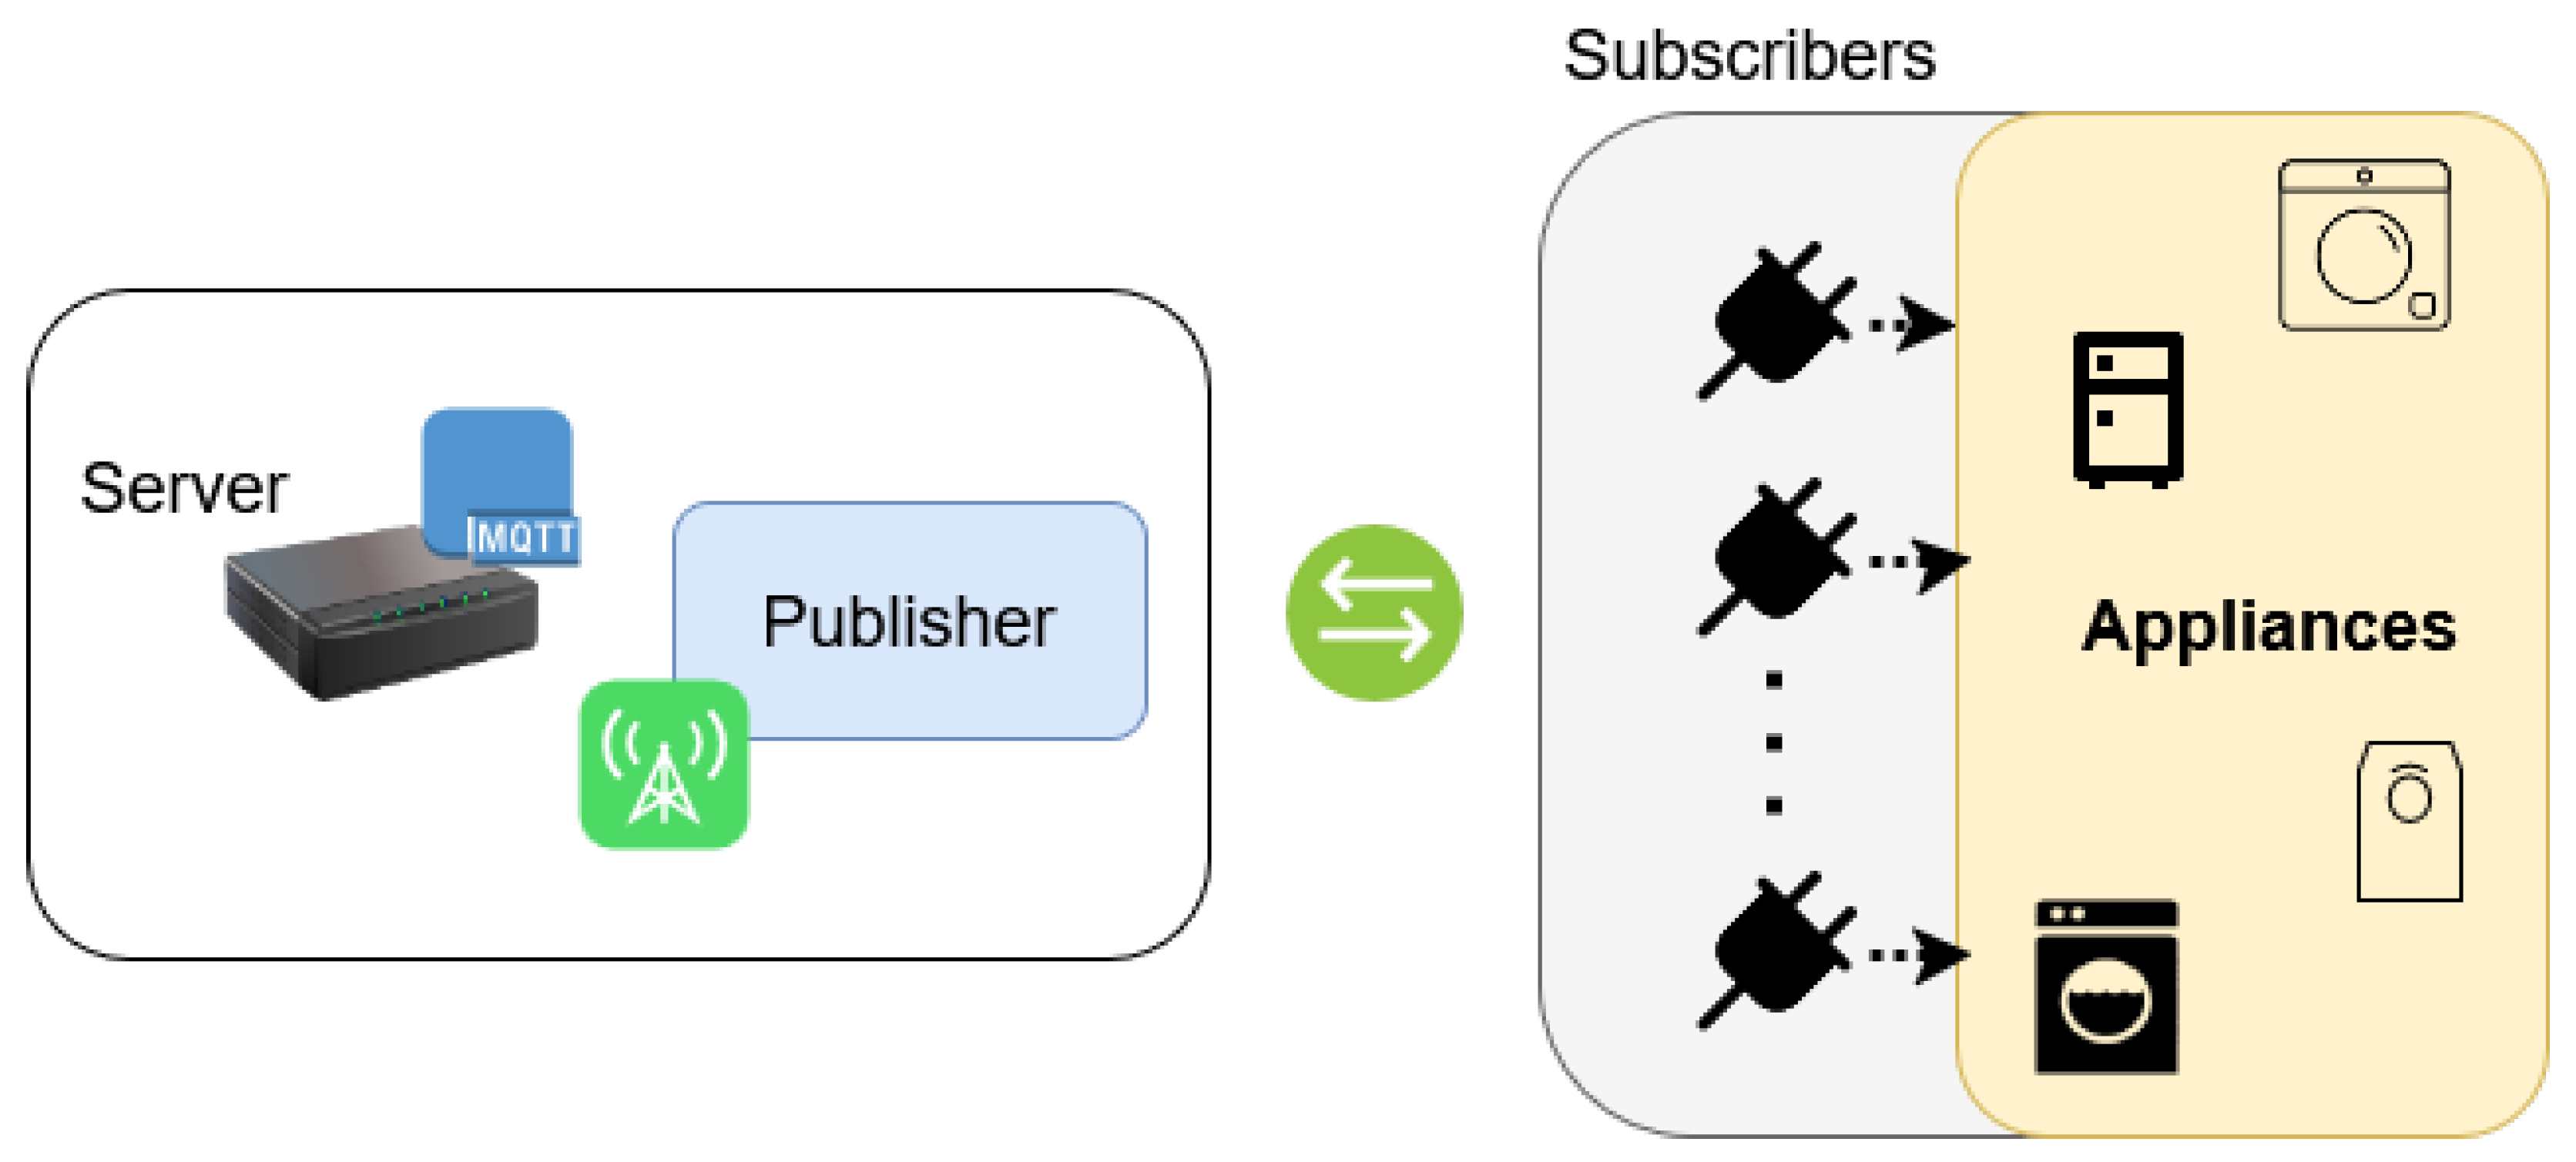
An Internet of Things (IoT) infrastructure is established within the home environment to enable easy device monitoring and management. As illustrated in Figure 2, a local server is installed as the data collection, device management, and communication orchestration hub. The server is a Message Queuing Telemetry Transport (MQTT) publisher, publishing messages to a network of smart plugs. These smart plugs are inserted in between the power supply and the electrical appliances, enabling real-time tracking and management of appliances such as refrigerators, washing machines, dryers, and ovens. The lightweight MQTT protocol is utilized for low-latency, efficient communication between the server and the distributed devices, thus being ideal for scalable home settings with scarce network resources [35].
Each smart plug can monitor and report important operational parameters, such as the real-time energy consumption, voltage, current, and on/off status of the appliance. Telemetry data are delivered as MQTT topics, which are subscribed to by the server and stored in a structured manner in a time-series database. This configuration allows for real-time bidirectional communication, supporting both telemetry data transmission and control command transmission. In addition, the architecture offers a stable and expandable platform through which the behavior of the devices may be easily incorporated into a digital twin framework. Through a modular and decentralized system, the system achieves high synchronization between the physical smart home installation and the virtual counterpart.

3.2.2. Floor Plan Design with Grid4Space

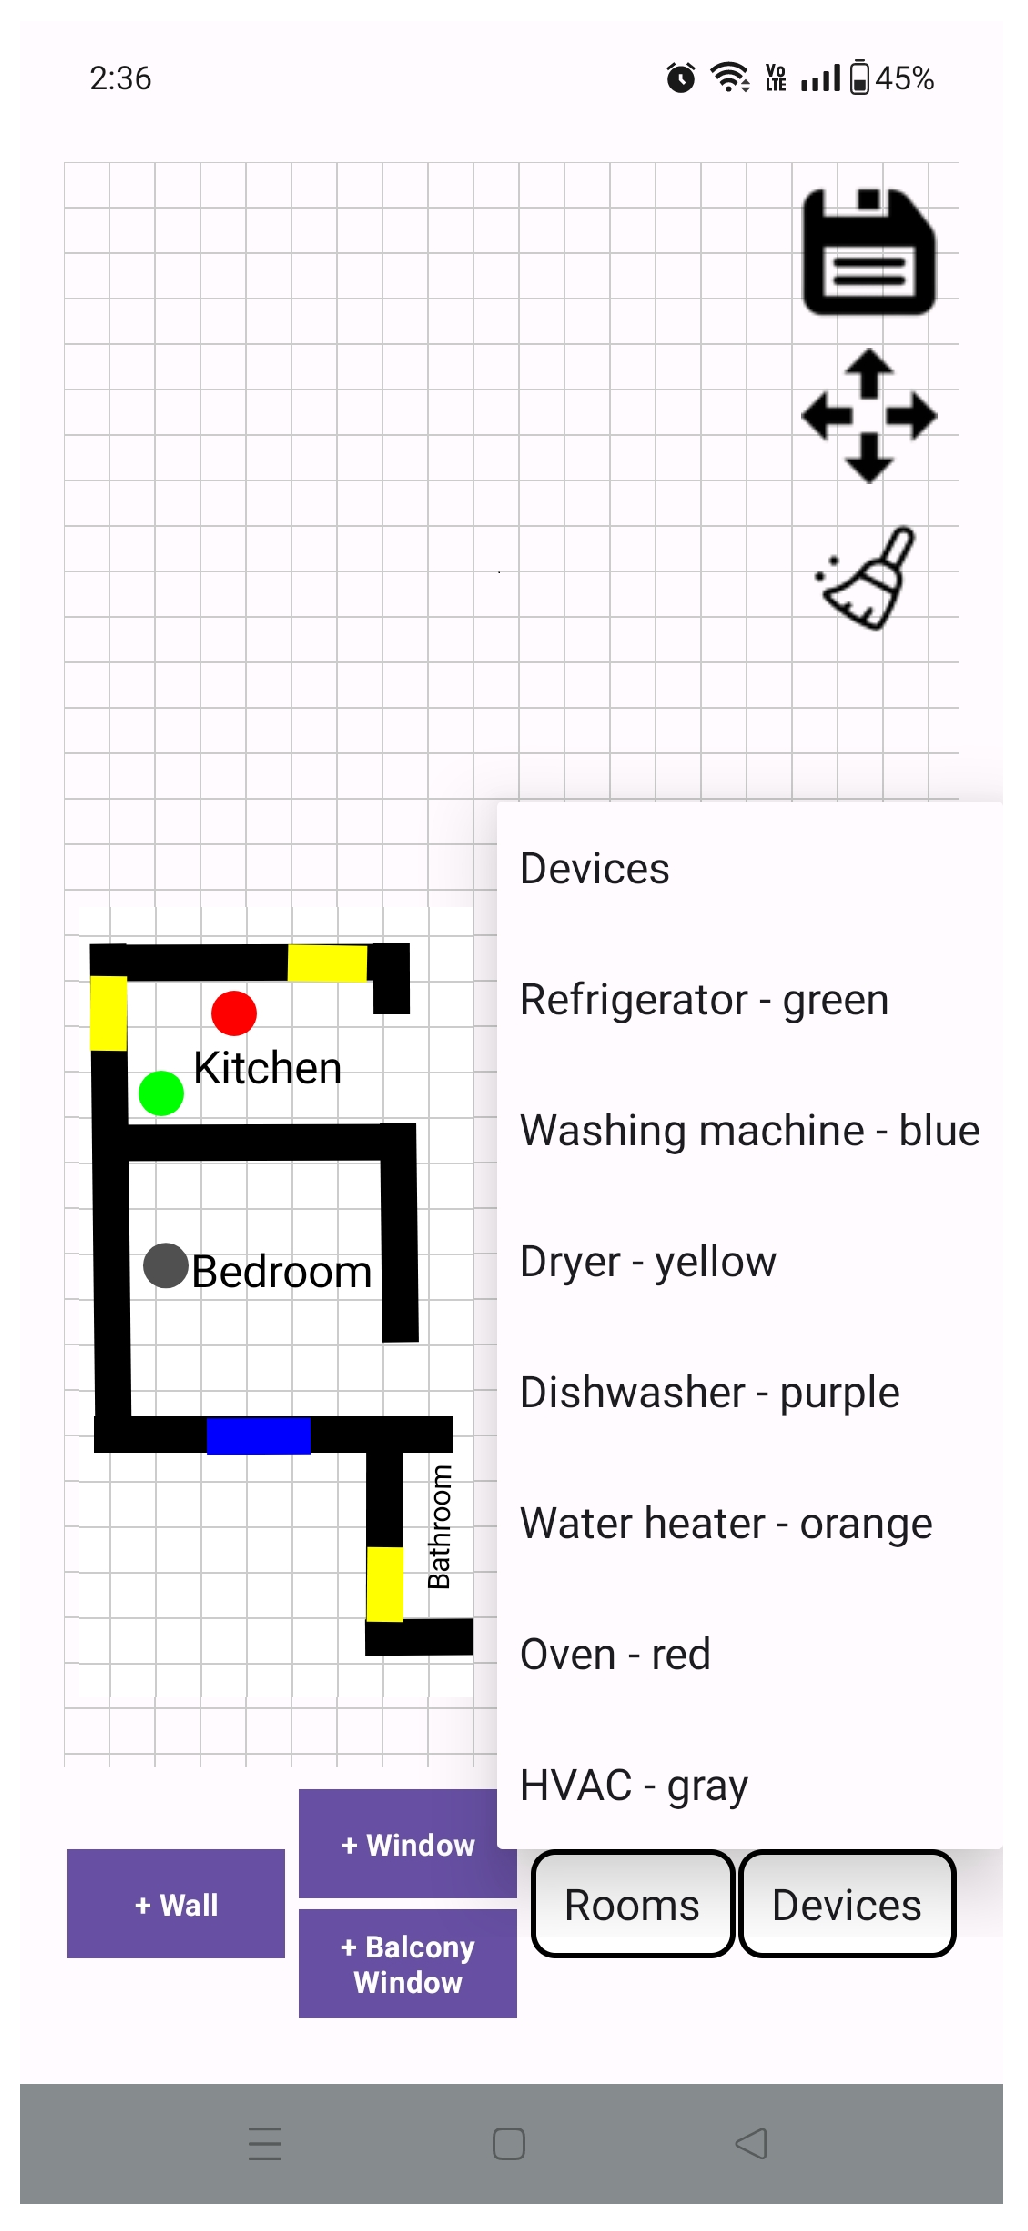
After the IoT infrastructure has been set up, the next critical step is to generate an accurate and comprehensive 2D floor plan that closely reflects the actual layout of the home environment. This is achieved by using the Grid4Space application (v1.0). Although it has many applications, in this case, it is particularly utilized to model the home environment for digital twin purposes. It is an easy-to-use, grid-based interface in which one can model easily, even if they have no technical expertise. The app is publicly released and hosted in the Grid4Space GitHub repository [36].
Users can draw structural elements like walls, doors, windows, and balconies directly onto a flexible grid using a drag-and-drop process. The app also allows space features to be labeled, where users can mark off and label different rooms like bedrooms, living rooms, kitchens, and bathrooms. Every device is introduced into the design by choosing from a checklist of household appliances like refrigerators, washing machines, ovens, air conditioners and heaters, and water heaters, with each one represented by different color-coded symbols. The devices are manually placed into the spaces on the floor plan to mark their corresponding positions in the home. The user interface of the application is illustrated in Figure 3.

3.2.3. Appliance Placement and Metadata Integration

Besides exporting the layout as a PNG image, Grid4Space also exports a formatted JSON file with the entire home layout and appliance setup. The JSON format has detailed information on the rooms (e.g., room names and coordinates) and appliances (e.g., types, room associations, and spatial locations). A sample structure is as follows in Figure 4. This machine-readable output allows for effortless integration with digital twin environments, allowing for automated simulation configurations, energy analysis, and smart appliance control. Grid4Space values user privacy by making sure that all of the user information, such as design files and JSON exports, stays on the device locally without the use of third-party servers or cloud infrastructure. By facilitating visual and structured data export, the app fills the gap between home design concepts and actual-time smart home control and thus becomes an integral part of the digital twin development process.

3.3. Functional and 3D Modeling Objectives

This subsection outlines the functional goals of the ENACT system and the objectives behind the 3D modeling process. Emphasis is placed on accurately representing household layouts and appliance states to support real-time monitoring, user engagement, and contextual maintenance feedback.

3.3.1. 3D Modeling of the Residential Space

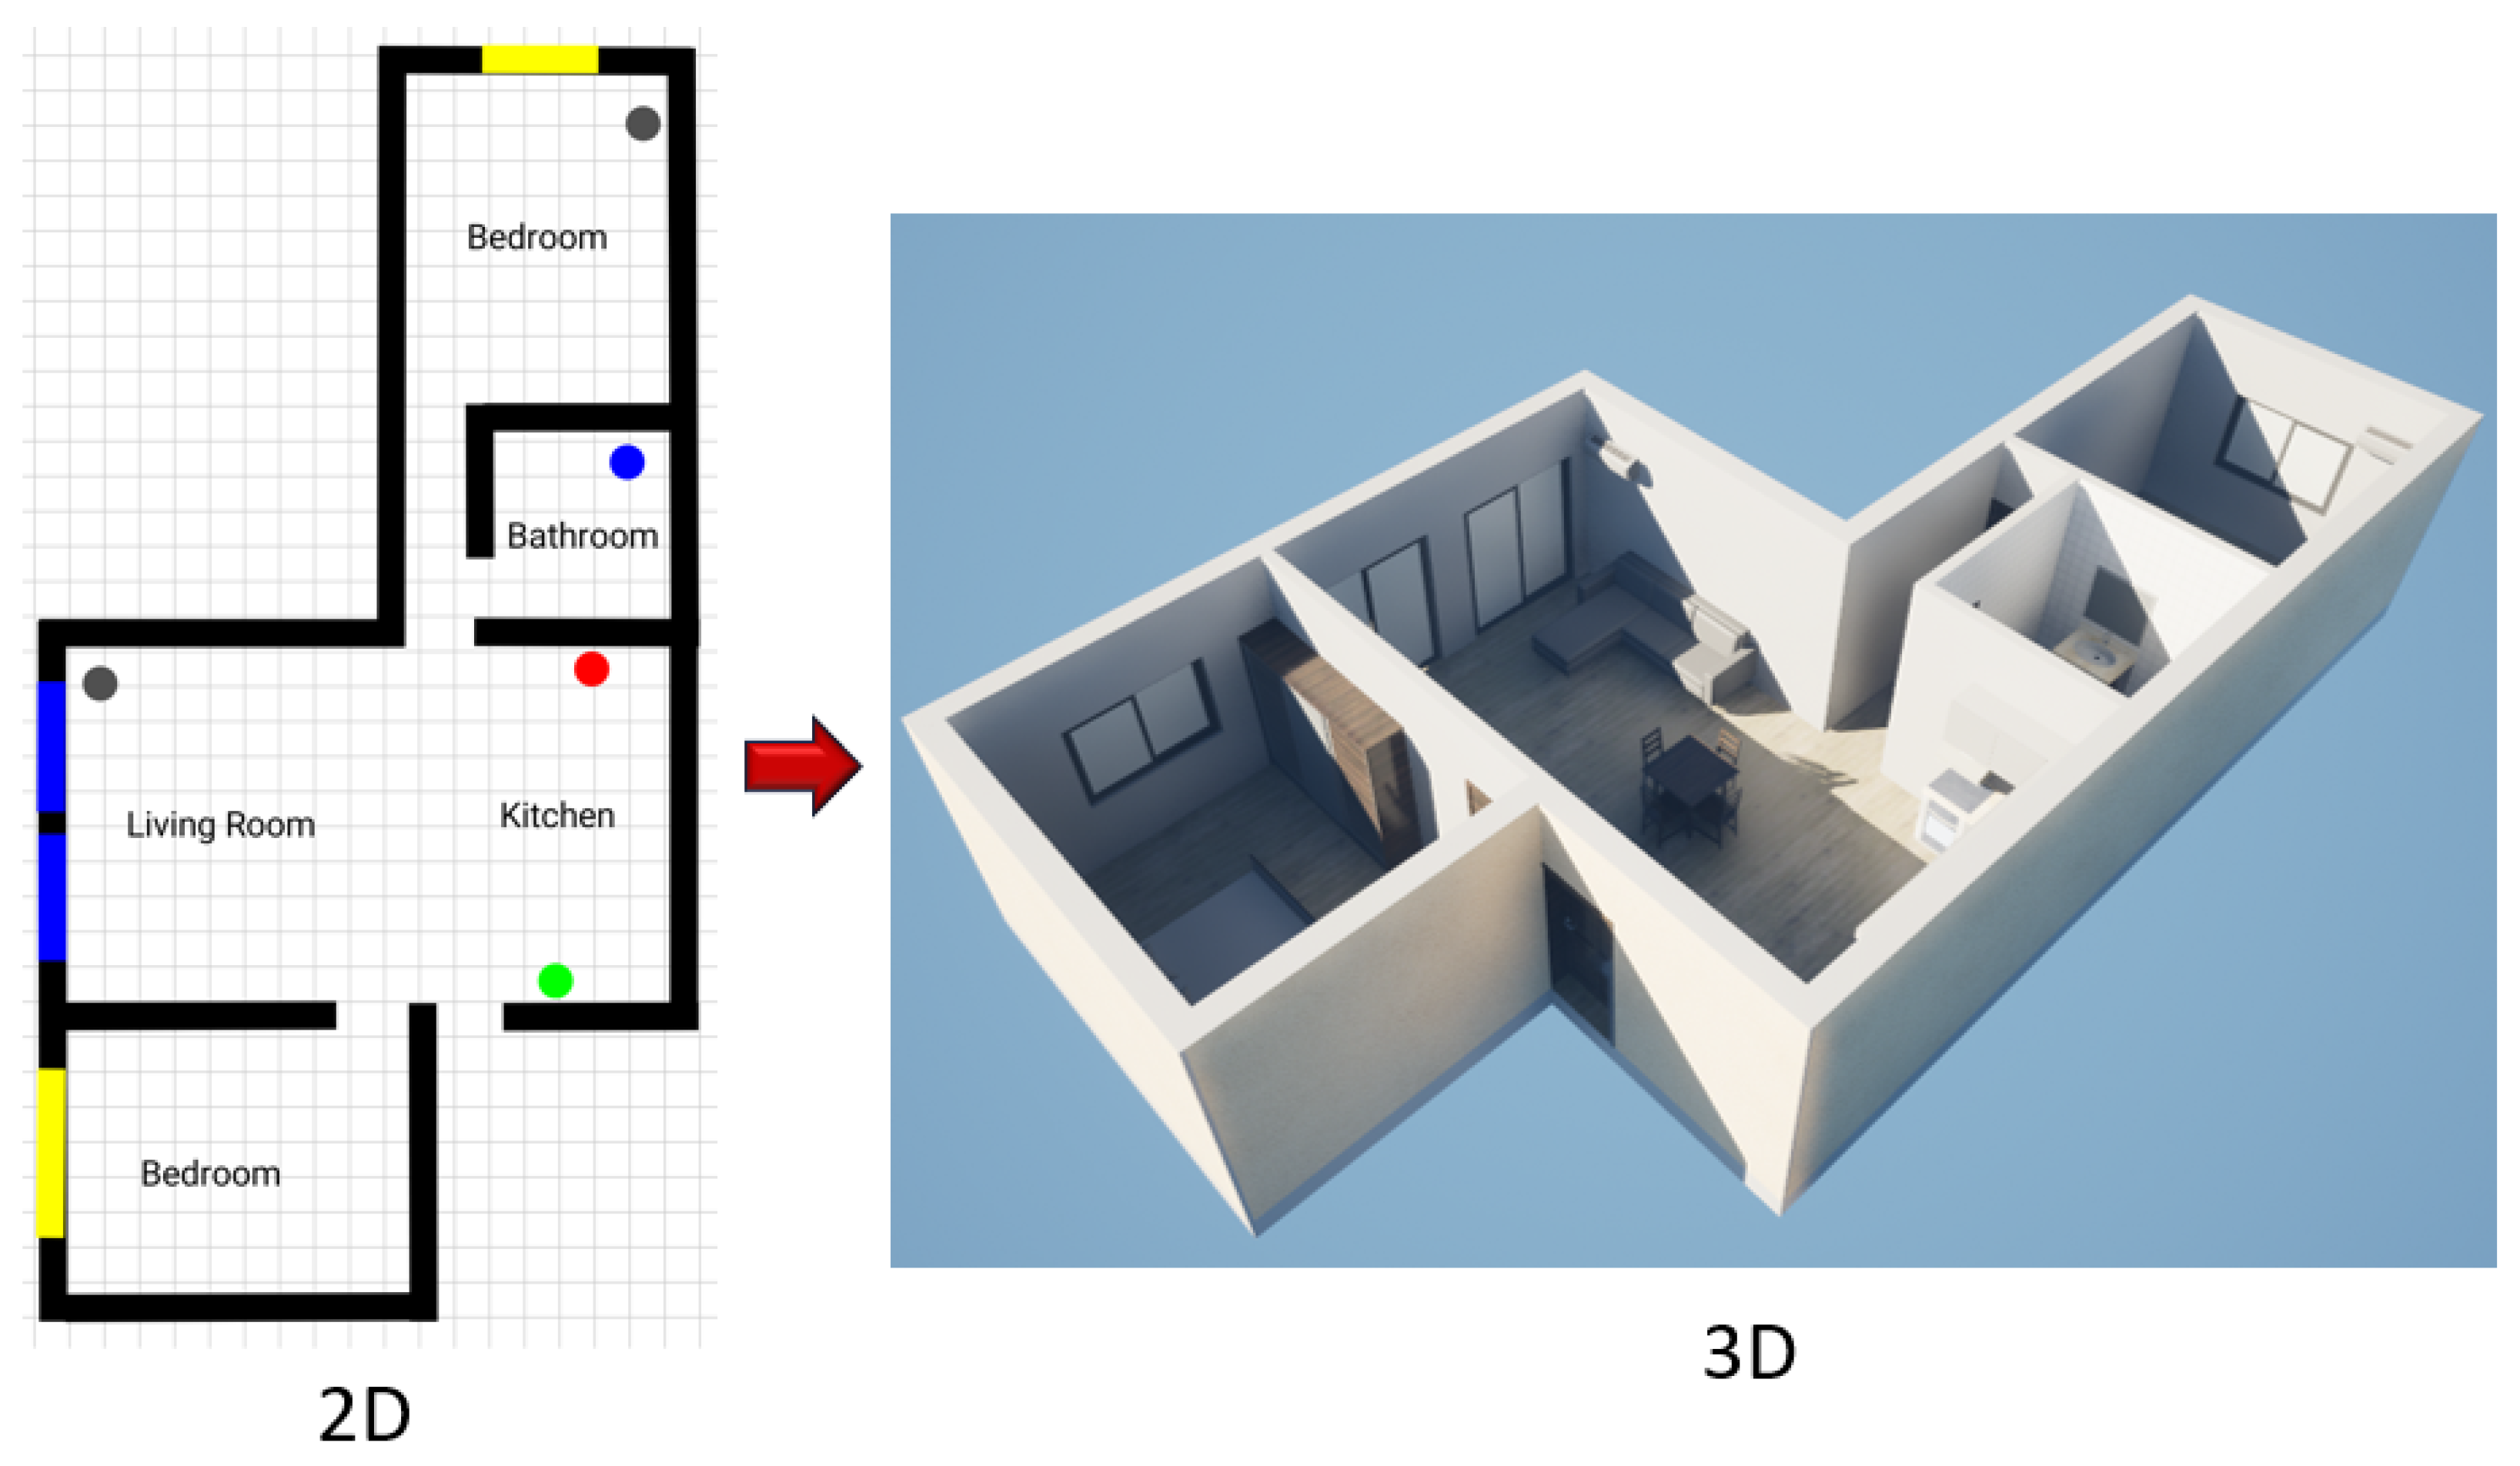
Once the user successfully completes the 2D design through the Grid4Space application, the conversion of the 2D model into a 3D model follows. By receiving all necessary elements through the application, the 3D model is constructed, which includes spatial information developed along three axes.
Initially, the perimeter and exterior walls of the residence are constructed with a thickness greater than that of the interior partition walls. The external wall or the partition wall between adjacent apartments has a greater thickness as it includes insulation against heat loss and sound. Subsequently, the interior walls are constructed, distinctly defining the spaces and different rooms of the residence. External walls with a thickness of 25 cm are chosen, while the internal walls are designed with a thickness of 10 cm. The height of the walls reaches up to 3 m, and no ceiling slab or roof is placed to create the perspective of a dollhouse. This particular perspective was chosen because it does not obstruct the view of all of the spaces and appliances of the residence, while at the same, time most users are familiar with representing spaces in this form. Then, the openings are added: internal openings and frames (doors), as well as openings in the external walls (balcony doors and windows). Based on the floor plan, the main entrance of the residence is initially defined, while the other interior openings (doors) are placed at points chosen by the user and oriented according to their position in relation to the space. At the same time, if a user has added a balcony to the floor plan of the residence, it is transferred to the corresponding 3D model.
Once the structural elements of the residence have been constructed, the next step is to furnish the spaces, as well as to place the home appliances in positions designated by the users. To reduce the time and complexity of constructing the 3D model, certain data categorization techniques derived from the 2D design are applied. Based on the names of the spaces and rooms, corresponding indicative furniture for the living room, kitchen, bedroom, bathroom, etc., is placed from a furniture library in the 3D design program to create a more realistic sense of space and enhance the user experience. From the same library, appliances chosen by the user are also selected and placed in the 3D model, such as an air conditioner in the living room, a water heater and washing machine in the bathroom, and kitchen appliances including an oven, refrigerator, and dishwasher. The placement of the appliances is determined by the user, so the 3D model is constructed accordingly with the positions of the appliances as chosen by them.
Completing the construction of the 3D model, the next step is the application of the appropriate materials to the respective surfaces. Regarding exterior walls, they are painted internally with a white color and externally in a warmer shade to create a sense of separation between the interior and exterior spaces. The interior walls are painted correspondingly with a white color to maintain homogeneity, while the interior walls of the bathroom are covered with white tiles, as typically found in wet areas. For the flooring of the residence, wood flooring is chosen, and correspondingly, in the bathroom area, white tiles are used to make the difference between the spaces distinct. The stage of applying the materials is particularly important as it lays the groundwork for the transformation of the 3D model into its corresponding DT.

3.3.2. Digital Twin Integration and Data Binding

Once the 2D floor plan and appliance layout have been converted into a 3D space, the DT system is imported into Unity (v6.2). Unity is the interaction and visualization platform, where the IoT-based real-time operating data on the appliances is embedded into the 3D model seamlessly. This allows the DT to break through the constraint of a simple static presentation, with functions for dynamic observations of appliances’ status, real-time system feedback, and maintenance identification. The precise spatial locations of appliances populate the 3D space, updated automatically from time to time through telemetries such as energy usage, run status, and diagnosis reports.
The appliances are highlighted in the DT using Unity by the statuses normal operation, failure, or require service through glyphs or color. Broken devices trigger context-dependent alarms and graphical notices, i.e., alert icons or highlight animations. In parallel, prescriptive maintenance recommendations like cleaning alerts and performance improvement tips are recommended close to affected devices in real time. This interactive, immersive 3D dashboard allows consumers to simply monitor and manage their smart home space, respond to alerts, and maximize energy efficiency without technical knowledge [9].

3.4. The Implementation of Prescriptive Techniques

Prescriptive maintenance plays a critical role in converting reactive smart homes into energy-efficient proactive living spaces. In this study, prescriptive strategies are implemented through the Prescriptive Intelligence System for Maintenance (PRISM), a unified tool designed to accommodate the diverse operational characteristics of household appliances. PRISM comprises two specialized AI-based models, each optimized for a distinct appliance category: on-demand devices (e.g., washing machines, dishwashers, dryers, ovens), which operate in user-initiated cycles, and constantly-on devices (e.g., refrigerators), which function continuously and autonomously.

3.4.1. Prescriptive Maintenance for On-Demand Appliances

On-demand appliances operate in user-defined cycles that vary in duration, temperature, and mechanical load, making them suitable candidates for multipattern anomaly analysis. The implemented method, known as Advanced Proactive Anomaly Detection (APAD), was a deep learning framework based on CNN-LSTM Variational Autoencoders (VAEs) and dynamic thresholding [23]. The process includes the following steps:
  • Feature Engineering: Power consumption data was preprocessed (including smoothing and decomposition to enhance the signal quality), segmented into operating cycles, and subjected to statistical feature extraction.
  • Program Classification: Extracted operational cycles were categorized into programs with similar features using an XGBoost classifier, enabling the differentiation of on-demand devices programs by duration, temperature, and other usage context.
  • Anomaly Detection: A CNN-LSTM VAE was trained per program class to reconstruct typical power profiles. Additionally, a dynamic anomaly threshold was calculated using the 3-sigma rule, adapting to signal variability for robust classification of normal and anomalous behavior.
  • Prescriptive Output: Detected anomalies enable specific maintenance actions, and the digital twin system highlights affected components offering real-time feedback to the user.
The prescriptive maintenance process begins with segmenting the appliance-level power consumption signal into operational cycles:
C j = { x t t [ t s ( j ) , t e ( j ) ] } ,
where C j denotes the j-th operational cycle, x t is the power signal at time t, and t s ( j ) , t e ( j ) are the start and end times of the cycle.
Each extracted cycle is classified into usage programs using an XGBoost classifier that minimizes the following loss:
L = i = 1 n l ( y i , y ^ i ) + k = 1 K Ω ( f k ) ,
where y i is the true program label, y ^ i is the predicted label for sample i, and Ω ( f k ) is a regularization term for the k-th tree. The regularization is given by
Ω ( f k ) = γ T + 1 2 λ j = 1 T w j 2 ,
where T is the number of leaves in tree f k , w j is the weight of leaf j, γ penalizes complexity, and λ controls weight shrinkage.
For anomaly detection, the classified cycle data is processed by the CNN-LSTM VAE. The CNN extracts temporal features:
F l ( k ) = σ m W l ( k , m ) x ( m ) + b l ( k ) ,
where F l ( k ) is the k-th output feature map at layer l, x ( m ) the m-th input channel, W l ( k , m ) the convolution kernel, b l ( k ) the bias term, and σ the activation function.
The LSTM captures the sequential dynamics as follows:
f t = σ ( W f · [ h t 1 , x t ] + b f )
i t = σ ( W i · [ h t 1 , x t ] + b i )
C ˜ t = tanh ( W C · [ h t 1 , x t ] + b C )
C t = f t C t 1 + i t C ˜ t
o t = σ ( W o · [ h t 1 , x t ] + b o )
h t = o t tanh ( C t )
where x t is the input at time t, h t the hidden state, C t the cell state, and f t , i t , and o t the forget, input, and output gates, respectively; ⊙ denotes element-wise multiplication; and W , b are trainable weights and biases.
The VAE is trained to minimize the following loss:
L VAE = E q ϕ ( z x ) [ log p θ ( x z ) ] D K L ( q ϕ ( z x )   p ( z ) ) ,
where x is the input time-series, z the latent variable, q ϕ ( z x ) the encoder distribution, p θ ( x z ) the decoder likelihood, and D K L the Kullback–Leibler divergence to the prior p ( z ) .
The reconstruction error is computed as
ϵ i = x ( i ) x ^ ( i ) _ 2 ,
where ϵ i is the Euclidean norm between the input x ( i ) and the reconstructed output x ^ ( i ) .
Anomalies are identified when the error exceeds the adaptive threshold:
τ = μ + 3 σ ,
where μ and σ are the mean and standard deviation of the reconstruction errors from non-anomalous training data, and τ is the upper confidence bound. If ϵ i > τ , the instance is annotated as anomalous.

3.4.2. Prescriptive Maintenance for Constantly-On Appliances

Constantly-on devices, such as refrigerators, exhibit autonomous and continuous operation, typically characterized by repetitive and periodic duty cycles. Unlike on-demand devices, these appliances do not operate under user-defined programs but rather adjust their performance dynamically based on the thermal load and environmental conditions. To address the particular requirements of these systems, the utilized methodology focuses on operational phase identification and using LSTM networks trained on long-term consumption patterns. The aim of the method was to monitor appliance health and predict degradation based on phase transitions [37].
While simpler statistical techniques (e.g., moving averages, variance analysis, or control charts) could be applied to monitoring constantly-on devices, they are limited to point-wise deviations and cannot capture the temporal dependencies across operational phases. Refrigerators and similar appliances exhibit sequential duty cycles (e.g., compressor on/off, defrost, standby), where degradations often manifest as changes in phase timing and transition patterns rather than absolute energy deviations. An LSTM-based approach is therefore adopted, as it can learn the long-term dependencies in power consumption data, enabling robust phase classification.
The methodology consists of the following steps:
  • Device Type and Operation Mode Detection: A preprocessing module classifies the appliance’s operational characteristics (fixed-state vs. variable-state operation) using cumulative distribution function (CDF) analysis and the ensemble classifier AdaBoost.
  • Feature Compression and Normalization: Power consumption data is resampled to 10-min intervals, normalized, and transformed using a Principal Component Analysis (PCA) to reduce the noise and dimensionality.
  • Phase Classification: Processed power profiles are input into an LSTM model that segments the data into distinct operational phases (e.g., active, idle, standby, high-load). These phases represent the recurring behavioral states of the appliance. Changes in the phase duration, frequency, or transition patterns indicate potential degradation or inefficiencies.
  • Anomalies in phase behavior trigger contextual maintenance suggestions, such as component inspection, sensor recalibration, or airflow optimization.
The initial step in classifying the appliance’s operation mode involves analyzing the distribution of the power readings. The CDF is computed:
F ( x ) = P ( X x ) ,
where X is the random variable representing power measurements. The shape of F ( x ) tells us whether the appliance exhibits fixed-state or variable-state operation. The derived features are input into an ensemble AdaBoost classifier, minimizing
L AdaBoost = i = 1 n w i · exp ( y i f ( x i ) ) ,
where w i is the weight of instance i, y i { 1 , + 1 } is the true label, and f ( x i ) is the predicted score.
The power consumption data X R n × d is normalized and compressed using the PCA:
Z = X W ,
where W R d × k is the matrix of the top k eigenvectors (principal components), and Z is the lower-dimensional representation used for subsequent modeling.
To detect the operational phases, the compressed time-series is input into the LSTM network. The LSTM state evolution is given by
f t = σ ( W f · [ h t 1 , x t ] + b f ) ,
represents the forget gate, which decides which information from the past should be discarded.
i t = σ ( W i · [ h t 1 , x t ] + b i ) ,
corresponds to the input gate, which determines what new information should be stored in memory.
C ˜ t = tanh ( W C · [ h t 1 , x t ] + b C ) ,
generates the candidate memory suggesting possible new information to add.
C t = f t C t 1 + i t C ˜ t ,
updates the cell state, combining retained old information with the new input.
o t = σ ( W o · [ h t 1 , x t ] + b o ) ,
defines the output gate, which decides what part of the memory will influence the next hidden state.
h t = o t tanh ( C t ) ,
computes the hidden state, which acts as the LSTM’s current summary of both past and present inputs.
Each time step is classified into a phase using
y t = Softmax ( W y h t + b y )
Let P = { p 1 , p 2 , , p m } denote the set of operational phases. Transitions between phases are monitored to identify abnormal patterns. A phase transition matrix T R m × m is computed:
T i j = count ( p i p j ) k count ( p i p k )
Significant changes in T i j , or deviations in the phase duration statistics, trigger prescriptive maintenance alerts such as component diagnostics or system recalibration.
To train the proposed method, the dataset consisted of refrigerators deployed across the 20 participating households. The sample included multiple brands (Samsung, LG, Siemens, Bosch, Hisense, Pitssos, Crown, and Favorit) and covered a wide range of appliance ages, from 1 year to over 18 years old, to ensure diversity in the operational characteristics. The refrigerators also differed in their capacity, with total storage volumes ranging from 151 L to 505 L, and in their energy usage, with average consumption values between 20 W and 70 W, depending on the model and compressor type. Datasets from refrigerators with both fixed- and variable-speed compressors were combined for this sub-method. In total, almost 500 days of data from fixed-speed refrigerators and 424 days from variable-speed refrigerators were used for the training phase, while 166 days were reserved for testing. This heterogeneity was critical to enable the LSTM-based phase detection model to generalize effectively across appliances with different specifications and operational lifespans.

3.4.3. Summary of Prescriptive Models

Both models are dynamically integrated within the DT platform, which functions as an intelligent hub for anomaly analysis and prescriptive maintenance of home appliances. An overview of the characteristics of the prescriptive maintenance approach to on-demand and constantly-on devices is illustrated in Table 2.

4. User-Centered Interaction and Deployment

This section presents the real-world deployment of the ENACT system in 20 residential households, emphasizing user-centered design principles. It details how users interacted with the mobile app, constructed personalized floor plans, and engaged with 2D and 3D digital twin representations to monitor appliance behavior and receive maintenance guidance.

4.1. Prescription Delivery and Awareness Strategies

Prescriptive maintenance leverages real-time, data-driven diagnostics to shift home appliance care from reactive to proactive. By integrating intelligent monitoring with targeted user communication, the ENACT framework delivers actionable maintenance recommendations that reduce energy consumption, extend appliance lifespans, and improve overall safety. The impact is not only technical but also behavioral: users are actively engaged in maintaining their home environment with minimal disruption. ENACT organizes its prescription outputs into three main categories, each designed to support different levels of user awareness and operational response: guideline prescriptions, routine prescriptions, and diagnostic prescriptions.
Guideline prescriptions are generic best-practice suggestions intended to raise general maintenance awareness. These tips are not tied to specific faults but aim to instil better habits—for example, encouraging users to regularly defrost a freezer or clean an appliance’s filters. Routine prescriptions are scheduled maintenance alerts delivered at predefined intervals (e.g., quarterly HVAC servicing or weekly filter cleaning). These ensure consistent upkeep and allow users to anticipate maintenance tasks, reducing the likelihood of sudden performance degradations. Finally, diagnostic prescriptions are generated in response to anomalies detected in device behavior through an AI analysis. They are highly targeted and come at three levels: specific diagnostic prescriptions, minor diagnostic prescriptions, and major diagnostic prescriptions (Table 3). Specifically, specific diagnostic prescriptions provide clear actionable steps based on identified errors (e.g., compressor overcycling due to airflow blockage). Minor diagnostic prescriptions address small inefficiencies, such as a 5–10% rise in energy consumption, often caused by filter obstructions or sensor drift. And major diagnostic prescriptions are triggered by significant anomalies (e.g., a >15% increase in power usage), prompting urgent user intervention or technician contact.
Prescriptions are integrated into the ENACT 3D digital twin interface with the following interaction features:
  • Visual Overlays: Faulty appliances are color-coded (e.g., orange for minor, red for major issues).
  • Contextual Pop-Ups: Each alert includes a timestamp, the recommended action, and the estimated energy impact.
  • The Notification System: Mobile push notifications ensure a timely user response even when not actively using the application.
These interactions are designed to maintain a low cognitive load, guiding users toward the optimal appliance management without requiring technical expertise. Over time, repeated exposure to actionable feedback fosters behavioral shifts and strengthens user–technology engagement.

4.2. Use Case Scenarios

This section outlines representative use cases that demonstrate how users interact with the ENACT system under various appliance conditions. Each scenario corresponds to a specific device state ranging from normal operation to critical faults and highlights the system’s visual indicators, user notifications, and behavioral logic. These examples illustrate the interface’s capacity to adaptively guide user responses while maintaining a low-disruption experience.

4.2.1. Use Case 1: Emergency Intervention

This use case refers to situations where a critical appliance malfunction is detected, requiring immediate user intervention to prevent safety risks or irreversible damage. A typical example involves motor overheating or system-level faults in appliances such as washing machines or dryers. When such a condition is identified by the diagnostic model, the ENACT system classifies it as a high-priority event and issues an emergency alert. The affected appliance is visually marked in red within the digital twin interface. A fixed pop-up message appears (e.g., “Critical error: Please stop using the appliance immediately. A diagnostic fault has been detected. Refer to the prescription for corrective action.”). This alert remains active until the root cause has been resolved and the system verifies that the appliance has returned to a safe, normal operational state. Merely acknowledging the alert is not sufficient; corrective maintenance or repair must be completed. Once resolved, the event is automatically logged in the appliance’s history for future reference and traceability. This use case demonstrates ENACT’s ability to manage emergency scenarios with persistent feedback, high-priority signaling, and structured user guidance.

4.2.2. Use Case 2: Minor Intervention

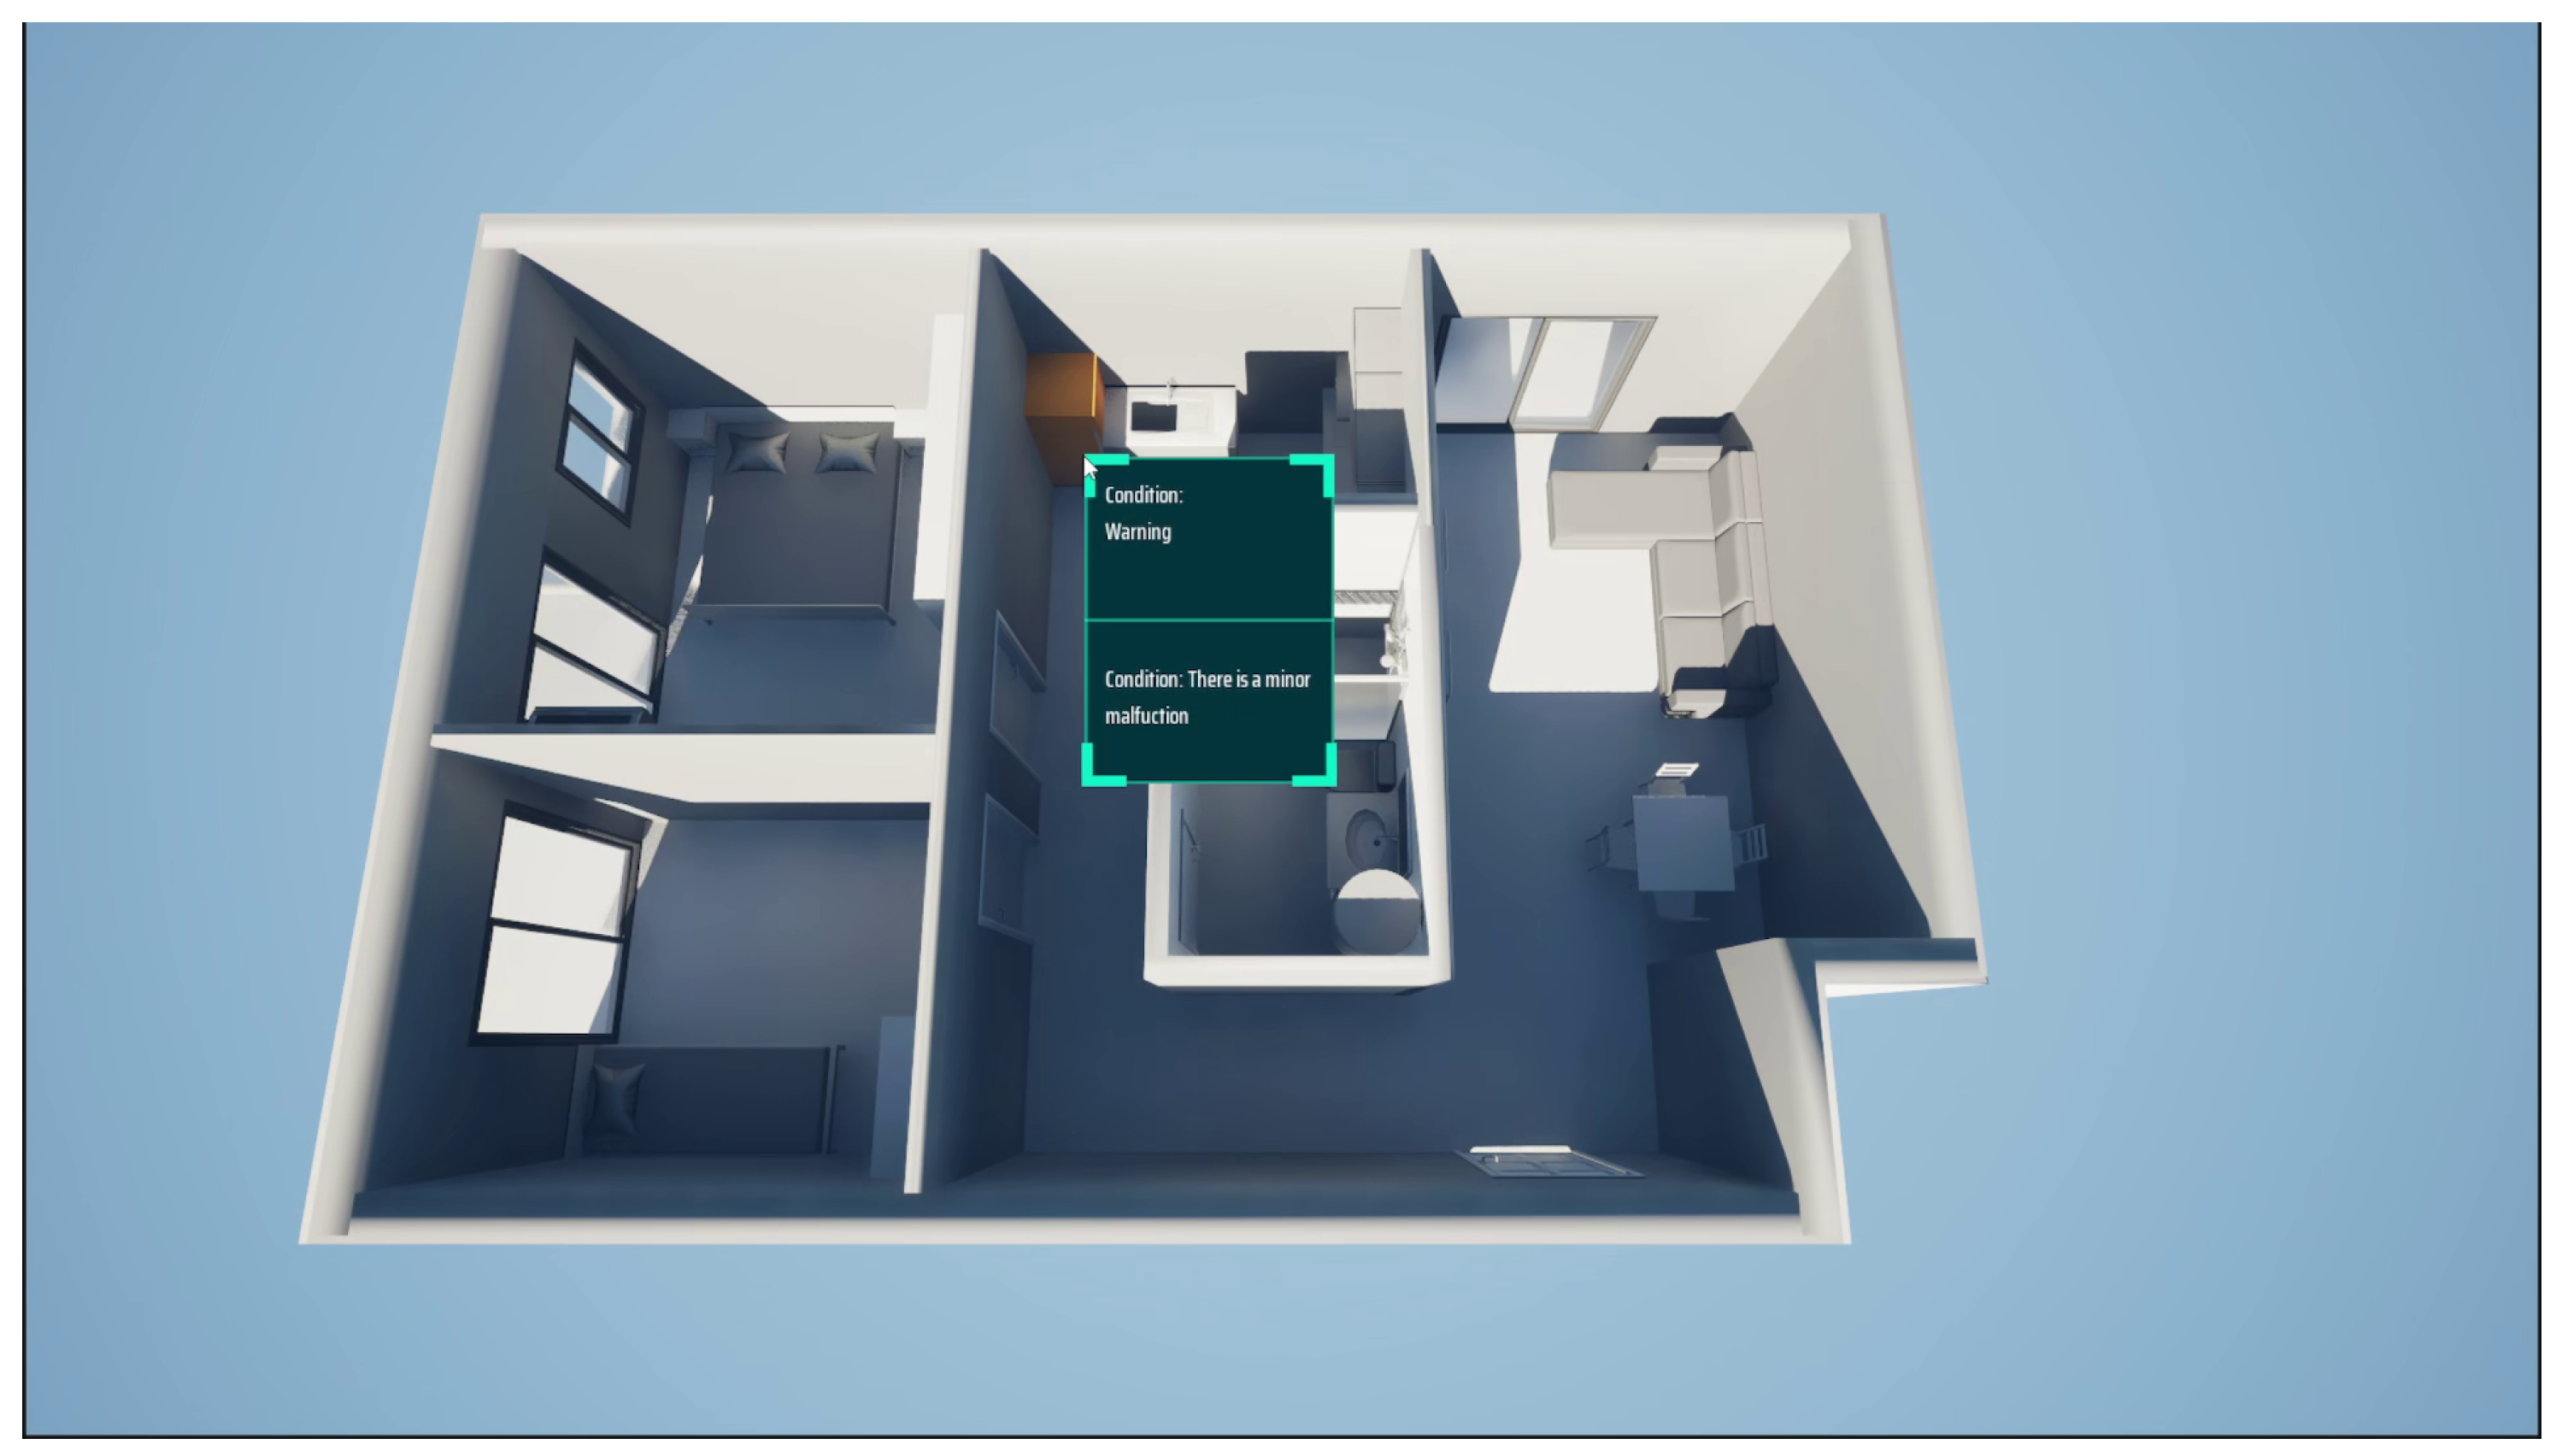
This use case refers to scenarios where a device is still operational but exhibits minor deviations from expected behavior, indicating a non-critical issue that requires maintenance or a certain easy action. Examples include slight temperature fluctuations in refrigerators or a reduced airflow due to a dirty HVAC filter. When such conditions are detected, the ENACT diagnostic engine categorizes the event as a minor issue and issues a high-priority advisory. The affected appliance is marked in orange within the DT environment. A contextual pop-up message is displayed (e.g., “Warning: Filter may need cleaning soon.”). If a more critical issue (i.e., red alert) is active simultaneously, the orange-level advisory is suppressed temporarily and displayed only after the critical alert has been cleared. This ensures a clear hierarchy of intervention. The warning remains visible until the issue is resolved and the system confirms that the appliance has returned to the optimal operating parameters. Additionally, the event is logged in the appliance’s maintenance history to support long-term pattern analysis and personalized maintenance forecasting. This use case illustrates ENACT’s ability to detect and communicate early-stage performance deviations, enabling preventive action without overwhelming the user.

4.2.3. Use Case 3: Routine Maintenance Notifications

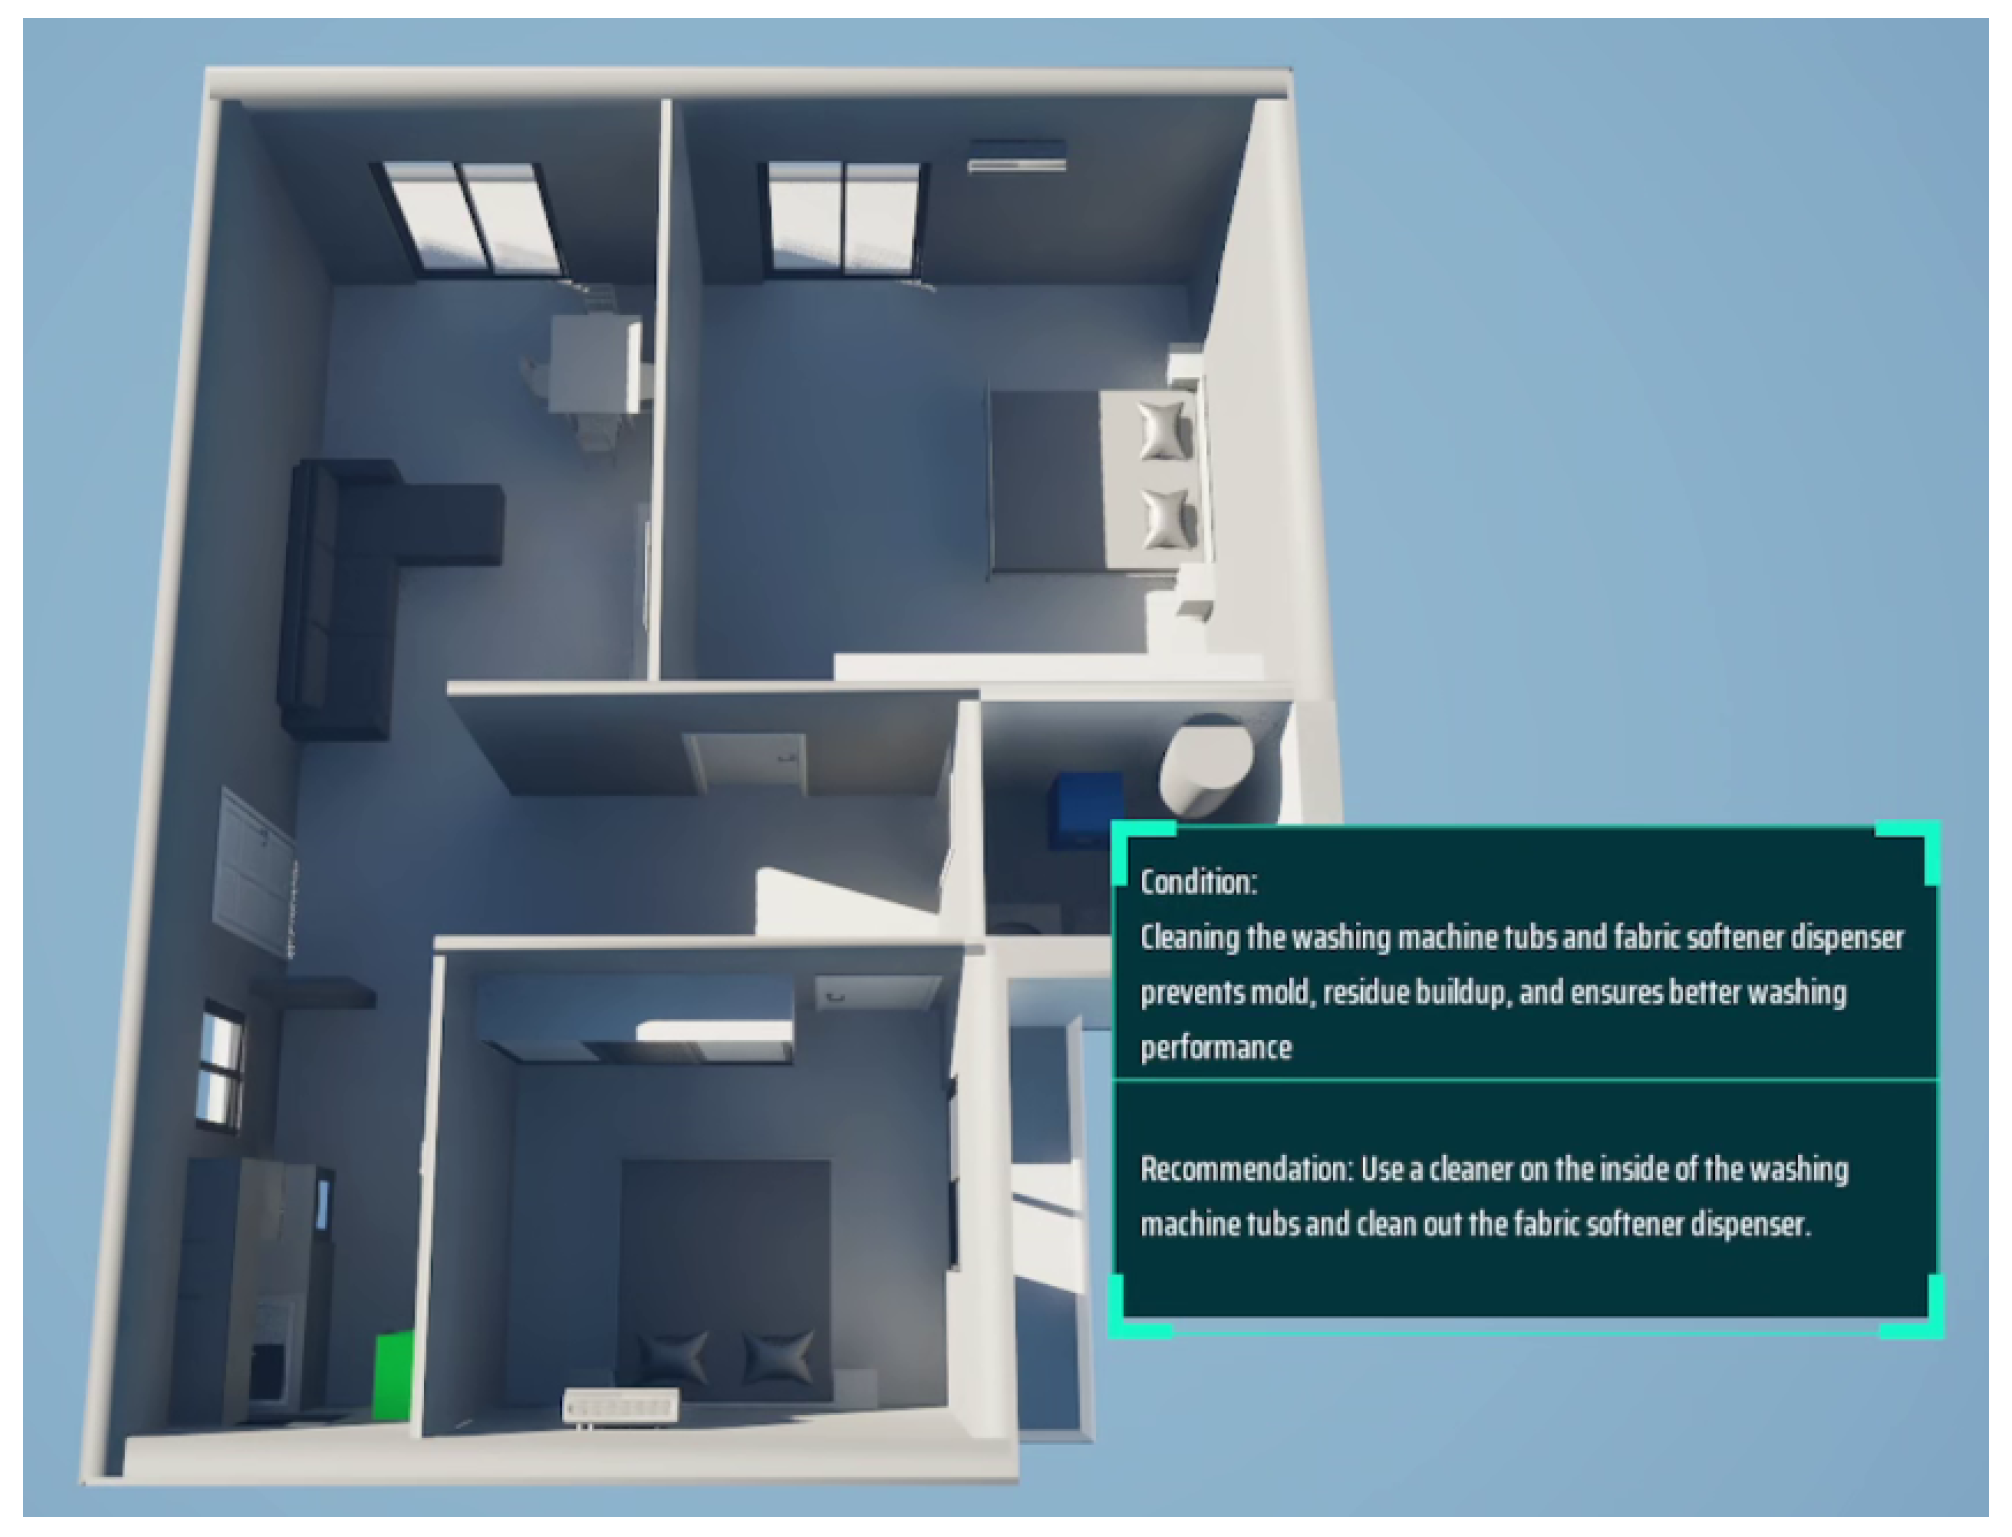
This use case refers to standard, scheduled maintenance events initiated by the system in the form of routine prescriptions. These are not triggered by anomalies but by predefined service intervals designed to maintain appliance health and prevent long-term degradation. An example includes reminders for filter cleaning every 30 days. When the scheduled interval is reached, the ENACT system issues a routine prescription. The corresponding appliance is marked in blue within the DT interface, and a passive notification is displayed (e.g., “Maintenance reminder: Perform filter cleaning (every 30 days).”). Routine prescriptions appear non-intrusively in a dedicated “Maintenance” section of the application and are typically accompanied by a clock or bell icon to signal recurrence. They do not interrupt user interactions and are intended to encourage consistent upkeep. Once the user acknowledges the notification, the appliance status returns to normal (green), and the event is logged in the appliance history with a #Routine tag for future reference and trend analysis. This use case demonstrates ENACT’s support for proactive, low-disruption maintenance by reinforcing regular care habits through scheduled, user-friendly prompts.

4.2.4. Use Case 4: Normal Operation

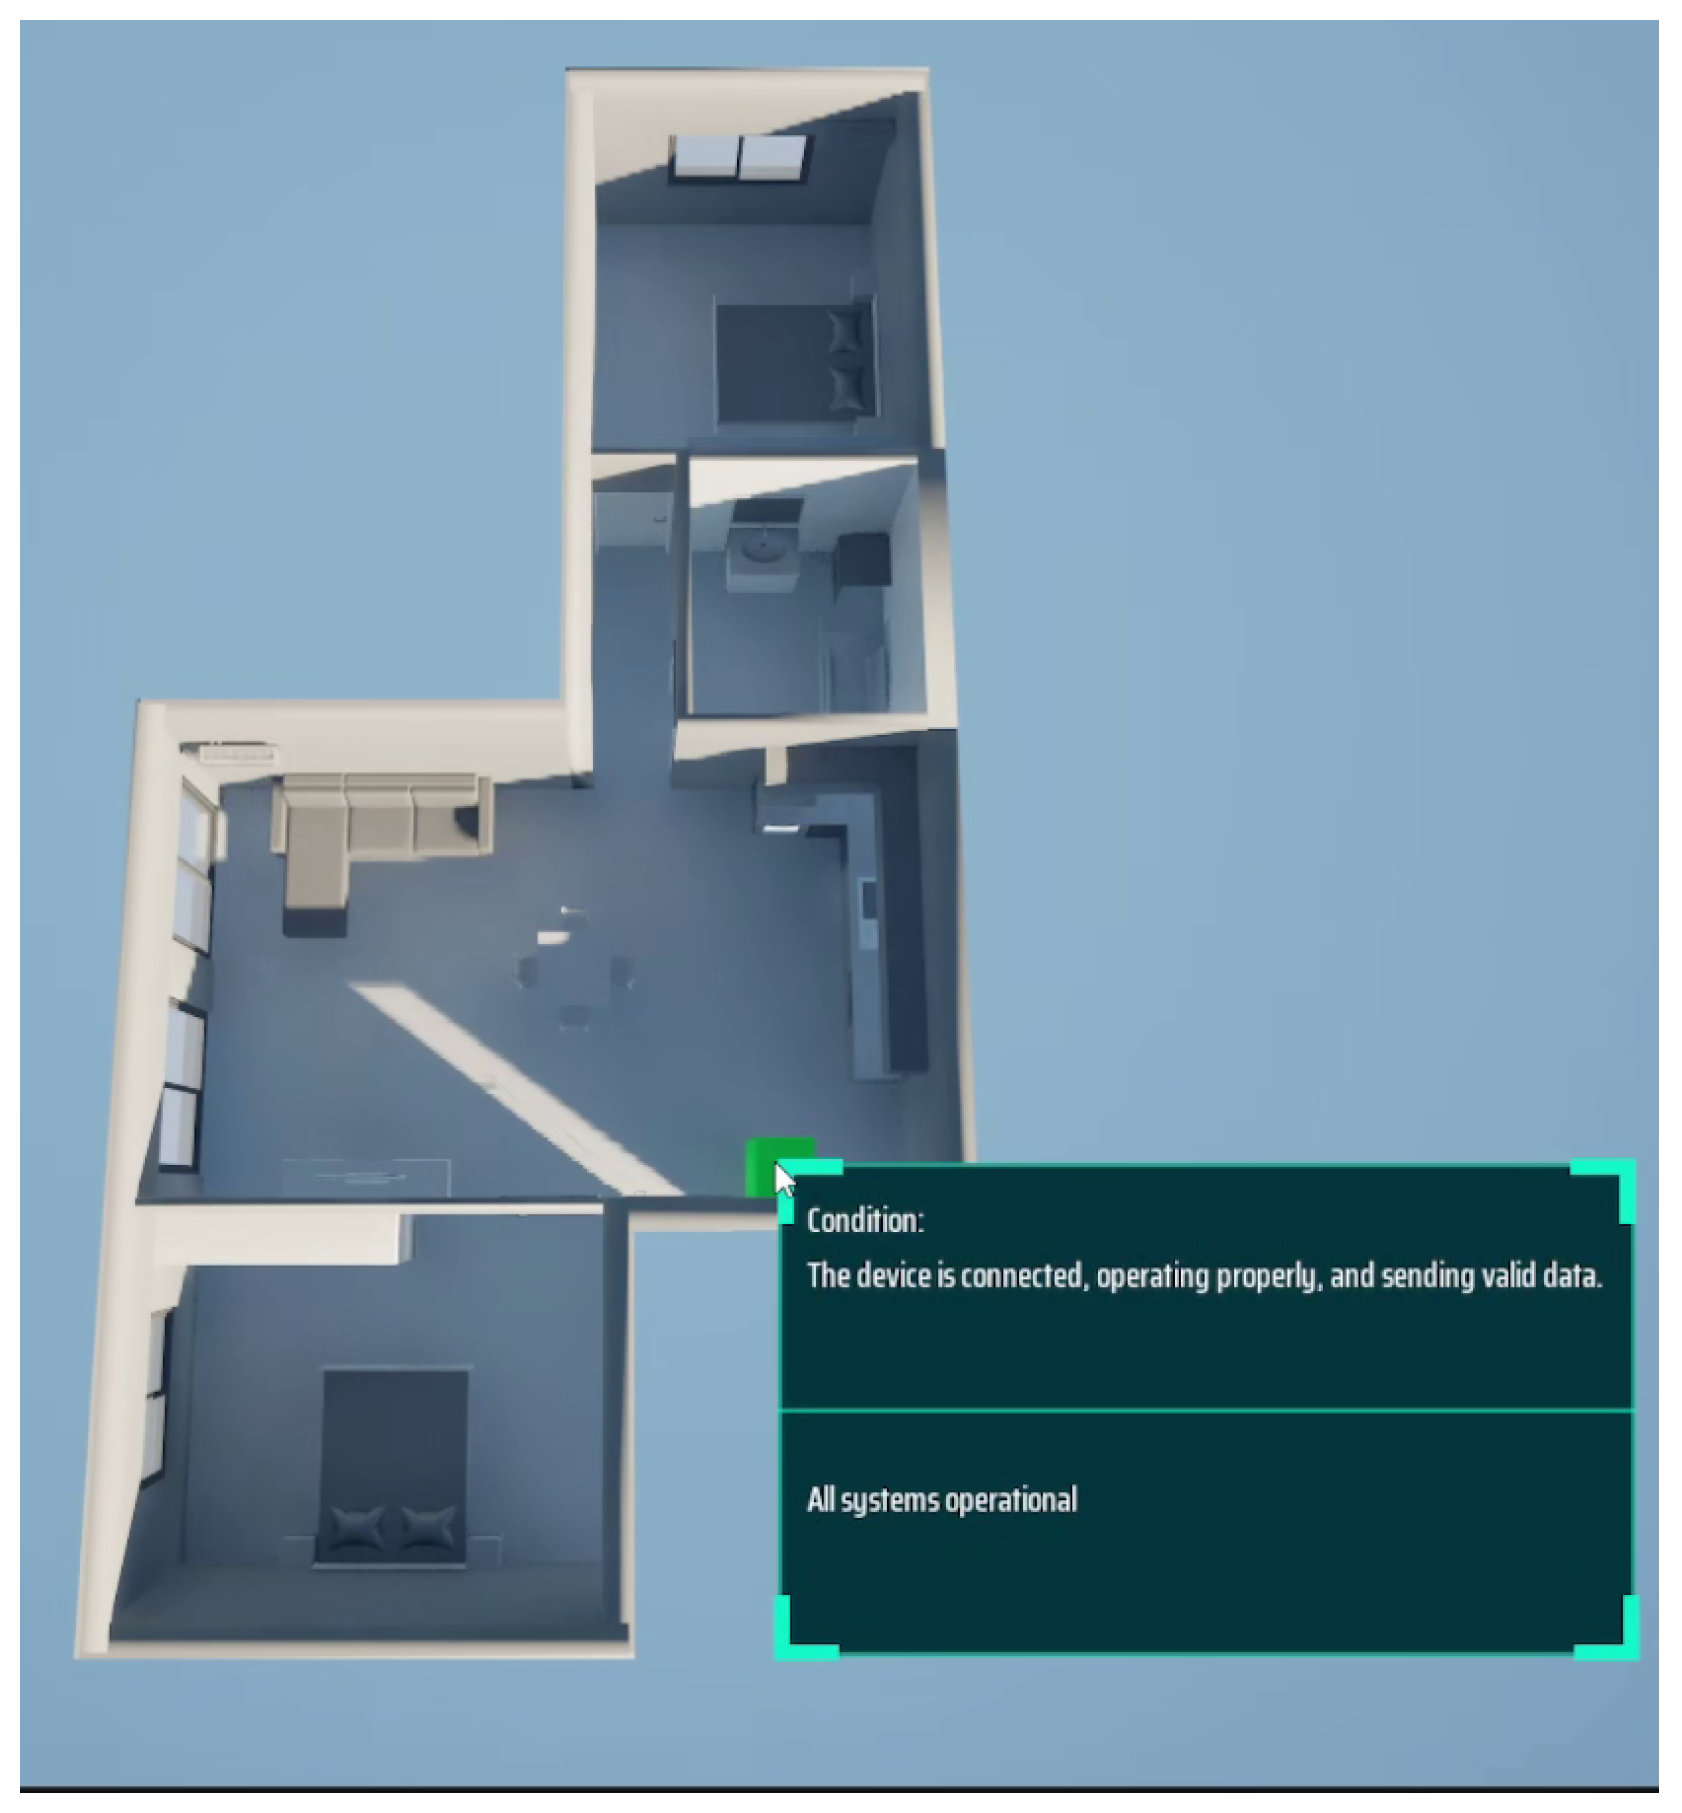
This use case is the baseline condition, in which an appliance is functioning correctly, connected to the system, and transmitting valid telemetry data without any deviations or service requirements. When no diagnostic anomalies or routine events are present, the ENACT system classifies the appliance as being in normal operation. The device is visually represented in green within the 3D views of the DT interface. A status message (e.g., “All systems operational.”) is passively maintained within the device’s state log. The device is visually represented in green within the views of the DT interface. A status message (e.g., “All systems operational.”) is passively maintained within the device’s state log. No pop-up alerts or intervention cues are displayed, ensuring that normal operation does not disrupt the user experience. While the status is recorded in the background for completeness and a potential historical analysis, it is not surfaced unless explicitly queried. This use case demonstrates ENACT’s ability to maintain a clean and unobtrusive user interface during stable appliance operation while still preserving a continuous digital history of the system behavior.

4.2.5. Use Case 5: Disconnected/No Data

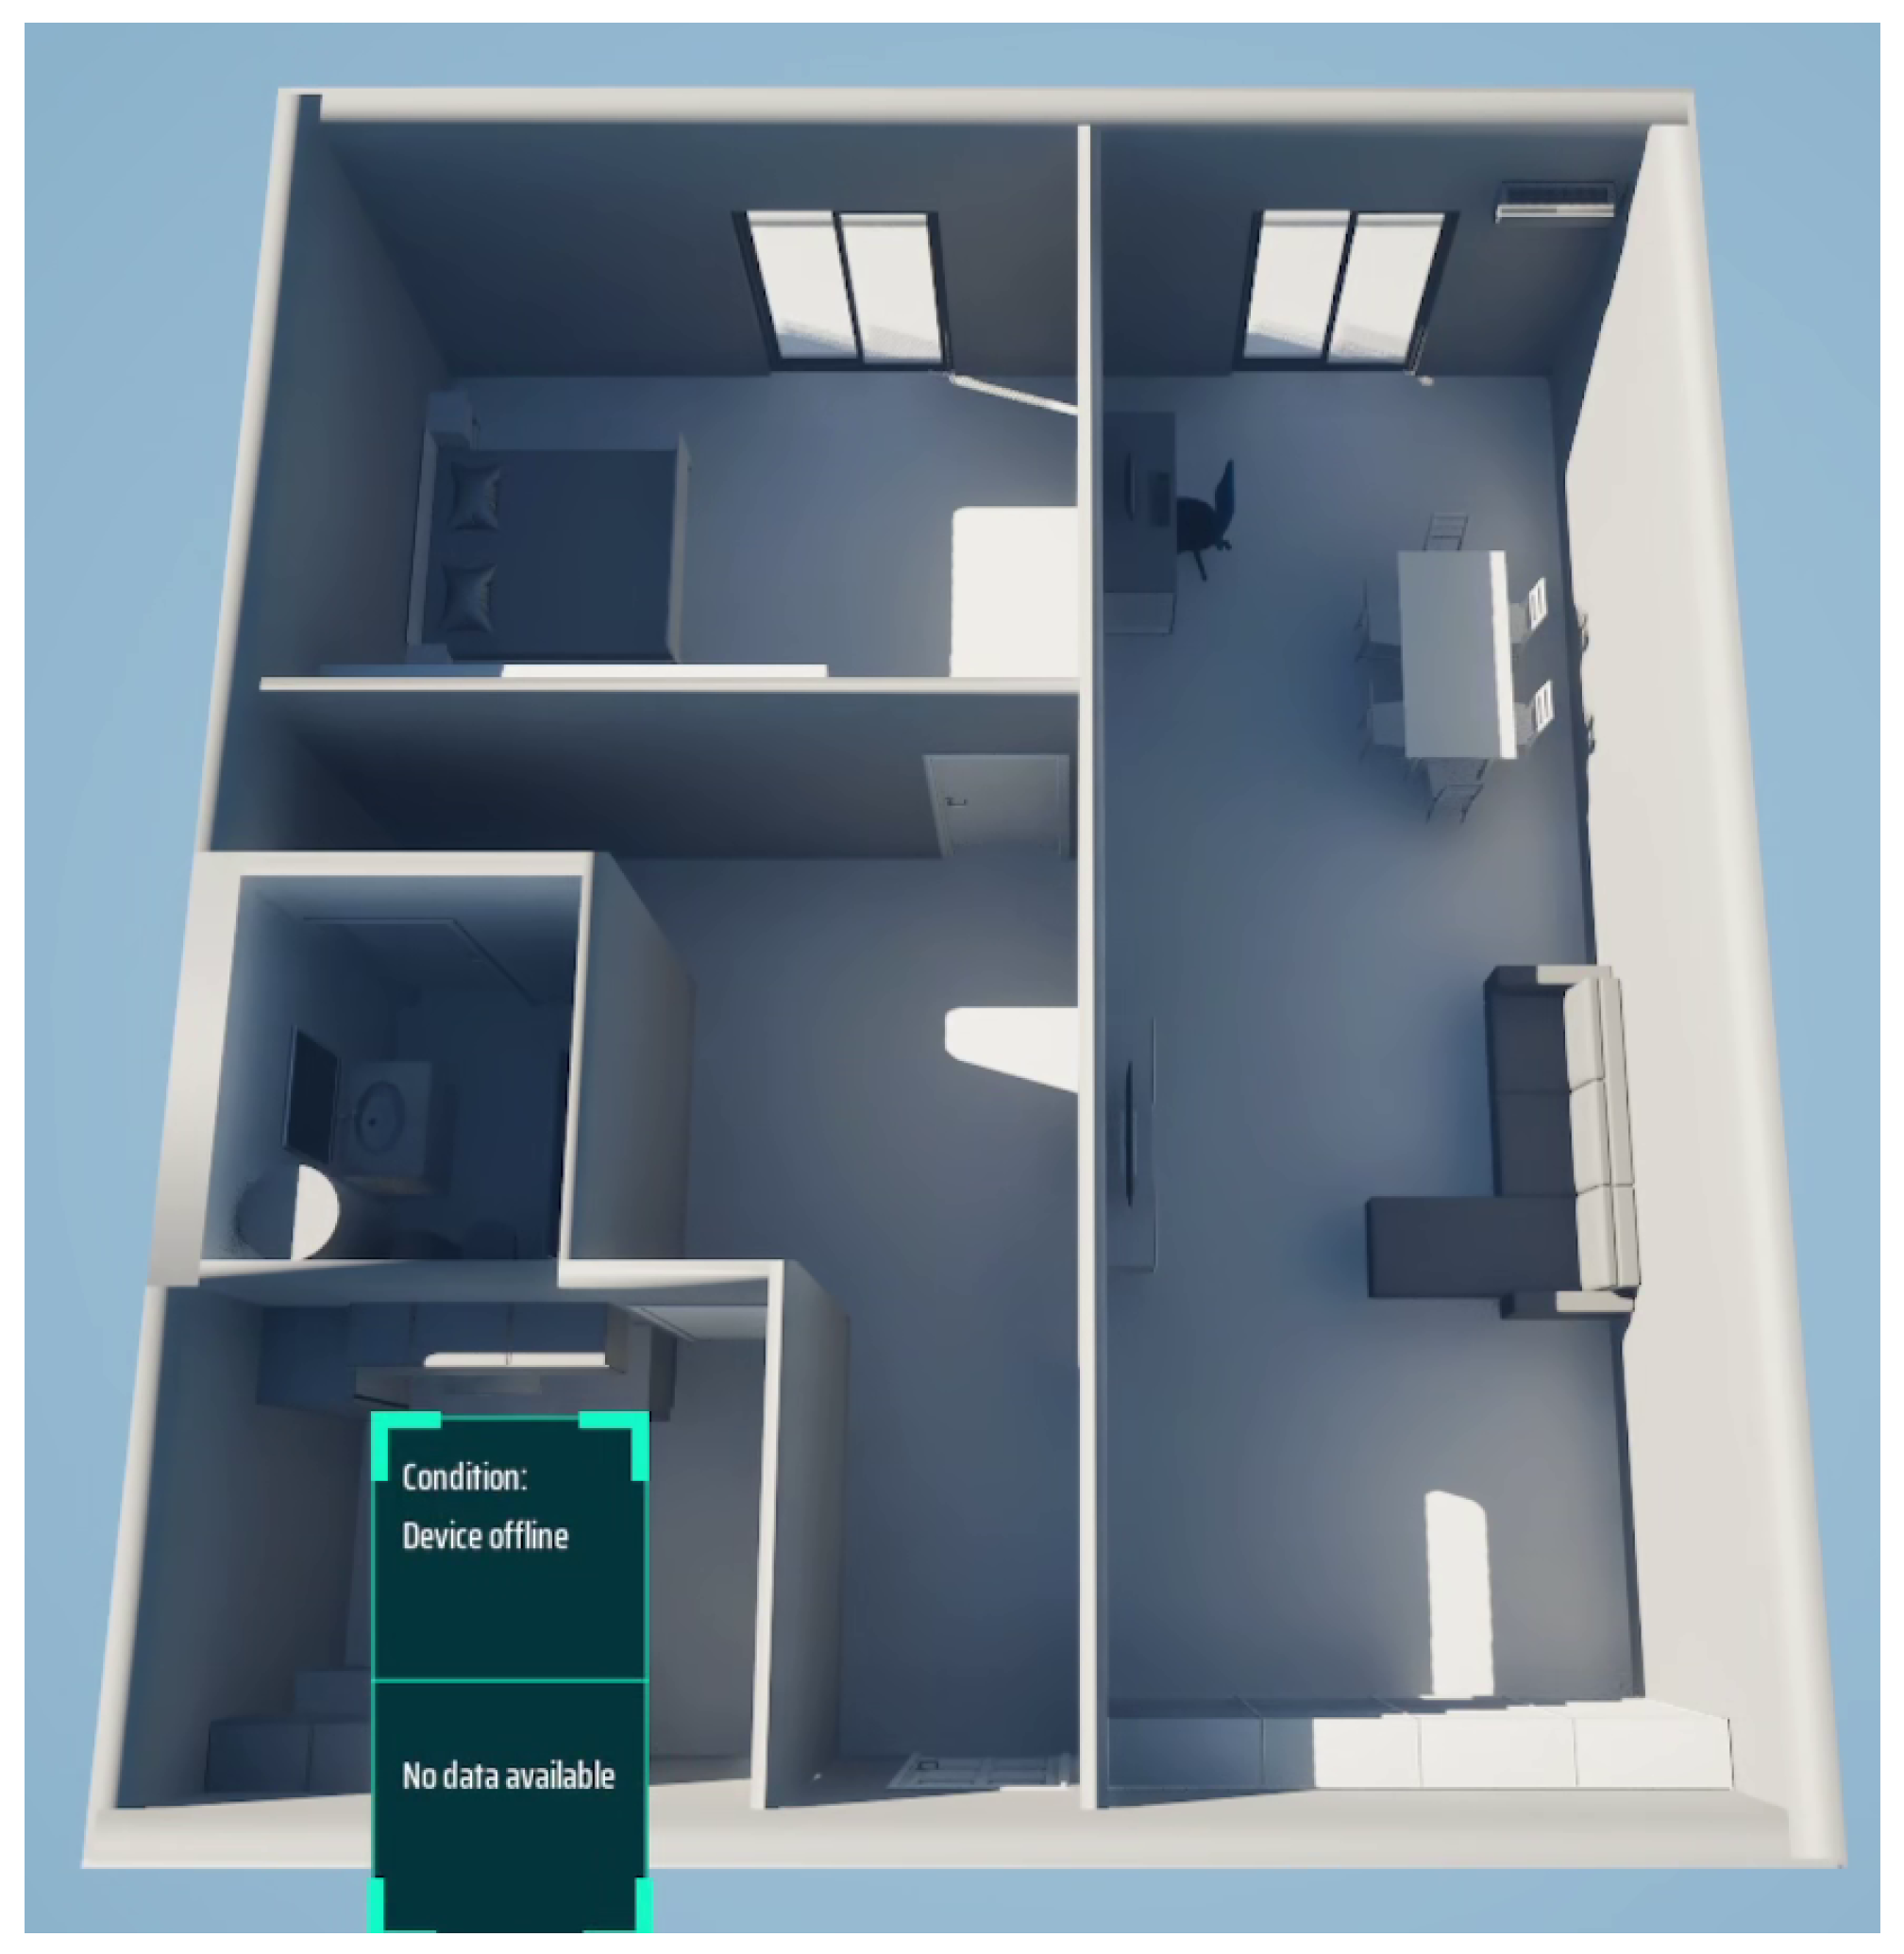
This use case refers to situations where a device is either not physically connected to a smart plug or has temporarily stopped transmitting data due to connectivity issues, power loss, or user configuration changes. In such cases, the ENACT system classifies the appliance as offline or non-reporting. The affected device is visually displayed in gray or with a faded appearance in the digital twin interface. A passive message such as “No data available” or “Device offline” is associated with the icon. If the condition is temporary, such as a short-term Wi-Fi drop or a scheduled power cycle, it is treated as a low-priority event. However, if the data gap persists beyond a defined threshold, the system can escalate the condition based on usage patterns or user preferences. The disconnected status is logged and timestamped, but no pop-up is generated unless the user manually queries the device or a pattern of intermittent outages is detected. This use case supports context-aware system monitoring, allowing users to distinguish between normal unavailability and potential configuration or hardware issues without generating unnecessary interruptions.

4.3. Behavioral Impact and Usability Assessment

To assess both the usability of the ENACT framework and its impact on users’ energy awareness and behavioral changes, a mixed-method evaluation strategy was employed. The core of the assessment was based on the standardized System Usability Scale (SUS), a well-established and lightweight tool for measuring perceived usability in interactive systems. In addition to the SUS, a set of four custom behavioral questions (BQs) was designed to evaluate the influence of the framework on sustainable maintenance behavior and user mindsets. These questions were administered using a five-point Likert scale (1: Strongly Disagree; 2: Disagree; 3: Neutral; 4: Agree; 5: Strongly Agree) and focused on user awareness, behavioral intentions, and confidence in proactive appliance care. The specific statements included
  • BQ1. Using ENACT made me more aware of how much energy my household appliances consume.
  • BQ2. The recommendations of ENACT motivated me to take maintenance actions that I would have otherwise ignored.
  • BQ3. Since using ENACT, I have changed the way I think about appliance longevity and energy efficiency.
  • BQ4. I feel more confident in managing the maintenance of my appliances thanks to ENACT.
  • BQ5. At the end of the questionnaire, participants were also invited to respond to the following open-ended question: “What feature or aspect of the system did you find most helpful or appealing? Feel free to share any additional comments or suggestions”.
The participants completed the full survey six months after interacting with the system during real-world use case trials. Their SUS scores were analyzed quantitatively to establish a usability benchmark, while the behavioral questions provided insights into the cognitive and motivational shifts enabled by the ENACT system. These findings support the evaluation of ENACT as a technical solution while behaviorally informing the intervention toward sustainable appliance management.

5. The Experimental Results

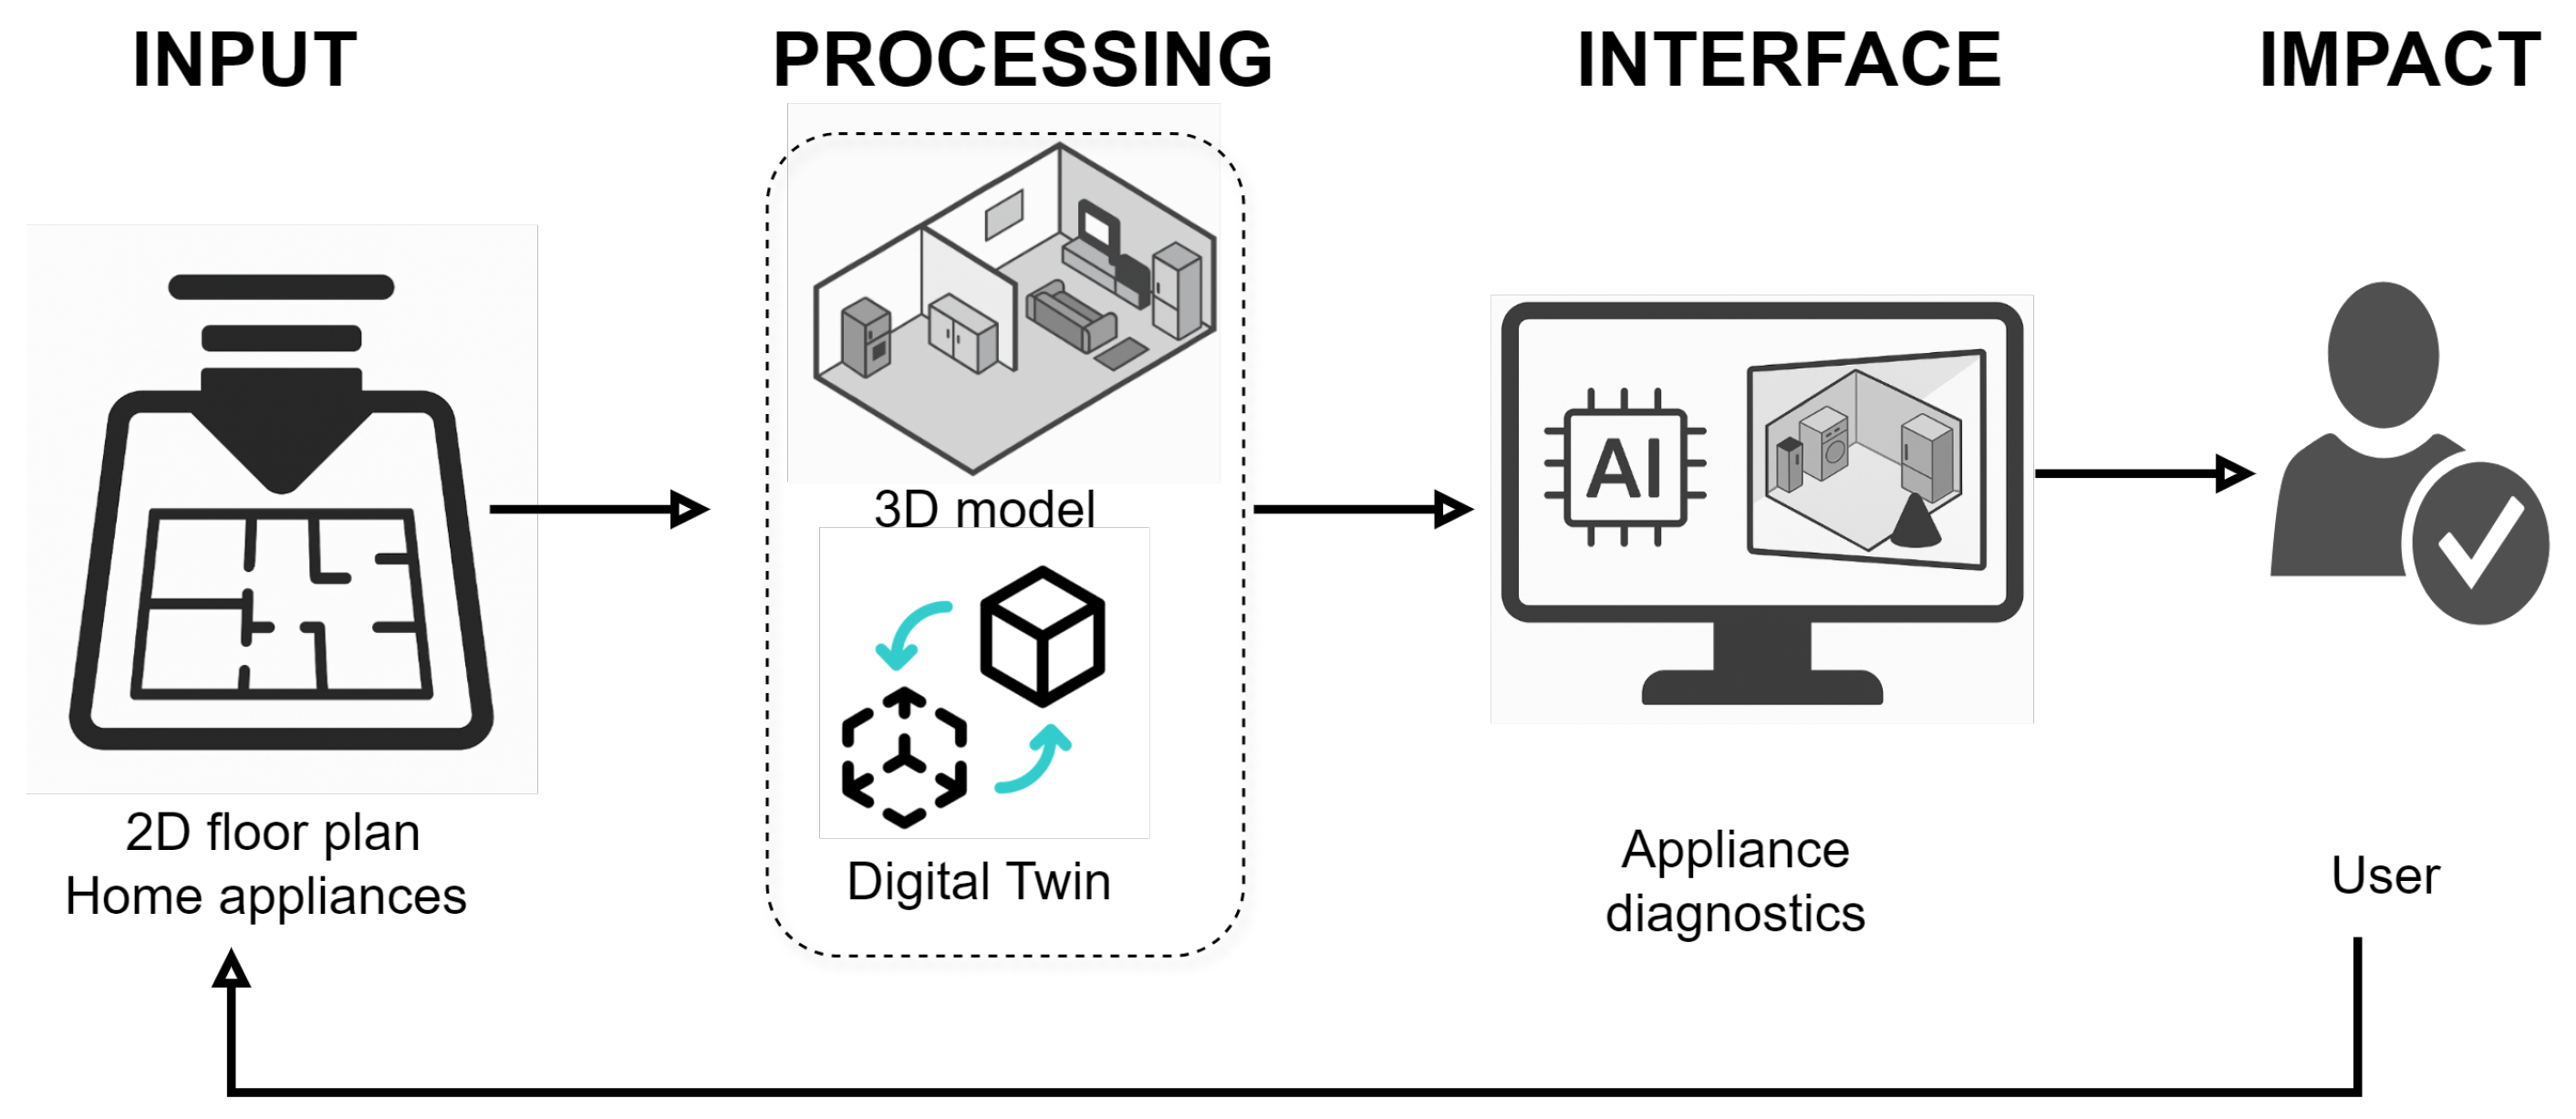
This section presents the results of the ENACT framework’s deployment, evaluating its effectiveness across three dimensions: system fidelity from user-defined layouts to real-time DTs, the algorithmic accuracy of the prescriptive maintenance models, and the behavioral response of end-users. To support this evaluation, Figure 5 depicts the end-to-end pipeline of the system, from the initial 2D floor plan input to the final user-facing diagnostics and maintenance feedback. This diagram serves as a high-level summary of the operational stages detailed in Section 3 and Section 4.

5.1. The Experimental Setup

5.1.1. Deployment Conditions

To evaluate the ENACT framework under real-world conditions, a longitudinal deployment was conducted across 20 residential households over a period of one year (May 2024–June 2025). In each household, the system was installed, consisting of a single Raspberry Pi (RPi) configured as a local MQTT hub and five smart plugs assigned to selected household appliances. Prior to system activation, participants were granted access to the ENACT mobile application. Through the application, users were instructed to design a 2D floor plan of their residence using the Grid4Space interface. Structural elements (e.g., walls, doors, rooms) and appliance placements were defined by each household, with the resulting layouts exported in both image and JSON formats. These layouts were automatically converted into spatially accurate 3D models, which were integrated into the digital twin environment. Navigation within the 3D interface was enabled via the ENACT application, allowing for real-time interaction with appliance status and prescriptive recommendations.
Appliances were selected from a predefined set comprising refrigerator, washing machine, dishwasher, oven, dryer, and air conditioner. In each household, four appliances were randomly chosen for monitoring to ensure diversity in the operational profiles and allow for an evaluation of both on-demand and continuously operating devices. A heterogeneous deployment scenario was thus established, simulating realistic usage conditions across different domestic configurations. The distribution of the appliances across the participating households is presented in Table 4.
The smart plug telemetry, including power usage, on/off status, and temporal profiles, was continuously transmitted to the RPi and then processed by the ENACT system. Real-time operational data were visualized within each household’s 3D model, where prescriptive recommendations were sent based on AI-driven diagnostics. This setup enabled continuous, device-level monitoring under authentic residential conditions and provided the basis for evaluating both the technical performance and user interaction.

5.1.2. Participant Characteristics

Table 5 summarizes the main participant characteristics. The sample included variations in the household sizes, age distribution, and digital literacy, allowing us to capture a range of behaviors and awareness levels relevant to appliance maintenance. While the study is not intended to be statistically representative, this diversity offers a meaningful perspective on how different user types interact with the ENACT framework.
It should be noted that the participant pool was drawn from a single geographical context. While this does not affect the technical validity of ENACT, which is designed as a plug-and-play framework at the household level, it does limit the generalizability of the behavioral results. Broader deployments across different regions and socio-economic contexts will be required to confirm the universality of the user engagement findings.

5.1.3. Events and Prescriptions

To provide further clarity on the outcomes of the experimental evaluation, the numbers and types of events triggered by ENACT during this study are reported in this section. Events include both diagnostic detections (from the AI models) and prescriptive maintenance recommendations (delivered through the interface). The prescriptions follow the categories summarized in Table 3, but their frequency depends on the appliance type and usage patterns. On average, each household operated five monitored appliances. Routine maintenance reminders (e.g., filter cleaning, periodic servicing) were generated regularly, while prescriptive guidelines were delivered according to the condition of the appliance. Diagnostic events were categorized as major or minor depending on the severity of the anomaly detected. Table 6 provides an overview of the total number of events recorded across the twenty households during the study period.

5.2. Deployment Feasibility and Cost Analysis

For the purpose of supplementing the technical testing, a cost breakdown was conducted to estimate the scalability of ENACT for residences. As can be seen in Table 7, the required hardware per household is incredibly low: 1 IoT hub (the Raspberry Pi or a cheap ESP32 equivalent) and 4–5 smart plugs to outfit major appliances. The total hardware price per residence is approximated at USD 90–150, not counting a smartphone already possessed by the user. Because prescriptive maintenance attained as much as a 30% reduction in appliances’ energy usage, the system had a quick payback period, and this therefore made ENACT technically and economically feasible for broader use.

5.3. Use Case Scenarios

To validate the functionality and responsiveness of the ENACT system, a series of representative use cases was defined and tested in real residential deployments. Each scenario captures a distinct appliance condition, from normal operation to critical failure, and demonstrates how the digital twin interface supports user awareness, diagnostics, and decision-making. All use cases are visualized at the respective GitHub link [38].

5.3.1. Use Case 1: Emergency Intervention

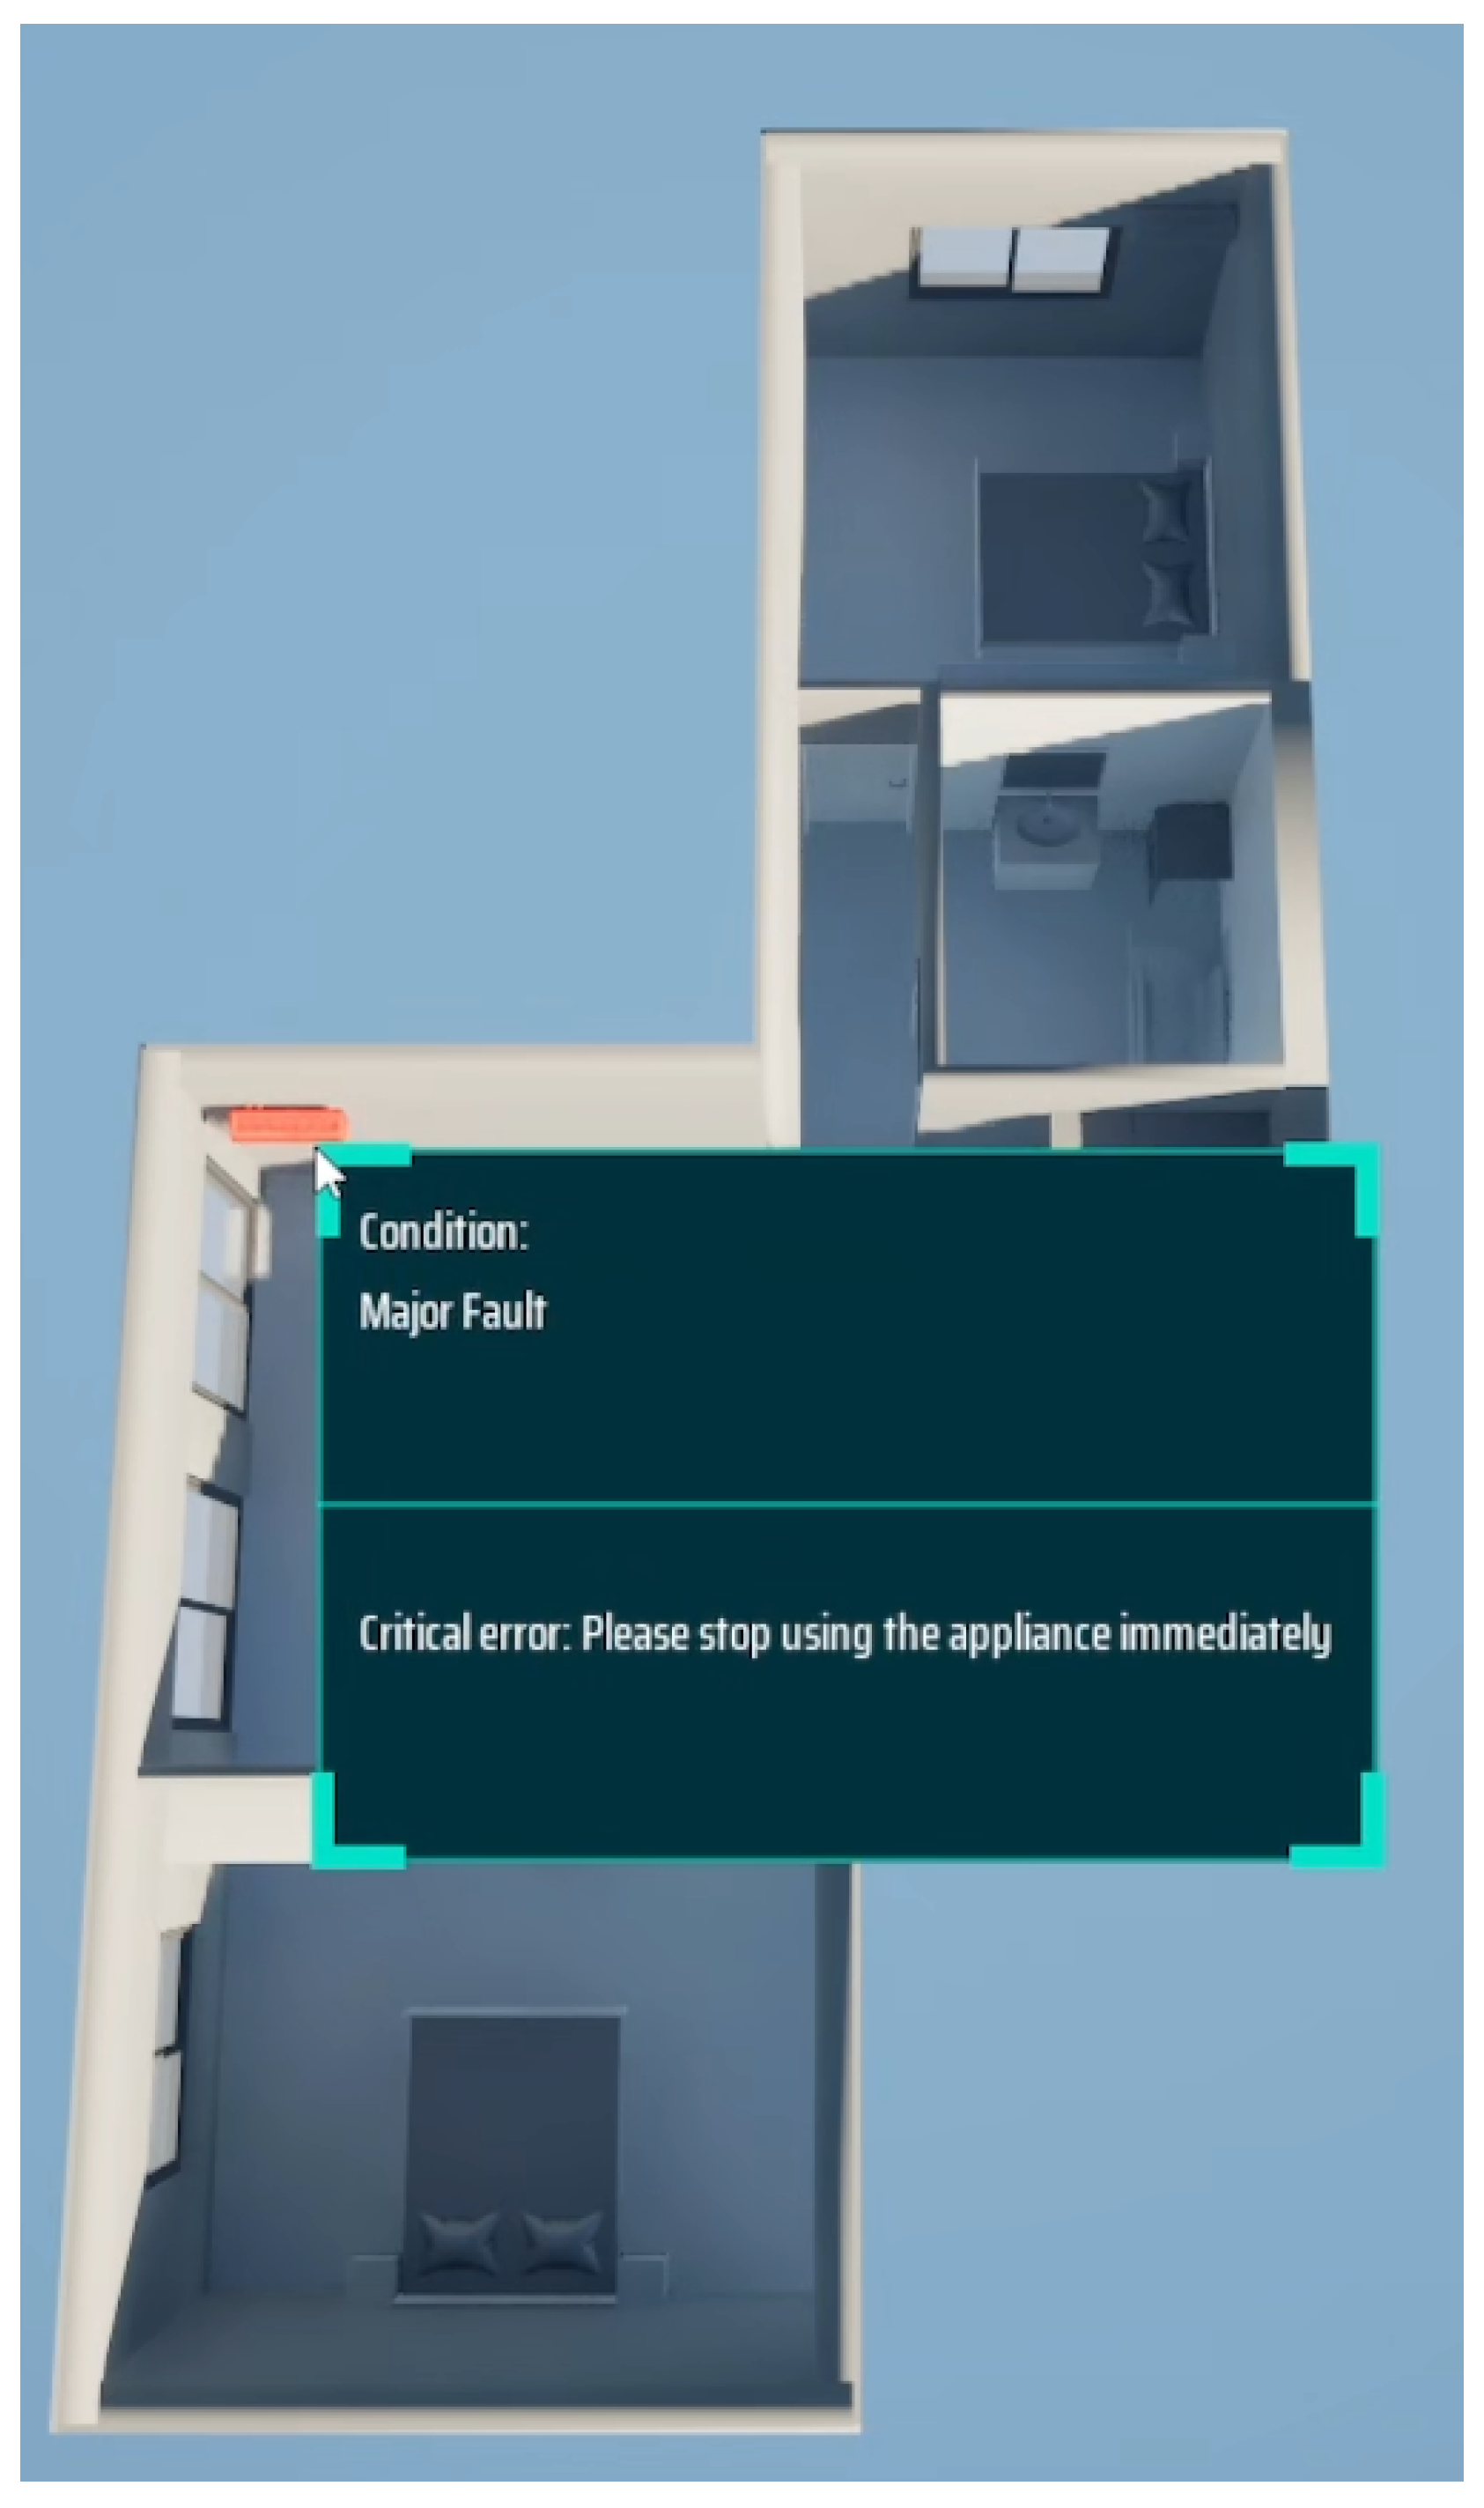
In the context of Use Case 1, the ENACT system successfully identified a critical fault in a monitored appliance (i.e., the air conditioning (AC)) and initiated an emergency intervention protocol. As illustrated in Figure 6, the affected device was immediately highlighted in red within the 3D digital twin environment, accompanied by an overlaid diagnostic panel. The panel explicitly indicated a “Major Fault” condition and issued a critical error message instructing the user to stop using the appliance immediately. This real-time alert mechanism ensured rapid user awareness and enforced a high-priority maintenance response. The interaction validated the system’s ability to detect severe anomalies, accurately classify the condition, and deliver targeted, context-aware feedback directly within the spatial interface. Through this scenario, ENACT demonstrated its effectiveness in managing high-risk events with minimal user ambiguity or delay.

5.3.2. Use Case 2: Minor Intervention

In this scenario, a minor malfunction was detected in the refrigerator, representing a non-critical but noteworthy deviation from the normal behavior. The ENACT system identified the anomaly based on subtle fluctuations in the energy consumption patterns, potentially indicating early-stage issues such as airflow obstruction or internal component wear. The condition was automatically classified as a warning state and visualized accordingly. As shown in Figure 7, the affected appliance was highlighted in orange within the 3D digital twin interface, accompanied by a contextual diagnostic message reading “Condition: There is a minor malfunction.”. This type of event does not require immediate cessation of use but instead prompts the user to perform a targeted inspection or cleaning task. The alert remains active until the system confirms that normal operational parameters have been restored. This use case highlights the system’s ability to detect and communicate early-stage inefficiencies in a non-intrusive manner. By differentiating between critical and minor anomalies, ENACT supports a graduated maintenance strategy that encourages timely user intervention without inducing alert fatigue or unnecessary disruption.

5.3.3. Use Case 3: Routine Maintenance Notification

This use case demonstrates the ENACT system’s capability to promote timely, routine maintenance through prescriptive recommendations, even in the absence of operational faults. In the scenario shown, the washing machine was identified as requiring internal cleaning to prevent the growth of mold, detergent residue buildup, and degradation of the washing performance. The system triggered a maintenance notification based on usage patterns, time-in-operation thresholds, and sensor input indicative of residue accumulation. As depicted in Figure 8, the appliance is highlighted in cyan within the 3D digital twin environment. A contextual maintenance panel appears, informing the user of the condition and providing a direct, actionable recommendation: “Use a cleaner on the inside of the washing machine tubs and clean out the fabric softener dispenser.”. This non-intrusive advice supports long-term appliance health and energy efficiency. The system avoids alarm-based disruptions while promoting proactive behavior through clear, contextual cues embedded into the spatial interface.

5.3.4. Use Case 4: Normal Operation

In Use Case 4, the refrigerator was observed to operate under normal conditions, illustrating the ENACT system’s baseline state monitoring functionality. As shown in Figure 9, the appliance (i.e., refrigerator) was represented with a green indicator within the 3D digital twin environment, signaling that the device was connected, functioning properly, and continuously transmitting valid telemetry data. The diagnostic overlay confirmed this status, stating “All systems operational” and affirming the absence of faults or service requirements. No alerts or maintenance prompts were issued, and the appliance remained in a passive monitoring state. This scenario validated the system’s ability to unobtrusively confirm stable appliance behavior while maintaining continuous backend data logging for future trend analysis.

5.3.5. Use Case 5: Disconnected/No Data

This use case illustrates a scenario where a monitored appliance becomes unreachable due to network disconnection, power loss, or sensor failure. In this example, the refrigerator was reported as offline by the ENACT system. As shown in Figure 10, the appliance is displayed in gray within the 3D digital twin, accompanied by a contextual message panel that indicates the status ‘Device off’ and ‘No data available’. The system automatically detected the absence of telemetry updates and visually flagged the appliance as inactive, allowing the user to recognize the issue without needing to perform a physical check. This offline status may result from unplugging, a smart plug malfunction, or Wi-Fi connectivity loss. The event was clearly communicated through the interface, ensuring transparency and maintaining user situational awareness. This use case confirms the system’s robustness in handling monitoring interruptions and its capacity to alert users to potential blind spots in the data acquisition layer.

5.4. System Flow: From 2D Design to the Digital Twin

The transformation from a 2D schematic layout to an interactive DT was implemented using a semi-automated pipeline that combined user-driven spatial modeling with programmatic 3D generation. The flow involves four key stages: user input via the Grid4Space application, data export and parsing, 3D model synthesis, and system integration for telemetry binding and live maintenance feedback. Initially, each participating household was instructed to model their residence using the Grid4Space application. As shown in Figure 11, users manually defined the structural layout by placing walls, windows, doors, and rooms onto a grid-based interface. Appliances were positioned using color-coded markers, allowing for spatial localization and semantic labeling. The resulting layout was exported in two formats: a visual PNG snapshot and a structured JSON object containing geometric coordinates, room metadata, and device attributes.
The exported JSON was programmatically parsed and fed into a 3D reconstruction module. Walls, openings, furniture, and appliances were procedurally generated using parametric geometry rules, material libraries, and dimension constraints. For example, the wall thicknesses were differentiated (25 cm exterior, 10 cm interior), room heights were set at 3 m, and tiled surfaces were automatically assigned in wet areas (e.g., bathrooms). Appliances were instantiated based on their spatial tags, preserving the exact placement and type as defined by the user in the 2D model.
The result of this transformation is depicted in Figure 11, where the original floor plan has been converted into a fully navigable 3D representation. Interior elements such as sofas, tables, and cabinets were added to enhance realism and facilitate contextual awareness. The DT interface allows for real-time visualization of appliance health, energy consumption, and anomaly alerts. Throughout operation, smart plug telemetry is dynamically bound to the 3D models. Device status (e.g., normal, warning, fault) is visually encoded using glyphs or color overlays, while prescriptive maintenance prompts are rendered in proximity to affected appliances. This design enables a seamless transition from static architectural input to an interactive, context-aware smart environment.

5.5. Performance Assessment of the PRISM Maintenance Models

The performance of PRISM was assessed using real-world data collected from 20 residential households. Each household was equipped with a varying subset of six appliance types: refrigerator, washing machine, dishwasher, dryer, oven, and air conditioner. Due to natural variation in the household configurations, not all devices were present in every home. This heterogeneity was considered beneficial, as it allowed the system to be tested under realistic deployment conditions.
Two distinct AI-driven methods were evaluated within the PRISM system, aligned with the operational characteristics of the appliances. On-demand devices, including washing machines, dishwashers, dryers, ovens, and air conditioners, were analyzed using the APAD framework. Constantly-on appliances, such as refrigerators, were analyzed using the LSTM-based behavioral classification model, enhanced by ensemble learning techniques.
To evaluate the performance of the prescriptive models, the classification outcomes were defined explicitly. Ground-truth anomaly labels were obtained from appliance-level telemetry, where deviations in the consumption profiles were validated against the expected operational patterns. A false positive was recorded when the system generated an anomaly alert in the absence of a verified deviation, whereas a false negative corresponded to a missed alert despite the presence of a verified deviation. Correctly detected anomalies and correctly identified normal operations were classified as true positives and true negatives, respectively. These definitions enabled the calculation of the precision, recall, F1-score, AUC-ROC, and false positive rates for each appliance type, as reported below. In addition, the average energy savings and user response times were used to measure the practical benefits of the system.
For model training and evaluation, events were balanced across categories to avoid class bias. Specifically, 50 instances were used for each class, corresponding to major diagnostic events, minor diagnostic events, and specific error cases. These events were simulated using [39], ensuring controlled conditions for a consistent comparison across anomaly types.
Table 8 presents the performance metrics of the PRISM models in detecting minor errors, including small deviations in the energy consumption or minor sensor drifts. Although detection is more challenging in these cases due to the subtle nature of the deviations, the models achieved F1-scores between 0.86 and 0.88 across appliance types. The precision and recall values remained balanced, confirming that the system could reliably capture early-stage inefficiencies without overproducing false alarms.
Table 9 shows the performance metrics for major diagnostic errors, including significant power deviations, compressor malfunctions, or system-level failures. The detection of major anomalies proved more accurate than that in minor cases, with precision and recall values consistently above 0.90. These results indicate the effectiveness of PRISM in rapidly identifying critical faults and providing prescriptive maintenance actions in a timely manner.
Table 10 details the performance of the PRISM models in detecting specific error cases, which refer to particular, predefined fault scenarios simulated during the evaluation (e.g., blocked airflow in refrigerators, filter clogging in HVAC units, or motor overheating in dryers). The performance remained robust, with precision and recall values close to 0.89 on average. These results suggest that PRISM can generalize effectively to well-defined but less frequently occurring anomalies, supporting its applicability in diverse operational contexts.
Table 11 summarizes the average performance of the PRISM models across all error categories, obtained as the arithmetic mean of the results for minor, major, and specific diagnostic events (reported separately in Table 8, Table 9 and Table 10). The aggregated results demonstrate a consistent and robust performance, with F1-scores ranging from 0.88 to 0.90 across all appliances. The oven and the washing machine achieved the highest average F1-scores of 0.90, while the dryer exhibited the most balanced behavior between precision (0.90) and recall (0.89). The AUC-ROC values closely followed the F1-scores, confirming that PRISM maintains strong discriminative power even under varying anomaly categories. These average values provide an overall indicator of the system performance, complementing the detailed per-category results.
For constantly-on appliances, the LSTM-based approach also delivered strong results. The refrigerator achieved F1-scores close to 0.90, highlighting the model’s effectiveness in identifying behavioral anomalies within continuously operating systems. Additionally, it maintained a high precision of 0.91, aligning with its steady-state operational profile and low variability in usage.
The energy savings were most significant among the on-demand appliances. The washing machine achieved the highest reduction at 28%, followed by the dishwasher at 26% and the dryer and oven at 25% and 20% respectively. The air conditioner, although user-operated, still benefited from an 18% reduction in energy consumption, further demonstrating the applicability of APAD to intermittently used, high-load devices.
To quantify the reported reductions, a household-specific baseline consumption profile was established from a four-week pre-deployment monitoring period in which no prescriptive recommendations were provided. The energy savings were then computed as the relative difference between this baseline and the measured consumption during the intervention phase. In cases where the number of observed operational cycles during the intervention was insufficient for statistically robust estimates, scenario-based simulations derived from historical usage profiles were employed to approximate potential savings. This methodology ensures that the reductions presented in Table 4 reflect both empirically measured improvements in household energy efficiency and the estimated potential benefits under the consistent adoption of prescriptive feedback.
Table 12 presents a comprehensive set of diagnostic metrics assessing the model behavior under clean and perturbed conditions. For on-demand appliances, the CNN-LSTM-VAE-based APAD models demonstrated strong robustness. Specifically, the washing machine and dishwasher models had AUC values above 0.91 even under Gaussian noise perturbation ( N ( 0 , 0.05 2 ) ), reflecting the encoder’s ability to preserve the discriminative structure despite noisy inputs. Similarly, when 10% of the data points were masked to simulate missing data, the F1-scores dropped modestly (from 0.90 to 0.87), showing that the LSTM’s temporal memory successfully bridged short-term gaps.
Metrics marked with a dash (–) in Table 12 indicate scenarios where the measurement was either not applicable (e.g., phase classification is exclusive to the refrigerator model) or not explicitly evaluated due to similarity in the expected behavior across appliance categories.
The inference latency, a critical consideration for edge deployment, remained below 52 ms across all appliance models. This aligns with the architectural complexity of each model: deeper VAE encoders (used in on-demand devices) incurred a slightly higher latency (45–52 ms), while the simpler LSTM phase classifiers (for constantly-on appliances) achieved faster predictions (as low as 27 ms).
False positive rates (FPRs) were particularly important for ensuring actionable and non-disruptive alerts. The dishwasher and oven models maintained an FPR below 5%, balancing sensitivity and specificity. This prevents excessive or unnecessary maintenance flags while still ensuring faults are detected early.
The refrigerator, modeled using a dedicated LSTM phase segmentation approach, was tested for its resilience to environmental seasonality. The phase classification accuracy remained high, 89.1% in winter and 88.4% in summer, demonstrating generalization under dynamic thermal loads. These results confirm the model’s ability to interpret appliance state transitions consistently, regardless of external temperature variations.
Overall, the evaluation confirms the system’s capability to deliver actionable, device-specific maintenance insights with high predictive reliability. The performance consistency across both appliance categories reinforces PRISM’s adaptability and practical effectiveness in heterogeneous smart home environments.

5.6. Baselines and Comparative Analysis

As no publicly available framework exists that combines appliance-level prescriptive digital twins with user interaction and embedded anomaly detection, direct system-level comparisons are not feasible. Instead, the components of the proposed PRISM framework were evaluated individually against representative state-of-the-art (SoA) models. The anomaly detection component for on-demand appliances (e.g., washing machines, dishwashers) was compared against an Isolation Forest, a One-Class SVM, a Matrix Profile, and an LSTM Autoencoder. For constantly-on appliances, such as refrigerators, phase classification using the LSTM model was benchmarked against Hidden Markov Models (HMMs), GRU classifiers, and Random Forest models using engineered features. All models were trained and tested on the same dataset, comprising both real telemetry data and simulated anomalies generated using a publicly available library [39]. The dataset included 50 instances per class (minor, major, and specific errors), ensuring a balanced evaluation across anomaly types. Identical preprocessing pipelines and nested cross-validation were applied to all methods for fair comparison.
As shown in Table 13, the PRISM models consistently outperformed all baseline methods across all key metrics. For on-demand appliances, PRISM-APAD achieved the highest F1-score (0.90), exceeding the best-performing baseline (LSTM Autoencoder, F1 = 0.85) by five percentage points. Similarly, PRISM-LSTM outperformed competing phase classification models for refrigerators, achieving both higher recall (0.90) and lower false positive rates (FPR = 0.04). Notably, traditional anomaly detection methods such as the One-Class SVM and Isolation Forest yielded lower precision and higher false positive rates, highlighting their limitations in handling complex, multivariate appliance signals. These results underscore the importance of integrating temporal and contextual learning, as applied in PRISM, to achieve both accurate and energy-efficient anomaly detection in appliance-level digital twins.

5.7. User Engagement and Awareness Outcomes

To assess the perceived usability of the ENACT system, the System SUS was administered to all 20 participants after one year of continuous system usage. The results are presented in Table 14. may be found in Appendix A. Individual SUS scores in the questionnaire ranged from 76 to 95, with a distribution spanning both the “Good” (70–80.3) and “Excellent” (>80.3) usability categories. The calculated mean score was 80.5, which met the threshold for “Excellent” usability, as defined in the standardized SUS interpretation framework. These results indicate a high level of user satisfaction, interface clarity, and overall acceptance of the ENACT platform. The presence of several scores near the upper bound further supports the effectiveness of the system in promoting intuitive interaction, visual engagement, and functional reliability across a diverse user base.
To complement the usability assessment, a behavioral evaluation was conducted using the four targeted questions (BQ1–BQ4) designed to measure the system’s influence on user awareness, motivation, and confidence in appliance maintenance. The per-user responses are summarized in Table 15. The results show a strong overall trend toward agreement or strong agreement across all four behavioral dimensions. The average scores were 4.55 for BQ1 (awareness), 4.5 for BQ2 (motivation to act), 4.65 for BQ3 (change in mindset), and 4.7 for BQ4 (confidence). These findings indicate that the ENACT system not only facilitated user interaction through a usable interface but also effectively influenced long-term behavioral engagement and proactive attitudes toward sustainable appliance care.
To capture qualitative user impressions, an open-ended question (BQ5) invited the participants to share the most helpful or appealing aspect of the ENACT system. The responses were thematically analyzed and grouped into five categories, as summarized in Table 16. The most frequently cited themes included the usefulness of the alerts and maintenance recommendations, increased awareness of energy consumption, and the simplicity of the interface. Several participants also reported a shift in their mindset toward more proactive appliance care, while others emphasized the value of the system’s integrated workflow from initial 2D layout creation to real-time monitoring. These insights further validate the system’s impact not only on usability but also on long-term engagement and behavioral adaptation.
The survey results confirm that while users declare awareness of maintenance practices, their actual behavior remains reactive. In this context, the graphical interface is not an ancillary feature but a targeted response to this gap: it transforms the prescriptive outputs of the AI models into intuitive visual feedback. By doing so, it directly addresses the lack of immediate and comprehensible information reported by users, supporting the intended shift from reactive to proactive maintenance behavior.

Analysis of User Behavior Changes and Energy Implications

The qualitative feedback from the twenty participating households demonstrates that ENACT had a clear impact on user behavior. Several users explicitly highlighted the usefulness of the alerts and prescriptive recommendations for guiding timely actions, such as cleaning filters or checking appliance components (U03, U07, U14, U18). Others emphasized that the system increased their awareness of appliance-level energy consumption (U05, U10, U13, U19), while many valued the simplicity and clarity of the interface, which made the information more actionable (U02, U08, U12, U15). Importantly, several participants reported a change in their general maintenance mindset, describing that the framework changed how they think about appliance care (U04, U06, U11, U17). In addition, users noted the value of the integrated workflow from floor plan definition to real-time alerts (U01, U09, U16, U20), underlining the importance of connecting technical diagnostics with an intuitive presentation.
These findings suggest that ENACT promotes a measurable change in user engagement with maintenance tasks. Although the present study did not aim to quantify direct energy savings, the observed behavioral changes have indirect but significant implications for energy performance and device longevity. By prompting timely cleaning and preventive actions, ENACT reduces the operational inefficiencies that typically lead to a higher energy consumption. The shift from reactive repair to proactive maintenance, as evidenced by the user feedback, provides the behavioral foundation required for sustained gains in energy efficiency in real-world residential environments. Thus, ENACT’s contribution lies not only in the technical integration of DTs and prescriptive intelligence but also in its ability to influence user behavior in ways that support long-term energy and sustainability objectives.

6. Discussion

6.1. Scalability, Cybersecurity, and Smart City Integration

ENACT was designed to be a user-focused system, aimed at one-family households and customized care for appliances. Its main goal is to look at the consumption behavior at the household level and provide context-dependent, individualized recommendations. As a consequence, there is no incentive in function to allow one household to observe another’s consumption behavior, nor would this be desirable from a privacy aspect. Thus, multi-apartment or city-level utilization of ENACT does not equate to common user behavior data but its technical scalability.
ENACT’s architecture is design-wise fully scalable. It adopts a plug-and-play, modular design with edge-based computing, wherein each deployment is able to function independently and securely without the need for central cloud services. This distributed architecture sidesteps network bottlenecks and enables hundreds or thousands of homes to be served simultaneously. MQTT also applies low-latency, lightweight, device-to-device communication and has been demonstrated in earlier work to be an appropriate protocol for the large-scale deployment of smart homes [40]. Edge computing platforms have also been identified as key enablers for large-scale, fault-tolerant smart city infrastructure [41]. Compared to cloud-based deployment, in which the data is centrally stored and facilitates big analytics, ENACT’s edge-centric architecture guarantees low latency, local control, and enhanced privacy. While cloud offers scaling, edge deployment decreases the dependency on third-party infrastructure and boosts the responsiveness in real-time.
In addition, continuous development work also aims to make the 2D-to-3D spatial modeling process automatic, which has been manually controlled through the Grid4Space tool. Rendering this transformation even more efficient, ENACT will cut the setup time and technical overhead considerably and pave the way for high-speed and scaled deployments in apartment buildings or city blocks.
Meanwhile, cybersecurity and privacy are paramount. ENACT applies a privacy-by-design philosophy in which sensitive data (i.e., layout models, telemetry) are stored locally and not remotely in the cloud. Secure MQTT with TLS encryption and device authentication is applied to device communication. Other more recent solutions, including Elliptic Curve Cryptography (ECC) and MQTT middleware extensions, are being examined to enhance data confidentiality and identity authentication further in low-power environments [42].
Lastly, as ENACT is per-household-consumption-oriented, its integration into smart city platforms is also expansive. Aggregated and anonymized leveled appliance data may enable city-level energy monitoring, grid stabilization, and sustainability policy development. This mirrors the latest developments in IoT and edge convergence in city infrastructures [43], demonstrating ENACT’s capability for use not only as a home assistant but even within general energy intelligence systems.

6.2. The Advantages of the CNN-LSTM VAE over Traditional Methods

The adoption of the CNN-LSTM VAE architecture for anomaly detection provides several advantages compared to traditional approaches. Classical methods such as the Isolation Forest, One-Class SVM, and Matrix Profile primarily rely on statistical distance measures or frequency-based thresholds. While effective for simple patterns, these methods often exhibit reduced accuracy when applied to high-dimensional, noisy, and non-stationary signals typical of appliance telemetry. Similarly, LSTM Autoencoders capture temporal dependencies but lack explicit mechanisms for localized feature extraction and therefore may struggle with multivariate data streams containing overlapping events.
In contrast, the CNN-LSTM VAE integrates three complementary components. The convolutional layers perform localized feature extraction, capturing short-term fluctuations and spatial dependencies in the signal. The LSTM layers model sequential patterns, enabling the framework to detect long-range temporal dependencies and evolving appliance behavior. Finally, the variational bottleneck enforces robust latent space regularization, which improves the generalization and reduces the sensitivity to noise or outliers. This combination makes the model particularly effective in detecting both subtle deviations (minor anomalies) and pronounced disruptions (major anomalies).
The comparative analysis presented in Section 5.3 (Table 13) empirically supports these claims. Across on-demand appliances, the CNN-LSTM VAE (PRISM-APAD) achieved an average F1-score of 0.90, outperforming the best traditional baseline, the LSTM Autoencoder, by approximately five percentage points. For constantly-on appliances, the LSTM-based phase classifier consistently outperformed HMMs and Random Forest models in both precision and recall. Furthermore, the false positive rates were reduced to 0.04, compared to 0.07–0.10 for the baseline approaches. These findings highlight the importance of combining convolutional, sequential, and probabilistic modeling when addressing the challenges of appliance-level anomaly detection in digital twins.

7. Conclusions

This paper presented ENACT, a novel framework that leverages DT technology, prescriptive maintenance logic, and IoT infrastructure to enhance awareness, sustainability, and user empowerment in residential appliance management. The system was designed to address the widespread issue of unnoticed faults and energy inefficiencies in household devices, problems often exacerbated by limited user knowledge and a lack of preventive maintenance behavior. ENACT integrates smart plugs, a user-friendly mobile application, and both 2D and 3D modeling environments to provide a spatial, real-time visualization of appliances, their status, and their maintenance needs. A structured workflow was established, starting from user-defined floor plans to fully rendered DTs enabling contextual feedback and diagnostic alerts tailored to each household. The system’s functionality was validated through a one-year deployment in 20 residential homes, during which users interacted with the ENACT app to manage five common appliances.
The results demonstrated high usability and a significant behavioral impact. A SUS score averaging 80.5 confirmed its excellent acceptance and ease of use. Complementary behavioral metrics revealed increased user awareness, higher motivation to perform maintenance, and a positive shift in mindset regarding appliance longevity and energy efficiency. The open-ended feedback further supported these findings, with users highlighting the value of the visual interface, actionable alerts, and integration of maintenance intelligence. The ENACT framework shows strong potential as a foundational layer for future smart home systems that go beyond passive monitoring toward truly prescriptive, adaptive maintenance support. Future directions include refining the anomaly detection pipeline with machine learning techniques, integrating predictive analytics for failure forecasting, and evaluating the long-term impact on energy savings and appliance lifespans across more diverse household types [42].
While this study demonstrated ENACT’s feasibility over a 12-month deployment, future research should incorporate longitudinal usage analytics to understand behavioral changes and maintenance patterns over time better. By aggregating and analyzing multi-year usage data, it will be possible to quantify how prescriptive maintenance influences appliance health, energy savings, and user engagement trajectories beyond the initial adoption phase. Moreover, future work will focus on enhancing the visual environment of the DT interface to improve user engagement and comprehension further. Planned developments include refining the spatial realism of the appliance representations, incorporating dynamic animations for fault progression, and enabling richer interactions with maintenance workflows. In addition, gamification techniques will be explored to sustain long-term behavioral engagement, such as achievement tracking, usage challenges, or household efficiency scores, with the aim of motivating users to consistently monitor and maintain their appliances. Future deployments will also incorporate longitudinal usage analytics, such as the frequency of interface interactions and compliance with prescriptive actions, to provide deeper insights into sustained user engagement and long-term behavioral changes. These interface improvements will be accompanied by validation studies across larger and more diverse user groups, supporting the generalization and scalability of the ENACT framework.

Author Contributions

Conceptualization: A.D., C.P., and A.P.; Methodology: M.S. and A.D.; Software: M.S., C.P., and O.E.; Validation: A.D.; Writing—original draft: M.S., A.D., C.P., O.E., and A.P.; Writing—review & editing: M.S., A.D., C.P., and A.P.; Visualization: M.S., A.D., O.E., and A.P.; Supervision: S.K. and C.-N.A. All authors have read and agreed to the published version of the manuscript.

Funding

This work was partially supported by the FLEdge project F-DUT-2022-0337. The FLEdge project has been funded by the General Secretariat of Research and Innovation (GSRI) under the Driving Urban Transitions (DUT) Partnership and by the European Union.

Informed Consent Statement

Not applicable.

Data Availability Statement

All of the data are included in the paper.

Conflicts of Interest

Author Orfeas Eleftheriou was employed by the company Code-Flow. The remaining authors declare that the research was conducted in the absence of any commercial or financial relationships that could be construed as a potential conflict of interest.

Appendix A. User Questionnaire

The complete questionnaire used in the current investigation can be found in link: https://docs.google.com/forms/d/e/1FAIpQLScp263T35nmNT6ftZ0jedN9q3aEVoPsVi2rchdEYBnTwgybkQ/viewform?usp=sharing (accessed on 8 July 2025).

References

  1. European Commission. Energy Performance of Buildings Directive. Available online: https://energy.ec.europa.eu/topics/energy-efficiency/energy-efficient-buildings/energy-performance-buildings-directive_en (accessed on 1 April 2025).
  2. Dimara, A.; Timplalexis, C.; Krinidis, S.; Schneider, C.; Bertocchi, M.; Tzovaras, D. Optimal comfort conditions in residential houses. In Proceedings of the 2020 5th International Conference on Smart and Sustainable Technologies (SpliTech), Virtual, 23–26 September 2020; pp. 1–6. [Google Scholar]
  3. Sayed, A.N.; Bensaali, F.; Himeur, Y.; Dimitrakopoulos, G.; Varlamis, I. Enhancing building sustainability: A Digital Twin approach to energy efficiency and occupancy monitoring. Energy Build. 2025, 328, 115151. [Google Scholar] [CrossRef]
  4. Rojek, I.; Mikołajewski, D.; Dostatni, E. Digital twins in product lifecycle for sustainability in manufacturing and maintenance. Appl. Sci. 2020, 11, 31. [Google Scholar] [CrossRef]
  5. Laitala, K.; Klepp, I.G.; Haugrønning, V.; Throne-Holst, H.; Strandbakken, P. Increasing repair of household appliances, mobile phones and clothing: Experiences from consumers and the repair industry. J. Clean. Prod. 2021, 282, 125349. [Google Scholar] [CrossRef]
  6. Magnier, L.; Mugge, R. Replaced too soon? An exploration of Western European consumers’ replacement of electronic products. Resour. Conserv. Recycl. 2022, 185, 106448. [Google Scholar] [CrossRef]
  7. Dimara, A.; Tzitziou, G.; Papaioannou, A.; Krinidis, S.; Anagnostopoulos, C.N.; Ioannidis, D.; Tzovaras, D. Appliance maintenance behaviors and sustainability: A European household perspective analysis. Resour. Conserv. Recycl. 2024, 210, 107835. [Google Scholar] [CrossRef]
  8. Jones, D.; Snider, C.; Nassehi, A.; Yon, J.; Hicks, B. Characterising the Digital Twin: A systematic literature review. CIRP J. Manuf. Sci. Technol. 2020, 29, 36–52. [Google Scholar] [CrossRef]
  9. Elfarri, E.M.; Rasheed, A.; San, O. Artificial intelligence-driven digital twin of a modern house demonstrated in virtual reality. IEEE Access 2023, 11, 35035–35058. [Google Scholar] [CrossRef]
  10. Liu, B.; He, X.; Li, Y.; Xiao, Y.; Feng, X.; Chen, L.; Yu, L. Design of Intelligent Home Lighting Control System Based on Speech Recognition. In Proceedings of the Green Energy and Networking: 6th EAI International Conference, GreeNets 2019, Dalian, China, 4 May 2019; Proceedings 6. pp. 150–158. [Google Scholar]
  11. Willcox, K.; Bingham, D.; Chung, C.; Chung, J.; Cruz-Neira, C.; Grant, C.J.; Ye, X. Foundational Research Gaps and Future Directions for Digital Twins; National Academies Press: Washington, DC, USA, 2023. [Google Scholar]
  12. Peter-Paul, V.; Slob, A. User Behavior and Technology Development; Springer: Dordrecht, The Netherlands, 2006. [Google Scholar]
  13. Bouchabou, D.; Grosset, J.; Nguyen, S.M.; Lohr, C.; Puig, X. A Smart Home Digital Twin to Support the Recognition of Daily Living Activities. Sensors 2023, 23, 7586. [Google Scholar] [CrossRef]
  14. Motlagh, N.H.; Zaidan, M.A.; Lovén, L.; Fung, P.L.; Hänninen, T.; Morabito, R.; Tarkoma, S. Digital twins for smart spaces—beyond IoT analytics. IEEE Internet Things J. 2023, 11, 573–583. [Google Scholar] [CrossRef]
  15. Yan, G. Intelligent lighting system based on digital twins in smart home. In Proceedings of the Third International Conference on Control and Intelligent Robotics (ICCIR 2023), Guangzhou, China, 23–25 June 2023; Volume 12940, pp. 323–333. [Google Scholar]
  16. Singh, S.K.; Kumar, M.; Tanwar, S.; Park, J.H. GRU-based digital twin framework for data allocation and storage in IoT-enabled smart home networks. Future Gener. Comput. Syst. 2024, 153, 391–402. [Google Scholar] [CrossRef]
  17. Aghazadeh Ardebili, A.; Zappatore, M.; Ramadan, A.I.A.; Longo, A.; Ficarella, A. Digital Twins of Smart Energy Systems: A Systematic Literature Review on Enablers, Design, Management and Computational Challenges. Energy Inform. 2024, 7, 94. [Google Scholar] [CrossRef]
  18. Palley, B.; Poças Martins, J.; Bernardo, H.; Rossetti, R. Integrating Machine Learning and Digital Twins for Enhanced Smart Building Operation and Energy Management: A Systematic Review. Urban Sci. 2025, 9, 202. [Google Scholar] [CrossRef]
  19. Tzitziou, G.; Dimara, A.; Papaioannou, A.; Krinidis, S.; Anagnostopoulos, C.N.; Ioannidis, D.; Tzovaras, D. Is the residential sector ready for prescriptive maintenance? A short analysis. In Proceedings of the 2023 IEEE 13th Annual Computing and Communication Workshop and Conference (CCWC), Las Vegas, NA, USA, 8–11 March 2023; pp. 22–28. [Google Scholar]
  20. Shorfuzzaman, M.; Hossain, M.S. Predictive analytics of energy usage by IOT-based smart home appliances for Green Urban Development. ACM Trans. Internet Technol. (TOIT) 2021, 22, 1–26. [Google Scholar] [CrossRef]
  21. Powroźnik, P.; Szcześniak, P. Predictive Analytics for Energy Efficiency: Leveraging Machine Learning to Optimize Household Energy Consumption. Energies 2024, 17, 19961073. [Google Scholar] [CrossRef]
  22. Ghosh, P.; Tyagi, S. Leveraging Big Data Analytics For Predictive Maintenance in Smart Home Appliances. In Proceedings of the 2024 10th International Conference on Electrical Energy Systems (ICEES), Chennai, India, 22–24 February 2024; pp. 1–4. [Google Scholar]
  23. Papaioannou, A.; Dimara, A.; Krinidis, S.; Anagnostopoulos, C.N.; Ioannidis, D.; Tzovaras, D. Advanced proactive anomaly detection in multi-pattern home appliances for energy optimization. Internet Things 2024, 26, 101175. [Google Scholar] [CrossRef]
  24. Thammaboosadee, S.; Wongpitak, P. An integration of requirement forecasting and customer segmentation models towards prescriptive analytics for electrical devices production. In Proceedings of the 2018 International Conference on Information Technology (InCIT), Chiang Mai, Thailand, 1–2 November 2018; pp. 1–5. [Google Scholar]
  25. Choubey, S.; Benton, R.G.; Johnsten, T. A holistic end-to-end prescriptive maintenance framework. Data-Enabled Discov. Appl. 2020, 4, 1–20. [Google Scholar] [CrossRef]
  26. Mao, H.; Liu, Z.; Qiu, C.; Huang, Y.; Tan, J. Prescriptive Maintenance for Complex Products with Digital Twin Considering Production Planning and Resource Constraints. Meas. Sci. Technol. 2023, 34, 125903. [Google Scholar] [CrossRef]
  27. Wang, H.; Yu, C.; Zheng, J.; Jia, Y.; Liu, Z.; Yang, K. Digital-Twin-Based Operation and Maintenance Management Method for Large Underground Spaces. Buildings 2024, 14, 2577. [Google Scholar] [CrossRef]
  28. Cespedes-Cubides, A.S.; Jradi, M. A Review of Building Digital Twins to Improve Energy Efficiency in the Building Operational Stage. Energy Inform. 2024, 7, 11. [Google Scholar] [CrossRef]
  29. Spigliantini, G.; Fabi, V.; Corgnati, S.P. Towards high energy performing historical buildings. a methodology focused on operation and users’ engagement strategies. Energy Procedia 2017, 134, 376–385. [Google Scholar] [CrossRef]
  30. Bernardini, G.; Di Giuseppe, E.; D’Orazio, M. Towards a user-centered framework to support proactive Building Operation and Maintenance: Preliminary results of a communication platform between users and stakeholders. Technol. Eng. Mater. Archit. 2020, 6, 7–17. [Google Scholar] [CrossRef]
  31. Bernardini, G.; Di Giuseppe, E. Towards a user-centered and condition-based approach in building operation and maintenance. In Proceedings of the Sustainability in Energy and Buildings: Proceedings of SEB, Budapest, Hungary, 4–5 July 2019; pp. 327–337. [Google Scholar]
  32. Liu, X.; Jiang, Y.; Huang, Y.; Zhang, H.; Tu, Z. Towards Sustainable Interaction in the Home Appliance Industry: An AI-Powered Dialogue System Approach. In Proceedings of the Eleventh International Symposium of Chinese CHI, Bali, Indonesia, 13–24 November 2023; pp. 556–561. [Google Scholar]
  33. Grover, A.; Tripathy, B.; Sharma, H.; Gill, A.K.; Panda, S.K. Enhancement in smart homes: AI-driven energy consumption optimization through IoT integration. In Integrated Technologies in Electrical, Electronics and Biotechnology Engineering; CRC Press: Boca Raton, FL, USA, 2025; pp. 300–307. [Google Scholar]
  34. Malleeshwaran, T.; Prasanna, T. Ai-driven iot framework for optimal energy management in consumer devices. In Proceedings of the 2024 3rd International Conference on Sentiment Analysis and Deep Learning (ICSADL), Bangkok, Thailand, 23–24 August 2024; pp. 746–751. [Google Scholar]
  35. Salama, M.; Raslen, B. MQTT in Action: Building Reliable and Scalable Home Automation Systems. Sak. Univ. J. Comput. Inf. Sci. 2024, 7, 494–509. [Google Scholar] [CrossRef]
  36. Papaioannou, C.; Dimara, A.; Tzitzios, I.; Stogia, M.; Anagnostopoulos, C.N.; Krinidis, S. Interactive 2D Design: A User Friendly Grid-Based Approach for Smart Digital Twins. In Artificial Intelligence Applications and Innovations; Papaleonidas, A., Pimenidis, E., Papadopoulos, H., Chochliouros, I., Eds.; AIAI 2025 IFIP WG 12.5 International Workshops; AIAI 2025; IFIP Advances in Information and Communication Technology; Springer: Cham, Switzerland, 2025; Volume 754. [Google Scholar] [CrossRef]
  37. Papaioannou, A.; Dimara, A.; Krinidis, S.; Tzitziou, G.; Papaioannou, I.; Michailidis, I.; Anagnostopoulos, C.-N.; Ioannidis, D.; Kosmatopoulos, E.; Tzovaras, D. A novel AI-powered method for robust identification of operational phases in refrigerators. Sustain. Energy Grids Netw. 2024, 39, 101405. [Google Scholar] [CrossRef]
  38. Use Cases GitHub. Available online: https://github.com/christofpap/ENACT (accessed on 9 July 2025).
  39. Papaioannou, A.; Dimara, A.; Papaioannou, C.; Papaioannou, I.; Krinidis, S.; Anagnostopoulos, C.N.; Korkas, C.; Kosmatopoulos, E.; Ioannidis, D.; Tzovaras, D. Simulation of Malfunctions in Home Appliances’ Power Consumption. Energies 2024, 17, 19961073. [Google Scholar] [CrossRef]
  40. Shinde, A.; Suryawanshi, R.; Pawar, M. IoT based Smart Home Testbed using MQTT Communication Protocol. Int. J. Eng. Res. Dev. 2020, 12, 317–324. [Google Scholar]
  41. Islam, A.; Rahman, R.; Alam, M.; Hossain, S. Edge Computing and IoT in Smart Cities—An Overview. In Holistic Research Perspectives; National Foundation for Entrepreneurship Development (NFED): Thiruvananthapuram, India, 2024. [Google Scholar]
  42. De Rango, F. DLST-MQTT: Dynamic and lightweight security over topics. Comput. Netw. 2025, 166, 107625. [Google Scholar] [CrossRef]
  43. Singh, P.; Sharma, K.; Gupta, V. A Review of IoT-Based Smart City Development and Management. Smart Cities 2024, 7, 1462–1501. [Google Scholar]
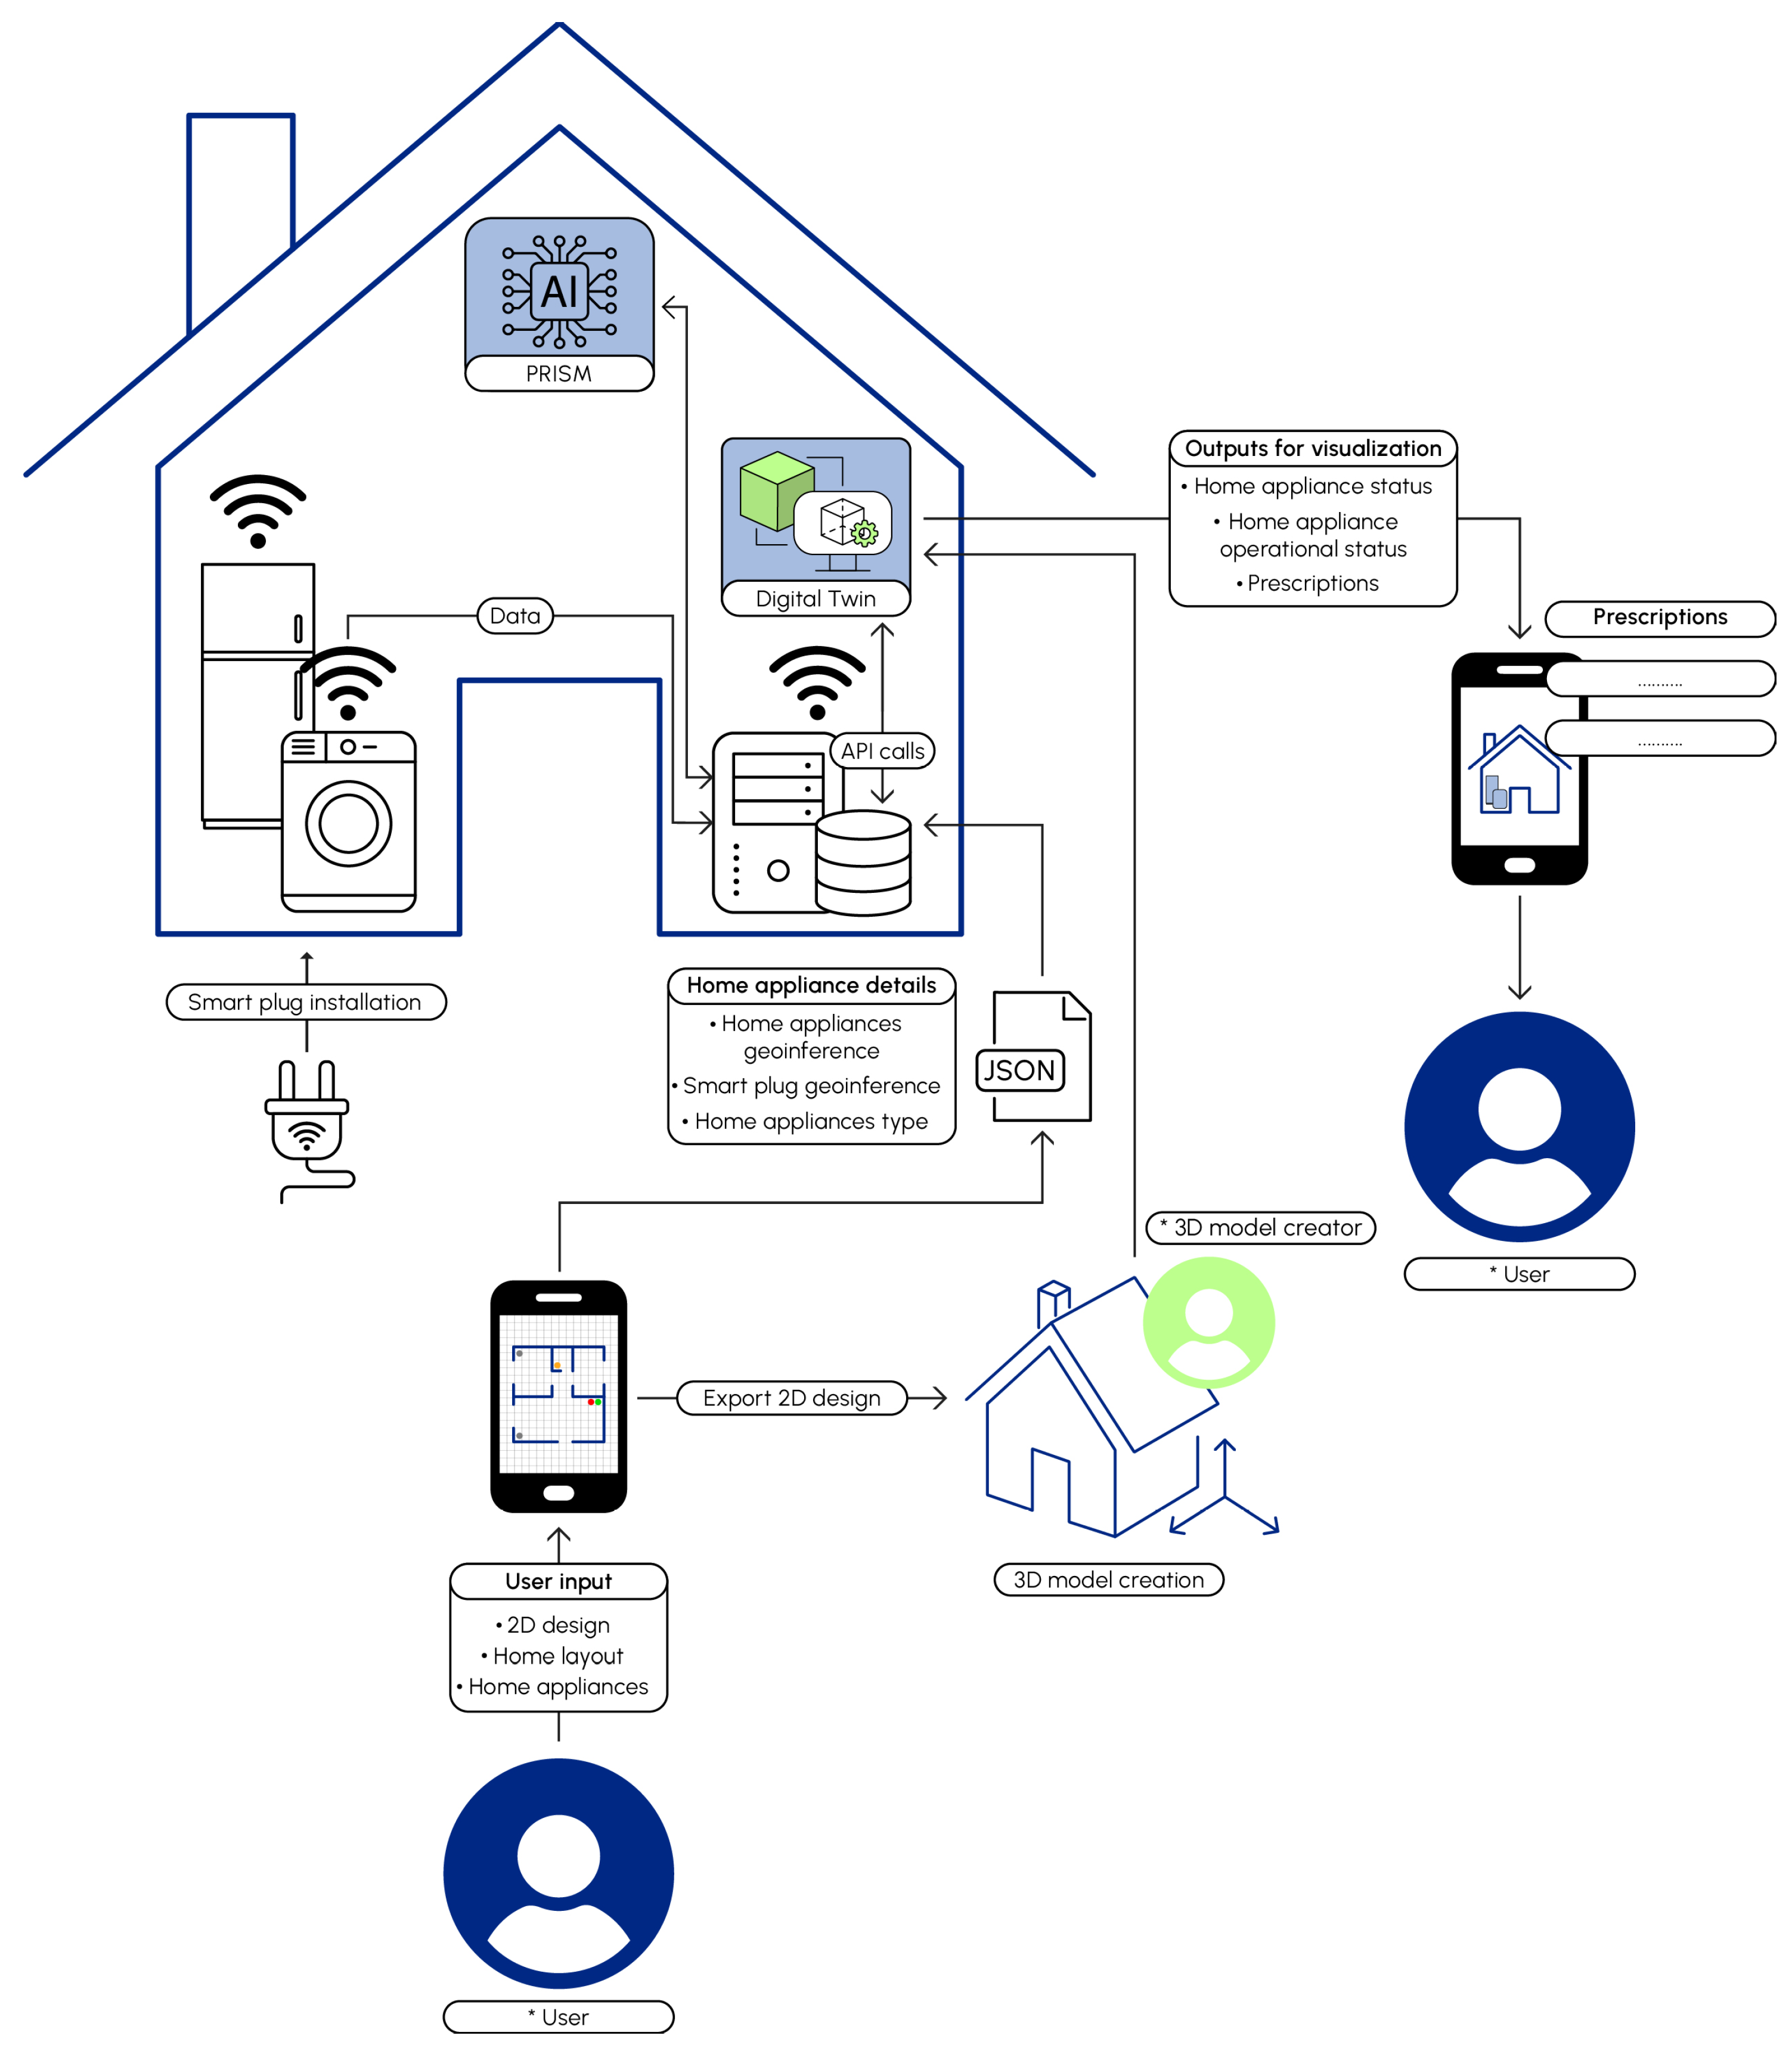
Figure 1. ENACT framework conceptual architecture.
Smartcities 08 00155 g001
Figure 2. IoT setup architecture for smart home appliance monitoring using MQTT.
Smartcities 08 00155 g002
Figure 3. Grid4Space app interface showing 2D layout with rooms and color-coded appliances.
Smartcities 08 00155 g003
Figure 4. Sample JSON export from Grid4Space showing the home layout and appliances.
Smartcities 08 00155 g004
Figure 5. Overview of ENACT experimental operational flow: from user-defined 2D floor plan to 3D modeling, digital twin integration, AI-based appliance diagnostics, and interactive user feedback.
Smartcities 08 00155 g005
Figure 6. The emergency intervention scenario within the ENACT digital twin interface.
Smartcities 08 00155 g006
Figure 7. The minor malfunction scenario for a monitored appliance within the ENACT digital twin.
Smartcities 08 00155 g007
Figure 8. The routine maintenance prompt for the washing machine within the ENACT digital twin.
Smartcities 08 00155 g008
Figure 9. The normal operation scenario for the refrigerator within the ENACT digital twin interface.
Smartcities 08 00155 g009
Figure 10. The offline status notification for the refrigerator within the ENACT digital twin.
Smartcities 08 00155 g010
Figure 11. The transformation from a user-defined 2D floor plan to an interactive 3D digital twin within the ENACT framework.
Smartcities 08 00155 g011
Table 1. Comparison of representative studies in DTs, maintenance strategies, and user engagement for smart homes.
StudyDTMaintenanceUser Awareness/InteractionLimitation/Focus
[14]LimitedGeneric DT architecture; no appliance-level maintenance
[10]Device mirroring; lacks prescriptive intelligence
[22]PredictivePredictive only; no prescriptive guidance or UI
[25]PrescriptiveIndustrial focus; not residential
[30]User engagement only; no DT or prescriptive maintenance
[27]PredictiveBuilding-level focus; not appliance-level or user-centered
ENACTPrescriptive ✓First integrative framework for residential appliances
Table 2. Overview of prescriptive maintenance approaches for home appliances.
FeatureOn-Demand
Devices Method
Constantly-On
Devices Method
Appliance TypeWashing machine,
dishwasher, oven,
dryer, air conditioner
Refrigerator
Detection MethodCNN-LSTM VAELSTM with AdaBoost for
operational mode
and behavioral phase
classification
Classification ApproachXGBoost-based
multi-pattern
program classification
PCA-based feature
compression followed
by LSTM classification
Prescriptive
Recommendations
Task-specific actionable
advice based on anomaly type
Maintenance or replacement
guidance with energy saving
suggestions
Energy Saving ImpactUp to 30% reduction
in energy consumption
Lifecycle extension and
cost efficiency due to proactive
degradation detection
Table 3. Examples of prescriptive maintenance types delivered by ENACT.
Prescription TypeExample
Guideline- Clean appliance filters monthly to maintain efficiency.
- Avoid overloading the washing machine to reduce wear on the motor.
Routine- Schedule an HVAC system check-up every 6 months.
- Defrost the freezer every 3 months to maintain cooling performance.
Diagnostic—Minor- A slight increase in energy use detected; clean condenser coils.
Diagnostic—Major- Significant deviation in usage; check for compressor failure or refrigerant leak.
Table 4. Appliance distribution across the 20 participating households. Each household was equipped with four monitored appliances.
Household IDMonitored Appliances
H01Refrigerator, Washing Machine, Dishwasher, Oven
H02Refrigerator, Dishwasher, Oven, Dryer
H03Refrigerator, Washing Machine, Oven, Air Conditioner
H04Washing Machine, Dishwasher, Oven, Dryer
H05Refrigerator, Washing Machine, Dryer, Air Conditioner
H06Refrigerator, Washing Machine, Dishwasher, Air Conditioner
H07Washing Machine, Dishwasher, Oven, Air Conditioner
H08Refrigerator, Washing Machine, Oven, Air Conditioner
H09Refrigerator, Washing Machine, Dryer, Air Conditioner
H10Refrigerator, Dishwasher, Oven, Dryer
H11Refrigerator, Washing Machine, Dishwasher, Dryer
H12Washing Machine, Dishwasher, Oven, Air Conditioner
H13Refrigerator, Washing Machine, Oven, Dryer
H14Refrigerator, Dishwasher, Oven, Air Conditioner
H15Refrigerator, Washing Machine, Dishwasher, Dryer
H16Refrigerator, Washing Machine, Dishwasher, Oven
H17Refrigerator, Washing Machine, Oven, Air Conditioner
H18Refrigerator, Dishwasher, Oven, Air Conditioner
H19Refrigerator, Washing Machine, Dryer, Air Conditioner
H20Refrigerator, Washing Machine, Dishwasher, Dryer
Table 5. Overview of participant household characteristics.
CharacteristicCategoryCountPercentage
Household size1–2 persons630%
3–4 persons945%
5+ persons525%
Age of primary user25–40 years840%
41–60 years945%
60+ years315%
Digital literacy *Low420%
Medium1050%
High630%
* Self-reported confidence in using digital technologies.
Table 6. Summary of ENACT events triggered during the study (20 households).
Event TypeTotal EventsAverage per HouseholdFrequency
Routine maintenance reminders1206.0every  2 months
Prescriptive guidelines241.2Condition-based
Diagnostic detections (major)20.1Event-driven
Diagnostic detections (minor)60.3Event-driven
Table 7. Cost and ROI analysis for wider ENACT deployment.
ItemCost (USD)Notes
IoT hub$30–50ESP32/RPi
Smart plugs (4–5)$60–100Major appliances
Total per household$90–150Excluding smartphone
Table 8. Performance metrics of PRISM across different appliance types for minor diagnostic errors.
Appliance TypeModelPrecisionRecallF1-ScoreAUC-ROCAvg. Energy
Saving
Washing MachineAPAD0.900.860.880.8726%
DishwasherAPAD0.880.840.860.8524%
DryerAPAD0.880.860.870.8623%
OvenAPAD0.870.890.880.8718%
Air ConditionerAPAD0.870.850.860.8516%
RefrigeratorLSTM0.890.880.880.87N/A
Table 9. Performance metrics of PRISM across different appliance types for major diagnostic errors.
Appliance TypeModelPrecisionRecallF1-ScoreAUC-ROCAvg. Energy
Saving
Washing MachineAPAD0.940.920.930.9430%
DishwasherAPAD0.920.900.910.9228%
DryerAPAD0.920.910.910.9227%
OvenAPAD0.910.930.920.9222%
Air ConditionerAPAD0.910.900.910.9120%
RefrigeratorLSTM0.930.910.920.92N/A
Table 10. Performance metrics of PRISM across different appliance types for specific error cases.
Appliance TypeModelPrecisionRecallF1-ScoreAUC-ROCAvg. Energy
Saving
Washing MachineAPAD0.910.880.890.9028%
DishwasherAPAD0.890.860.870.8825%
DryerAPAD0.900.880.890.8924%
OvenAPAD0.880.900.890.8919%
Air ConditionerAPAD0.880.870.880.8817%
RefrigeratorLSTM0.900.890.890.89N/A
Table 11. Average performance metrics of PRISM across different appliance types, computed as the mean of the minor, major, and specific error categories.
Appliance TypeModelPrecisionRecallF1-ScoreAUC-ROCAvg. Energy
Saving
Washing MachineAPAD0.920.890.900.9128%
DishwasherAPAD0.900.870.880.8926%
DryerAPAD0.900.890.890.9025%
OvenAPAD0.890.910.900.9020%
Air ConditionerAPAD0.890.880.880.8918%
RefrigeratorLSTM0.910.900.900.90N/A
Table 12. Diagnostic and robustness metrics of PRISM models under varying conditions.
ApplianceAUCAUC
(Noisy)
F1
(Missing Data)
Latency
(ms)
FPR
(%)
Phase Acc.
Washing Machine0.940.920.8745
Dishwasher0.930.910.87403.4
Dryer0.9250
Oven0.90384.8
Air Conditioner0.9152
Refrigerator0.890.87272.989.1% (W),
88.4% (S)
Table 13. Algorithmic comparison (mean across appliances and error categories).
MethodPrecisionRecallF1-ScoreAUC-ROCFPR
PRISM–APAD (on-demand)0.900.890.900.900.04
PRISM–LSTM (refrigerator)0.910.900.900.900.04
LSTM Autoencoder0.860.840.850.860.07
Isolation Forest0.820.800.810.830.09
One-Class SVM0.800.790.790.810.10
Matrix Profile0.830.810.820.840.08
HMM (refrigerator phases)0.860.850.850.870.07
GRU (refrigerator phases)0.880.870.880.890.06
Table 14. System Usability Scale (SUS) scores across 20 participants.
User IDSUS Score (0–100)Usability Rating
U0185Excellent
U0282.5Excellent
U0390Excellent
U0477.5Good
U0580Good
U0695Excellent
U0778Good
U0885Excellent
U0976Good
U1088Excellent
U1180Good
U1284Excellent
U1379Good
U1491Excellent
U1583Excellent
U1680Good
U1782Excellent
U1890Excellent
U1977Good
U2081.5Excellent
Average80.5Excellent
Table 15. Per-user responses to behavioral questions (BQ1–BQ4) on a 5-point Likert scale.
User IDBQ1BQ2BQ3BQ4
U015555
U024545
U035555
U045454
U054344
U065555
U075545
U084444
U093434
U105555
U114444
U125555
U135455
U144454
U154444
U165555
U174344
U185555
U195454
U205555
Average4.554.54.654.7
Table 16. Summary of user comments for the open-ended question (BQ5), grouped by theme.
ThemeSummarized User CommentUser IDs
Alerts and RecommendationsFound the alerts useful for timely actions (e.g., cleaning).U03, U07, U14, U18
Energy AwarenessBecame more aware of appliance energy consumption.U05, U10, U13, U19
Simple InterfaceAppreciated the system’s ease of use and clarity.U02, U08, U12, U15
Maintenance MindsetChanged how they think about appliance care.U04, U06, U11, U17
Integrated ProcedureValued the full workflow from 2D to alerts.U01, U09, U16, U20
Disclaimer/Publisher’s Note: The statements, opinions and data contained in all publications are solely those of the individual author(s) and contributor(s) and not of MDPI and/or the editor(s). MDPI and/or the editor(s) disclaim responsibility for any injury to people or property resulting from any ideas, methods, instructions or products referred to in the content.