Highlights
What are the main findings?
- Developed a unified analytical framework combining K-means clustering and non-negative Tucker decomposition to identify latent spatiotemporal mobility modes of metro and bikesharing systems using large-scale data from Tianjin, China.
- Revealed distinct station typologies (mismatched, employment-oriented, and comprehensive) and quantified temporal–spatial coordination between metro and bikesharing through Jaccard similarity, showing strong coupling during peak hours and weaker alignment in off-peak periods.
What is the implication of the main finding?
- Provides a scalable and interpretable method to uncover multimodal travel patterns, enabling planners to tailor infrastructure and operations to specific station types and temporal demand structures.
- Offers practical guidance for dynamic bike rebalancing, differentiated station-area design, and integrated metro–bike management strategies to enhance first- and last-mile connectivity in smart city transport systems.
Abstract
Multimodal transportation systems, particularly those combining metro and bikesharing, have become central to addressing the first- and last-mile connectivity challenges in urban environments. This study presents a comprehensive data-driven framework to analyze the spatiotemporal interplay between metro and dockless bikesharing usage using real-world data from Tianjin, China. Two primary methods are employed: K-means clustering is used to categorize metro stations and bike usage zones based on temporal demand features, and non-negative Tucker decomposition is applied to a three-way tensor (day, hour, station) to extract latent mobility modes. These modes capture recurrent commuting and leisure behaviors, and their alignment across modes is assessed using Jaccard similarity indices. Our findings reveal distinct usage typologies, including mismatched (misalignment of jobs and residences), employment-oriented, and comprehensive zones, and highlight strong temporal coordination between metro and bikesharing during peak hours, contrasted by spatial divergence during off-peak periods. The analysis also uncovers asymmetries in peripheral stations, suggesting differentiated planning needs. This framework offers a scalable and interpretable approach to mining multimodal travel patterns and provides practical implications for station-area design, dynamic bike rebalancing, and integrated mobility governance. The methodology and insights contribute to the broader effort of data-driven smart city planning, especially in rapidly urbanizing contexts.
1. Introduction
The rapid expansion of urban populations and increasing travel demand have placed unprecedented stress on transportation systems in many metropolitan regions [1]. Traditional single-mode transit networks, while effective for core commuting flows, often fall short in addressing the first- and last-mile challenges faced by users in peripheral or low-density areas [2]. To improve urban accessibility and facilitate multimodal integration [3], many cities have adopted solutions that integrate high-capacity metro systems with flexible short-distance connectivity modes such as dockless bikesharing [4].
The integration of metro with bikesharing has proven especially effective in addressing spatial gaps in public transit networks [5,6,7]. As a spatial and temporal feeder, bikesharing can help users bridge the service gaps at metro stations to achieve seamless door-to-door travel. This integration is particularly relevant in Asian cities with high land intensification and significant regional differences in transit accessibility [8].
However, despite growing academic and policy attention in metro–bikesharing integration, existing studies remain limited in scope. Most rely on static demand statistics, localised case studies, or short-term surveys [9,10,11], which constrains their ability to reveal general patterns or scalable planning strategies. In particular, the behavioural structural mechanisms behind metro–bikesharing use interactions are still not fully revealed. Existing studies mostly focus on descriptive patterns or statistical correlation analyses, neglecting the intrinsic mechanisms of users’ behavioural decisions in multimodal scenarios across space and time [12,13]. While some studies have used clustering techniques to classify the types of metro or bikesharing use, there is still a lack of joint analyses of metro and bikesharing mode classifications to discuss their temporal and spatial relevance [14,15].
Meanwhile, the issue of equity in the spatial deployment of shared mobility infrastructure has emerged as a key issue [16]. While dockless bikesharing platforms have the potential to improve accessibility to underserved areas, empirical studies have shown that their usage patterns tend to favour affluent and accessible urban areas [6,17]. Without thoughtful policy interventions and targeted planning, this skewed distribution may exacerbate existing inequalities in access to transport resources [18].
To better understand these complex dynamics, recent studies have begun to introduce advanced analytical tools such as clustering and tensor decomposition to reveal the underlying travel structure. However, most of the previous studies have applied these tools to metro or bikesharing systems solely, without a unified modelling framework capable of capturing their joint spatiotemporal coupling [12,17,19,20]. Clearly, integrative approaches are needed to connect functional, spatial, and temporal dimensions to reveal the hidden coordination mechanisms underpinning metro–bikesharing interactions [12,17].
To address these gaps, this study develops a unified analytical framework that combines K-means clustering and non-negative Tucker decomposition to investigate metro–bikesharing travel behavior at scale. Using large-scale metro smartcard and bikesharing data from Tianjin, China, we extract latent spatiotemporal travel modes, classify station functions, and assess the degree of coordination between metro and bike systems using Jaccard similarity measures. This study aims to establish a data-driven framework for quantifying metro–bikesharing interactions at the station level, with the specific objectives of (i) identifying distinct station typologies through clustering, (ii) capturing spatiotemporal demand patterns via tensor decomposition, and (iii) evaluating the coupling strength between metro and bikesharing across clusters and time windows. Unlike previous studies that mainly relied on buffer zone methods or static correlation analysis, our approach leverages tensor decomposition to simultaneously capture multidimensional patterns, thereby providing a more comprehensive understanding of multimodal demand interdependencies.
The main contributions of this research are as follows. First, we propose a data-driven station classification scheme that captures temporal demand characteristics across metro and bikesharing systems. Second, we construct a three-way tensor to model the interplay among day type, time of day, and station location, enabling interpretable decomposition of latent mobility modes. Third, we evaluate the spatial and temporal alignment of metro and bikesharing modes to reveal patterns of synergy and mismatch, offering practical guidance for multimodal infrastructure design and policy interventions.
The remainder of this paper is organized as follows. Section 2 reviews the relevant literature on metro–bikesharing integration, station clustering, and tensor-based mobility analysis. Section 3 presents the data and preprocessing procedures. Section 4 introduces the methodological framework. Section 5 discusses empirical results and key findings. Section 6 provides discussion and planning implications. Section 7 concludes the study and outlines directions for future research.
2. Literature Review
2.1. Metro–Bikesharing Integration and Multimodal Planning
The integration of metro systems with dockless bikesharing has emerged as a promising solution to address the first- and last-mile gap in urban transportation systems. As high-capacity metro systems provide efficient trunk-line services, shared bikes offer a flexible and low-cost option to complete short-distance access and egress trips (i.e., first- and last-mile segments) [5,6]. This metro–bikesharing synergy is particularly vital in rapidly urbanizing regions where spatial disparities in transit accessibility persist.
Recent empirical studies have investigated the behavioral, spatial, and temporal dynamics of metro–bikesharing integration. For example, Wu et al. [9] revealed that bikesharing usage around metro stations in Shenzhen is highly concentrated during peak commuting hours and in city centers, reflecting a strong but localized complementarity between the two systems. In contrast, ride-hailing trips show broader temporal distribution and stronger linkages to employment centers, especially in areas underserved by metro services [21]. These findings suggest that different shared mobility modes fulfill distinct roles in supporting metro access, and that their impacts vary depending on time, location, and land use characteristics.
At the same time, several studies have raised concerns about the equity implications of metro–bike integration. Although dockless systems are often promoted as tools for inclusive mobility, usage patterns tend to cluster in affluent, transit-rich neighborhoods [6,17]. Without proactive planning and infrastructure support, such systems may inadvertently deepen spatial inequalities in access to transit. Moreover, Chen et al. [22] examined the competitive and complementary dynamics between shared bikes and buses, showing that their relationship varies by station type and service characteristics. This highlights the need to consider intermodal competition in metro station access planning.
To better understand metro–bikesharing integration performance, researchers have turned to data-driven approaches. Some studies have employed regression models to quantify the influence of built environment variables—such as land-use mix, network density, and job accessibility—on bike–metro linkage strength [23]. Others have used clustering methods to categorize station usage patterns and classify feeder types. However, most existing work remains limited in temporal scope or spatial generalizability. A recent systematic review emphasized the importance of integrating behavioral, infrastructural, and policy factors into holistic frameworks that support scalable multimodal planning [24].
2.2. Clustering Approaches in Station and Usage Typology
Clustering techniques are widely used to analyze transportation systems, particularly for classifying metro stations and bikesharing usage patterns. K-means clustering is a common method for grouping transit nodes based on temporal demand, land-use context, and flow directions [25]. Studies on bikesharing systems have identified key usage zones, such as residential, employment, and mixed-use hubs, which help optimize first- and last-mile connectivity [26]. However, most research focuses on single-mode systems, leaving a gap in multimodal clustering analysis.
Previous work has applied clustering to metro stations, revealing distinct typologies like residential, employment, and hybrid stations [17,27]. Similarly, bikesharing studies have used hierarchical clustering to link demand patterns with land-use diversity [14]. Temporal features—such as peak-hour coefficients and skewness—are critical in differentiating station functions [28]. Yet, few studies combine metro and bikesharing data to analyze their interaction. For example, Tong et al. [29] examined spatial overlap but overlooked temporal dynamics.
Our study integrates clustering and tensor decomposition to classify stations and detect latent travel patterns in Tianjin. This approach improves interpretability and supports data-driven planning.
2.3. Tensor Decomposition for Spatiotemporal Mobility Patterns
The application of tensor decomposition in the analysis of spatiotemporal mobility patterns is increasing, mainly due to its ability to preserve multidimensional data structures and extract interpretable latent patterns. For example, techniques such as CANDECOMP/PARAFAC (CP) decomposition and Tucker decomposition have been applied to a variety of urban datasets, including taxi trajectories, bus passenger flows [30], mobile phone location data, and bikesharing systems [31].
Some studies have collectively emphasized the versatility of tensor decomposition in travel pattern analysis. For example, Qi et al. [32] combined non-negative tensor factorization (NTF) with artificial neural networks (ANNs) to predict regional mobility patterns using smartcard and point of interest (POI) data. Tisijaric and Caric [33] used CP decomposition to detect anomalies in sparse GPS data. Frutos-Bernal et al. [34] applied Tucker3 decomposition to analyze travel patterns in the Barcelona metro. Liu et al. [35] proposed a hybrid tensor–PCA framework for license plate data analysis. Lv et al. [36] integrated tensor decomposition with ensemble learning for bikesharing demand prediction. Li et al. [19] introduced graph-regularized tensor LDA for personalized travel pattern clustering. Sangveraphunsiri et al. [37] quantified the impact of COVID-19 on bikesharing via non-negative tensor decomposition. These applications highlight the need for dynamic, interpretable, and scalable extensions of tensor decomposition techniques.
In this context, the non-negative Tucker decomposition has been successfully applied to origin–destination flow reconstruction, pattern analysis, and anomaly detection due to its enhanced interpretability. However, the joint tensor analysis of metro and bikesharing data remains relatively underexplored, especially in terms of mining coupled mobility modes within a single analytical framework.
3. Data Description and Preprocessing
3.1. Multi-Source Data Description
This study utilizes multimodal mobility big data from Tianjin, a megacity in northern China, integrating two complementary datasets: smartcard transaction records from the metro system and dockless bikesharing lock/unlock data.
Metro data cover 139 stations and contain transaction-level details: anonymized user IDs, entry/exit timestamps, station identifiers, and transaction types. Bikesharing data are sourced from a leading operator and include GPS-tagged lock/unlock events, vehicle IDs, precise timestamps, and status codes, enabling full trip reconstruction and spatial linkage.
This study adopts a systematic data processing process which consists of key steps such as data loading, cleaning, temporal processing, single-vehicle spatial matching, metro interchange matching and merging, and anomalous data processing to ensure the accuracy and consistency of the data. Through these steps, we are able to effectively integrate and process the raw data to generate a high-quality final dataset. After rigorous data cleaning, the final research dataset contains the following fields for each station: station ID, station name, 1-hour interval start time, metro inbound volume, metro outbound volume, bicycle unlocking volume, and bicycle locking volume. Sample data of a selected metro station (i.e., Xikang Road station) is shown in Table 1. For the empirical analysis, we use data from a complete weekday week (12–18 May 2019) to ensure consistency and comparability across stations and time periods. This provides a solid foundation for subsequent analyses and research.

Table 1.
Sample data for Xikang Road station.
3.2. Data Preprocessing Procedures
To investigate bikesharing mobility patterns potentially associated with urban rail transit, the dataset incorporates information from 139 corresponding metro stations. Additionally, a circular buffer zone with a specified radius was delineated around each station to define the scope of bikesharing data related to metro stations [38].
To determine the optimal buffer radius, this study examined the variation in usage volume and growth rate under different radii. The radius was ultimately selected based on the observed relationship between these metrics. As shown in Figure 1, approximately one-quarter of the city’s total bikesharing trips originated within 400 m of metro stations [36]. Furthermore, the growth rate of bikesharing usage declined rapidly with increasing distance. The 400 m radius was chosen as it simultaneously satisfies three criteria: substantial data coverage (about 25% of total trips), relatively high growth rate (approximately 0.5), and compact spatial extent.
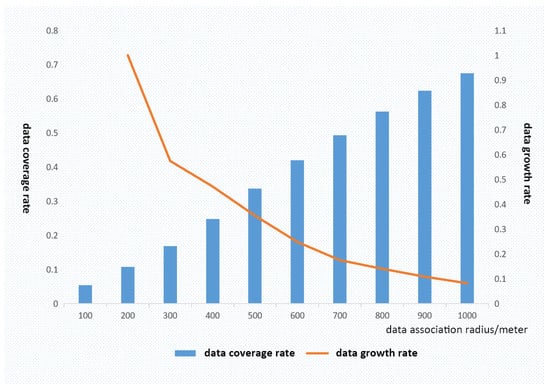
Figure 1.
Variation in usage volume and growth rate across different radii.
To fully characterize the data features, the original metro passenger flow data was processed with temporal constraints, considering only passenger volumes between 6:00 and 23:00 at each station [26]. The passenger flow values represent weekday averages and were subsequently standardized. The standardization process involved dimensionless treatment to ensure data comparability, using z-score normalization based on the original data’s mean and standard deviation [39]. This method transforms the data to have a mean of 0 and standard deviation of 1, where positive values indicate above-average hourly passenger flow and negative values indicate below-average flow at a given station.
To enhance data quality, abnormal records of bikesharing were removed, including trips with negative or zero duration, missing or invalid GPS coordinates, and duplicate unlock–lock pairs recorded within short time intervals. After cleaning, each data point was labeled with “weekday/weekend” tags to facilitate temporal segmentation in subsequent analyses.
3.3. Feature Construction
Time series eigenvalues have multiple features, which can be classified into morphological features, structural features, and model features. Morphological features mainly refer to the characteristics of the shape change of the time series, including global and local features; global features describe the ups and downs of the time series, such as rising and falling; local features are manifested as the abnormal observed values at local time points, such as extreme points and turning points. Structural features are descriptions of the global structure of the time series or the intrinsic change mechanism, which can well express the global characteristics of the time series, including basic statistical features, such as skewness and kurtosis, and time domain features. Model features describe the potential movement law of things changing; these models include the Gaussian process model and ARMA.
To support downstream modeling tasks such as clustering and tensor decomposition, a series of derived variables were constructed.
For the metro data, we calculated the hourly in- and outflows at each station. For the bikesharing data, the number of unlocks and locks were similarly counted within the buffer. In addition to the raw counts, station-level temporal descriptors were derived from each time series. The maxima, skewness, kurtosis, equilibrium coefficients of the temporal distribution of passenger flows, and peak hour coefficients of the entry and exit of metro stations were extracted from morphological and structural perspectives in order to characterise the metro passenger flow time series of the 139 metro stations [40]. Each station is represented by a univariate time series, from which ten features are calculated, corresponding to inflow and outflow patterns, as explained below:
- 1.
- Number of maximum points: This refers to the number of local maxima (peaks) in the time series, which reflects the number of prominent passenger flow waves within a day. Since the number of peaks varies by station, it serves as an important morphological indicator for differentiating stations.
- 2.
- Skewness: Skewness measures the asymmetry of the data distribution in comparison to the normal distribution. A skewness of zero indicates symmetry similar to a normal distribution. Positive skewness suggests a longer right tail (right-skewed), while negative skewness indicates a longer left tail (left-skewed) [41].
- 3.
- Kurtosis: Kurtosis evaluates the “peakedness” of the data distribution. A kurtosis of zero indicates a similar sharpness to the normal distribution. A kurtosis greater than zero indicates a sharper peak (leptokurtic), whereas a value less than zero suggests a flatter peak (platykurtic) [41].
- 4.
- Peak hour coefficient: The peak hour coefficient P is used to describe the concentration of passenger flows during peak hours. It is defined as:where represents the actual passenger inflow or outflow during the i-th hour, and denotes the total daily inflow or outflow. A higher P implies a more concentrated peak period.
- 5.
- Equilibrium coefficient: The equilibrium coefficient U quantifies how evenly the passenger flow is distributed throughout the day. It is given by:where G is the average hourly inflow/outflow during peak periods (e.g., 7:00–9:00 a.m. and 5:00–7:00 p.m.), and H is the average hourly inflow/outflow during the remaining hours. A value of indicates highly uneven flow (strong peak concentration), while indicates moderate imbalance. When , the passenger flow is considered relatively balanced across the day.
3.4. Exploratory Visualization
To provide an intuitive understanding of the spatial distribution of metro usage, we conducted a preliminary visualization of average passenger flows across all metro stations in Tianjin. As shown in Figure 2, dots with different colors represent metro stations with varying passenger volumes. The volumes are highly concentrated in the city center and gradually decline toward the periphery, reflecting the typical radial structure of urban commuting demand. These spatially uneven passenger flow patterns provide a preliminary motivation to further classify station types and explore latent multimodal demand structures, as described in the next section.
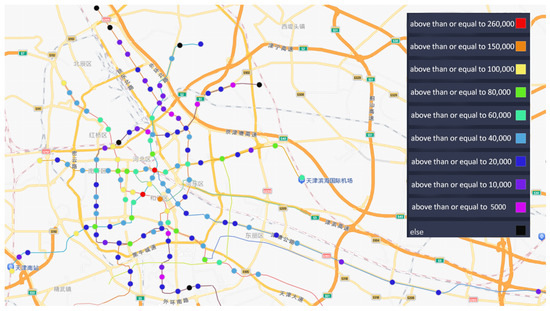
Figure 2.
Metro passenger flow visualisation.
4. Methodology
4.1. Overview
In order to reveal the underlying spatiotemporal structure in the use of metro systems and bikesharing, this study proposes a two-stage analytical framework that combines unsupervised clustering and non-negative tensor decomposition [42]. The construction of this framework stems from the need to characterise complex travel behaviour patterns that are both temporally dynamic and spatially heterogeneous, particularly in the context of multimodal transport convergence.
In the first stage, a K-means algorithm is used to cluster station-level temporal features and identify typical types of metro and bikesharing stations. In the second stage, a 3D tensor is constructed to jointly model the changes in demand in the ‘date type–time period–station’ dimensions, and the non-negative Tucker decomposition is used to extract the potential travel patterns that can be interpreted, thus revealing the dominant commuting and leisure structures in the data.
To assess the degree of integration of the metro–bicycle system, we calculate the Jaccard similarity index between the spatial components of the corresponding potential modes. This method quantifies the spatial match between the two types of transport systems at the station level, identifying areas where their operational service areas are complementary or misaligned.
By integrating clustering and tensor modelling approaches, this framework provides a scalable and interpretable research path for multimodal transport system analysis. In particular, the approach reveals how bikesharing can enhance accessibility by filling spatial gaps in the service areas of metro stations, and how this synergy effect varies over time and across station contexts, thus providing an important decision-making basis for demand-responsive planning and the collaborative design of multimodal transport infrastructures.
4.2. Station Typology via Clustering
To uncover spatiotemporal demand patterns in metro–bikesharing systems, we apply K-means clustering to classify metro and bikesharing stations based on their temporal flow characteristics. This process involves three steps: feature construction, data normalization, and optimal cluster number selection.
Ten temporal features extracted in Section 3 are used as clustering inputs, including maxima, skewness, kurtosis, peak hour coefficients, and equilibrium coefficients of metro entry and exit volumes and shared bike unlock/lock events. All features are standardized using z-score normalization to ensure comparability.
The optimal number of clusters (K-value) in K-means clustering is determined using the elbow method. This heuristic involves plotting the Within-Cluster Sum of Squares (WCSS) against the K-value. WCSS is defined as the sum of squared distances from each data point to its corresponding cluster center; a smaller WCSS indicates more effective clustering [42].
In an elbow plot, the horizontal axis represents the K-value, while the vertical axis represents the intra-cluster error. As the K-value increases, the intra-cluster error typically decreases gradually, as a larger number of clusters can better fit the data. However, the magnitude of this decrease diminishes until an “elbow” point is reached, after which further increases in the number of clusters no longer yield a significant reduction in error. This “elbow” point is the K-value recommended by the elbow method.
This study utilizes the elbow diagram derived from hierarchical clustering to determine the K-value, employing squared Euclidean distance as the distance metric [43]. Hierarchical clustering is a widely used method that generates a clustering tree (dendrogram), illustrating the hierarchical relationships between different clusters. By calculating the intra-cluster error at various K-values and plotting the elbow diagram, it is possible to visually ascertain which K-value best balances clustering quality and quantity. The choice of squared Euclidean distance is predicated on its common use as a distance metric that reflects the actual distance between data points. This ensures that the selected K-value not only reduces intra-cluster error but also accurately reflects the true structure of the data [44].
As depicted in Figure 3, the turning points are evident at cluster numbers 3 and 6, which appear to be more appropriate. Upon graphical exploration, it was found that when , the clustering results are characterized by a loose structure, even leading to instances where a single station is categorized into its own cluster. In contrast, when , the clustering results for each category appear normal and well-defined. Therefore, this paper employs the K-means clustering method to divide the 139 stations into 3 clusters.
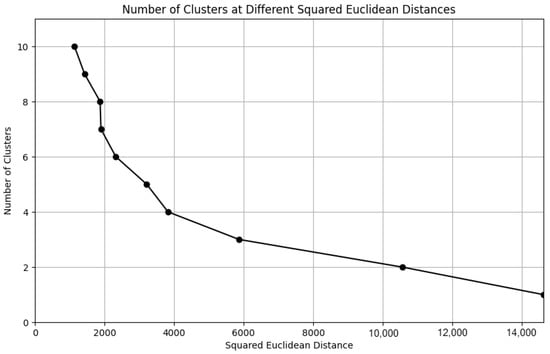
Figure 3.
Distribution of metro and bikesharing stations.
We cluster metro and bike time series separately because they represent different legs of the same trip chain and respond to distinct operational constraints. Separate clustering preserves each mode’s temporal signature and avoids a single mixed feature space that could blur mode-specific patterns. Cross-modal relationships are then evaluated explicitly via latent modes and Jaccard similarity, which keeps the interpretation transparent for policy use.
4.3. Tensor Construction
To capture multimodal spatiotemporal demand patterns, using bike lock/unlock volumes and metro passenger flow data as target variables, we construct four three-dimensional tensors with dimensions corresponding to day type (), time interval (), and station () (as illustrated in Figure 4) [34].
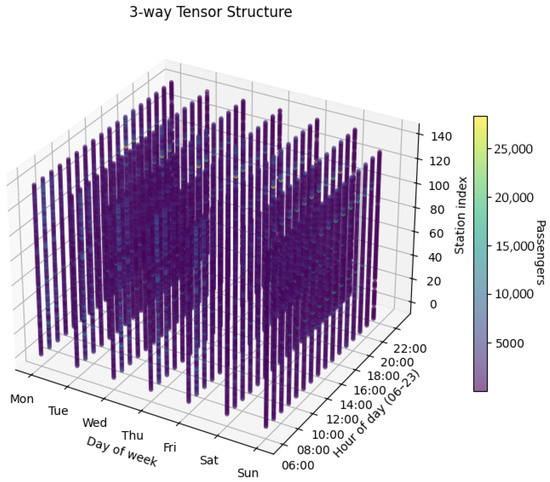
Figure 4.
Illustration of the tensor structure.
Each entry denotes the metro entry volume or bike unlock volume at station s during time interval t on day type d (weekday or weekend). Four separate third-order tensors are constructed for the metro and bikesharing data, all of them sharing the same temporal resolution and a consistent station indexing scheme.
4.4. Non-Negative Tucker Decomposition
Tensor decomposition is a mathematical technique to represent high-dimensional data down to a more concise structure, which can effectively capture the potential spatiotemporal patterns and associated features in the original data. It achieves efficient data representation and dimensional approximation by decomposing the high-order tensor into the product of several low-rank tensors, thus extracting key feature information from multidimensional data. Non-negative Tucker decomposition is one of the tensor decomposition methods, which decomposes the original tensor into the product of the core tensor and the factor matrix, and the factor matrix obtained by decomposition can be used to explore the traffic flow patterns and classify the patterns [32].
Compared with traditional decomposition methods, non-negative Tucker decomposition has more advantages in the exploration of traffic laws: first, it can avoid the common negative artefacts in the tensor decomposition; second, it ensures that all modal weights are non-negative, which can directly quantify the contribution of each component; third, based on its non-negative constraints, the detectability of abnormal fluctuations can be significantly improved. The above advantages make the method more effective in practical problem solving. Therefore, in this paper, we apply non-negative Tucker decomposition to each tensor to uncover latent demand modes [37]:
Here, denotes the i-th mode product, which is a specific type of tensor multiplication that aligns the i-th mode of the core tensor with the corresponding factor matrix. is used as the core tensor to encode the interactions between potential factors, which is usually smaller than the original tensor, and its dimension corresponds to the rank of the factor matrix, while , , and are non-negative factor matrices denoting the distribution of date types, temporal features, and site loadings, respectively, representing the contribution of each mode to the contribution of each mode to the overall tensor. Tensor decomposition is able to find and classify traffic patterns because it identifies underlying structure in the data. By reducing dimensionality while retaining key information, it simplifies complex interactions into more interpretable and manageable components. Each factor matrix can be interpreted as a profile or feature of the corresponding pattern, and the core tensor reveals how these profiles interact with each other [34].
The decomposition rank need to be determined through computation. Specifically, based on the travel conditions throughout the week, that is weekdays and weekends, the decomposition rank for day type is set to 2. Generally, the decomposition rank for time slots is set to 5 [32]. The decomposition rank for the station factors, representing the number of station mobility patterns, is identified by comparing the Kullback–Leible (KL) divergence as follows [36]:
where is the element value in the original tensor , is the element value in the approximation tensor , and represents an infinitesimal number.
After obtaining the core tensor and factor matrices from the decomposition, we reconstruct the original tensor and then calculate the KL divergence between the reconstructed tensor and the original tensor. The smaller the KL divergence, the better the quality of the decomposition, which is used to measure the effectiveness of the decomposition. Figure 5 shows the curve of KL divergence with respect to the station dimension (U), which visually demonstrates the trend of KL divergence under different parameter combinations. We focus on the “elbow point” of the KL divergence curve rather than the absolute value; the optimal U value is usually located where the KL divergence begins to flatten, helping to determine the best parameter combination. When the decomposition parameter , the four extracted patterns show high similarity between modes, which is not conducive to distinguishing features. Therefore, we choose the parameter 3, where each mode is more distinct after decomposition, i.e., the station factor decomposition parameter is 3.
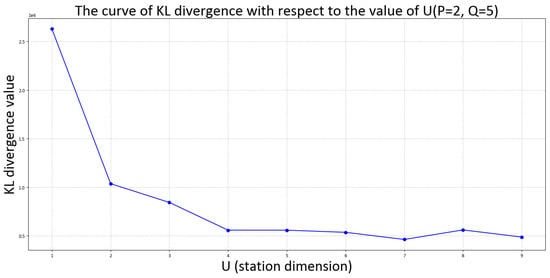
Figure 5.
Variation in KL divergence across different values of parameter U.
Thus, the factor matrices of D (), T (), and S (), the core tensor G (), and the expression of in Equation (3) can be obtained.
4.5. Pattern Coupling via Jaccard Similarity
The Jaccard Similarity Coefficient is a statistical measure used to assess the similarity between two sets, with values ranging from 0 (no correlation) to 1 (perfect agreement) [45,46]. In the study of multimodal transportation demand forecasting, introducing the Jaccard coefficient can serve the following purposes:
- Quantifying the complementarity of interchange behaviors: The coordinated use of shared bicycles and metro often manifests as the “last mile” interchange. By calculating the overlap of station usage patterns between the two modes during specific periods (such as peak hours), the strength of their interchange relationship can be quantified, verifying the hypothesis of multimodal data synergy.
- Identifying spatiotemporal demand characteristics: Travel purposes vary across different periods (e.g., commuting vs. leisure times), leading to changes in the usage patterns of shared bicycles and metro. The Jaccard coefficient can help identify these differences, thereby distinguishing commuting-dominated from leisure-dominated stations.
- Optimizing resource allocation: Stations with high Jaccard coefficients indicate a strong binding between shared bicycles and metro demands, necessitating prioritized coordination of resources (such as increasing bike deployment during peak hours), while areas with low coefficients require differentiated strategies.
To quantify the alignment between latent metro and bike mobility modes, we compute the Jaccard similarity index between their respective station activation sets:
where and denote the sets of stations with high activation scores under metro mode M and bike mode B, respectively. A higher Jaccard score indicates stronger spatial coupling between the two modes, suggesting more synchronized or complementary demand structures.
5. Results and Analysis
5.1. Station Clustering Results
Based on 10 time series features (including peak count, skewness, kurtosis, peak hour coefficient, and distributional balance), the K-means algorithm divides the 139 metro stations in Tianjin into 3 significant clusters. According to the hourly distribution curves of inbound and outbound passenger flows for each type of station (as shown in Figure 6, where different colored lines represent data from different stations), the three categories of stations can be summarised as occupational/residential mismatch type, employment-oriented type, and comprehensive type. The clustering results are presented in Table 2. Moreover, similar to Figure 2, the spatial distribution of metro station types is shown in Figure 7, where different colored dots represent stations belonging to different categories.
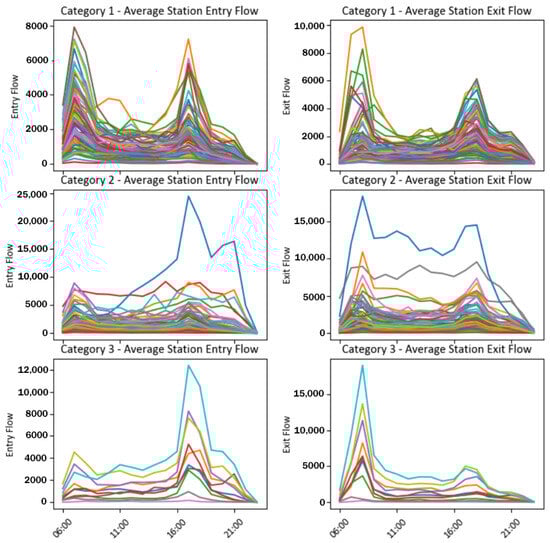
Figure 6.
Average inflow (left) and outflow (right) of metro stations in clusters.
Table 2.
K-means clustering results for metro stations.
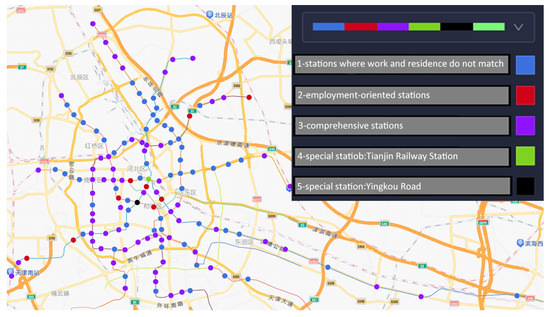
Figure 7.
Spatial distribution of metro station categories.
For metro stations, the resulting clusters include the following:
Category 1: Mismatched Stations (Misalignment of Jobs and Residences)—The hourly distribution curve for this type of station is bimodal, as shown in Figure 6. Both the incoming and outgoing passenger flows exhibit clear morning and evening peak patterns. The morning rush hour generally spans from 6:00 to 9:00, while the evening peak is typically observed between 16:00 and 19:00. This distribution of passenger traffic suggests that these stations primarily cater to commuting demands [25,29]. On weekdays, there is a notable rise in passenger numbers during the morning and evening rush hours, whereas volume remains relatively low during non-peak periods. Moreover, stations located in areas where residential and employment zones are not well aligned often display an imbalance in the surrounding land use (see Figure 7). This imbalance results in a large number of commuters relying on public transport over longer distances, thereby producing pronounced tidal commuter flows at subway stations. Such flow patterns present challenges for station operations and management, requiring thoughtful planning of capacity and infrastructure to handle increased demand during rush hours.
Category 2: Employment Oriented Stations—The passenger flow distribution at this station shows a distinct unimodal pattern throughout the day, as illustrated in Figure 6. This distribution feature is characterized by a predominance of outbound passengers in the morning and inbound passengers in the evening, indicating a reverse flow trend. This pattern reflects the commuting behavior of residents leaving their residences and returning home, and also suggests that the surrounding area is likely dominated by commercial and office uses, attracting a large number of office workers (see Figure 7). Therefore, during peak hours, these stations face significant passenger flow pressure, and it is necessary to optimize operational arrangements and adjust facility layouts to enhance service efficiency and the travel experience of passengers.
Category 3: Comprehensive Stations—The passenger flow at such stations shows irregular fluctuations (see Figure 6), and the land use types around them are diverse (see Figure 7), including tourist attractions, commercial services, and science, education, and culture. The passenger arrival and departure time distribution at some stations is relatively even, with a low peak hour coefficient, indicating that these stations face significant passenger flow pressure throughout the day [25]. Therefore, it is necessary to improve service quality and travel experience by optimizing operation plans and adjusting facility layouts. At the same time, the passenger flow at these stations remains at a high level during off-peak hours, reflecting that they not only serve daily commuting needs but also play a key role in promoting regional economic development and providing public services. Thus, for comprehensive stations, it is essential to strengthen overall planning and collaborative management to achieve a reasonable distribution of passenger flow throughout the day and comprehensively enhance service levels.
In addition, by clustering the bikesharing data based on the number of unlocks and locks (as shown in Figure 8, where different colored lines represent data from different stations), we examine the relationship between shared bike usage and metro demand. The spatial distribution of the three bikesharing clusters, as shown in Figure 9, where different colored dots represent stations of different categories, reveals a strong correlation with local land use patterns and a close connection with metro ridership. The stations with high demand for shared bikes are distributed in the central urban area, while those with low demand are located around the suburbs. This rule is helpful for classifying and positioning the subway passenger flow, improving the subway dispatching mechanism, and providing more convenient and economical transportation services.
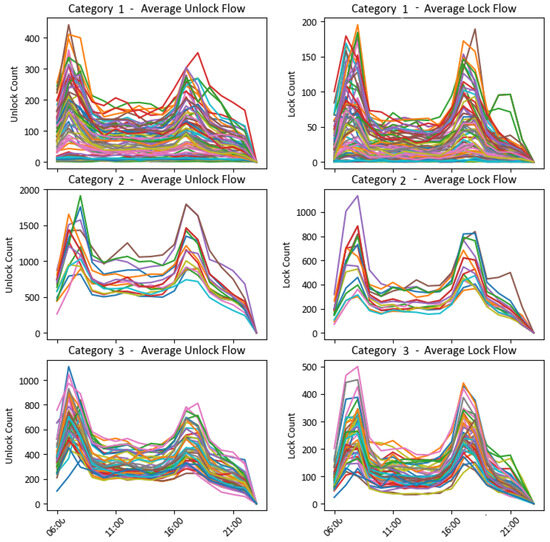
Figure 8.
Average unlock flow (left) and lock flow (right) of bikesharing in clusters.
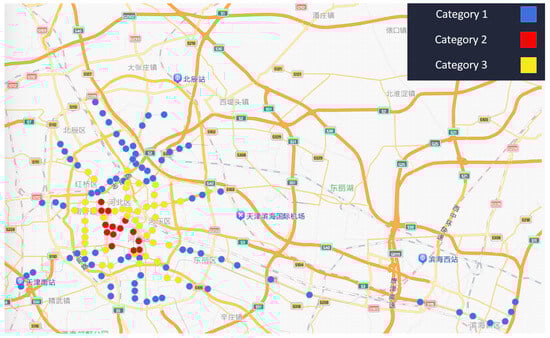
Figure 9.
Spatial distribution of bikesharing station categories.
For bikesharing, the clustering results also reveal three distinct categories, as illustrated in Figure 8 and Figure 9.
Category 1. This group exhibits clear morning and evening peaks, but the overall scale of unlock and lock flows is relatively small (maximum unlocks around 400). These stations are typically located in peripheral residential areas, where bikesharing serves mainly as a feeder to metro services.
Category 2. This group has the highest usage intensity, with unlock counts peaking close to 2000 and lock counts exceeding 1000. Although the temporal pattern still shows the common morning and evening peaks, the demand level is substantially greater than the other categories. Spatially, these stations are concentrated in dense employment and commercial districts in the city center, reflecting their role in absorbing large commuting flows.
Category 3. This group falls between Categories 1 and 2 in terms of demand intensity (unlock peaks around 1000). The daily curve shows balanced peaks with sustained activity during mid-day periods, indicating a mixture of commuting and discretionary trips. These stations are mostly distributed in inner-city mixed-use areas with retail, education, and leisure facilities.
Overall, the three bikesharing clusters share a broadly similar diurnal rhythm characterized by morning and evening peaks, but differ significantly in demand intensity and spatial context. This suggests that while commuting remains the dominant driver of bikesharing around metro stations, land-use heterogeneity amplifies or dampens demand levels across different clusters.
5.2. Latent Modes from Tensor Decomposition
Based on the results of non-negative Tucker decomposition, let the reconstructed tensor be denoted as , where is the core tensor, and A and B are the temporal and weekday factor matrices, respectively. The third-mode factor matrix represents the spatial loadings of metro stations or bikesharing points. The interaction between day type, time of day, and spatial patterns is visualized to interpret the latent mobility structures of different modes.
Figure 10 and Figure 11 illustrate the dominant latent patterns for metro entry and exit passenger flows, respectively. For shared bikes, Figure 12 and Figure 13 present the latent unlocking and locking patterns.
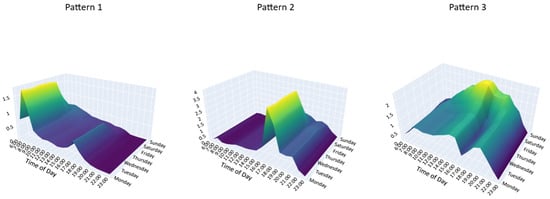
Figure 10.
Latent demand modes for metro entry passenger flows.
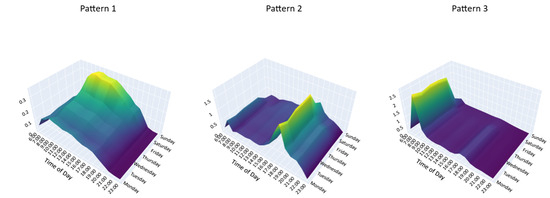
Figure 11.
Latent demand modes for metro exit passenger flows.
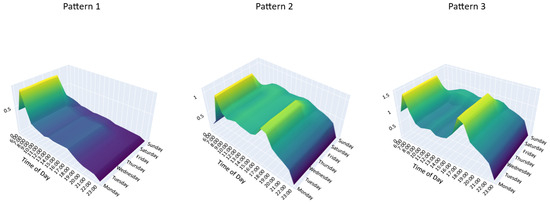
Figure 12.
Latent demand modes for bikesharing unlock events.
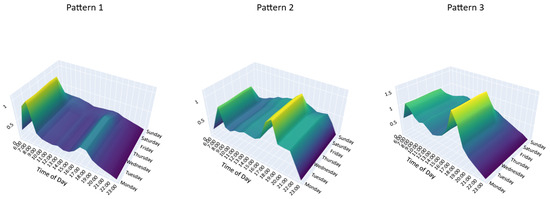
Figure 13.
Latent demand modes for bikesharing lock events.
For interpretability, we describe the three latent patterns in terms of their dominant temporal profiles. Specifically, one pattern is characterized by strong activity during the morning peak (07:00–09:00), another by activity concentrated in the evening peak (17:00–19:00), and the third by more balanced flows that extend into weekends and leisure periods. The numerical labels (Pattern 1–3) in Figure 10, Figure 11, Figure 12 and Figure 13 are generated by the algorithm and do not carry intrinsic meaning; therefore, we focus on the descriptive categories (morning peak, evening peak, weekend/leisure) to ensure consistency across entry/exit and unlock/lock plots.
From these visualizations, the descriptive categories confirm that both metro and bikesharing exhibit morning and evening commuting peaks, along with a distinct weekend/leisure pattern. These patterns reflect the complementary roles of metro and bikesharing systems in accommodating varying mobility needs across time and space.
5.3. Cross-Modal Pattern Alignment
To further investigate the spatial-temporal coordination between metro travel and bikesharing activities, we conduct a Jaccard similarity analysis between the latent usage modes extracted from both systems. Specifically, we compare the metro entry patterns with bikesharing unlock patterns, and metro exit patterns with bikesharing lock patterns. The results, shown in Table 3 and Table 4, reveal distinct levels of alignment across travel periods.
Table 3.
Jaccard similarity between metro entry patterns and bike unlock patterns.
Table 4.
Jaccard similarity between metro exit modes and bike lock modes.
As shown in Table 3, Metro Pattern 1 (representing morning peak entry flows) exhibits high similarity with Bike Pattern 1 (morning peak unlocking), suggesting a strong coupling during morning commutes [47]. Meanwhile, Metro Pattern 2 and Bike Pattern 2 demonstrate moderate alignment, likely reflecting leisure-oriented or non-commute travel. The low overlap with Pattern 3 across both systems corresponds to more dispersed off-peak travel.
Table 4 shows the similarity between metro exit and bike lock patterns. The strongest alignment occurs between Metro Pattern 2 (evening peak exits) and Bike Pattern 1 (morning peak unlocking), which appears counterintuitive. Further investigation reveals that many stations exhibiting this pattern—such as Jiayuanli and Yudongcheng—are located in peripheral residential zones. Although these stations primarily experience outbound flows during the evening peak, they also serve as destinations for inbound passengers during the morning, leading to overlapping spatial characteristics between opposing travel directions.
This mismatch may be explained by two main factors:
- Concentrated Demand: During evening peaks, a large number of metro passengers exit at residential stations and seek bikesharing services to complete their final travel leg, resulting in a surge in local demand.
- Supply Shortage: The operational distribution of shared bikes may not sufficiently accommodate this peak demand, leaving unmet needs in key metro areas.
Overall, these results emphasize the complementary nature of metro and bikesharing systems in facilitating directional commuting during peak hours. In contrast, the relatively low pattern alignment observed during off-peak periods suggests more diverse, leisure-driven demand patterns with weaker modal coupling.
Finally, by analyzing the weight distribution of latent modes at each station, we identify the top five stations most representative of each usage mode. These representative stations are selected based on their temporal latent patterns rather than spatial cluster categories, and are intended to illustrate how typical temporal dynamics can inform differentiated policy responses. They can serve as case studies for demand forecasting and for diagnosing deviations from typical commuting behavior, thereby informing targeted strategies for multimodal transport planning and regulatory optimization.
5.4. Temporal and Spatial Implications
The integration of clustering and tensor decomposition results reveals that metro–bike coordination is highly sensitive to both temporal and spatial contexts. Specifically, stations categorized as residential or employment-oriented exhibit pronounced directional complementarities: metro entries and bike unlocks align during morning peak hours, while metro exits and bike locks dominate in the evening. In contrast, transfer hubs and mixed-use zones display more dispersed temporal usage patterns and weaker mode alignment.
These observations highlight the inadequacy of uniform operational strategies across the network. Instead, effective multimodal system optimization necessitates adaptive and differentiated management schemes. Such strategies should account for station-specific functions and their associated temporal demand structures, enabling more responsive resource deployment—particularly in areas with high commuting intensity or fluctuating leisure demand. This differentiated approach can better support the dynamic nature of urban travel and promote efficient first- and last-mile connectivity.
6. Analysis and Policy Implications
6.1. Interpretation of Multimodal Travel Patterns
The empirical findings reveal a pronounced temporal and spatial complementarity between metro and shared bike usage during commuting hours. In the morning peak, bike unlocking activity is concentrated around residential areas and precedes metro entry; in the evening peak, bike unlocking shifts to employment areas and follows metro exit. This directional flow suggests that bikesharing serves effectively as a feeder mode to metro services, particularly for the first- and last-mile segments.
In contrast, the alignment between metro and shared bike usage weakens during off-peak and weekend periods. The tensor decomposition results indicate that bikesharing trips during these periods are more dispersed, with weaker spatial coupling to metro flows. These patterns likely reflect a broader range of purposes—such as leisure or errands—and greater heterogeneity in travel behavior. This underscores the need for more flexible operational strategies outside of peak commuting hours.
6.2. Station Area Design and Infrastructure Implications
The clustering of metro stations highlights the varying roles of different station types within the multimodal system. Employment-oriented stations exhibit heightened bikesharing demand in the evening peak and should be equipped with high-capacity parking areas, wayfinding systems, and seamless physical connections to metro exits. Conversely, residential-oriented stations experience greater demand during the morning peak and require sufficient bike supply and reduced walking distances between bike docks and metro entrances.
Comprehensive stations—typically located in mixed-use areas—carry sustained demand throughout the day. For these, the integration of transport services should be enhanced through infrastructure such as real-time information panels, lighting, signage, and protected pathways. Stations at the periphery or with relatively low demand may adopt more flexible infrastructure solutions, such as temporary drop-off zones or mobile bike racks, to accommodate variable travel needs.
6.3. Time-Sensitive Operational Strategies
The observed temporal variability in usage patterns provides a basis for adaptive operational strategies. Based on predicted peak periods, shared bikes can be pre-positioned in residential areas before the morning peak and redistributed to employment areas in anticipation of the evening peak. Additionally, the latent temporal modes extracted from tensor decomposition can inform real-time monitoring and resource allocation strategies, allowing operators to respond proactively to demand fluctuations.
For off-peak and weekend periods, targeted promotional strategies—such as discounts, loyalty rewards, or collaboration with local businesses—can help stimulate bike usage and balance system loads. These interventions may be particularly valuable in areas with persistently low utilization.
6.4. Integrated Traffic Management Recommendations
The results emphasize the importance of enhancing coordination between metro and bikesharing systems to support multimodal integration. While these systems are typically operated by separate entities, their functional interdependence warrants joint planning and governance. The following recommendations are proposed:
- Joint Station Planning: Urban planning and transport authorities should coordinate the design of key transfer hubs to align traffic flow, station access, and surrounding land use.
- Data Sharing Mechanisms: Establish shared platforms for exchanging real-time and historical data between metro and bikesharing operators, enabling collaborative forecasting, service optimization, and performance evaluation.
- Multimodal Hubs: At major interchange stations, concentrate metro, bikesharing, and other micro-mobility services to create cohesive transfer environments, improve transfer efficiency, and reduce user inconvenience.
These measures can strengthen local-level multimodal connectivity, improve service coordination, and support the broader integration of urban transport systems.
6.5. Limitations and Future Research Directions
This study has several limitations. First, the analysis is based on retrospective data, and does not incorporate dynamic or predictive modeling components. Second, due to data privacy constraints, individual-level behavioral attributes such as user profiles or trip purposes are not considered. In particular, socio-demographic characteristics (e.g., gender, age, and socio-economic status) that have been shown in prior studies to influence bikesharing adoption are absent from our dataset. As a result, we cannot examine how demand differs across user groups or how differentiated services (such as step-through bicycles for seniors or tourist-oriented short-term rental packages) could be designed. Future work may integrate survey-based or aggregated demographic data with our analytical framework to explore these aspects in greater detail. Third, the Jaccard similarity index used to assess modal alignment captures spatial co-occurrence but does not reflect the intensity or temporal synchronization of demand.
Future research could incorporate trajectory-level data and behavioral models to provide a more detailed understanding of user decisions and preferences. Agent-based simulations may also be used to test the effectiveness of various operational strategies. Additionally, comparative studies across multiple cities could assess the transferability of the proposed framework and identify scalable approaches to integrated mobility governance.
Another important direction is to explicitly link spatial station typologies obtained from clustering with temporal patterns extracted from tensor decomposition. Such an integrated approach could provide a more holistic understanding of how spatial and temporal dimensions jointly shape metro–bike interactions, thereby offering stronger support for multimodal planning strategies.
7. Conclusions
This study presents a data-driven framework for identifying spatiotemporal patterns in multimodal urban travel, with a particular focus on the integration of metro systems and dockless bikesharing services. Drawing on operational data from Tianjin, China, the analysis combines K-means clustering and non-negative Tucker decomposition to classify metro stations and bike usage zones, and to extract latent travel modes from a three-dimensional demand tensor. The spatial correspondence of these patterns is assessed using Jaccard similarity, providing a structured perspective on the degree of coordination between metro and shared bicycle systems across time and space.
The findings reveal that multimodal usage is shaped by both the functional characteristics of stations and the timing of travel demand. A clear pattern of directional complementarity emerges during commuting hours, particularly between residential–origin and employment–destination clusters. Conversely, travel during off-peak and leisure periods shows weaker alignment and greater spatial dispersion, reflecting more varied trip purposes and localized travel needs. These results suggest that station-level infrastructure and operational strategies should be tailored to specific temporal and functional contexts, rather than applying uniform solutions across the network.
From a methodological standpoint, the proposed approach demonstrates the value of combining clustering and tensor decomposition to capture both categorical and continuous dimensions of multimodal demand. This enables planners to move beyond simple volume-based metrics toward interpretable representations of user behavior, facilitating more informed decisions about infrastructure provision, bike distribution, and service coordination.
Nonetheless, the analysis is subject to several limitations. The study relies on historical aggregated data and does not incorporate dynamic or predictive elements. It also lacks access to individual-level user information, which restricts the ability to model behavioral mechanisms underlying mode choice and transfer. Future work could address these gaps by integrating real-time data streams, exploring behavioral modeling approaches, and testing operational strategies in simulation environments.
As urban mobility systems evolve toward more integrated and user-responsive designs, the capacity to identify and manage intermodal linkages will become increasingly important [48]. The findings of this study are of direct relevance to metro operators, bikesharing companies, and municipal transport authorities. Practical implementation may involve differentiated bicycle allocation across station typologies, adaptive rebalancing strategies before peak hours, and the development of integrated ticketing and information platforms that streamline multimodal transfers. This study contributes to that goal by offering a structured analytical basis for understanding metro–bike coordination, and by providing practical insights to guide the planning and regulation of multimodal transport in complex urban settings.
Author Contributions
Conceptualization, X.K. and J.Z.; methodology, X.K. and Y.M.; software, X.K. and Z.J.; validation, X.K., Y.M. and Z.J.; formal analysis, X.K.; investigation, X.K. and Y.M.; resources, D.C.; data curation, Y.M.; writing—original draft preparation, X.K.; writing—review and editing, J.Z. and D.C.; visualization, X.K., Y.M. and Z.J.; supervision, J.Z. and D.C.; project administration, J.Z.; funding acquisition, J.Z. All authors have read and agreed to the published version of the manuscript.
Funding
This research was supported by the China Scholarship Council (CSC), grant number 202406540085.
Data Availability Statement
The authors do not have permission to share data.
Acknowledgments
This paper is a result of the National Undergraduate Innovation and Entrepreneurship Training Program at Beijing University of Technology. The authors would like to thank the editor and reviewers for their constructive comments and suggestions.
Conflicts of Interest
The authors declare no conflicts of interest.
References
- Pojani, D.; Stead, D. Sustainable urban transport in the developing world: Beyond megacities. Sustainability 2015, 7, 7784–7805. [Google Scholar] [CrossRef]
- Van Soest, D.; Tight, M.R.; Rogers, C.D. Exploring the distances people walk to access public transport. Transp. Rev. 2020, 40, 160–182. [Google Scholar] [CrossRef]
- Mohiuddin, H. Planning for the first and last mile: A review of practices at selected transit agencies in the United States. Sustainability 2021, 13, 2222. [Google Scholar] [CrossRef]
- Fan, A.; Chen, X.; Wan, T. How Have Travelers Changed Mode Choices for First/Last Mile Trips after the Introduction of Bicycle-Sharing Systems: An Empirical Study in Beijing, China. J. Adv. Transp. 2019, 2019, 5426080. [Google Scholar] [CrossRef]
- Fan, Y.; Zheng, S. Dockless bike sharing alleviates road congestion by complementing subway travel: Evidence from Beijing. Cities 2020, 107, 102895. [Google Scholar] [CrossRef]
- Yu, Y.; Zang, P.; Ye, B.; Liao, X.; Zhao, Z. Exploring the complex relationship between metro and shared bikes in the built environment: Competition, connection, and complementation. Sustain. Cities Soc. 2024, 115, 105870. [Google Scholar] [CrossRef]
- Chen, W.; Liu, X.; Chen, X.; Cheng, L.; Chen, J. Deciphering flow clusters from large-scale free-floating bike sharing journey data: A two-stage flow clustering method. Transportation 2025, 52, 155–184. [Google Scholar] [CrossRef]
- Sun, X.; Cui, X.; Gao, Y. How urban form shapes bike-metro integration: A multidimensional typology of usage patterns and accessibility inequities. Travel Behav. Soc. 2025, 41, 101080. [Google Scholar] [CrossRef]
- Wu, H.; Wang, Y.; Sun, Y.; Yin, D.; Li, Z.; Luo, X. Identification and spatiotemporal analysis of bikesharing-metro integration cycling. ISPRS Int. J.-Geo-Inf. 2023, 12, 166. [Google Scholar] [CrossRef]
- Cai, J.; Liang, Y. System dynamics modeling for a public–private partnership program to promote bicycle–metro integration based on evolutionary game. Transp. Res. Rec. 2021, 2675, 689–710. [Google Scholar] [CrossRef]
- Hu, J.W.; Creutzig, F. A systematic review on shared mobility in China. Int. J. Sustain. Transp. 2022, 16, 374–389. [Google Scholar] [CrossRef]
- Lee, M.; Hwang, S.; Park, Y.; Choi, B. Factors affecting bike-sharing system demand by inferred trip purpose: Integration of clustering of travel patterns and geospatial data analysis. Int. J. Sustain. Transp. 2022, 16, 847–860. [Google Scholar] [CrossRef]
- Feng, J.; Liu, H. An Adaptive Spatial-Temporal Method Capturing for Short-Term Bike-Sharing Prediction. IEEE Trans. Intell. Transp. Syst. 2024, 25, 16761–16774. [Google Scholar] [CrossRef]
- Ma, X.; Cao, R.; Jin, Y. Spatiotemporal clustering analysis of bicycle sharing system with data mining approach. Information 2019, 10, 163. [Google Scholar] [CrossRef]
- Mátrai, T.; Tóth, J. Cluster analysis of public bike sharing systems for categorization. Sustainability 2020, 12, 5501. [Google Scholar] [CrossRef]
- Fleming, K.L. Social equity considerations in the new age of transportation: Electric, automated, and shared mobility. J. Sci. Policy Gov. 2018, 13, 20. [Google Scholar]
- Yan, Q.; Gao, K.; Sun, L.; Shao, M. Spatio-temporal usage patterns of dockless bike-sharing service linking to a metro station: A case study in Shanghai, China. Sustainability 2020, 12, 851. [Google Scholar] [CrossRef]
- Hamidi, Z.; Camporeale, R.; Caggiani, L. Inequalities in access to bike-and-ride opportunities: Findings for the city of Malmö. Transp. Res. Part A Policy Pract. 2019, 130, 673–688. [Google Scholar] [CrossRef]
- Li, Z.; Yan, H.; Zhang, C.; Tsung, F. Individualized passenger travel pattern multi-clustering based on graph regularized tensor latent dirichlet allocation. Data Min. Knowl. Discov. 2022, 36, 1247–1278. [Google Scholar] [CrossRef]
- Cao, M.; Huang, M.; Ma, S.; Lü, G.; Chen, M. Analysis of the spatiotemporal riding modes of dockless shared bicycles based on tensor decomposition. Int. J. Geogr. Inf. Sci. 2020, 34, 2225–2242. [Google Scholar] [CrossRef]
- Gao, F.; He, S.Y.; Han, C.; Liang, J. The impact of shared mobility on metro ridership: The non-linear effects of bike-sharing and ride-hailing services. Travel Behav. Soc. 2024, 37, 100842. [Google Scholar] [CrossRef]
- Chen, T.; Chen, Y.; Mu, Z.; Yu, X. The Game Relationship of Metro station Connection Mode: The Competition and Complementarity of Bike-sharing and Bus. IEEE Access 2025, 13, 70128–70137. [Google Scholar] [CrossRef]
- Zhan, Z.; Guo, Y.; Noland, R.B.; He, S.Y.; Wang, Y. Analysis of links between dockless bikeshare and metro trips in Beijing. Transp. Res. Part Policy Pract. 2023, 175, 103784. [Google Scholar] [CrossRef]
- Kosmidis, I.; Müller-Eie, D. The synergy of bicycles and public transport: A systematic literature review. Transp. Rev. 2024, 44, 34–68. [Google Scholar] [CrossRef]
- Shen, P.; Ouyang, L.; Wang, C.; Shi, Y.; Su, Y. Cluster and characteristic analysis of Shanghai metro stations based on metro card and land-use data. Geo-Spat. Inf. Sci. 2020, 23, 352–361. [Google Scholar] [CrossRef]
- Gan, Z.; Yang, M.; Feng, T.; Timmermans, H. Understanding urban mobility patterns from a spatiotemporal perspective: Daily ridership profiles of metro stations. Transportation 2020, 47, 315–336. [Google Scholar] [CrossRef]
- He, B.; Zhang, Y.; Chen, Y.; Gu, Z. A simple line clustering method for spatial analysis with origin-destination data and its application to bike-sharing movement data. ISPRS Int. J.-Geo-Inf. 2018, 7, 203. [Google Scholar] [CrossRef]
- Pang, L.; Jiang, Y.; Wang, J.; Qiu, N.; Xu, X.; Ren, L.; Han, X. Research of metro stations with varying patterns of ridership and their relationship with built environment, on the example of tianjin, China. Sustainability 2023, 15, 9533. [Google Scholar] [CrossRef]
- Tong, Z.; Zhu, Y.; Zhang, Z.; An, R.; Liu, Y.; Zheng, M. Unravel the spatio-temporal patterns and their nonlinear relationship with correlates of dockless shared bikes near metro stations. Geo-Spat. Inf. Sci. 2023, 26, 577–598. [Google Scholar] [CrossRef]
- Shanthappa, N.K.; Mulangi, R.H.; Manjunath, H.M. The spatiotemporal patterns of bus passengers: Visualisation and evaluation using non-negative tensor decomposition. J. Geovisualization Spat. Anal. 2023, 7, 9. [Google Scholar] [CrossRef]
- Tang, J.; Wang, X.; Zong, F.; Hu, Z. Uncovering spatio-temporal travel patterns using a tensor-based model from metro smart card data in Shenzhen, China. Sustainability 2020, 12, 1475. [Google Scholar] [CrossRef]
- Qi, G.; Huang, A.; Guan, W.; Fan, L. Analysis and prediction of regional mobility patterns of bus travellers using smart card data and points of interest data. IEEE Trans. Intell. Transp. Syst. 2018, 20, 1197–1214. [Google Scholar] [CrossRef]
- Tišljarić, L.; Carić, T. Clustering of the anomalous spatiotemporal traffic patterns using tensor decomposition method. In Proceedings of the 3rd Symposium on Management of Future Motorway and Urban Traffic Systems (MFTS), Luxembourg, 6–8 June 2020; pp. 1–4. [Google Scholar]
- Frutos-Bernal, E.; Martin del Rey, A.; Mariñas-Collado, I.; Santos-Martín, M.T. An Analysis of Travel Patterns in Barcelona Metro Using Tucker3 Decomposition. Mathematics 2022, 10, 1122. [Google Scholar] [CrossRef]
- Liu, Z.; Wang, X.; Bi, Y.; Kong, J.; Xu, R.; Chen, Y.; Tang, J. Travel Patterns Analysis Using Tensor-Based Model from Large-Scale License Plate Recognition Data. J. Adv. Transp. 2022, 2022, 3930795. [Google Scholar] [CrossRef]
- Lv, Y.; Zhi, D.; Sun, H.; Qi, G. Mobility pattern recognition based prediction for the subway station related bike-sharing trips. Transp. Res. Part Emerg. Technol. 2021, 133, 103404. [Google Scholar] [CrossRef]
- Sangveraphunsiri, T.; Fukushige, T.; Jongwiriyanurak, N.; Tanaksaranond, G.; Jarumaneeroj, P. Impacts of the COVID-19 pandemic on the spatio-temporal characteristics of a bicycle-sharing system: A case study of Pun Pun, Bangkok, Thailand. PLoS ONE 2022, 17, e0272537. [Google Scholar] [CrossRef] [PubMed]
- Wu, X.; Lu, Y.; Gong, Y.; Kang, Y.; Yang, L.; Gou, Z. The impacts of the built environment on bicycle-metro transfer trips: A new method to delineate metro catchment area based on people’s actual cycling space. J. Transp. Geogr. 2021, 97, 103215. [Google Scholar] [CrossRef]
- Moningkey, M.J.M.; Kaparang, D.R.; Sumual, H. The Distribution Pattern Of New Students Admissions Using The K-Means Clustering Algorithm. Int. J. Inf. Technol. Bus. 2024, 6, 1–10. [Google Scholar] [CrossRef]
- Yan, X.; Gao, L.; Chen, J.; Ye, X. Usage and temporal patterns of public bicycle systems: Comparison among points of interest. Information 2021, 12, 470. [Google Scholar] [CrossRef]
- Baran, A.; Piórkowski, A. Using Histogram Skewness and Kurtosis. In Proceedings of the The Latest Developments and Challenges in Biomedical Engineering: The 23rd Polish Conference on Biocybernetics and Biomedical Engineering, Lodz, Poland, 27–29 September 2023; Springer Nature: Berlin/Heidelberg, Germany, 2023; Volume 746, p. 67. [Google Scholar]
- Schubert, E. Stop using the elbow criterion for k-means and how to choose the number of clusters instead. ACM Sigkdd Explor. Newsl. 2023, 25, 36–42. [Google Scholar] [CrossRef]
- Jaslam, P.M.; Bhardwaj, N.; Devi, M.; Singh, V.K.; Anu. Diversity structure analysis based on hierarchical clustering method. AIP Conf. Proc. 2022, 2357, 080003. [Google Scholar] [CrossRef]
- Shi, C.; Wei, B.; Wei, S.; Wang, W.; Liu, H.; Liu, J. A quantitative discriminant method of elbow point for the optimal number of clusters in clustering algorithm. EURASIP J. Wirel. Commun. Netw. 2021, 2021, 31. [Google Scholar] [CrossRef]
- Diop, A.K.; Gueye, A.D.; Tall, K.; Farssi, S.M. A SVM approach for assessing traffic congestion state by similarity measures. In Proceedings of the International Conference on Networking, Intelligent Systems and Security, Bandung, Indonesia, 30–31 March 2022; Springer: Berlin/Heidelberg, Germany, 2022; pp. 63–72. [Google Scholar]
- Banihosseini, M.; Baradaran, V.; Doroudyan, M.H. Clustering approach to identifying and analyzing the traffic conditions: A novel hybrid cloud density and fuzzy clustering algorithm. Int. J. Intell. Transp. Syst. Res. 2025, 23, 1–15. [Google Scholar] [CrossRef]
- Zhao, Y.; Wu, Y.; Zhang, X.; Wang, Y.; Zhang, Z.; Lu, H.; Ma, D. Analysis and Prediction of Dockless Shared Bike Demand Evolving Around Urban Rail Transit Stations: Case Study in Shenzhen, China. Urban Rail Transit 2023, 9, 368–382. [Google Scholar] [CrossRef]
- Allard, R.F.; Moura, F. The incorporation of passenger connectivity and intermodal considerations in intercity transport planning. Transp. Rev. 2016, 36, 251–277. [Google Scholar] [CrossRef]
Disclaimer/Publisher’s Note: The statements, opinions and data contained in all publications are solely those of the individual author(s) and contributor(s) and not of MDPI and/or the editor(s). MDPI and/or the editor(s) disclaim responsibility for any injury to people or property resulting from any ideas, methods, instructions or products referred to in the content. |
© 2025 by the authors. Licensee MDPI, Basel, Switzerland. This article is an open access article distributed under the terms and conditions of the Creative Commons Attribution (CC BY) license (https://creativecommons.org/licenses/by/4.0/).