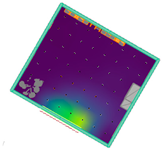
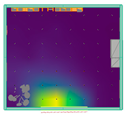
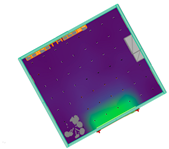
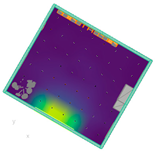
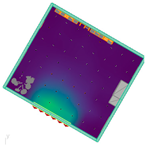
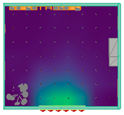
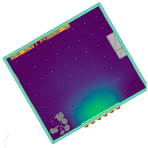
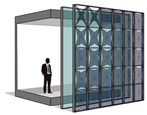
Highlights
What are the main findings?
- This work shows geometrically complex adaptive photovoltaic shading systems to achieve significantly high energy production and glare control, while maintaining daylight availability, compared to simple configurations.
- Advanced kinetic shading configurations demonstrate optimal overall performance with enhanced thermal control, superior daylight uniformity, and economic viability with a payback time of 2.9–7.4 years, considering different building typologies and climate conditions.
What are the implications of the main findings?
- This research establishes that sophisticated adaptive shading systems can simultaneously optimize energy generation, occupant comfort, and visual performance through multi-objective control algorithms that balance solar tracking with daylight factor maintenance, providing architects with evidence-based design guidance for smart building envelope technologies.
- The comprehensive framework enables scalable implementation of Dynamic and Adaptive Photovoltaic Shading Systems across diverse climates and building types, advancing the integration of renewable energy production with smart building envelope design in urban sustainability initiatives.
Abstract
Dynamic and Adaptive solar systems demonstrate a greater potential to enhance the satisfaction of occupants, in terms of indoor environment quality and the energy efficiency of the buildings, than conventional shading solutions. This study has evaluated Dynamic and Adaptive Photovoltaic Shading Systems (DAPVSSs) through a comprehensive analysis of six shading designs in which their energy production and the comfort of occupants were considered. Energy generation, thermal comfort, daylight, and glare control have been assessed in this study, considering multiple orientations throughout the seasons, and a variety of tools, such as Rhino 6.0, Grasshopper, ClimateStudio 2.1, and Ladybug, have been exploited for these purposes. The results showed that the prototypes that were geometrically more complex, designs 5 and 6 in particular, had approximately 485 kWh higher energy production and energy savings for cooling and 48% better glare control than the other simplified configurations while maintaining the minimum daylight as the threshold (min DF: 2%) due to adaptive and control methodologies. Design 6 demonstrated optimal balanced performance for all the aforementioned criteria, achieving 587 kWh/year energy production while maintaining the daylight factor within the 2.1–2.9% optimal range and ensuring visual comfort compliance during 94% of occupied hours. This research has established a framework that can be used to make well-informed design decisions that could balance energy production, occupants’ wellbeing, and architectural integration, while advancing sustainable building envelope technologies.
1. Introduction
The building sector accounts for approximately one-quarter of global energy consumption, and it exceeds the combined energy consumption of the industrial and transportation sectors [1]. A significant portion of this consumption has been attributed to the heating and cooling systems that are used to counteract the thermal inefficiency of building envelopes. Since more than 40% of the heat loss experienced in winter and the excessive heat gain experienced in summer take place through building façades, there is a tendency to rely on energy-intensive air conditioning systems [2,3]. Moreover, despite the urgent need to mitigate climate change and the intensification of the commitment to carbon neutrality targets, the focus on developing intelligent building systems that can significantly reduce energy consumption and maintain optimal indoor environments has also grown.
In order to address these inefficiencies, researchers have developed adaptive building envelope technologies as sustainable alternatives to conventional systems. Among these, innovative shading systems have emerged because of their ability to dynamically respond to environmental conditions, and, in particular, to the movement of the sun, while simultaneously enhancing the comfort of the occupants and reducing energy consumption [4]. Many researchers have examined various aspects of adaptive façades separately, but this research attempts to investigate Dynamic and Adaptive PV Shading Systems (DAPVSSs), which integrate photovoltaic technology with responsive shading mechanisms. These systems are used as a dual-purpose strategy: to generate renewable energy on-site and, at the same time, to optimize the interior environmental conditions.
DAPVSSs are able to adjust to real-time parameters, such as sunlight intensity and air temperature (only the sun orientation parameter has been considered in this study). DAPVSSs can significantly reduce the dependency on heating, cooling, and lighting systems [5]. The effectiveness of shading systems varies considerably because of multiple factors, including the envelope configuration, the architectural context, the energy performance requirements, the users’ needs, and the technological specifications [6]. Our study addresses three critical gaps in the current research on DAPVSSs:
- Performance: The existing work has not yet considered the trade-offs between energy consumption, energy generation, thermal comfort, and daylight penetration.
- Scalable: The majority of prototypes are site- and climate-specific, or they are limited to a specific building typology.
- Feasibility: New PV technologies consent to efficient use of PV modules with good independence of each element and without too high costs. In this work, technical and economic feasibility were analyzed.
A particularly promising development in this field is the Adaptive Solar Façade (ASF), which was conceptualized as a modular, dynamic, and flexible architectural element [7]. ASFs have gained the attention of the research community, due to their ability to comprehensively deal with environmental modulations and to improve heating, cooling, natural ventilation, acoustic insulation, and glare-free daylighting [8]. Although such systems offer certain benefits, there are several obstacles to their implementation, including the costs of the initial setup and technical issues associated with maintaining the systems. Other implementation concerns include their acceptability by users and by the market, as well as socioeconomic issues that impact the users’ acceptance and market penetration [9,10]. The main objective of this investigation was to develop a comprehensive analytical model that could be used to assess and optimize the performance of DAPVSSs and, consequently, energy generation, the occupants’ comfort level, and the economic feasibility of a system. By addressing the aforementioned research gaps, we provide evidence-based guidance for architects, engineers, and policymakers, which could be used to enable them to implement these systems in diverse building contexts.
2. Methodology
In this study, a systematic methodology was developed to evaluate DAPVSS with emphasis on building energy efficiency and occupants’ comfort. Figure 1 shows the multi-phase process with this purpose.
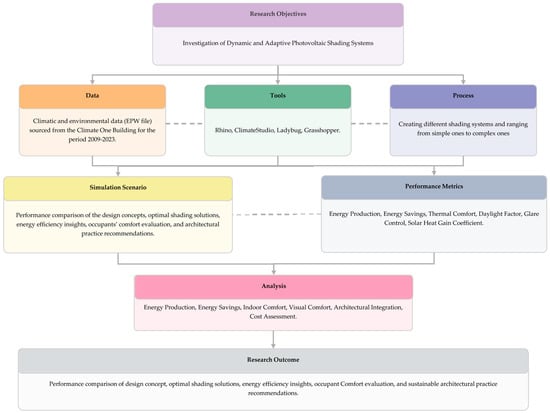
Figure 1.
Flowchart of the design development process, showing the progression from the objectives, through the design development and computational analysis, to the performance evaluation.
Figure 1 shows the progress of the conducted study, from the objective phase through the design development, input climate data [11], computational analysis, and performance evaluation to the enhancement of architectural design by means of computational simulation. This framework fills the gap between theoretical modeling and practical application, and it identifies the best solutions that can be used to balance the technical performance, occupants’ wellbeing, and the architectural requirements of a building.
2.1. Design Development Process
Multiple designs have been developed in this study. We began the study by designing several shading systems and then categorizing them from the simplest configuration to the most complex. The most efficient systems, that is, the ones that were more compatible with the conceptualization of the occupants’ needs, were chosen in the system selection process.
The systems were then assessed in terms of their shading efficiency, energy performance (including production with PV and energy savings), aesthetics, and adaptability to different types of buildings and various building orientations. This stage ensured that the final results would not just be functional but also visually compatible with the contemporary architectural trends [12].
2.2. Tools and Performance Metrics
A variety of advanced simulation and modeling tools were utilized to evaluate the performance of the systems considered, including (Figure 2):
- Rhino (Version 6.0) [13], which was used for the 3D modeling of the base building geometry and the six DAPVSS designs.
- Grasshopper [14], which was employed for the development of the parametric design and the integration of the analytical plugins.
- Climate Studio [15], which was applied for the detailed daylight analysis, energy modeling, and the thermal performance simulations.
- Ladybug Tools [16], which was utilized for solar radiation analysis, shading calculations, and environmental visualization.
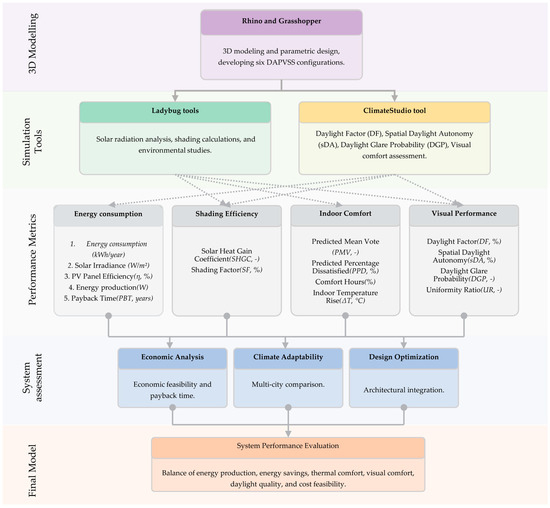
Figure 2.
Comprehensive DAPVSS analysis framework illustrating the computational workflow from parametric design through environmental simulation to multi-criteria performance evaluation including energy, thermal, visual, and economic assessment for sustainable building envelope optimization.
Each tool was used in all the phases to analyze a metric, in terms of energy production, shading efficiency, and indoor comfort, under different environmental conditions. Simulations were conducted by evaluating various scenarios and parameters, including changes in the sun’s position and shading states, different orientations, and different height levels of the devices. This provided valuable insights into how the system performed in both theoretical and real-world applications. This approach ensured a boost in performance of both energy efficiency and occupants’ comfort.
Some key performance indicators (KPIs), such as the energy yield (kWh/year), thermal comfort (PMV, PPD) [17], daylight factors (DF, DA), and glare control (DGP) [18], were used to evaluate the performance of the systems in order to assess their effectiveness and to balance the energy production and consumption, indoor comfort, and visual performance, as shown in Figure 2. By focusing on these KPIs, the study ensured that the designs met the goals of energy efficiency and occupants’ satisfaction, thereby leading to a suitable approach that could be adapted to a wide range of building types and climates. Different scenarios, such as a variety of shading states (open, closed, optimized) and solar orientations, in terms of the position of the windows (facing South, South-East, South-West), were considered and evaluated to test the accuracy and efficiency of the aforementioned systems and to identify the best designs for the various conditions.
2.3. Technical and Architectural Case Studies
Several case studies of similar projects with dynamic and adaptive photovoltaic shading systems were analyzed and assessed to provide practical insights into the effectiveness of such systems (Table 1). These case studies highlighted the design, performance, and integration of the mechanisms adopted in actual buildings, thereby offering valuable information for future applications. Then, after examining how the systems performed in different climates and architectural contexts, the methodology was reinforced with examples of successful case studies. Table 1 shows some of the examined case studies and their key features.

Table 1.
The analyzed case studies of existing dynamic and adaptive façade systems [19,20,21,22,23,24,25,26,27,28,29,30].
Even though we analyzed such aspects as the technologies and PV systems of some of the case studies, we also assessed some other aspects to obtain a better understanding of the usability, architectural integration and installation of such systems; the case studies in this section are evidence of the existence of several similar building structures that are currently implementing such systems, and of the benefits of their implementation.
Looking at Table 1, the examples were considered such as TU Darmstadt Solar Decathlon [19], which utilizes rotational PV-integrated wooden slits, Novartis Pavilion [20], which is a zero-energy media façade, and the Soft House [21], with its flexible PV membranes, in the design strategies of DAPVSS Designs 1–3 in this study.
Then the Al-Bahr Tower [22], which is a large-scale design system as it has about 1049 folding hexagonal panels, the GSW Headquarters [23], which has a dual-skin façade system, the Freiburg Town Hall [24], with its vertical PV modules, and the Solar Ivy [25] biomimetic PV system as they are all regarded as being successful systems. We considered the Kiefer Technic Showroom [26], with its 112 individually controlled aluminum panels, in this work to assess the progression of complexity from the simple folding mechanisms (Design 1) to the sophisticated kinetic systems (Designs 5–6). Moreover, the hybrid rotational-sliding system of the Institute du Monde Arabe [27], which was inspired by traditional Mashrabiya patterns, the customizable PV configurations of the Swiss Tech Convention Center [28], and the wind-responsive passive fins of the Pittsburgh Children’s Museum [29] were all considered in the multi-criteria optimization approach used to evaluate the six DAPVSS designs, particularly in terms of the trade-offs between energy production, daylight quality, and glare control.
These projects were useful for the analysis conducted on the DAPVSS designs. Moreover, climate adaptability was also taken into consideration in different contexts. This involved such devices as the use of perforated metal rotating louvers, as used in the temperate climate of Zurich Airport [30], to the use of the desert application of the Al-Bahr Tower [22], both of which were considered in this study to conduct a multi-city performance comparison across the different climate conditions of Oslo, Turin, and New Mexico.
Furthermore, in order to enhance the analytical depth of this section and respond to the need for research-focused evaluation, a comparative assessment of the selected case studies in terms of energy performance has been included. Table 2 presents a structured comparison of reference projects implementing dynamic and adaptive systems, with a focus on energy performance, system typology, PV integration, and climatic context. Key indicators such as annual energy demand, PV energy production, energy offset percentage, and shading classifications are summarized in Table 2. This matrix reveals different design strategies, ranging from passive shading systems with limited energy contribution (e.g., GSW Headquarters and Al Bahr Towers) to highly efficient PV-integrated façades that achieve or exceed net-zero energy performance (e.g., TU Darmstadt Solar House and Freiburg Town Hall). The inclusion of climatic zones further emphasizes the adaptability of these systems across temperate, cold, and hot-arid environments. This comparative framework provides a basis for benchmarking the performance of the proposed DAPVSS designs presented in subsequent sections, particularly in relation to energy efficiency, climate responsiveness, and architectural integration. These data can serve as reference points for future assessment and comparative analysis of systems.

Table 2.
Comparative summary of case studies featuring dynamic and adaptive photovoltaic systems.
Overall, these case studies highlight the importance of façade systems for various climates and typologies but also demonstrate the potential of DAPVSS to enhance energy efficiency and occupants’ comfort in real-world settings.
3. Design and Development of the Systems
The glazed surfaces of a building are one important element of the building structure, because they are highly responsive to solar radiation, and thus help to provide thermal and lighting comfort for the people in a building. A passive strategy with the design of solar shading systems mitigates heat gains during the peak sunlight hours, which is expected to enhance the performance and efficiency of the building, as well as the satisfaction of the users.
Especially in temperate climates, dynamic systems are preferable to static ones, due to their more flexible control and adaptability, which is particularly beneficial since the efficiency of a system depends on such parameters as time and orientation. Thus, static systems are less popular than DAPVSS, which have more flexible control properties, not only for lighting comfort but also for energy consumption or, in this case, for energy generation purposes. Dynamic shading devices rely on algorithms and mechanics to react to the local and overall conditions. These systems depend on such mechanical activities as rotation, translation, and deformation for their geometrical transformations [31].
A visual scheme of the categorized motions is shown in Figure 3. This figure demonstrates how certain geometric transformations serve as the foundation for dynamic shading operations.
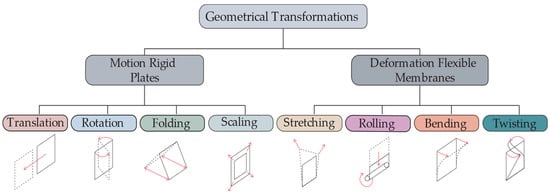
Figure 3.
Simplified categorization of the kinetic motion types and geometric deformation mechanisms considered in adaptive shading systems.
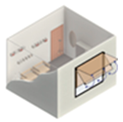
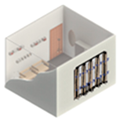
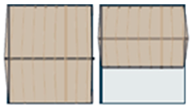
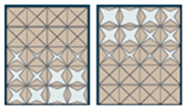
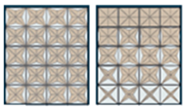
Table 3 presents the motion principles adopted for each design: Design 1 uses simple folding mechanisms, while designs 2 and 3 employ rotating louvers (vertical and horizontal, respectively). Design 4 features have a folding adjustment. Design 5 implements dynamic X-pattern movement, and Design 6 utilizes a fully adaptive hybrid grid system.

Table 3.
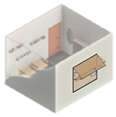
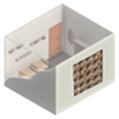
The six considered DAPVSS design configurations with their visual representations, motion diagrams, and architectural characteristics.
The systems were sorted and grouped. The six models were categorized according to their complexity: simple folding (Design 1), rotating panels (Designs 2 and 3), and complex shapes (Designs 4, 5, and 6). Furthermore, their effects on indoor quality and building energy were assessed, considering both the positive and negative impacts on a building and its occupants.
3.1. Design Considerations
During the system design phase, after considering various design concepts, six systems were selected for further assessments with the aim of achieving a suitable compromise between shading and energy production.
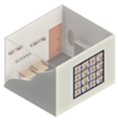
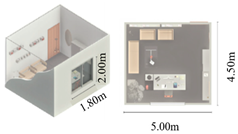
These designs, which are shown in Table 3, ranged from simple configurations to more complex systems. However, many challenges arose as a result of this selection. For instance, a significant challenge was that of developing a spatially adaptive system that would be able to enhance both the energy performance and the users’ experience at the same time. This integration of objectives led to the creation of kinetic solar shading systems, which were effectively able to balance efficiency with contemporary building demands pertaining to energy management, occupants’ satisfaction, and comfort. The characteristics of the room used to implement and assess the devices are presented in Table 4.

Table 4.
Comprehensive construction specifications and material properties of the standardized test room used for performance evaluation across all six design configurations.
The main concerns at this stage were the shading performance, energy production, and the adaptability of the design to various orientations. This phase began with Design 1, which featured a somewhat simple idea. This design evolved into Design 5, which had more complex geometries, and then into Design 6, which had responsive systems, thereby highlighting the generative aspect of the approach. Thus, the identified solutions are not just the optimal solutions of this study, as they could be employed over a range of possible options in other building sectors. The scale from simple to complex patterns will also help offer better insights to stakeholders to help them make informed decisions on the best-fit patterns in different contexts.
Although the variety of design criteria for these systems has represented a critical aspect in this study, it should be noted that aspects pertaining to mechanical and electrical systems, controllers, maintenance, and technical installation have not been addressed, and electrical consumptions of shading devices were considered similar. Instead, the research has focused on assessing the energy generation potential of the prototypes and on highlighting the benefits of their implementation, the user interface, and their effects on the six designs.
3.2. Photovoltaic Technology
The photovoltaic industry has undergone numerous advancements in recent years, with improvements in efficiency, design innovations, and the integration of solar energy into modern architecture. This evolution in PV technology has been taken into consideration for the current project.
The main purpose of this research has been to combine photovoltaic technology with shading systems in order to achieve the highest possible level of efficiency and productivity. Therefore, after considering the frame space that was needed to assemble panels on the shaders, about 80% of the total shader space was dedicated to PV panels. This investigation presents the potential of the various PV technologies that were assessed and the benefits of their applications (Table 5).

Table 5.
Comparative analysis of the photovoltaic technologies considered for DAPVSS integration [32,33].
The first PV system considered during the design stage was monocrystalline PV, as it is a high-efficiency PV, with performances that range between 15% and 26.8%. Monocrystalline solar glass is completely opaque and has a sleek mono-black appearance; it provides rigid durability as well as significantly higher efficiency and a longer lifespan of 25+ years than other technologies, thus making it ideal for rooftops, solar farms and high-irradiance installations, where maximum power generation is prioritized, although it comes at a higher cost and performs better under direct sunlight conditions [34]. Certain concerns about the aesthetic impact of this system, such as the related wiring, no-transparency with the lack of a visual connection between the outside and inside, and even the fact that the implementation of such a system could have a negative effect on the overall architecture of the building led to these problems being mitigated through the alternative use of amorphous PV systems.
Amorphous solar glass offers up to 70% transparency, and it has a uniform dark gray or brown appearance. It is flexible, lightweight, and suitable for integrated photovoltaic applications on buildings, for example, windows and façades, as well as portable devices. Although this technology has a lower efficiency (5–10%) and it performs well under low-light and high-temperature conditions. Amorphous silicon can be structured into single- or triple junction cells. Triple-junction cells, exploiting a broader portion of the solar spectrum, offer higher efficiency, especially in low-light conditions and if a little more expensive.
After comparing these two systems, it was decided to choose the amorphous PV technology with an efficiency of 10% (triple junction) as the best solution for the aforementioned problematic criteria. The decision to adopt this system was largely because using a semi-transparent system made it easier to provide daylight and visibility for the occupants. However, these systems are less efficient and considerably decrease the amount of energy produced, thereby creating another challenge. Therefore, power optimizers re added to the systems to avoid the reduction in energy production in the presence of shade and thus compensate for the low efficiency (Table 6). These systems are module-level devices that are able to optimize the energy production of individual PV elements via Maximum Power Point Tracking (MPPT), which was implemented on each element of the shading devices [34]. This PV system has good performance under partial shading, the differing panel angles, and their mismatch conditions, increasing the efficiency of the energy production system.

Table 6.
Specifications of the PV amorphous module with triple junction and power optimizer used to enhance the DAPVSS photovoltaic performance.
3.3. Comparative Analyses Framework and Control Logic
To evaluate the energy production potential of DAPVSS designs, this study employed a comparative analysis framework examining three distinct operational scenarios. These states were designed to establish the range of energy production possibilities and demonstrate the benefits of adaptive solar tracking versus static configurations.
3.3.1. Comparative Operational States
Three operational scenarios were simulated for each design to provide a comprehensive performance comparison:
- Open State: Elements permanently positioned for maximum daylight penetration with minimal PV obstruction (static baseline).
- Closed State: Elements permanently positioned for maximum shading/solar protection (static baseline).
- Adaptive Mode: Elements dynamically positioned according to solar irradiance, sun position, and daylight for optimal energy production (hourly dynamic optimization).
This comparative framework allows assessment of:
- Static performance range: Energy production boundaries between fully open and fully closed positions.
- Adaptive benefits: Additional energy gains achievable through dynamic solar tracking.
- Design effectiveness: How geometric complexity affects the performance between states.
3.3.2. Adaptive Mode Control Logic
The adaptive mode represents the core innovation of DAPVSS technology, where elements respond to environmental conditions for energy optimization. The control logic operates to optimize mainly the PV energy production and considering the more suitable surface exposure on three parameters:
- Solar Irradiance: Real-time hourly solar irradiance (W/m2).
- Solar Position: Sun azimuth and height angles, driving the optimal elements’ orientation.
- Daylight Availability: Natural daylight requirements at 80 cm above the floor (e.g., on the desks inside the offices for scenarios 4, 5, and 6).
For each hour from 5 am to 9 pm, the control algorithm used:
- Calculates current solar position (azimuth, altitude)
- Determine optimal PV element orientation for maximum solar irradiance
- Assesses available daylight levels for indoor natural lighting
- Position elements to balance energy generation with daylight provision
- Record energy production and indoor environmental effects.
3.3.3. Design-Specific Adaptive Behavior
The mentioned six PV shading devices were analyzed to evaluate the most suitable one considering solar geometry and irradiance, and natural daylight factors with hourly time-steps during all seasons. The first three designs have one axis rotation and the same control system for the whole window; the second three systems have different elements on the window that work individually. The movements of the six shading devices can be synthesized as follows:
Design 1 (Simple Folding, PV area is 80% of the shader surface and 30% of the window area): Its movement is limited to a single-axis hinge (typically 45–90°), making it simple but less responsive to changing sun paths throughout the day. When open, it is best suited for South-facing façades with high solar-height angles.
Design 2 (Vertical Louvers, PV area is 80% of the shader surface and window area): Panels rotate around vertical axes depending on the solar azimuth, maintaining efficient PV exposure during morning and afternoon hours. The lack of vertical adjustability limits midday effectiveness. Ideal for East- and West-facing façades.
Design 3 (Horizontal Louvers, PV area is 80% of the shader surface and window area): Panels tilt along horizontal axes to follow the sun’s height, providing effective shading during peak midday hours. It does not adapt well to changing sun azimuth, making it less suitable. Performs best on South-facing façades.
Design 4 (Folding System, PV area is 50% of the shader surface and window area): Similar to Design 1, but with six elements that can be regulated individually until the window is completely shaded.
Design 5 (4-Triangles Patterns with 80% PV area shader surface and window area): Adaptive coordination allows individual segments to independently track solar positions, maximizing energy generation while creating dynamic daylight patterns. The system combines horizontal and vertical rotation, making it efficient for all common façades.
Design 6 (8-Triangles Patterns with 80% PV area of shader surface and window area): Is the advanced version of Design 5 with double elements for a better performance system.
The comparative analysis framework demonstrates the energy benefits achievable through intelligent-adaptive control versus conventional-static shading systems. Videos on the movement mechanisms of each design are provided in Appendix C.
4. Performance Analysis and Simulation Results
We conducted a multi-stage computational simulation process, based on an advanced parametric design and on environmental analysis tools (Figure 2). The combined and sequential use of the software packages is described in detail in Figure 4, which shows the complete simulation workflow. The study begins with modeling six adaptive photovoltaic façade systems (DAPVSS) in Rhino, leveraging the precise geometry modeling capabilities of Rhino. This model was then scripted parametrically in Grasshopper, which allowed the geometry of the shading system to be modified dynamically and flexibly over a range of parameters to obtain rapid iterations and explore different design scenarios. Environmental data was imported using Ladybug and ClimateStudio, including hourly solar irradiance and solar position (azimuth and altitude) from EPW files for the Climate One Building (2009–2023) [11].
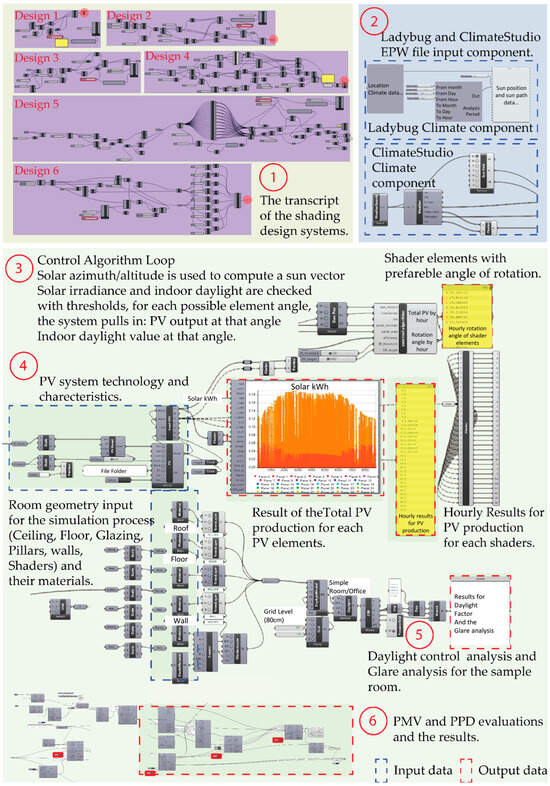
Figure 4.
The parametric modeling script process of Grasshopper with integration of geometric modeling, solar analysis, and performance evaluation components.
By using ClimateStudio, it was possible to simulate hourly indoor daylight availability using a horizontal sensor grid placed at 80 cm above the floor, providing average illuminance per hour. In parallel, PV production was pre-simulated for every element orientation per hour using ClimateStudio’s PV module combined with Ladybug, allowing performance evaluation across all design variations and evaluation scenarios. For each hour, the sun vector, solar irradiance, and indoor daylight levels were assessed and calculated to determine if they exceeded predefined thresholds. If so, the algorithm assesses all possible rotation angles for each system using a weighted performance score that balances PV output and daylight availability. The angle with the highest score is selected as the optimal orientation and applied to the system geometry in Grasshopper. The process records key outputs such as selected angle, PV generation, daylight sufficiency, and environmental parameters. This hour-by-hour evaluation logic allows all six systems to dynamically respond to climate conditions, maximizing energy efficiency while maintaining visual comfort for occupants. The three typical orientations (South, South-East, South-West) were then explored in PV systems during the simulation process to achieve a more accurate result. This was primarily carried out because the maximum solar radiation occurs in these oriented facades during the day.
4.1. Energy Yield and Performance
Since a well-designed system is tailored to the various parameters and operational aspects that can influence the energy yield and overall efficiency, our simulations were initialized through an energy performance assessment. The efficiency of the solar panels determines the conversion of solar energy into electricity, as illustrated in the following equation [35]:
where
E = η · A · H · PR
E is the electrical energy produced (kWh), H is the solar irradiation (kWh/m2), η is the panel efficiency, A is the active panel area (m2), and PR is the Performance Ratio which considers all energy losses compared to standard test conditions (STC, Tae = 25 °C and Isol = 1000 W/m2).
It is worth noting that this study was conducted in the city of Turin, Italy, and the primary metric used to evaluate energy production was solar irradiance (W/m2). The data were collected on an hourly basis to achieve a more accurate and realistic result. Additionally, the PV production results of Design 1, which is the simplest and the most basic system of all the designs considered, were compared with the data that were obtained through a manual calculation process using Equation (1). Our simulation predicted 102 kWh/year for Design 1, with 1.20 m2 amorphous PV coverage (about one-third of the 3.6 m2 window area) for the Turin climate conditions (average irradiation 1406 kWh/m2/year). The manual calculation instead yielded 105 kWh/year (including power optimizer improvements), thus representing a 3.0% difference, a result that confirms the accuracy of the computational approach.
The simulations and assessments were conducted using different tools, such as Grasshopper and ClimateStudio, along with the Ladybug plugin, and they involved modeling each system and implementing the corresponding scripts, as shown in Figure 4.
The climate data (EPW file) used in this study were sourced from the Climate One Building for the 2009–2023 period [11]. The monthly climate data pertaining to three different locations of Turin, New Mexico, and Oslo are presented in Table A1 of Appendix A.
In order to optimize the performance of each panel, the systems were designed so that each component of the photovoltaic system could function separately and, as a result, maximize PV production and minimize shading losses. This is more evident in Designs 5 and 6, which allowed higher gains to be obtained and mutual shading between the elements to be minimized, due to their different configurations.
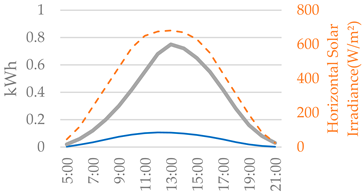
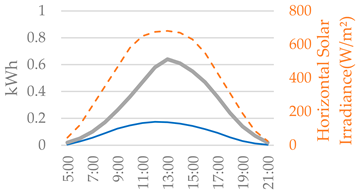
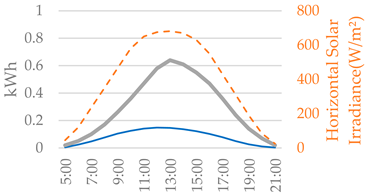
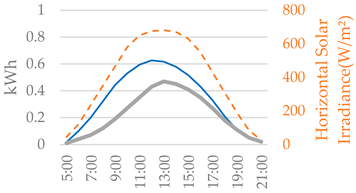
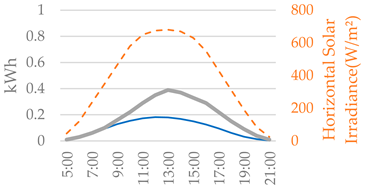
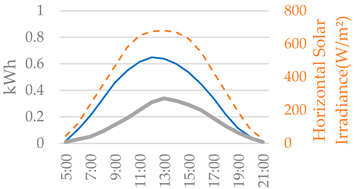
To demonstrate the operation of adaptive DAPVSS, Figure 5 presents hourly energy production data for a representative summer day of 15 July. This analysis illustrates how continuous solar tracking translates into advanced energy performance for the geometrically complex Designs 5 and 6.
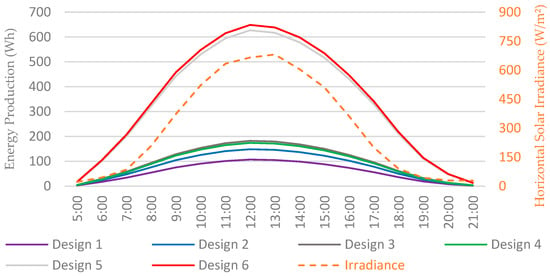
Figure 5.
Comparative hourly photovoltaic production analysis for all six DAPVSS designs on 15 July (peak summer conditions) on the South façade in Turin, Italy.
The hourly production profiles reveal the distinct adaptive capabilities across design configurations. The data shows that adaptive control operates through continuous positioning adjustments based on real-time solar conditions in order to maintain optimal PV surface orientation.
The adaptive shading effectiveness varies significantly across DAPVSS configurations, with Design 1 achieving 32% average shading through its simple folding mechanism, while Design 2 and Design 3 provide moderate improvements at 44% and 55% shading, respectively, through their vertical and horizontal louver systems. The more sophisticated configurations demonstrate substantially enhanced performance: Design 4 achieves 62% shading through folding adaptive positioning, Design 5 reaches 71%, and Design 6 delivers optimal thermal management with 75% average shading effectiveness through its hybrid grid configuration. Peak shading capabilities during maximum solar irradiance periods (12:00–14:00) range from 45% for the folding system to 90% for the advanced design, with dynamic operational ranges spanning 20–45% for Design 1 up to 65–90% for Design 6, demonstrating the superior adaptive thermal control achieved through geometric complexity and intelligent positioning algorithms.
The correlation between solar irradiance availability and PV production confirms the effectiveness of the adaptive systems. Peak solar irradiance in the middle of the day corresponds with maximum energy generation across all designs, with complex configurations achieving higher conversion efficiency through optimal positioning.
This hourly analysis confirms that continuous environmental responsiveness drives the superior annual performance of geometrically complex DAPVSS configurations and confirms the adaptive control methodology that is employed throughout this study.
Furthermore, Table 7 illustrates the hourly photovoltaic energy production and cooling demand analysis for the six DAPVSS during the time period from 05:00 to 21:00. The results reveal significant performance variations across the design spectrum, with geometrically complex configurations demonstrating substantially better energy generation capabilities. Design 6 achieved peak hourly production of 0.649 kWh at 13:00, representing about 6x improvement over Design 1’s peak output of 0.107 kWh. The adaptive shading effectiveness demonstrates a positive correlation with cooling demand, then Design 6’s high Solar Heat Gain Coefficient (SHGC = 0.22) results in 55% lower cooling requirements compared to Design 1 (SHGC = 0.64). The hourly data shows the effectiveness of real-time solar tracking algorithms, with peak energy generation coinciding precisely with maximum solar irradiance availability, thereby confirming the adaptive control methodology’s capacity to optimize energy harvesting throughout varying solar conditions.

Table 7.
Hourly photovoltaic energy production and cooling demand analysis for six DAPVSS configurations during peak summer conditions (15 July, Turin, Italy).
The results indicate that the most complex systems offer better results. The comparative performance data show that Designs 5 and 6 outperform the simpler designs, thereby underscoring the importance of designing shading patterns that effectively balance energy capture and shading functions.
Moreover, the seasonal differences confirm the expected energy production, which shows a peak production during the summer months (June to July) and the least energy output in winter (December to January), which confirms that the southern orientation leads to the highest annual productivity. Only Design 2 with vertical louvers has a lower production with South orientation because its performance decreases with high sun angles. At the same time, the South-East orientation offers a slightly better performance in the mornings, and the South-West one offers an excellent performance in the afternoons. Figure 6 represents the annual energy produced by each system design, showing that it clearly outperforms Designs 5 and 6 for all the assessed orientations (South, South-West, and South-East).
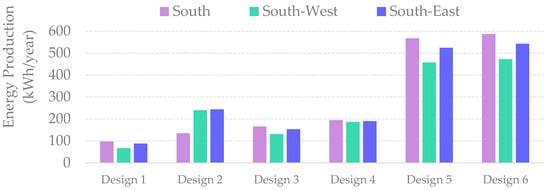
Figure 6.
Comparison of the annual energy production results for the six considered DAPVSS designs for three orientations (South, South-West, South-East).
In Figure 7, by assessing the energy production of Design 6, it can be observed that the production of this system reaches a maximum in July, when it delivers its best monthly performance. This design is particularly effective during warmer months, thus demonstrating its ability to easily handle intense solar radiation.

Figure 7.
Monthly photovoltaic energy productions for Design 6 for the three considered orientations.
Design 1 instead struggles to produce satisfactory results. It shows the lowest yield, and it produces the lowest amount of energy all year round for each orientation (as can be seen in Figure 7 and Figure 8). Therefore, Design 1 is less effective at capturing solar energy than the other systems. And, more importantly, the dimensions of the PV system in Design 1 are one-third of the window size, due to the necessity of considering the daylight factor and of not blocking natural light.

Figure 8.
Monthly photovoltaic energy production profile for Design 1 for the three considered orientations.
In Table 8, the progressive growth in the energy yields from Design 1 to Design 6 is shown. The gradual increase in design efficiency, correspondingly in the PV output, underlines the effect of more sophisticated shading strategies and larger surfaces, which are optimized for solar exposure. Further details on the monthly energy production of each system can be found in Table 8 and Table A2 in Appendix A.

Table 8.
The total annual energy production results of all six designs.
4.2. Indoor Comfort and User Experience Parameters
Thermal comfort is a crucial factor in a kinetic solar shading system as it ensures the occupants’ satisfaction and energy efficiency. The ability of the system to regulate the indoor temperature and reduce the solar heat gain, as a result of the movement of its elements, can have a direct impact on thermal comfort. Therefore, one of the key metrics that should be considered in the design of a system is the Solar Heat Gain Coefficient (SHGC), which is used to measure the fraction of solar radiation that enters a space through windows. Equation (2), which, in this study, represents the annual average performance of each DAPVSS design, accounts for the dynamic shading adjustments throughout the year. Figure 9 shows the average SHGC and the annual solar gain for each system design.
where
Qgain: solar heat entering through a glass (kWh), Qincident: incident solar radiation on the glazing surface (kWh).

Figure 9.
Comparison of the annual solar heat gain for the internal environment and the average Solar Heat Gain Coefficient (SHGC) for the six DAPVSS designs.
Another factor that has been evaluated in this study is the Predicted Mean Vote (PMV), which considers environmental factors such as the air temperature, mean radiant temperature, air velocity, relative humidity, and personal factors such as the metabolic rate and clothing insulation. These factors, considered together, determine the thermal comfort index PMV on a 7-point scale from −3 (cold) to +3 (hot), with ±0.5 representing the acceptable comfort range [36,37,38].
By simulating indoor temperatures and calculating the PMV, it was possible to ensure the maintenance and efficiency of the shading system, thereby resulting in a more comfortable environment.
Another essential metric that has been considered is the Predicted Percentage Dissatisfied (PPD), providing a direct quantification of thermal dissatisfaction. PPD was used to estimate the percentage of hours that occupants inside a unit are likely to feel uncomfortable [37,38].
A clear pattern emerges from an analysis of the data: more complex shading systems provide better thermal comfort. Design 1, which has a high SHGC that is equal to 0.65, shows significantly elevated indoor temperatures, with an increase of 5.2 °C above the outdoor ambient temperatures during the peak summer months (mainly July). This excessive heat gain leads to poor PMV comfort, that is, 1.6 for the South-oriented configurations, as shown in Figure 10. As the complexity of the shaders increases, the thermal comfort performance progressively improves in the design systems. For example, Design 2, which features vertical louvers (SHGC: 0.54), provides moderate thermal control, and it limits the summer temperature rise to about 4.7 °C, with a PMV of 1.3. In comparison, the horizontal configuration of Design 3 (SHGC: 0.43) exhibits a superior performance, with a temperature increase of 3.7 °C. Design 4 continues this optimization trend, and it achieves an SHGC of 0.36 and further reduces the thermal gain to 3.1 °C above the ambient conditions, resulting in a PMV of 0.7, which is close to the neutral comfort zone.

Figure 10.
Assessment of the Predicted Mean Vote (PMV) of the thermal comfort measured during peak summer conditions (15 July at 12:00) for the three south-oriented configurations.
The advanced systems (Designs 5 and 6) deliver exceptional thermal comfort performances that significantly outperform conventional shading approaches.
The dynamic X-pattern configuration of Design 5 (SHGC: 0.27) demonstrates a remarkable degree of thermal control, and it limits the temperature increase to only 2.4 °C during peak summer conditions, while maintaining a near-neutral PMV of 0.4. In Figure 11 it can be observed that this performance enables thermal comfort to be achieved during 95% of the hours occupied, thus indicating excellent year-round habitability.

Figure 11.
Performance of the annual adaptive thermal comfort with the percentage of occupied hours (8 AM–6 PM).
Design 6 also showed an excellent thermal optimization performance, as a result of its grid system, which led to the lowest SHGC, that is, of 0.24, and provided exceptional temperature control by limiting the indoor temperature rise to just 2.1 °C above the outdoor conditions, even during extreme summer peaks; this resulted in a PMV of 0.2.
Overall, the data show that advanced adaptive shading can maintain optimal thermal conditions while simultaneously maximizing the energy generation potential.
4.3. Visual Comfort
Visual comfort in buildings is fundamentally shaped by such factors as daylight availability, glare control, and view quality, all of which have been explored in this research.
Daylight Analysis
The amount of daylight received in a specified unit area plays a significant role in determining the efficiency of DAPVSS devices, as well as in the occupant’s satisfaction. One of the factors that plays a role in reaching these goals is the Daylight Factor (DF), which is the ratio of indoor-to-outdoor illuminance [39]:
where
DF = Ep/Eh,ext · 100, %
Ep is the inside illuminance of a reference point (lx)
Eh,ext is the outside horizontal illuminance with overcast sky conditions (lx).
The daylight performance of the six DAPVSS designs was evaluated using multiple metrics in order to assess both the quantity and quality of natural illumination. The simulations were conducted using Climate Studio and Ladybug tools (Figure 4).
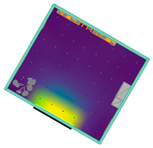
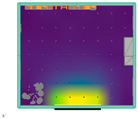
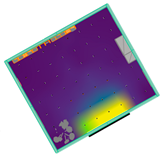
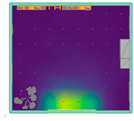
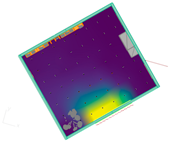
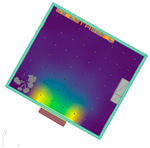
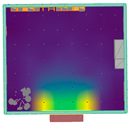
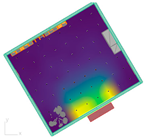
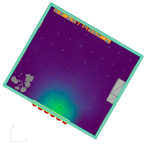
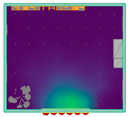
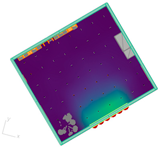
Design 1 shows the highest Daylight Factor of around 2.8% (maintained within a 2.6–3.1% range), with 91% DF compliance during occupied hours. Designs 2 and 3 maintained adequate daylight levels of about 2.1% and 2.3% DF, respectively (within 2.0–2.4% and 2.1–2.6% ranges), and offered improved solar protection with 94% and 89% DF compliance. Design 4 achieved a balanced DF of 2.4% (within 2.2–2.8% range) with 87% DF compliance, while the more complex designs, Designs 5 and 6, maintained optimal DF levels of 2.3% and 2.4%, respectively (within 2.1–2.7% and 2.1–2.9% ranges), achieving 89% and 94% DF compliance while significantly improving visual comfort through superior uniformity ratios of 0.71 and 0.75, and reduced occurrence of excessive illuminance. The illuminance gradient analysis, Daylight Factor, and the uniformity of the designs are shown in Figure 12 and Table 9 with multi-objective optimization that maintains daylight quality while maximizing energy generation, demonstrating practical optimum performance that balances energy production with occupant visual comfort. The thresholds used to evaluate daylight performance are reported in Table A3.
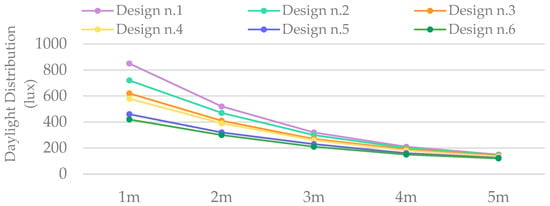
Figure 12.
Interior daylight distribution from the window for the six DAPVSS designs.

Table 9.
Comparison of the daylight assessments for all of the DAPVSS designs considered in the different orientations of South-West, South.
The findings demonstrate that the daylight distribution becomes more uniform, but diminishes in intensity, as the design complexity increases, with Design 6 showing a reduction of approximately 40% in light at a depth of 5 m, compared to Design 1.
The prevention of glare is fundamental to ensure visual comfort. The Daylight Glare Probability (DGP) factor was assessed in order to examine whether glare is likely to occur in a given space [40]:
where
DGP = f (Ev, Ls, ωs, Lb)
Ev is the vertical illuminance at eye level (lux), Ls is the luminance of the glare source (cd/m2), ωs is the solid angle of the glare source (sr), and Lb is the background luminance in the field of view (cd/m2).
The glare analysis revealed that these designs differed significantly in their ability to reduce discomfort and glare with DF integration (in Figure 13). The DGP values were 0.33 (imperceptible glare) in summer and 0.39 (perceptible glare) in winter for Design 1. While the winter value slightly exceeds the barely noticeable glare threshold of 0.35, the summer performance remains excellent, and DF integration has significantly improved year-round visual comfort compared to systems without DF control. The winter months present the most challenging conditions due to lower sun angles.
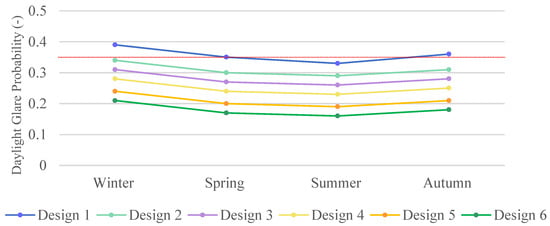
Figure 13.
Analysis of the seasonal Daylight Glare Probability (DGP) for the six DAPVSS designs.
The seasonal variation in DGP ranges from 0.33 to 0.39 for Design 1, demonstrating improved glare management with DF control compared to basic shading devices alone. Design 6 demonstrates superior glare control, with DGP values of 0.16 in summer and 0.21 in winter, both significantly below the barely noticeable glare threshold of 0.35. This represents 46% better glare control than Design 1 in winter conditions. Designs 2–6 maintain DGP values below 0.35 during summer conditions, with Design 6 showing remarkable consistency across seasons, only a 0.05-point difference between summer and winter. Designs 5 and 6 achieve excellent glare control with values well below 0.35 throughout all seasons.
4.4. Architectural Integration
The architectural implementation of DAPVSS can vary significantly, depending on the building typology and its characteristics. Therefore, the systems designed and analyzed in this research have been divided into two main groups: residential, for designs 1 to 3, and commercial, for designs 4 to 6.
Designs 1, 2, and 3, which demonstrate moderate performances, have been considered as suitable solutions for residential buildings. Design 1, which has a straightforward folding mechanism, offers operational simplicity and reduced maintenance demands, making it more cost-effective for domestic installations than other applications. The vertical louver configuration of Design 2 also provides directional solar control, and it is able to maintain visual coherence with the existing vertical façade rhythms. This is particularly beneficial for multi-story residential buildings. Similarly, Design 3, which features a horizontal louver system, enables graduated articulation and solar modulation of the façade, although it has a lower energy generation potential than more complex configurations.
Designs 4, 5, and 6 instead represent advanced configurations, which are suitable for larger-scale and more significant projects. Design 4 features seasonal adaptability, and it provides an enhanced energy yield and thermal control. The triangulated X-pattern configuration of Design 5 additionally offers structural efficiency and has a distinctive aesthetic appeal, as it creates dynamic shadow patterns that contribute to the visual interest of a façade, while maintaining effective solar control. Both of these designs are suitable for commercial and institutional buildings. Design 6, with its hybrid grid system, represents the most sophisticated solution, as it combines maximum operational flexibility with optimized energy generation, thus making it ideal for architectural landmark buildings and high-performance structures, where both functional excellence and architectural distinction are of primary importance.
All the systems considered (Table 10) offer integration options that can be used by architects. These options range from lightweight curtain wall attachments to full-structural envelope integration, which can satisfy their project needs.

Table 10.
Architectural integrated design systems.
Visual Impact and Aesthetic Integration Analysis
Design 6 demonstrates that the adaptive shading systems are able to achieve a maximum energy performance while maintaining a visual transparency of 70%, without compromising the environmental efficiency and/or architectural openness. The six designs represent an architectural spectrum, ranging from basic building enhancement (Design 1) to bold environmental expression (Design 6). These dynamic façade systems can enhance urban vitality through visual interest and the environmental performance of buildings by supporting broader sustainability initiatives in urban developments.
4.5. Comparison of the Climate Adaptability of the Considered Six DAPVSS Systems
In this study, three different cities with different climatic conditions and characteristics were chosen to evaluate the efficiency, functionality, and adaptability of the considered DAPVSS systems. Cities such as Oslo, New Mexico, and Turin were selected because of their different weather characteristics.
- Oslo, which is located at a latitude of 59.9° N, has a humid continental climate and receives 948 kWh/m2 of annual solar radiation [41];
- New Mexico, which is located at a latitude of 34.6° N and has a desert-type climate, receives 2079 kWh/m2 (monthly: 173 kWh/m2) [42];
- Turin, which was the main study site, is located at 45.1° N, has a moderately continental climate and it receives 1406 kWh/m2, thereby representing typical Mediterranean solar conditions [43].
New Mexico’s high solar irradiance (2079 kWh/m2/year) enabled Design 6 to achieve peak performances. The adaptive systems reduced the cooling energy needs by 30%, compared to fixed horizontal shadings, while maintaining PV efficiencies of 18–22% as a result of dynamic orientation adjustments. These differences in solar conditions directly impact the performance of DAPVSS systems across different climate zones, thereby emphasizing the importance of adjusting the solar technology to suit the local environmental conditions. They also show that sustainable solar energy practices cannot be assessed without considering the local solar dynamics, weather conditions, and geographic challenges. The following bar chart, shown in Figure 14, presents a comparison of the energy production of Design 6 in Turin, New Mexico, and Oslo for three different shading states: open, closed, and optimized.

Figure 14.
Climatic comparison of the energy production of Design 6 in Turin, New Mexico, and Oslo (kWh/year).
Moreover, the climate adaptability comfort assessment in this research was conducted by assessing the difference in the local temperature ranges, solar irradiance levels, and thermal performance data [44]. The assessment led to variations in the thermal comfort performances in the different locations. It should be noted that the term “Comfort hours” refers to the percentage of occupied time (8 AM–6 PM) in which the PMV values remain within the ±0.5 thermal comfort range [38], and it accounts for seasonal temperature variations and the thermal control characteristics of the DAPSS.
Figure 15 shows the Annual climate adaptability performance of Design 6 across the mentioned cities. At this stage, the evaluation of the performance of Design 6 in Oslo (cold climate; solar irradiance 948 kWh/m2) showed that it reached about 78% of comfort hours and experienced a minimal solar heat gain. Turin, with its mild climate (1406 kWh/m2), presented the best overall performance and reached around 92% of comfort hours. New Mexico, with its dry conditions (2079 kWh/m2), was more challenging in terms of providing thermal comfort, and Design 6 could only reach about 72% of comfort hours, given the intense amount of the solar load. These results confirm that the effectiveness of DAPVSS varies significantly according to the local climate conditions.
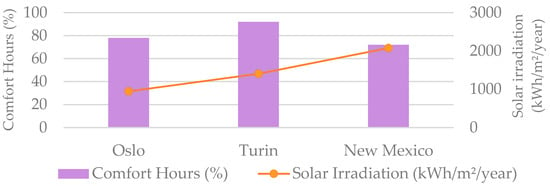
Figure 15.
Annual thermal comfort performance and percentage of occupied hours in comfort for Design 6 for the three considered climate zones.
4.6. Cost Assessment
An economic performance evaluation has been conducted to determine the convenience of the aforementioned systems, and several aspects were considered, including capital costs, operational expenses, energy savings, and payback time (PBT). Each index can be used to determine the financial impact of implementing such systems.
As previously mentioned, the systems were divided into two main categories: residential (Designs 1 to 3) and commercial (Designs 4 to 6). It should be recalled that the PV output of residential buildings is generally lower than that of commercial buildings, due to the larger scale and greater efficiency associated with smart grid technologies in commercial applications.
4.6.1. Calculation of the PV System Costs
The key components of the PV system, such as the costs of the PV panel, inverter, power optimizer, and the cost of installing and mounting the system, were considered in the calculation of the total costs of the system in Equation (5) [45]:
where
CI: Initial investment cost (€), Cinstallation: installation costs (€), CO&M: operation and maintenance costs (€/year), Creplacement: component replacement costs (€), Vresidual: residual value at end of analysis period (€).
Moreover, the economic grid integration analysis has indicated that all the DAPVSS configurations with DF integration offer improved economic feasibility, with annual net benefits ranging from €69 to €220 in the case of residential buildings and from €139 to €486 for commercial scenarios. The economic return is primarily due to PV generation, which accounts for 95% of the financial earnings, while passive cooling energy savings and enhanced occupant comfort provide supplementary value, accounting for the remaining 5%. The investment-to-return analysis revealed favorable capital recovery periods: residential systems achieved payback periods of approximately 4.2 to 8.2 years, with initial investments ranging from €569 to €929, while commercial systems demonstrated competitive economic efficiency, with payback periods of about 2.9 to 8.6 years, considering the higher capital requirements of about €1189 to €1944.
Design 2 in the South-East orientation (residential: 4.2 years, €220 annual benefit) and Design 5 in the south-west orientation (commercial: 2.9 years, €486 annual benefit) resulted to be the optimal solutions from an economic point of view, with ROI ranging from 136% to 298% for residential buildings and from 149% to 472% for commercial ones. The economic model confirmed the practical viability of DAPVSS systems that balance energy generation with occupant comfort through integrated daylight factor control, demonstrating that the slight energy trade-off is offset by improved user acceptance and building performance value.
4.6.2. Economic Performance Analysis
A performance analysis of the costs and revenues was conducted to assess the Annual Economic Benefits and the PayBack Time, which were calculated using Equations (6) and (7), respectively [45,46,47]:
where
AEB: annual economic benefit (€/year), EPV: PV energy production (kWh/year), Cavoided: avoided grid purchase cost (€/kWh), Esurplus: surplus energy sold to grid (kWh/year), Tfeed-in: feed-in tariff (€/kWh), CO&M: operation and maintenance costs (€/year), Cgrid: grid connection fees (€/year), Cfinancing: financing costs (€/year)
where
PBT: payback time (years), CI: initial investment cost (€), AEB: annual economic benefit (€/year).
The financial evaluation showed that PV production (in euros), the annual economic benefits, and the total costs were higher in commercial systems than in residential systems.
Figure 16 shows a comparison between the annual economic benefit (€) and payback time (years) for each Design, and it highlights the economic feasibility of the designs considered. The economic evaluations showed that Design 2 was the most efficient residential option among the system designs, especially for south-east orientation, as it offered the shortest payback time of 4.2 years with €220 annual benefit, while maintaining 94% daylight factor compliance. Design 5 showed the best performance for commercial buildings, especially in the south-west orientation, as it offered the highest economic benefit of €486 annually and a quick 2.9-year payback while achieving 89% DF compliance and 38% visual comfort improvement. Overall, the south-east and south-west orientations demonstrated better returns for residential and commercial setups, respectively, with the multi-objective optimization providing enhanced occupant satisfaction alongside economic viability. The payback times for Designs 5 and 6 remained attractive at 2.9–5.1 years, indicating the continued feasibility of advanced systems despite the energy-comfort trade-offs inherent in DF integration. Further data can be found in Table A4 in Appendix A.
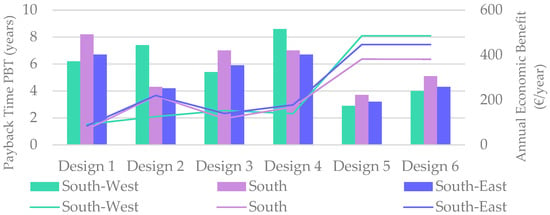
Figure 16.
Economic performance analysis of DAPVSS designs in Turin, Italy, comparing annual economic benefit (€/year) and simple payback time (years).
5. Discussion
The results of the evaluation of the six DAPVSS systems considered in this study have shown that the geometrically complex configurations significantly outperform the simpler alternatives. Also, the comparative case study analysis supported the proposed DAPVSS designs by providing real-world benchmarks across different climates and system types. These references helped demonstrate the practicality and adaptability of the designs developed in this study. Design 6 achieved a 6 times higher energy production and 48% better glare control than the basic designs. Moreover, the data confirmed the financial viability of the design systems, particularly for Design 5, which was considered for commercial buildings, and had a payback period of 2.9 years, and for Design 2, which was considered for residential buildings, and had a payback period of 4.2 years.
The relatively short payback periods observed in this study, that ranged from 2.9 to 4.2 years for the most efficient designs, are notably lower than the ones commonly reported in the existing literature, which often cite 5 to 10 years for comparable photovoltaic systems; this indicates that the integrated design and optimization methodology used here was effective in achieving more economically attractive solutions.
The annual energy performance of the mentioned system designs, depending on the configuration and climate zone, aligns well with values reported in the literature. These data can be compared with the results of Designs 5 and 6, which demonstrated enhanced performance through real-time adaptive response.
The case studies in the literature in Table 2 were used to compare the energy performance of the six DAPVSS designs. Systems like TU Darmstadt and Freiburg Town Hall operate within ZEB or even plus-energy standards, while others such as the Soft House use nZEB thresholds. These benchmarks support the DAPVSS designs in comparing the energy performance of shading PV technology in different contexts.
The comparative analysis of the reference case studies reveals some differences in installed photovoltaic energy output per square meter. High-performance examples such as the TU Darmstadt Solar House and Freiburg Town Hall achieve PV outputs of approximately 70 kWh/m2/year and 25 kWh/m2/year, respectively, enabling them to reach ZEB or even ZEB+ status. In contrast, the highest-performing DAPVSS system in this study, Design 6, achieves around 35.22 kWh/m2/year (based on a 3-window installation in a 50 m2 unit). While this is lower than the TU Darmstadt benchmark, it is noteworthy given that DAPVSS panels are integrated into façade shading devices rather than applied across full building envelopes. Designs 2–4 produce between 8.06 and 34.04 kWh/m2/year, highlighting the trade-off between visual openness, façade area coverage, and energy generation. These comparisons underline that while DAPVSS systems alone may not meet full ZEB criteria, they represent a viable façade-integrated solution that contributes meaningful energy production and comfort benefits. For future implementations, combining DAPVSS with complementary rooftop PV or other systems could significantly increase overall building energy autonomy. This improvement is attributed to climate-specific design, multi-objective control logic, and increased PV surface activation, demonstrating the potential for economically viable adaptive building envelopes.
Furthermore, the amorphous PV technology, despite its low 8–10.2% efficiency, preserved the architectural aesthetics of buildings, and its low efficiency also justified the use of power optimizers, which led to performance improvements under partial shading conditions.
The present study has addressed the critical gaps in DAPVSS research by comprehensively evaluating performance trade-offs, and it has demonstrated the scalability of the considered systems across different cities with various climates (Oslo, New Mexico, and Turin).
Overall, Design 6 offers the most balanced performance, and the results demonstrate that the optimal design selection mainly depends on the specific building requirements, the local solar conditions, and grid policies. The present study has been limited to simulation-based analysis considering automatic systems. Mechanical constraints, user behavior, and long-term maintenance were not evaluated. Building upon the comprehensive adaptive control algorithms and multi-objective optimization framework established in this study, future research should focus on physical sensor integration, experimental field validation, and development of standardized installation protocols to facilitate broader market adoption of these sustainable building envelope technologies.
6. Conclusions
The main criterion considered in this work was the optimization of the shading devices to produce energy and to assess their impact on occupants’ comfort. This research involved a comprehensive evaluation of six dynamic and adaptive photovoltaic shading systems (DAPVSSs) and focused on the improvement of the building energy performance, indoor thermal and visual comfort, and architectural integration, as shown in Figure 17.
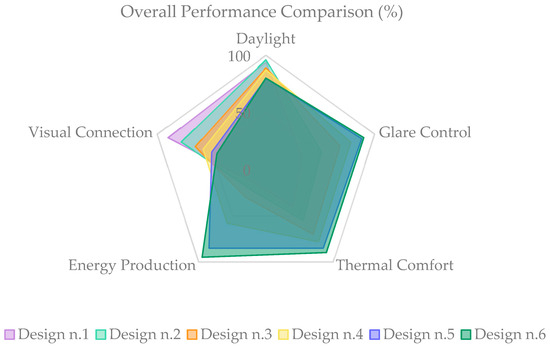
Figure 17.
Radar comparison chart of the comprehensive multi-criteria performance of the six considered DAPVSS designs.
The study revealed that Design 6 is the most effective system design of all the systems assessed in this study, as it achieved the highest glare control, thermal comfort, and energy generation results while maintaining optimal daylight factor, thus making it suitable for hot climates; Design 4 is the second-best option, and it offers similar daylighting results and visual accessibility, although it exhibits poorer glare control and energy production performances. However, among the remaining designs (1–5), Design 4 showed the most consistent performance across different evaluation criteria, achieving moderate results in energy generation (186–195 kWh/year), thermal comfort, and daylight without having the extreme weaknesses seen in simpler configurations. Design 3 and Design 2 represent trade-offs between environmental performance and user experience. Design 1, which performs better in daylight and in visual connection, exhibits the worst performance for the other parameters. Furthermore, the proposed DAPVSS configurations with DF integration have demonstrated strong potential in terms of energy performance, thermal comfort, and visual glare control, while successfully balancing daylight quality with energy generation. The multi-objective optimization approach ensured that visual comfort is maintained alongside energy performance, with all designs achieving daylight factor compliance during 87–94% of occupied hours. Furthermore, the DF integration approach addresses visual discomfort by maintaining illuminance within optimal ranges, resulting in 12–45% improvement in visual comfort for occupants. The systems that were designed and considered in this study have to face numerous challenges, including high initial costs, complex integration with the local aesthetics, and increased maintenance costs. These challenges should be assessed and analyzed in the next step of the research to overcome these challenges and reach the best possible solution.
Future work should investigate user-centered design strategies, such as transparency-optimized PV materials, responsive shading geometries with adaptive view corridors, and real-world occupant feedback studies, to ensure that visual comfort is holistically integrated alongside energy and environmental performance.
This research establishes that sophisticated adaptive shading systems can simultaneously optimize energy generation, occupant comfort, and visual performance through multi-objective algorithms that balance solar tracking with daylight factor maintenance, providing architects with evidence-based design guidance for smart building envelope technologies that prioritize occupant wellbeing alongside energy performance.
Author Contributions
Conceptualization, G.M.; methodology, R.R.K., G.M., R.I. and G.P.; software, R.R.K.; validation, G.M. and G.P.; formal analysis, R.R.K.; investigation, G.M., R.I. and G.P.; resources, G.M., R.I. and G.P.; data curation, G.M., R.I. and G.P.; writing—original draft preparation, R.R.K. and G.M.; writing—review and editing, R.R.K., G.M., G.P. and R.I.; visualization, R.R.K.; supervision, G.M. All authors have read and agreed to the published version of the manuscript.
Funding
This research received no external funding.
Data Availability Statement
The raw data supporting the conclusions of this article will be made available by the authors on request.
Conflicts of Interest
The authors declare no conflict of interest. The company Studio SolarDesign had no role in the design of the study; in the collection, analyses, or interpretation of data; in the writing of the manuscript; or in the decision to publish the results.
Correction Statement
This article has been republished with a minor correction to the Data Availability Statement. This change does not affect the scientific content of the article.
Abbreviations
The following abbreviations are used in this manuscript:
| Term | Definition |
| AEB | Annual Economic Benefit (€/year) |
| ASF | Adaptive Solar Façade |
| BIPV | Building-Integrated Photovoltaics |
| BMS | Building Management System |
| Cavoided | Avoided grid purchase cost (€/kWh) |
| Cfinancing | Financing costs (€/year) |
| Cgrid | Grid connection fees (€/year) |
| CI | Initial investment cost (€) |
| Cinstallation | Installation costs (€) |
| CO&M | Operation and maintenance costs (€/year) |
| Creplacement | Component replacement costs (€) |
| Ctotal | Total system cost (€) |
| Closed | Shader in closed state (maximum shading) |
| DA | Daylight Autonomy (%) |
| DAPVSS | Dynamic and Adaptive Photovoltaic Shading Systems |
| DF | Daylight Factor (%) |
| DGP | Daylight Glare Probability (-) |
| E | Electrical energy produced (kWh) |
| Eh,ext | Outside horizontal illuminance (lux) |
| Ep | Inside illuminance of a reference point (lux) |
| EPV | PV energy production (kWh/year) |
| Esurplus | Surplus energy sold to grid (kWh/year) |
| Ev | Vertical illuminance at eye level (lux) |
| EPBT | Energy Payback Time |
| EPS | Expanded Polystyrene |
| EPW | EnergyPlus Weather |
| H | Solar irradiation (kWh/m2) |
| HVAC | Heating, Ventilation, and Air Conditioning |
| KPI | Key Performance Indicators |
| Lb | Background luminance in the field of view (cd/m2) |
| Ls | Luminance of glare source (cd/m2) |
| MPPT | Maximum Power Point Tracking |
| Open | Shader in fully open state (maximum daylight) |
| Optimized/Adaptive | Shader adjusted according to sun’s position throughout the year |
| PBT | Payback Time (years) |
| PMV | Predicted Mean Vote (-) |
| PPD | Predicted Percentage Dissatisfied (%) |
| PR | Performance Ratio |
| PV | Photovoltaic |
| Qgain | Solar heat entering through a glass (kWh) |
| Qincident | Incident solar radiation on the glazing surface (kWh) |
| ROI | Return on Investment (%) |
| sDA | Spatial Daylight Autonomy (%) |
| SHGC | Solar Heat Gain Coefficient (-) |
| STC | Standard Test Conditions |
| Tfeed-in | Feed-in tariff (€/kWh) |
| U-Value | Thermal transmittance (W/m2K) |
| Vresidual | Residual value at end of analysis period (€) |
| VLT | Visible Light Transmittance |
| ωs | Solid angle of the glare source (sr) |
| A | Active panel area (m2) |
| η | Panel efficiency |
Appendix A
Appendix A.1. Climate Data
All climate data was extracted from Climate Consultant software [11] using EPW files from Climate.OneBuilding.Org. Turin data (WMO 160595) serves as the primary study location, with Oslo (WMO 014900) and New Mexico (WMO 720484) providing validation of climate adaptability across different climate zones.

Table A1.
Monthly Climatic Data.
Table A1.
Monthly Climatic Data.
| Month | Oslo, Norway | Turin, Italy (Primary) | New Mexico, USA | |||||||||
|---|---|---|---|---|---|---|---|---|---|---|---|---|
| Temp (°C) | Solar (W/m2) | Humidity (%) | Wind (m/s) | Temp (°C) | Solar (W/m2) | Humidity (%) | Wind (m/s) | Temp (°C) | Solar (W/m2) | Humidity (%) | Wind (m/s) | |
| Jan | −3 | 50 | 86 | 2 | 2 | 194 | 70 | 1 | 5 | 256 | 70 | 3 |
| Feb | −2 | 120 | 87 | 4 | 4 | 237 | 73 | 1 | 7 | 280 | 75 | 3 |
| Mar | 0 | 213 | 76 | 5 | 8 | 295 | 65 | 1 | 10 | 323 | 71 | 4 |
| Apr | 4 | 286 | 72 | 4 | 12 | 385 | 55 | 1 | 15 | 399 | 65 | 4 |
| May | 9 | 327 | 65 | 2 | 16 | 347 | 70 | 1 | 20 | 393 | 75 | 4 |
| Jun | 13 | 306 | 69 | 2 | 21 | 382 | 69 | 1 | 26 | 473 | 69 | 3 |
| Jul | 14 | 295 | 80 | 2 | 23 | 392 | 66 | 1 | 28 | 416 | 80 | 1 |
| Aug | 13 | 243 | 80 | 2 | 22 | 382 | 59 | 1 | 27 | 432 | 81 | 1 |
| Sep | 10 | 209 | 79 | 5 | 18 | 328 | 69 | 1 | 22 | 416 | 72 | 2 |
| Oct | 5 | 128 | 82 | 4 | 12 | 246 | 74 | 1 | 15 | 348 | 68 | 3 |
| Nov | 1 | 65 | 85 | 3 | 6 | 168 | 78 | 1 | 8 | 287 | 72 | 3 |
| Dec | −2 | 42 | 87 | 2 | 3 | 142 | 75 | 1 | 6 | 241 | 73 | 3 |
Appendix A.2. Monthly Energy Production with DAPVSS Systems
For the city of Turin, Table A2 presents monthly energy production for the six scenarios. The data show seasonal variations, with maximum production in the summer months (June–August) and minimum values in the winter months (December–February).

Table A2.
Monthly Energy production results (kWh).
Table A2.
Monthly Energy production results (kWh).
| Jan | Feb | Mar | Apr | May | Jun | Jul | Aug | Sep | Oct | Nov | Dec | ||
|---|---|---|---|---|---|---|---|---|---|---|---|---|---|
| South | Design 1 | 2.95 | 3.78 | 7.36 | 10.47 | 11.73 | 15.65 | 16.3 | 11.21 | 8.45 | 4.33 | 2.7 | 2.41 |
| Design 2 | 4.84 | 5.69 | 11.81 | 14.72 | 15.07 | 18.49 | 20.25 | 15.94 | 13.28 | 6.23 | 4.24 | 3.78 | |
| Design 3 | 6.64 | 8.28 | 12.02 | 15.94 | 21.67 | 24.44 | 24.34 | 18.31 | 13.07 | 9.22 | 5.95 | 5.31 | |
| Design 4 | 7.85 | 9.82 | 14.27 | 18.89 | 25.42 | 28.57 | 28.49 | 21.73 | 15.56 | 10.92 | 7.05 | 6.29 | |
| Design 5 | 22.83 | 28.46 | 41.31 | 54.81 | 74.5 | 83.97 | 83.56 | 62.86 | 44.87 | 31.64 | 20.45 | 18.23 | |
| Design 6 | 23.63 | 29.45 | 42.72 | 56.68 | 77.05 | 86.84 | 86.41 | 65.06 | 46.41 | 32.74 | 21.15 | 18.86 | |
| South-West | Design 1 | 2.98 | 3.71 | 5.4 | 7.12 | 9.59 | 10.78 | 10.74 | 8.2 | 5.87 | 4.11 | 2.66 | 2.37 |
| Design 2 | 6.7 | 6.7 | 10.31 | 15.82 | 22.78 | 36.06 | 35.67 | 35.56 | 33.2 | 17.92 | 12.07 | 10.76 | |
| Design 3 | 3.62 | 3.62 | 5.58 | 8.56 | 12.33 | 19.51 | 18.2 | 19.21 | 17.97 | 9.69 | 6.54 | 5.83 | |
| Design 4 | 5.85 | 5.85 | 8.62 | 13.17 | 18.72 | 29.38 | 28.84 | 28.97 | 27.2 | 14.93 | 9.97 | 8.89 | |
| Design 5 | 12.44 | 12.44 | 19.17 | 29.4 | 51.72 | 66.99 | 68.64 | 65.96 | 55.03 | 33.28 | 22.46 | 20.03 | |
| Design 6 | 12.89 | 12.89 | 19.82 | 30.41 | 53.16 | 69.28 | 70.66 | 68.21 | 57.1 | 34.41 | 23.23 | 20.72 | |
| South-East | Design 1 | 2.75 | 2.75 | 4.04 | 6.16 | 8.76 | 11.83 | 14.11 | 13.55 | 12.72 | 7.01 | 4.68 | 4.17 |
| Design 2 | 17.93 | 17.04 | 20.95 | 22.27 | 21.64 | 25.33 | 27.94 | 23.93 | 22.11 | 14.82 | 13.58 | 12.12 | |
| Design 3 | 4.61 | 5.9 | 11.58 | 16.45 | 18.43 | 24.63 | 25.63 | 17.65 | 13.27 | 6.79 | 4.22 | 3.76 | |
| Design 4 | 5.89 | 7.54 | 14.68 | 20.87 | 23.4 | 31.26 | 32.55 | 22.4 | 16.84 | 8.62 | 5.36 | 4.78 | |
| Design 5 | 15.84 | 20.28 | 39.72 | 56.49 | 63.28 | 84.45 | 87.91 | 60.46 | 45.52 | 23.26 | 14.48 | 12.92 | |
| Design 6 | 16.4 | 20.97 | 41.12 | 58.42 | 65.44 | 87.33 | 90.91 | 62.54 | 47.08 | 24.05 | 14.97 | 13.36 | |
Appendix A.3. Daylight Performance Evaluation and Threshold Values Used in DAPVSS Assessments
Daylight performance evaluation and threshold values used in DAPVSS assessments.

Table A3.
Daylight performance evaluation standards and thresholds used in DAPVSS assessment.
Table A3.
Daylight performance evaluation standards and thresholds used in DAPVSS assessment.
| Performance Metric | Threshold Range | Performance Level | Description |
|---|---|---|---|
| Daylight Factor (DF) | <2% | Insufficient | Below the minimum for adequate daylight |
| 2–5% | Optimal | Visual comfort without glare issues | |
| >5% | Excessive | May cause overheating and glare problems | |
| Spatial Daylight Autonomy (sDA) | ≥50% | Acceptable | minimum requirement |
| ≥65% | Good performance | Enhanced daylight availability | |
| Uniformity Ratio | <0.4 | Poor | Uneven light distribution |
| 0.4–0.6 | Minimum acceptable | Basic uniformity requirements |
Appendix A.4. Economic Analysis
The comprehensive economic assessment of all six DAPVSS designs in three orientations is presented in Table A4. The analysis includes initial capital costs, annual economic benefits, payback periods, and return on investment (ROI) calculations for each design configuration. (All data presented in Table A4 are rounded to the nearest value for clarity).

Table A4.
The Economic Assessment.
Table A4.
The Economic Assessment.
| South-West | South | South-East | ||||||||||
|---|---|---|---|---|---|---|---|---|---|---|---|---|
| Cost (€) | Benefit (€/year) | Payback (years) | ROI (%) | Cost (€) | Benefit (€/year) | Payback (years) | ROI (%) | Cost (€) | Benefit (€/year) | Payback (years) | ROI (%) | |
| Design 1 | 569 | 92 | 6.2 | 201 | 569 | 69 | 8.2 | 136 | 569 | 85 | 6.7 | 183 |
| Design 2 | 929 | 126 | 7.4 | 168 | 929 | 218 | 4.3 | 294 | 929 | 220 | 4.2 | 298 |
| Design 3 | 823 | 153 | 5.4 | 230 | 823 | 117 | 7.0 | 176 | 823 | 140 | 5.9 | 204 |
| Design 4 | 1189 | 139 | 8.6 | 149 | 1189 | 169 | 7.0 | 171 | 1189 | 178 | 6.7 | 180 |
| Design 5 | 1430 | 486 | 2.9 | 472 | 1430 | 382 | 3.7 | 375 | 1430 | 447 | 3.2 | 446 |
| Design 6 | 1944 | 486 | 4.0 | 320 | 1944 | 381 | 5.1 | 251 | 1944 | 447 | 4.3 | 294 |
Appendix B
Photo credentials:
TU Darmstadt Solar Decathlon: Technische Universität Darmstadt’s passive house used by German universities. Photo credit: Galería de Decatlón Solar 2007-12. Available online at: https://www.archdaily.pe/pe/02-4220/decatlon-solar-2007/52831336_sd-primer-lugarjpg (accessed on 17 May 2025).
Novartis Pavillon: Zero-Energy Media Façade. Photo credit: IArt—studio for media architecture, v2com newswire: Press release distribution, Architecture, Design, Lifestyle. Available online at: https://www.v2com-newswire.com/en/newsroom/categories/institutional-architecture/press-kits/7096-01/novartis-pavillon-zero-energy-media-facade (accessed on 17 May 2025).
Soft House: Adaptive PV textile membrane shading of IBA Soft House. Photo credit: Research profile via ResearchGate. Available online at: https://www.researchgate.net/profile/Ahmet-Orhon?_tp=eyJjb250ZXh0Ijp7ImZpcnN0UGFnZSI6Il9kaXJlY3QiLCJwYWdlIjoicHVibGljYXRpb24ifX0 (accessed on 17 May 2025).
Al-Bahr Towers: Double skin façade of the Al-Bahr Tower in the UAE. Photo credit: Applying Zero Carbon Architecture Strategies to Mitigate Climate Change in the Middle East and North Africa (MENA), uploaded by Mahsa Ghamkhar. Available online at: https://www.researchgate.net/publication/314243450_Applying_Zero_Carbon_Architecture_Strategies_to_Mitigate_Climate_Change_in_the_Middle_East_and_North_Africa_MENA/figures?lo=1 (accessed on 17 May 2025).
GSW Headquarters: Adaptive façade system. Photo credit: GSW | artursalisz. Available online at: http://www.artursalisz.com/gsw/ (accessed on 17 May 2025).
Freiburg Town Hall: Solar modules for the new City Hall of Freiburg. Photo credit: A2-Solar. Available online at: https://a2-solar.com/en/new-city-hall-of-freiburg/ (accessed on 17 May 2025).
Solar Ivy: Biomimetic photovoltaic system. Photo credit: Innovations: The leaf as a solar panel?—All around the Planet. Available online at: https://www.runforplanet.org/2023/07/09/innovations-the-leaf-as-a-solar-panel/ (accessed on 17 May 2025).
Kiefer Technic Showroom: Kinetic façade system. Photo credit: Kiefer Technic Showroom/Ernst Giselbrecht + Partner|ArchDaily. Available online at: https://www.archdaily.com/89270/kiefer-technic-showroom-ernst-giselbrecht-partner (accessed on 17 May 2025).
Institute du Monde Arabe: Adaptive screen system. Photo credit: The museum of the Arab World Institute (IMA), www.archipicture.eu—Jean Nouvel—Institut du Monde Arabe. Available online at: http://www.archipicture.eu/Architekten/Frankreich/Nouvel%20Jean/Nouvel%20Jean%20-%20Institut%20Du%20Monde%20Arabe%201.html (accessed on 17 May 2025).
Swiss Tech Convention Center: Customizable photovoltaic panels. Photo credit: The Swisstech Convention Center on the EPFL campus near Lausanne, which was designed by Richter Dahl Rocha & Associés. Available online at: https://dominikgehl.com/architects-rdr-architectes (accessed on 17 May 2025).
Pittsburgh Children’s Museum: Wind-responsive passive fins. Photo credit: Children’s Museum of Pittsburgh—Koning Eizenberg Architecture. Available online at: https://www.kearch.com/childrens-museum-of-pittsburgh (accessed on 17 May 2025).
Zurich Airport: Perforated metal rotating louvers. Photo credit: A Model for Measuring Airport Competitiveness: The Case of Zurich Airport, uploaded by Erik Linden. Available online at: https://www.researchgate.net/publication/321462979_A_Model_for_Measuring_Airport_Competitiveness_The_Case_of_Zurich_Airport/figures (accessed on 17 May 2025).
Appendix C
Videos about the movement of the six shading device designs for the South façade in the different seasons: link https://drive.google.com/drive/folders/1sGCPVizRwLbo4FSjJBTp_4-OSyecEcih?usp=sharing (accessed on 17 May 2025).
References
- IEA. CO2 Emissions in 2022; IEA: Paris, France, 2023; Available online: https://www.iea.org/reports/co2-emissions-in-2022 (accessed on 17 May 2025).
- Barozzi, M.; Lienhard, J.; Zanelli, A.; Monticelli, C. The Sustainability of Adaptive Envelopes: Developments of Kinetic Architecture. Procedia Eng. 2016, 155, 275–284. [Google Scholar] [CrossRef]
- European Solar Shading Organization (ES-SO). Energy Saving and CO2 Reduction Potential from Solar Shading Systems and Shutters in the EU-25 (ESCORP-EU25); ES-SO: Brussels, Belgium, 2006; Available online: https://bvst.at/images/pdfs/ESCORP-EU25.pdf (accessed on 17 May 2025).
- Evola, G.; Gullo, F.; Marletta, L. The Role of Shading Devices to Improve Thermal and Visual Comfort in Existing Glazed Buildings. Energy Procedia 2017, 134, 346–355. [Google Scholar] [CrossRef]
- Skoplaki, E.; Palyvos, J.A. On the Temperature Dependence of Photovoltaic Module Electrical Performance: A Review of Efficiency/Power Correlations. Sol. Energy 2009, 83, 614–624. [Google Scholar] [CrossRef]
- Al-Masrani, S.M.; Al-Obaidi, K.M. Dynamic Shading Systems: A Review of Design Parameters, Platforms and Evaluation Strategies. Autom. Constr. 2019, 102, 195–216. [Google Scholar] [CrossRef]
- Nagy, Z.; Svetozarevic, B.; Jayathissa, P.; Begle, M.; Hofer, J.; Lydon, G.; Willmann, A.; Schlueter, A. The Adaptive Solar Facade: From Concept to Prototypes. Front. Archit. Res. 2016, 5, 143–156. [Google Scholar] [CrossRef]
- Hraska, J. Adaptive Solar Shading of Buildings. Int. Rev. Appl. Sci. Eng. 2018, 9, 107–113. [Google Scholar] [CrossRef]
- Hasselaar, B.L.H. Climate Adaptive Skins: Towards the New Energy-Efficient Façade. In Proceedings of the Management of Natural Resources, Sustainable Development and Ecological Hazards, Bariloche, Argentina, 22 November 2006; WIT Press: Bariloche, Argentina, 2006; Volume I, pp. 351–360. [Google Scholar]
- Loonen, R.C.G.M.; Trčka, M.; Cóstola, D.; Hensen, J.L.M. Climate Adaptive Building Shells: State-of-the-Art and Future Challenges. Renew. Sustain. Energy Rev. 2013, 25, 483–493. [Google Scholar] [CrossRef]
- Milne, M.; Liggett, R. Climate Consultant 6.0: Visualizing Building Energy Climate Data; UCLA Energy Design Tools: Los Angeles, CA, USA, 2016; Available online: www.sbse.org (accessed on 20 July 2025).
- Loonen, R.C.G.M.; Favoino, F.; Hensen, J.L.M.; Overend, M. Review of Current Status, Requirements and Opportunities for Building Performance Simulation of Adaptive Facades. J. Build. Perform. Simul. 2017, 10, 205–223. [Google Scholar] [CrossRef]
- McNeel, R.; Robert McNeel & Associates. Rhinoceros 3D, Version 6.0; Robert McNeel & Associates: Seattle, WA, USA, 2010. Available online: https://www.rhino3d.com/ (accessed on 17 May 2025).
- Rutten, D. Grasshopper–Algorithmic Modeling for Rhino; Robert McNeel & Associates: Seattle, WA, USA, 2017; Available online: https://www.grasshopper3d.com/ (accessed on 20 July 2025).
- Solemma LLC. ClimateStudio [Computer Software]. Available online: https://www.solemma.com/ (accessed on 20 July 2025).
- Roudsari, M.; Pak, M.; Smith, A. Ladybug Tools [Computer Software]. Available online: https://www.ladybug.tools/ (accessed on 20 July 2025).
- Fanger, P.O. Thermal Comfort: Analysis and Applications in Environmental Engineering; McGraw-Hill: Copenhagen, Denmark, 1970. [Google Scholar]
- Wienold, J.; Christoffersen, J. Evaluation Methods and Development of a New Glare Prediction Model for Daylight Environments with the Use of CCD Cameras. Energy Build. 2006, 38, 743–757. [Google Scholar] [CrossRef]
- Voss, K.; Hendel, S.; Stark, M. Solar Decathlon Europe–A Review on the Energy Engineering of Experimental Solar Powered Houses. Energy Build. 2021, 251, 111336. [Google Scholar] [CrossRef]
- Bonomo, P.; Frontini, F.; Loonen, R.; Reinders, A.H.M.E. Comprehensive Review and State of Play in the Use of Photovoltaics in Buildings. Energy Build. 2024, 323, 114737. [Google Scholar] [CrossRef]
- Kennedy & Violich Architecture. Soft House Project: IBA Internationale Bauausstellung Hamburg; Kennedy & Violich Architecture: Boston, MA, USA, 2013; Available online: https://www.kvarch.net/projects/iba-soft-house (accessed on 20 July 2025).
- Hameedaldeen, K.A.; Mostafa, A.O.M.S. Adaptive Façades’ Technologies to Enhance Building Energy Performance and More.; Scholarworks@UAEU: Abu Dhabi, United Arab Emirates, 2022. [Google Scholar]
- Wigginton, M.; Harris, J. Intelligent Skins, 1st ed.; Routledge: Abingdon, UK, 2002. [Google Scholar] [CrossRef]
- Réhault, N.; Engelmann, P.; Lämmle, M.; Munzinger, L. New Town Hall in Freiburg (D): Concept, Performance and Energy Balance after the First Year of Monitoring of a Large Net plus-Energy Building. IOP Conf. Ser. Earth Environ. Sci. 2019, 352, 012003. [Google Scholar] [CrossRef]
- Tashakori, M. Design of a Computer Controlled Sun-Tracking Façade Model. Master’s Thesis, The Pennsylvania State University, University Park, PA, USA, 2014. [Google Scholar]
- Al-Masrani, S.M.; Al-Obaidi, K.M.; Zalin, N.A.; Isma, M.I.A. Design Optimization of Solar Shading Systems for Tropical Office Buildings: Challenges and Future Trends. Sol. Energy 2018, 170, 849–872. [Google Scholar] [CrossRef]
- Winstanley, T. AD Classics: Institut du Monde Arabe., Archdaily.com, Jan. 28, 2018, [Online]. Available online: https://www.archdaily.com/162101/ad-classics-institut-du-monde-arabe-jean-nouvel (accessed on 20 July 2025).
- Barraud, E. Stained Glass Solar Windows for the Swiss Tech Convention Center. Chimia 2013, 67, 181. [Google Scholar] [CrossRef]
- Alotaibi, F. The Role of Kinetic Envelopes to Improve Energy Performance in Buildings. J. Archit. Eng. Technol. 2015, 4, 3. [Google Scholar] [CrossRef]
- Al Dakheel, J.; Tabet Aoul, K. Building Applications, Opportunities and Challenges of Active Shading Systems: A State-of-the-Art Review. Energies 2017, 10, 1672. [Google Scholar] [CrossRef]
- Brzezicki, M. A Systematic Review of the Most Recent Concepts in Kinetic Shading Systems with a Focus on Biomimetics: A Motion/Deformation Analysis. Sustainability 2024, 16, 5697. [Google Scholar] [CrossRef]
- Sharma, S.; Tahir, A.; Reddy, K.S.; Mallick, T.K. Performance Enhancement of a Building-Integrated Concentrating Photovoltaic System Using Phase Change Material. Solar Energy Mater. Sol. Cells 2016, 149, 29–39. [Google Scholar] [CrossRef]
- Green, M.A.; Dunlop, E.D.; Yoshita, M.; Kopidakis, N.; Bothe, K.; Siefer, G.; Hao, X. Solar Cell Efficiency Tables (Version 63). Prog. Photovolt. 2024, 32, 3–13. [Google Scholar] [CrossRef]
- Verayiah, R.; Iyadurai, A. A Comparison Study on Types of PV for Grid Connected Photovoltaic Power. Indones. J. Electr. Eng. Comput. Sci. 2017, 6, 349. [Google Scholar] [CrossRef]
- Usta, Y.; Montazeri, A.; Mutani, G. Feasibility analysis of integrating solar thermal technologies into district heating network with urban building energy modeling. Energy Build. 2025, 338, 115661. [Google Scholar] [CrossRef]
- Muhy Al-Din, S.S.; Ahmad Nia, H.; Rahbarianyazd, R. Enhancing Sustainability in Building Design: Hybrid Approaches for Evaluating the Impact of Building Orientation on Thermal Comfort in Semi-Arid Climates. Sustainability 2023, 15, 15180. [Google Scholar] [CrossRef]
- ISO 7730:2005; Ergonomics of the Thermal Environment—Analytical Determination and Interpretation of Thermal Comfort Using PMV and PPD Indices. ISO: Geneva, Switzerland, 2005.
- ASHRAE. ANSI/ASHRAE Addendum a to ANSI/ASHRAE Standard 55-2020: Thermal Environmental Conditions for Human Occupancy; American Society of Heating, Refrigerating and Air-Conditioning Engineers: Peachtree Corners, GA, USA, 2021. [Google Scholar]
- Mardaljevic, J. Daylight Simulation: Validation, Sky Models and Daylight Coefficients; De Montfort University: Leicester, UK, 1999. [Google Scholar]
- Geisler-Moroder, D.; Knoflach, C. Critical review of the daylight glare probability and proposal for modification for improved evaluation of small glare sources. Light. Res. Technol. 2025. [Google Scholar] [CrossRef]
- Global Solar Atlas. Solar Resource Data for Oslo, Norway; World Bank Group: Washington, DC, USA, 2024; Available online: https://globalsolaratlas.info/map?c=59.913333,10.738889,11&s=59.913333,10.738889 (accessed on 17 May 2025).
- Global Solar Atlas. Solar Resource Data for New Mexico, USA; World Bank Group: Washington, DC, USA, 2024; Available online: https://globalsolaratlas.info/map?c=34.580207,-105.996047,8&s=34.580207,-105.996047 (accessed on 17 May 2025).
- Global Solar Atlas. Solar Resource Data for Turin, Italy; World Bank Group: Washington, DC, USA, 2024; Available online: https://globalsolaratlas.info/map?c=45.067755,7.682489,11&s=45.067755,7.682489 (accessed on 17 May 2025).
- Brager, G.S.; De Dear, R.J. Thermal Adaptation in the Built Environment: A Literature Review. Energy Build. 1998, 27, 83–96. [Google Scholar] [CrossRef]
- Eiffert, P. Guidelines for the Economic Evaluation of Building-Integrated Photovoltaic Power Systems; National Renewable Energy Lab. (NREL): Golden, CO, USA, 2003; p. NREL/TP-550-31977, 15003041. [Google Scholar]
- Mutani, G.; Todeschi, V. Optimization of Costs and Self-Sufficiency for Roof Integrated Photovoltaic Technologies on Residential Buildings. Energies 2021, 14, 4018. [Google Scholar] [CrossRef]
- IEA-PVPS. Trends in Photovoltaic Applications 2024: Survey Report of Selected IEA Countries Between 1992 and 2023; Masson, G., de l’Epine, M., Kaizuka, I., Eds.; Becquerel Institute: Brussels, Belgium, 2024; ISBN 978-3-907281-68-0. Available online: https://iea-pvps.org/ (accessed on 10 May 2025).
Disclaimer/Publisher’s Note: The statements, opinions and data contained in all publications are solely those of the individual author(s) and contributor(s) and not of MDPI and/or the editor(s). MDPI and/or the editor(s) disclaim responsibility for any injury to people or property resulting from any ideas, methods, instructions or products referred to in the content. |
© 2025 by the authors. Licensee MDPI, Basel, Switzerland. This article is an open access article distributed under the terms and conditions of the Creative Commons Attribution (CC BY) license (https://creativecommons.org/licenses/by/4.0/).


