Article

Nonlinear Heat Effects of Building Material Stock in Chinese Megacities

1
College of Grassland Science and Technology, China Agricultural University, Beijing 100083, China
2
School of Geographical Sciences, Hunan Normal University, Changsha 410081, China
3
Chongqing Geological and Mineral Surveying and Mapping Institute, Chongqing 400021, China
*
Author to whom correspondence should be addressed.
Smart Cities 2025, 8(4), 119; https://doi.org/10.3390/smartcities8040119
Submission received: 17 May 2025 / Revised: 30 June 2025 / Accepted: 2 July 2025 / Published: 17 July 2025

Abstract

Highlights

What are the main findings?
  • The BMS of eight Chinese megacities in China is 9,175.07 Mt.
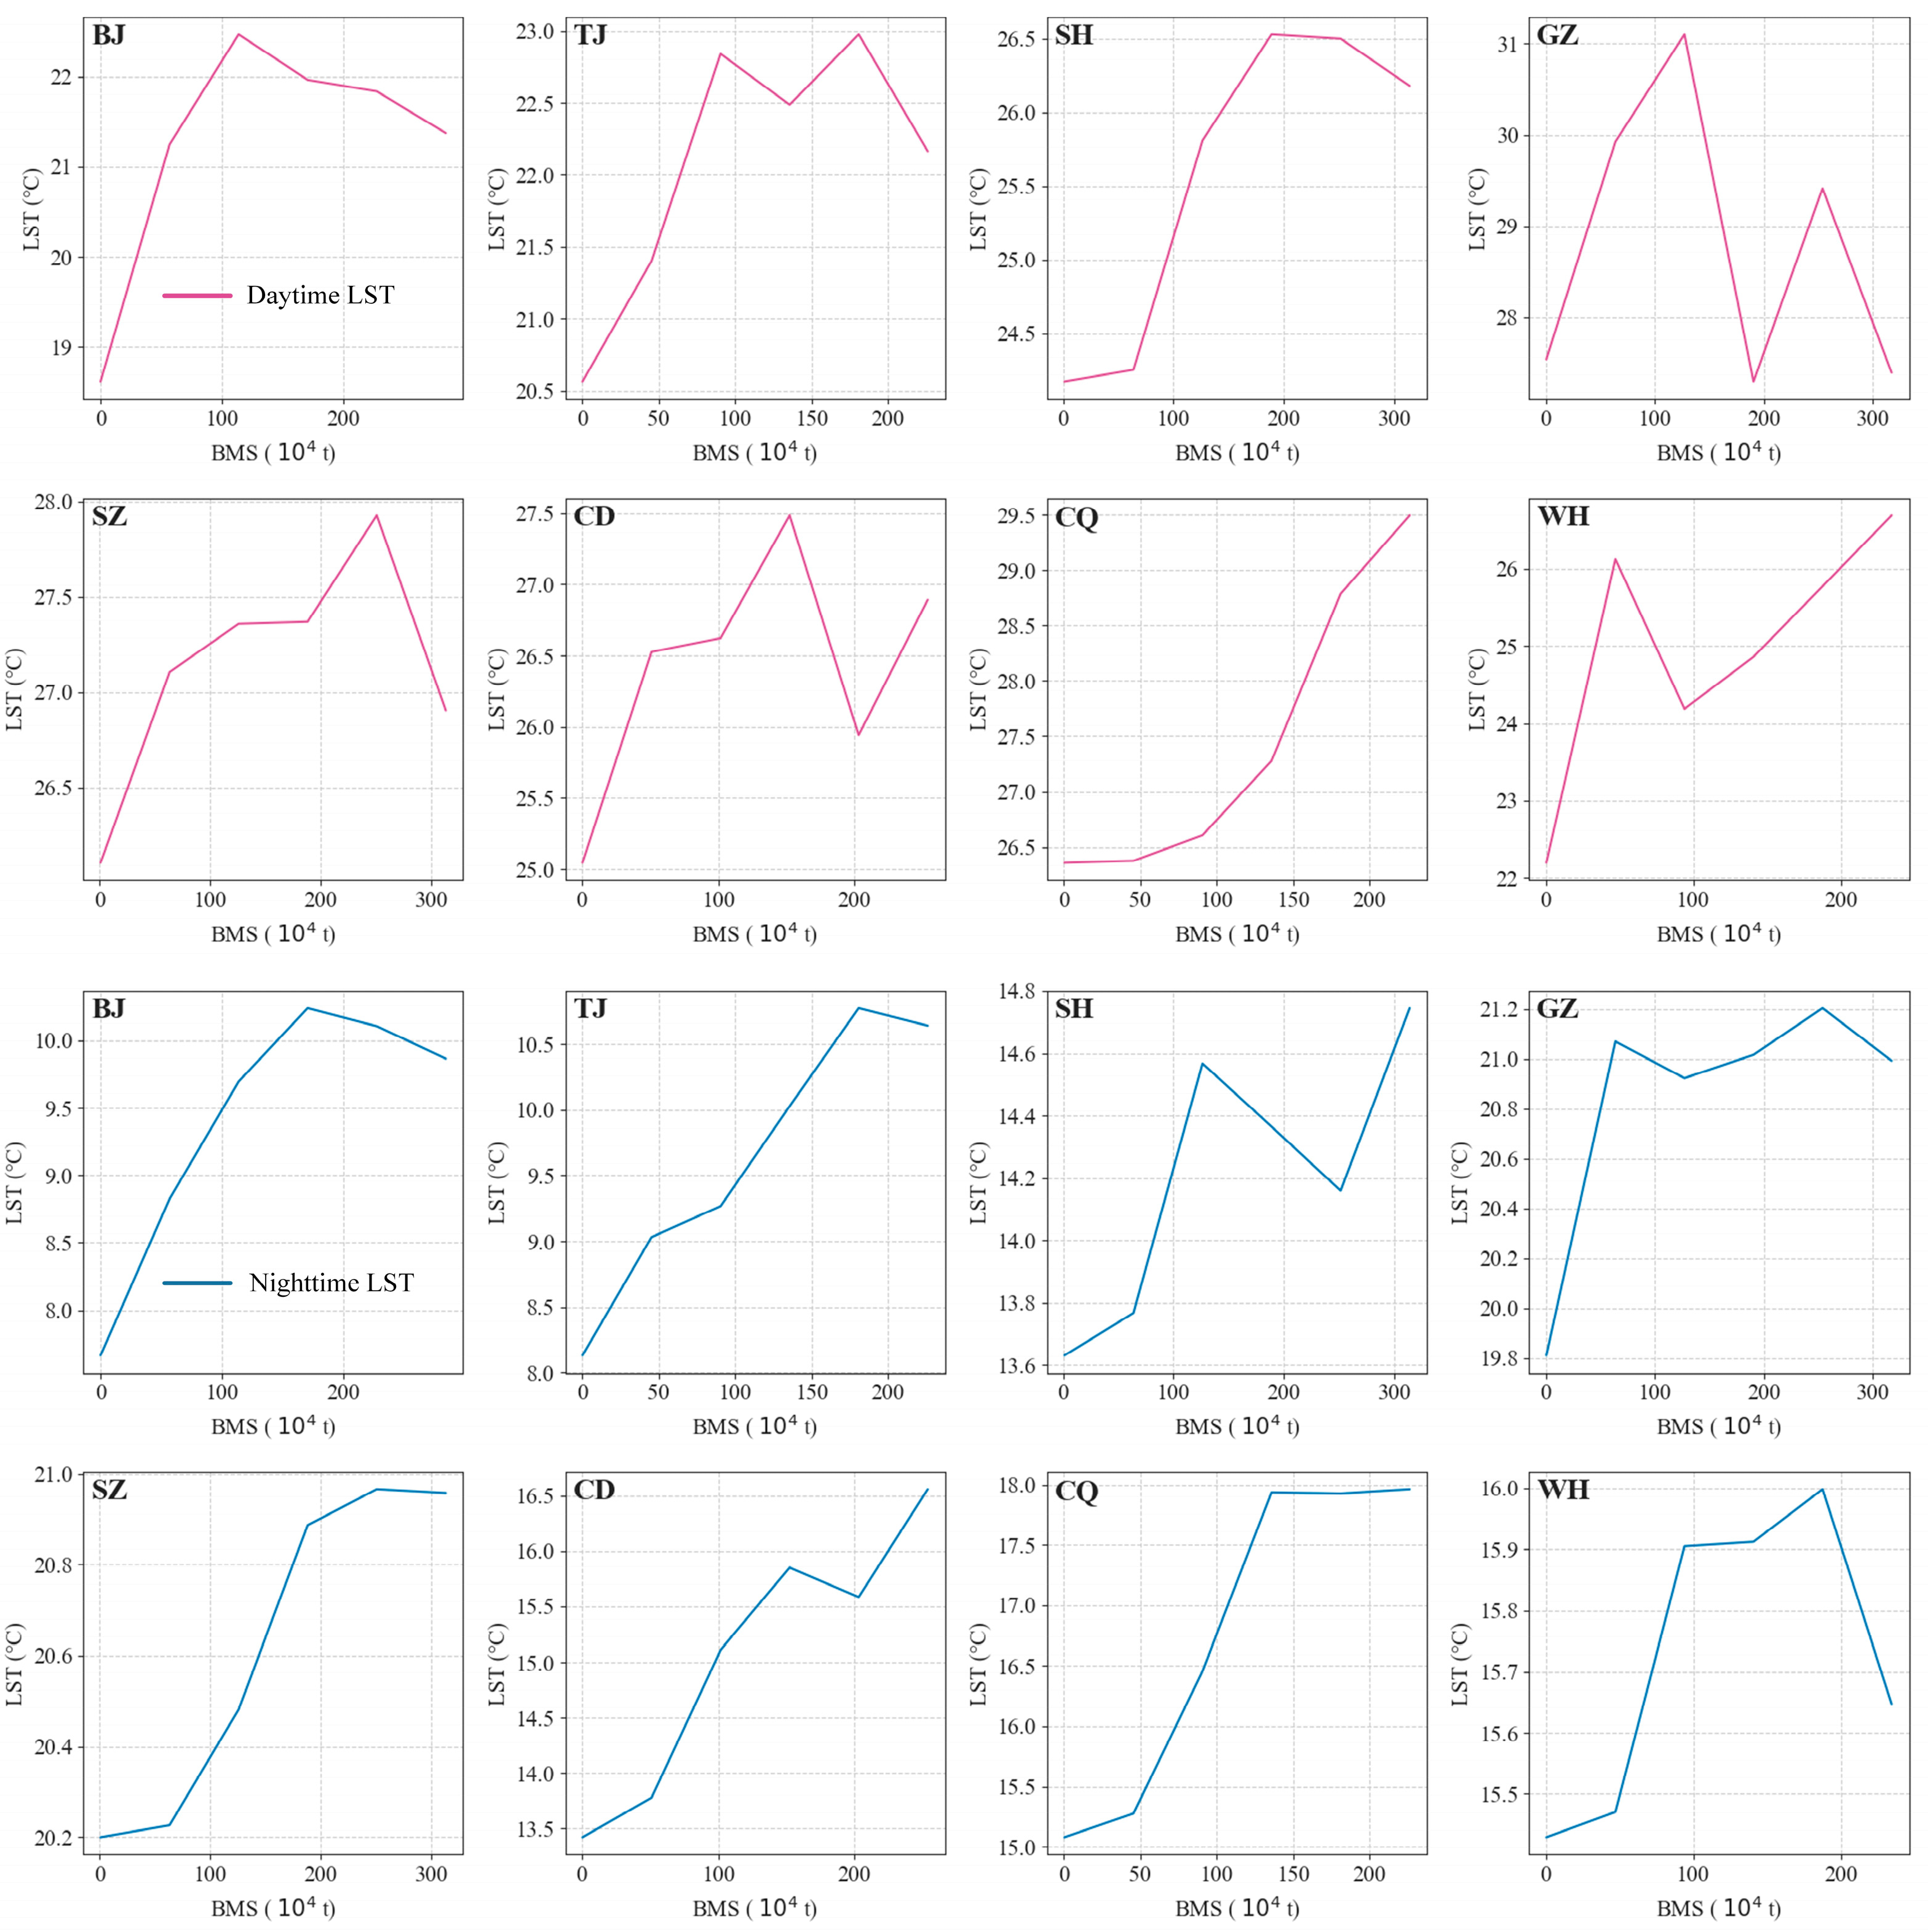
  • Nonlinear relationship exists between BMS and LST especially at nighttime.
  • Building height leads the nonlinear relationship exists between BMS and LST.
What is the implication of the main finding?
  • Optimize building forms to achieve heat mitigation in areas with high BMS.

Abstract

Urbanization is accompanied by an increased use of building materials. However, the lack of high-resolution building material stock (BMS) maps limits our understanding of the relationship between BMS and urban heat. To address this, we estimated BMS across eight typical Chinese megacities using multi-source geographic data and investigated the relationship between BMS and land surface temperature (LST). The results showed that (1) the total BMS for the eight megacities was 9175.07 Mt, with Beijing and Shanghai having the largest shares. While BMS correlated significantly with population, growth patterns varied across cities. (2) Spatial autocorrelation between BMS and LST was evident. Around 16% of urban areas exhibited High–High clustering between BMS and LST, decreasing to 10% during the daytime. The relationship between BMS and LST is nonlinear, and also prominent at night, especially in Beijing. (3) Diverse building forms, especially building height, contribute to a nonlinear relationship between BMS and LST.

1. Introduction

Land surface temperature (LST) served as a crucial indicator reflecting the urban environment [1], because excessive LST not only negatively impacted human health [2], air quality [3], urban infrastructure [4], and energy consumption [5] but also exacerbated the urban heat island (UHI) effect, posing great threats to sustainable development goals (SDGs) [6]. Moreover, with the ongoing rise in urban population and impending climate change, LST was foreseen to undergo more intense and frequent warming processes in the future [7,8], potentially adversely affecting human society. Therefore, investigating the potential influencing factors of LST held great significance for improving the urban heat environment and sustainable urban development.
Urban landscapes were predominantly shaped by buildings, leading to extensive building material consumption and significant impacts on the urban heat environment [9,10,11]. At present, the building area spanned 291,577 km2, with a total volume of 1632 km3 globally [12], and the building materials consumed solely for residential land has exceeded 12 Gt [13]. More importantly, 42% of global carbon emissions stemmed from buildings, and it was projected that between 2020 and 2060, carbon emissions associated with building material stock (BMS) would increase by 3.5 to 4.6 Gt of CO2 equivalent annually [14]. Therefore, BMS exerted great influences on climate change [15,16,17]. Furthermore, in the foreseeable decades, both the population and urban areas were expected to continue expanding, inevitably leading to a large demand for building materials in the future [18,19]. Therefore, conducting an analysis of the relationship between BMS and LST would be beneficial for urban heat mitigation and climate change adaption.
In recent years, the role of BMS in influencing LST has received growing attention, resulting in significant research progress [20,21]. The thermophysical properties of building materials—such as thermal conductivity, specific heat capacity, and thermal inertia—are widely recognized as critical factors influencing LST [22,23,24]. Consequently, with increasing focus on climate-adaptive urban planning, research has increasingly emphasized material-based strategies—such as replacing conventional materials and enhancing surface albedo with cool roofs—to regulate urban thermal environments [25,26]. In addition, the composition and spatial characteristics of different types of BMS would also affect urban ventilation, thermal radiation, and heat conduction processes, resulting in diverse spatial distributions of LST at local scale [27,28,29], underscoring the importance of optimizing BMS to mitigate urban heat stress.
While scholars acknowledged the impact of BMS on LST and suggested that integrating BMS into urban climate research could yield novel insights into urban heat environment [30,31], it was important to note that the research was still in its nascent stages. This could be attributed to the absence of high-resolution BMS estimation, which not only required detailed building data, but also information such as the building age, structure, and functions. However, this information was difficult to obtain from statistical data [32,33]. Thanks to the development of big data, the internet not only provided detailed building data but also contained detailed information such as building age, building structure [34]. These refined datasets facilitated the accurate estimation of high-resolution BMS maps and offered great opportunities for exploring the relationship between BMS and LST [35,36]. Although the influencing factors of LST have been extensively studied, most existing research has focused on daytime conditions [37,38], with relatively limited attention given to nighttime LST [39,40], particularly regarding how the existing building stock affects it. However, recent studies suggest that nighttime heat may also pose threats to urban residents and it often goes unnoticed [41]. Furthermore, while current research has acknowledged the impact of building forms on LST [42,43], buildings with comparable BMS values can still exhibit significant morphological differences, which in turn lead to variations in LST; however, our understanding about this remains limited. Therefore, it is necessary to examine how variations in BMS under different building forms influence LST. Such analysis is crucial for mitigating urban heat and promoting sustainable urban development.
To address these shortcomings, we selected eight megacities (Beijing, Tianjin, Shanghai, Guangzhou, Shenzhen, Chengdu, Chongqing, Wuhan) in China as our research areas. By integrating multi-source geographic data, we employed a bottom-up approach to estimate the BMS of ten types of materials (steel, wood, cement, brick, sand, gravel, lime, glass, linoleum, and asphalt) in these cities at high-resolution, and analyzed the relationship between BMS and LST during daytime and nighttime. Based on this, we examined how changes in BMS associated with varying building forms affect LST. Therefore, the objectives of this study were (1) to calculate the BMS of eight Chinese megacities; (2) to analyze the spatiotemporal relationship between BMS and LST; and (3) to examine the influence of building form on the nonlinear relationship between BMS and LST. We aimed to provide new insights into the relationship between BMS and LST and to support the regulation of urban heat environments in Chinese megacities.

2. Materials and Methods

2.1. Study Area

We selected eight representative megacities as our study areas in this research, including Beijing (BJ), Tianjin (TJ), Shanghai (SH), Guangzhou (GZ), Shenzhen (SZ), Chengdu (CD), Chongqing (CQ), and Wuhan (WH) (Figure 1). According to the 2024 China City Statistical Year Book (https://www.stats.gov.cn/ (accessed on 1 July 2024)), total populations of these megacities reached 140 million, accounting for approximately 10% of China’s population in 2023. The built-up area covered 9586 km2 with a total building volume of 55 million km3, with Beijing (12.81 million km3) and Shanghai (12.07 million km3) having the highest volumes according to their building data (collected from Baidu Map API (https://lbsyun.baidu.com/ (accessed on 7 June 2024))). This high concentration of building materials has led to severe urban heat island effects. Additionally, all these megacities experience a monsoon climate characterized by hot summers. Therefore, the combination of urban heat island effects and hot summers exacerbates high temperatures in these areas. Considering their locations, the selection of these megacities spans eastern (Beijing, Tianjin, Shanghai, Guangzhou, Shenzhen), central (Wuhan), and western China (Chengdu, Chongqing), including both southern (Shanghai, Guangzhou, Shenzhen, Chengdu, Chongqing, Wuhan) and northern (Beijing, Tianjin) regions, ensuring the generalizability and applicability of our research findings across different cities.

2.2. Research Framework

Our research consisted of three main steps: 1. Estimating BMS of Chinese megacities. In this step, we employed multi-source geographic data to collect detailed building information for megacities, including building height, building area, building function, building age, and building structure. Combining detailed building information with building material intensity inventory, we adopted a bottom-up approach to estimate the BMS of Chinese megacities. 2. Investigating the relationship between BMS and LST. Utilizing Google Earth Engine, we retrieved average summer LST maps in 2020 from the MOD11A1 product, which included both daytime and nighttime LST. Subsequently, we analyzed the relationship between BMS and LST through partial dependence plots and local binary spatial autocorrelation methods. 3. Exploring the influence of building morphology on the relationship between BMS and LST. Building density and building height were used as key morphological indicators to analyze the combined effects of building form and BMS on LST, thereby clarifying the complex interactions between BMS and LST.

2.3. Data Source

2.3.1. Detailed Building Information

In addition to the impact of building area and building height on its material consumption, the building’s function, structure, and age also play significant roles [36]. However, detailed building information is often challenging to extract from statistical data. Therefore, we utilized multi-source geographic data to gather this comprehensive building information. In summary, the detailed building data utilized in this study primarily encompass the following aspects:
Building data: We crawled the building data through crawler technology and the Baidu Map API. This building data recorded the building coordinates, shape, and height, enabling the estimation of building area and building height. In this research, we have collected more than 2 million building data for these selected cities.
Building function: EULUC data were combined with building data to identify building function. EULUC data were the first set of urban land functional classification map in China, which divided Chinese urban land into residential land, commercial land, industrial land, and public management land [44]. We identified the building function by spatially integrating EULUC data with building data using ArcGIS.
Building age and building structure: We obtained detailed building information from two of the most popular real estate information trading websites in China, namely Lianjia and Anjuke. This detailed building information included building age, building structure (such as brick concrete or steel concrete), latitude, and longitude of numerous residential and commercial buildings within megacities. Using ArcGIS, we estimated the building age and structure for each building through spatial analysis.

2.3.2. MODIS Product

Two sets of MODIS products were used in our research. First, we employed GEE to calculate the 2020 average summer LST (June to September) maps from both daytime and nighttime using MYD11A1 dataset. The MOD11A1 LST product has a spatial resolution of 1 km and overpasses at 13:30 and 1:30 local time, providing higher temporal and spatial resolution that captures LST variations well. Additionally, we used MOD13A1 16-Day NDVI (Normalized Difference Vegetation Index) products to compute the summer average NDVI for eight megacities in 2020. This was completed to analyze the impact of NDVI on the relationship between BMS and LST, as detailed in Section 4.1. The spatial resolution of NDVI product is 500 m, and we resampled the NDVI to 1 km × 1 km using ArcGIS Pro software.

2.3.3. Population Data

In this study, two sets of population data products were also utilized. Firstly, we obtained the population data of China at a resolution of 100 m from the WorldPop website during 2020 to analyze the impact of population on BMS.
Table 1 shows the data used in this study.

2.4. Methods

2.4.1. Building Material Stock Estimation and Validation

Combining the detailed building information with the Chinese building materials intensity inventory [45], we calculated the BMS of these megacities, including steel, wood, cement, brick, sand, gravel, lime, glass, linoleum, and asphalt, and the total BMS was calculated as Formula (1). To analyze the relationship between BMS and LST, this paper generated grids of each megacity with a resolution of 1 km × 1 km, intersecting them with the calculated BMS to obtain a grid-scale map of BMS.
B M S = i = 1 n S t o c k i
Here, B M S is the total building material stock of different megacities, measured in megatons (Mt), S t o c k i is the stock of different types of building material.
To validate the accuracy of building material stock estimation, we selected Beijing as the verification area and focused on steel stock as the subject for validation. We compared the building material stock estimation results in this research with other findings [46] at grid scale. The study results demonstrate a strong correlation at the grid scale between them (R2 = 0.80, more detailed information see SI), indicating that our building material stock estimation results are reliable.

2.4.2. Building Form Indicators

To examine the influence of building form on the relationship between BMS and LST, we delineated the urban areas of the city and overlaid them with a 1 km × 1 km grid. This grid was then intersected with building data to extract building information within each grid. Based on these data, we calculated the building height and building density [47] for each grid cell using Equations (2) and (3), respectively.
B H = i = 1 n B S i   *   B H i i = 1 n B S i
B S F = i = 1 n B S i S
where BH represents building height, BSF denotes building density, BSi is the footprint area of the i-th building within a given grid, BHi is its height, and n is the number of buildings within the grid, S is the area of each grid.

2.4.3. The Relationship Between BMS and LST

(1)
Partial dependence plots
We hired partial dependence plots to analyze the relationship between BMS and LST using a scikit-learn package in Python 3.10 [48]. Partial dependence plots displayed the marginal effect of one predictor on the response variable while holding all other predictors constant. If the plot sloped upwards from left to right, it indicated that an increase in the predictor’s value correlated with an increase in the model’s prediction of the target variable; conversely, a downward slope suggested a decrease. The slope of the plot reflected the marginal effect of the predictor on the target variable. A positive slope indicated that increasing the predictor’s value increased the model’s prediction, while a negative slope indicated the opposite. A flat slope suggested no marginal effect of the predictor on the model’s prediction. Additionally, to assess model accuracy, we split 20% of each city’s building stock data into the test set and 80% into the training set for evaluation.
(2)
Local bivariate spatial autocorrelation
We identified the spatial correlation between BMS and LST within Chinese megacities by employing bivariate spatial autocorrelation technology in Geoda software [49]. Bivariate spatial autocorrelation served as a method to delineate the spatial correlation and dependency features between two geographic attributes. There were two types of bivariate spatial autocorrelation: global bivariate Moran’s I index and local bivariate Moran’s I index. The global bivariate Moran’s I index was utilized to scrutinize the overall spatial distribution correlation between the two variables. Specifically, it assessed the spatial correlation characteristics between the independent variable of region i and the dependent variable of region j. The resulting patterns could be categorized into four types of agglomeration: H–H cluster (High–High) denoted that both the independent variable value of region i and the dependent variable value of region j were high, L–L cluster (Low–Low) indicated that both variables’ values were low, H–L cluster (High–Low) suggested that the independent variable value of region i was high while the dependent variable value of the adjacent region j was low, and L–H cluster (Low–High) signified that the independent variable value of region i was low while the dependent variable value of adjacent region j was high. The calculation method was outlined as follows:
I = n i = 1 n j = 1 n w i j ( x i x ˉ ) ( y j y ˉ )
where n is the number of regions, xi and yj are the independent and dependent values of regions i and i, respectively, x ˉ and y ˉ are the mean values of the independent and dependent variables, respectively, and w i j is the spatial weight between region i and region j.
The local bivariate Moran’s I index exponent calculated the local correlation between the independent variable of region i and the dependent variable of region j. Similarly, it can also be divided into four clusters of agglomeration: H–H, L–L, H–L, and L–H. If the BMS was taken as the independent variable and the LST was the dependent variable, then the H–H type in this study indicated that the BMS and LST of the region were high, the L–L type indicated that the BMS and LST of the region were low, the H–L type indicated that the BMS was high but the LST was low, and the L–H type indicated that the BMS was low but the LST was high. The local bivariate Moran’s I index can be calculated as follows:
I i = j = 1 n w i j ( x i x ˉ ) ( y j y ˉ ) j = 1 n w i j ( x i x ˉ ) 2 j = 1 n w i j ( y j y ˉ ) 2
Before conducting the local bivariate spatial autocorrelation, we constructed the spatial weights matrix using the Queen contiguity method [50]. Queen contiguity defines two polygon units as neighbors if they share either a boundary or a corner point. For regular grid data, this means that each unit is considered adjacent to all eight surrounding cells, including those along the diagonals. This approach captures spatial relationships in horizontal, vertical, and diagonal directions, offering a more comprehensive representation of spatial dependence.

3. Results

3.1. The BMS in Chinese Megacities

Analyzing building material stock (BMS) across eight Chinese megacities for ten material types revealed a total stock of 9175.07 Mt (Figure 2a). Sand, gravel, and brick emerged as dominant building materials in these megacities, each exceeding 2000 Mt and contributing approximately 81% to the total stock, with sand alone amounting to 3157.15 Mt (Figure 2a). As for cities, Beijing and Shanghai held the largest shares, comprising nearly 50% of the total, with 2324.23 Mt and 2178.67 Mt, respectively, at 1.9 to 5.4 times higher than other cities, as they had the largest share of building volume in these cities. However, the building material stock density per unit area (BMSDA) of Chongqing surpassed that of other cities, exceeding 1.2 Mt/km2, and the average BMSDA of these cities was less than 1.0 Mt/km2 (Figure 2b). This disparity may be because Chongqing was a mountain city characterized by numerous high-rise buildings [47]. When considering urban population, the building material stock density per person (BMSDP) of Beijing exceeded 100 Mt/104 people (Figure 2c), while the average BMSDP of all cities was only 62 Mt/104 people. More importantly, a significant and positive linear correlation between BMS and population in each megacity was observed (SI-Figure S4), indicating that urban population growth would increase substantial BMS demand. However, regional variations in BMS and population growth within each megacity were evident. The BMS growth in Chongqing, Wuhan, and Guangzhou matched the pace of population growth, whereas in Chengdu, population growth significantly outpaced BMS growth. In Tianjin and Beijing, BMS growth lagged behind population growth (Figure 2d). This finding suggested that while BMS was related to urban development, not all cities posed BMS fully compatible with their development levels.

3.2. The Spatiotemporal Relationship Between BMS and LST

We further examined the relationship between BMS and LST using partial dependence plots. The model yielded R2 values ranging from 0.11 to 0.57, with an average RMSE of 1.08 °C (SI-Table S1). More detailed, in almost all cities, an increase in BMS corresponded to an increase in LST, both during the daytime and nighttime. Interestingly, as BMS continued to increase, the rise in LST showed signs of plateauing or fluctuation (Figure 3). More importantly, the correlation between BMS and LST was substantially weaker in the linear model (average r = 0.16, SI-Table S2) compared to the random forest model (average r = 0.48, SI-Table S1). This suggested the gradual attenuation impacts of BMS on LST and indicated a nonlinear relationship between the two. However, the BMS turning points vary across different cities. For instance, the BMS turning point in Beijing ranges from 55.84 to 56.93 Mt, while that in Chongqing is between 135.87 and 180.98 Mt (SI-Table S3). In most megacities, the correlation coefficient between BMS and LST consistently demonstrated a stronger association at nighttime (average r = 0.56) compared to daytime (average r = 0.4). Beijing particularly exhibited a stronger correlation between BMS and nighttime LST compared to other cities (SI-Table S1).
Local bivariate spatial autocorrelation analysis revealed that across all megacities, approximately 10% of their urban areas exhibited a High–High cluster between BMS and LST during the daytime (SI-Table S4). Notably, this proportion increased to 16% at nighttime (Figure 4). Additionally, less than 4% of the urban area in all megacities displayed a High–Low cluster, regardless of the time of day. These findings suggested that a higher spatial concentration of BMS led to higher local LST. Furthermore, this effect was particularly pronounced at nighttime, as evidenced by the stronger global bivariate Moran’s I index observed at nighttime (for more detailed information, see SI). As for cities, in Shenzhen and Guangzhou, the proportion of areas exhibiting a High–High cluster during the daytime was less than 7%, significantly lower than other megacities. This suggested a weaker spatial correlation between BMS and LST here. Furthermore, the area exhibiting an High–High cluster across all megacities also increased at nighttime, particularly in Beijing, where the increase was 20%. This further corroborated the notion of a stronger spatial correlation between BMS and LST at nighttime.

3.3. The Influence of Building Form on the Nonlinear Relationship Between BMS and LST

Under the same BMS, higher building density (BSF) is typically associated with lower building height (BH), and vice versa. Since building form significantly influences LST, it likely plays an important role in shaping the relationship between BMS and LST. Therefore, we used two-way partial dependence plots to analyze this relationship, taking nighttime LST and steel stock as an example. The results showed that incorporating building form (i.e., BSF and BH) into the random forest regression model improved its performance, with R2 values ranging from 0.14 to 0.60 and RMSE reduced to 0.97 °C (SI-Table S4). More specifically, the joint effect of building density and BMS drove LST changes between 0.35 and 1.76 °C, with an average of 1.01 °C (Figure 5b). Notably, Beijing experienced the largest LST changes due to the joint effect of BMS and building density, while Guangzhou exhibited the smallest. Conversely, while holding density constant, increasing building height consistently reduced LST. The joint effect of BMS and building density caused LST changes between 0.27 and 3.15 °C, with an average of 1.41 °C (Figure 5c). Beijing again exhibited the largest change, while Guangzhou experienced the smallest. These findings indicated that while increased building density elevated LST under constant BMS, taller buildings conversely decreased it. Furthermore, the LST decrease induced by building height outweighed the LST increase caused by building density, leading to a nonlinear relationship between BMS and LST. Notably, the LST changes influenced by building height in Beijing and Tianjin significantly exceeded those in other cities, resulting in a more pronounced nonlinear relationship in Beijing and Tianjin.

4. Discussion

4.1. The Mechanism of How Building Material Stock Influences LST

Building material stock plays a critical role in regulating LST, primarily through the thermophysical properties and thermal inertia of building materials. Urban structures are commonly composed of materials such as concrete, steel, and glass, which possess high heat capacity and thermal conductivity. These materials absorb substantial amounts of solar radiation during the day and release the stored heat gradually, resulting in elevated surface temperatures (Figure 6). At night, the delayed release of accumulated heat limits temperature reductions, contributing to the persistence of the urban heat island effect [51,52]. In addition, the density and height of buildings alter the urban surface energy balance and airflow patterns, further influencing the accumulation and dissipation of heat [53]. Recent studies have emphasized the strong correlation between building material stock and the urban thermal environment. For example studies found that the heat capacity and thermal conductivity of urban structures significantly affect diurnal surface temperature variations in U.S. cities, particularly in high-density areas [54]. Similarly, some scholars stated that the heat storage characteristics of building materials are key contributors to the maintenance of nighttime heat islands in Chinese cities by using remote sensing data [55]. Therefore, understanding the thermal responses of building material stock is essential for optimizing urban thermal environments and formulating climate adaptation strategies.

4.2. Implications for Urban Planning

The observed positive correlation between BMS and LST, particularly at nighttime, where the average correlation reached r = 0.56, underscores the role of accumulated building materials in intensifying urban heat. For instance, Beijing exhibited the strongest nighttime BMS–LST correlation, with 20% of its urban area classified as a High–High spatial cluster. These findings highlight the need to manage BMS, especially in densely developed zones, as a long-term strategy for mitigating urban heat. In addition, partial dependence analysis revealed a nonlinear relationship between BMS and LST; the temperature initially increases with BMS but begins to plateau or fluctuate after certain thresholds. These thresholds differ by city, with BMS turning points ranging from 55.84–56.93 Mt in Beijing to 135.87–180.98 Mt in Chongqing. This suggests that beyond these city-specific limits, further material accumulation has diminishing thermal effects. Integrating these thresholds into planning can optimize material use while minimizing additional heat stress. Moreover, spatial clustering of high BMS and high LST values (i.e., High–High clustering) identifies localized urban heat island zones. These clusters were more pronounced at nighttime (16% of urban area) than daytime (10%), indicating heightened nighttime heat risk. Notably, cities like Shenzhen and Guangzhou had <7% High–High clusters during the day, while Beijing experienced a 20% increase in cluster area at night. Therefore, heat mitigation efforts should prioritize high-BMS areas with persistent nighttime heat, especially in cities with strong spatial coupling between BMS and LST. The interaction between building form and BMS further highlights a promising design-based intervention. While higher building density tends to exacerbate LST, increasing building height was found to reduce LST through shading, improved airflow, and greater surface-to-volume efficiency [56,57]. Specifically, in our model, taller buildings helped lower LST by up to 3.15 °C, with the average cooling effect exceeding that of the warming effect caused by density. These findings suggest that a strategic combination of vertical development and material management can serve as a passive climate adaptation strategy.

4.3. Advantages and Limitations in Our Research

One of the key strengths of this study lies in its broad spatial scope, covering eight representative Chinese megacities with diverse climatic, morphological, and development conditions. This comprehensive coverage enhances the generalizability of the findings within the context of China’s urbanization trajectory. In addition, a notable advantage is the integration of spatiotemporal analysis, particularly the differentiation between daytime and nighttime LST. This distinction highlights the disproportionate thermal impact of BMS at night, a time when heat stress can be more harmful and harder to detect, and thus, offers valuable implications for nighttime heat management. By analyzing building form interaction with BMS, this study sheds light on the synergistic or offsetting effects of form on urban temperature, suggesting that vertical urban forms may mitigate some of the heat impacts associated with dense material accumulation.
Despite these contributions, several limitations remain. First, BMS accuracy depends on the quality and resolution of building data and material coefficients. Data quality differences across cities may introduce uncertainty. Second, the analysis uses static building form data (height and density) from a single time point. This limits analysis of temporal changes in urban growth, redevelopment, or material transitions that affect BMS and LST. Third, other environmental and socioeconomic factors affecting LST, such as vegetation, albedo, anthropogenic heat, and income disparities, are not included. Future studies should integrate these to improve urban heat modeling.

5. Conclusions

We have estimated the total stocks of ten types of building materials across eight megacities in China. The total BMS of the eight megacities reached 9175.07 Mt, with sand, gravel, and brick accounting for 81% of the total stock. Beijing and Shanghai held the largest shares, comprising nearly 50% of the total stock. We observed a significant positive correlation between urban population and BMS. However, this trend was not uniform across all cities. Chengdu’s population growth significantly outpaced its BMS growth, while Tianjin and Beijing experienced slower BMS growth compared to their population increases. This study further analyzed the relationship between BMS and LST. Increased BMS raised LST, but this effect weakened as BMS increased, indicating a nonlinear relationship between the BMS and LST. The correlation between BMS and nighttime LST was stronger, especially in Beijing. During the daytime, around 10% of urban areas exhibited a High–High cluster between BMS and LST. This percentage increased to 16% at nighttime, indicating a stronger positive correlation during the night. We elucidated the underlying mechanism linking BMS and LST by incorporating the influence of building form. Increased building density led to higher LST, while increased building height led to lower LST. The combined effect of these two factors resulted in a significant nonlinear relationship between BMS and LST.

Supplementary Materials

The following supporting information can be downloaded at https://www.mdpi.com/article/10.3390/smartcities8040119/s1, Figure S1: The relationship of daytime LST between Landsat 8 OLI and MODIS; Figure S2: The validation of building height in our research; Figure S3: The validation of steel stock in our research; Figure S4: The scatter plot between BMS and population; Table S1: Validation of random forest model between BMS and LST; Table S2: Correlation coefficients between BMS and LST; Table S3: Turning points of BMS estimated by random forest model; Table S4: The global bivariate Moran’s I index between BMS and LST during daytime and nighttime in different megacities; Table S5: Validation of the random forest model between BMS and LST with consideration of building forms.

Author Contributions

Conceptualization, methodology, formal analysis, investigation, writing—original draft, and visualization: Y.Z. and L.L.; software: L.T.; validation: R.J.; writing—review and editing: L.L. and R.J.; supervision and funding acquisition: Y.Z. All authors have read and agreed to the published version of the manuscript.

Funding

This work was supported by the National Natural Science Foundation of China [42401325], Scientific Research Fund of Hunan Provincial Education Department [23B0048], the Changsha Natural Science Foundation [kq2402161] and the Natural Resources Department Dongting Lake Basin Ecological Protection and Restoration Engineering Technology Innovation Center Open Project Fund [DTB.TICECR-2024-09].

Data Availability Statement

The datasets generated and/or analyzed during the current study are available from the corresponding author on reasonable request.

Conflicts of Interest

The authors declare no conflicts of interest.

References

  1. Li, Z.; Tang, B.; Wu, H.; Ren, H.; Yan, G.; Wan, Z.; Trigo, I.F.; Sobrino, J.A. Satellite-derived land surface temperature: Current status and perspectives. Remote Sens. Environ. 2013, 131, 14–37. [Google Scholar] [CrossRef]
  2. Venter, Z.S.; Krog, N.H.; Barton, D.N. Linking green infrastructure to urban heat and human health risk mitigation in oslo, norway. Sci. Total Environ. 2020, 709, 136193. [Google Scholar] [CrossRef] [PubMed]
  3. Fuladlu, K.; Altan, H. Examining land surface temperature and relations with the major air pollutants: A remote sensing research in case of tehran. Urban Clim. 2021, 39, 100958. [Google Scholar] [CrossRef]
  4. Mishra, V.; Sadhu, A. Towards the effect of climate change in structural loads of urban infrastructure: A review. Sustain. Cities Soc. 2023, 89, 104352. [Google Scholar] [CrossRef]
  5. Wang, P.; Yu, P.; Lu, J.; Zhang, Y. The mediation effect of land surface temperature in the relationship between land use-cover change and energy consumption under seasonal variations. J. Clean. Prod. 2022, 340, 130804. [Google Scholar] [CrossRef]
  6. Huang, Q.; Huang, J.; Yang, X.; Fang, C.; Liang, Y. Quantifying the seasonal contribution of coupling urban land use types on urban heat island using land contribution index: A case study in wuhan, china. Sustain. Cities Soc. 2019, 44, 666–675. [Google Scholar] [CrossRef]
  7. Esha, E.J.; Rahman, M.T.U. Simulation of future land surface temperature under the scenario of climate change using remote sensing & gis techniques of northwestern rajshahi district, bangladesh. Environ. Chall. 2021, 5, 100365. [Google Scholar]
  8. Guo, L.; Di, L.; Zhang, C.; Lin, L.; Chen, F.; Molla, A. Evaluating contributions of urbanization and global climate change to urban land surface temperature change: A case study in lagos, nigeria. Sci. Rep. 2022, 12, 14168. [Google Scholar] [CrossRef] [PubMed]
  9. Heisel, F.; McGranahan, J.; Ferdinando, J.; Dogan, T. High-resolution combined building stock and building energy modeling to evaluate whole-life carbon emissions and saving potentials at the building and urban scale. Resour. Conserv. Recycl. 2022, 177, 106000. [Google Scholar] [CrossRef]
  10. Palladino, D. Energy performance gap of the italian residential building stock: Parametric energy simulations for theoretical deviation assessment from standard conditions. Appl. Energy 2023, 345, 121365. [Google Scholar] [CrossRef]
  11. Rajaratnam, D.; Stewart, R.A.; Liu, T.; Vieira, A.S. Building stock mining for a circular economy: A systematic review on application of gis and remote sensing. Resour. Conserv. Recycl. Adv. 2023, 18, 200144. [Google Scholar] [CrossRef]
  12. Esch, T.; Brzoska, S.E.; Dech, B.; Leutner, D.; Palacios-Lopez, A.; Metz-Marconcini, A.; Marconcini, M.; Roth, A.; Zeidler, J. World settlement footprint 3d-a first three-dimensional survey of the global building stock. Remote Sens. Environ. 2022, 270, 112877. [Google Scholar] [CrossRef]
  13. Marinova, S.; Deetman, S.; van der Voet, E.; Daioglou, V. Global construction materials database and stock analysis of residential buildings between 1970–2050. J. Clean. Prod. 2020, 247, 119146. [Google Scholar] [CrossRef]
  14. Zhong, X.; Hu, M.; Deetman, S.; Steubing, B.; Lin, H.X.; Hernandez, G.A.; Harpprecht, C.; Zhang, C.; Tukker, A. Global greenhouse gas emissions from residential and commercial building materials and mitigation strategies to 2060. Nat. Commun. 2021, 12, 6126. [Google Scholar] [CrossRef] [PubMed]
  15. Huo, T.; Xu, L.; Liu, B.; Cai, W. China’s commercial building carbon emissions toward 2060: An integrated dynamic emission assessment model. Appl. Energy 2022, 325, 119828. [Google Scholar] [CrossRef]
  16. Lu, M.; Lai, J. Review on carbon emissions of commercial buildings. Renew. Sustain. Energy Rev. 2020, 119, 109545. [Google Scholar] [CrossRef]
  17. Mao, R.; Bao, Y.; Duan, H.; Liu, G. Global urban subway development, construction material stocks, and embodied carbon emissions. Humanit. Soc. Sci. Commun. 2021, 8, 1–11. [Google Scholar] [CrossRef]
  18. Zhang, Y.; Hu, S.; Guo, F.; Mastrucci, A.; Zhang, S.; Yang, Z.; Yan, D. Assessing the potential of decarbonizing china’s building construction by 2060 and synergy with industry sector. J. Clean. Prod. 2022, 359, 132086. [Google Scholar] [CrossRef]
  19. Zhou, W.; Moncaster, A.; O’Neill, E.; Reiner, D.M.; Wang, X.; Guthrie, P. Modelling future trends of annual embodied energy of urban residential building stock in china. Energy Policy 2022, 165, 112932. [Google Scholar] [CrossRef]
  20. Bao, Y.; Huang, Z.; Yin, G.; Ren, S.; Yan, X.; Qi, J. Quantifying the impact of building material stock and green infrastructure on urban heat island intensity. Build. Environ. 2025, 280, 113068. [Google Scholar] [CrossRef]
  21. Song, J.; Chen, W.; Zhang, J.; Huang, K.; Hou, B.; Prishchepov, A.V. Effects of building density on land surface temperature in china: Spatial patterns and determinants. Landsc. Urban Plan. 2020, 198, 103794. [Google Scholar] [CrossRef]
  22. Derbal, R.; Defer, D.; Chauchois, A.; Antczak, E. A simple method for building materials thermophysical properties estimation. Constr. Build. Mater. 2014, 63, 197–205. [Google Scholar] [CrossRef]
  23. Li, B.; Cheng, C. Quantifying the impact of buildings on land surface temperature: Intrinsic structure and extrinsic morphology. Build. Environ. 2024, 259, 111680. [Google Scholar] [CrossRef]
  24. Jonnala, S.N.; Gogoi, D.; Devi, S.; Kumar, M.; Kumar, C. A comprehensive study of building materials and bricks for residential construction. Constr. Build. Mater. 2024, 425, 135931. [Google Scholar] [CrossRef]
  25. Basyouni, Y.A.; Mahmoud, H. Affordable green materials for developed cool roof applications: A review. Renew. Sustain. Energy Rev. 2024, 202, 114722. [Google Scholar] [CrossRef]
  26. Matias, M.; Lopes, A. Lcz thermal and exoatmospheric albedo assessment using landsat 8 land surface temperature and reflectance dataset: Case study of lisbon. Remote Sens. Appl. Soc. Environ. 2024, 34, 101163. [Google Scholar] [CrossRef]
  27. Okumus, D.E.; Terzi, F. Evaluating the role of urban fabric on surface urban heat island: The case of istanbul. Sustain. Cities Soc. 2021, 73, 103128. [Google Scholar] [CrossRef]
  28. Teichmann, F.; Baumgartner, C.M.; Horvath, A.; Luisser, M.; Korjenic, A. Simulation of urban microclimate with uhisolver: Software validation using simplified material data. Ecol. Process. 2021, 10, 1–23. [Google Scholar] [CrossRef]
  29. Wonorahardjo, S.; Sutjahja, I.M.; Mardiyati, Y.; Andoni, H.; Thomas, D.; Achsani, R.A.; Steven, S. Characterising thermal behaviour of buildings and its effect on urban heat island in tropical areas. Int. J. Energy Environ. Eng. 2020, 11, 129–142. [Google Scholar] [CrossRef]
  30. Li, Y.; Schubert, S.; Kropp, J.P.; Rybski, D. On the influence of density and morphology on the urban heat island intensity. Nat. Commun. 2020, 11, 2647. [Google Scholar] [CrossRef] [PubMed]
  31. Spyrou, G.; Ioannou, B.; Souliotis, M.; Savvides, A.L.; Fokaides, P.A. The adaptability of cities to climate change: Evidence from cities’ redesign towards mitigating the uhi effect. Sustainability 2023, 15, 6133. [Google Scholar] [CrossRef]
  32. Augiseau, V.; Barles, S. Studying construction materials flows and stock: A review. Resour. Conserv. Recycl. 2017, 123, 153–164. [Google Scholar] [CrossRef]
  33. Langevin, J.; Reyna, J.L.; Ebrahimigharehbaghi, S.; Sandberg, N.; Fennell, P.; Nägeli, C.; Laverge, J.; Delghust, M.; Mata, É.; Van Hove, M. Developing a common approach for classifying building stock energy models. Renew. Sustain. Energy Rev. 2020, 133, 110276. [Google Scholar] [CrossRef]
  34. Buffat, R.; Froemelt, A.; Heeren, N.; Raubal, M.; Hellweg, S. Big data GIS analysis for novel approaches in building stock modelling. Appl. Energy 2017, 208, 277–290. [Google Scholar] [CrossRef]
  35. Haberl, H.; Wiedenhofer, D.; Schug, F.; Frantz, D.; Vira, D.; Plutzar, C.; Gruhler, K.; Lederer, J.; Schiller, G.; Fishman, T. High-resolution maps of material stocks in buildings and infrastructures in Austria and Germany. Environ. Sci. Technol. 2021, 55, 3368–3379. [Google Scholar] [CrossRef] [PubMed]
  36. Mao, R.; Bao, Y.; Huang, Z.; Liu, Q.; Liu, G. High-resolution mapping of the urban built environment stocks in beijing. Environ. Sci. Technol. 2020, 54, 5345–5355. [Google Scholar] [CrossRef] [PubMed]
  37. Li, X. Mapping pedestrian network level outdoor heat hazard distributions in Philadelphia. Environ. Plan. B Urban Anal. City Sci. 2025, 52, 899–912. [Google Scholar] [CrossRef]
  38. Xiang, Y.; Yuan, C.; Cen, Q.; Huang, C.; Wu, C.; Teng, M.; Zhou, Z. Heat risk assessment and response to green infrastructure based on local climate zones. Build. Environ. 2024, 248, 111040. [Google Scholar] [CrossRef]
  39. Han, C.; Man, Q.; Dong, P.; Yang, X.; Zhang, B.; Wu, J.; Liu, C.; Zhou, C.; Tan, Z. Exploring the influence of urban morphology on summer daytime and nighttime LST based on sdgsat-1. Int. J. Digit. Earth 2025, 18, 2482101. [Google Scholar] [CrossRef]
  40. Wang, H.; Yi, T.; Lu, Y.; Wang, Y.; Wu, J. Patterns of nighttime surface urban heat island patch in mega urban agglomerations: A case study in the pearl river delta, China. Sustain. Cities Soc. 2025, 128, 106465. [Google Scholar] [CrossRef]
  41. Ding, S.; Chen, A. Comprehensive assessment of daytime, nighttime and compound heatwave risk in east China. Nat. Hazards 2024, 120, 7245–7263. [Google Scholar] [CrossRef]
  42. Yang, L.; Chen, Y.; Li, Y.; Zhu, H.; Yang, X.; Li, S.; Tang, G. Is 3D building morphology really related to land surface temperature? Insights from a new homogeneous unit. Build. Environ. 2024, 266, 112101. [Google Scholar] [CrossRef]
  43. Dab’at, A.A.; Alqadi, S. The impact of urban morphology on energy demand of a residential building in a Mediterranean climate. Energy Build. 2024, 325, 114989. [Google Scholar] [CrossRef]
  44. Gong, P.; Chen, B.; Li, X.; Liu, H.; Wang, J.; Bai, Y.; Chen, J.; Chen, X.; Fang, L.; Feng, S.J.S.B. Mapping essential urban land use categories in china (euluc-china): Preliminary results for 2018. Sci. Bull. 2020, 65, 182–187. [Google Scholar] [CrossRef] [PubMed]
  45. Yang, D.; Guo, J.; Sun, L.; Shi, F. Urban buildings material intensity in china from 1949 to 2015. Resour. Conserv. Recycl. 2020, 159, 104824. [Google Scholar] [CrossRef]
  46. Huang, Z.; Bao, Y.; Mao, R.; Wang, H.; Yin, G.; Wan, L.; Qi, H.; Li, Q.; Tang, H.; Liu, Q.J.E. Big geodata reveals spatial patterns of built environment stocks across and within cities in china. Engineering 2024, 34, 143–153. [Google Scholar] [CrossRef]
  47. Zhou, Y.; Zhao, H.; Mao, S.; Zhang, G.; Jin, Y.; Luo, Y.; Huo, W.; Pan, Z.; An, P.; Lun, F. Exploring surface urban heat island (suhi) intensity and its implications based on urban 3d neighborhood metrics: An investigation of 57 chinese cities. Sci. Total Environ. 2022, 847, 157662. [Google Scholar] [CrossRef] [PubMed]
  48. Pedregosa, F.; Varoquaux, G.; Gramfort, A.; Michel, V.; Thirion, B.; Grisel, O.; Blondel, M.; Prettenhofer, P.; Weiss, R. Scikit-learn: Machine learning in python. J. Mach. Learn. Res. 2011, 12, 2825–2830. [Google Scholar]
  49. Anselin, L.; Syabri, I.; Kho, Y. Geoda: An introduction to spatial data analysis. In Handbook of Applied Spatial Analysis: Software Tools, Methods and Applications; Springer: Berlin/Heidelberg, Germany, 2009; pp. 73–89. [Google Scholar]
  50. Zhang, X.; Zhang, D.; Yiwen, Z. Temporal changes and spatial driving mechanisms of water ecological footprints in the context of urbanization: Taking three major urban agglomerations in china’s yangtze river economic belt as an example. Water 2023, 15, 760. [Google Scholar] [CrossRef]
  51. Oke, T.R. The energetic basis of the urban heat island. Q. J. R. Meteorol. Soc. 1982, 108, 1–24. [Google Scholar] [CrossRef]
  52. Schrijvers, P.; Jonker, H.; Kenjereš, S.; De Roode, S. Breakdown of the night time urban heat island energy budget. Build. Environ. 2015, 83, 50–64. [Google Scholar] [CrossRef]
  53. Masson, V. A physically-based scheme for the urban energy budget in atmospheric models. Bound.-Layer Meteorol. 2000, 94, 357–397. [Google Scholar] [CrossRef]
  54. Zhao, L.; Lee, X.; Smith, R.B.; Oleson, K. Strong contributions of local background climate to urban heat islands. Nature 2014, 511, 216–219. [Google Scholar] [CrossRef] [PubMed]
  55. Huang, K.; Lee, X.; Stone, B., Jr.; Knievel, J.; Bell, M.L.; Seto, K.C. Persistent increases in nighttime heat stress from urban expansion despite heat island mitigation. J. Geophys. Res. Atmos. 2021, 126, e2020JD033831. [Google Scholar] [CrossRef]
  56. Loh, N.; Bhiwapurkar, P. Urban heat-mitigating building form and façade framework. Archit. Sci. Rev. 2022, 65, 57–71. [Google Scholar] [CrossRef]
  57. Carpentieri, M.; Robins, A.G. Influence of urban morphology on air flow over building arrays. J. Wind. Eng. Ind. Aerodyn. 2015, 145, 61–74. [Google Scholar] [CrossRef]
Figure 1. Study areas in our research (a) the location of study areas; (b) the urban characteristics of study areas.
Smartcities 08 00119 g001
Figure 2. The BMS in Chinese megacities (a). the stock of different types of building material in Chinese cities; (b). the building material stock density per unit area in Chinese cities; (c). the building material stock density per person in Chinese cities; (d). Changes in building material stock and population accumulation percentage in Chinese megacities.
Smartcities 08 00119 g002
Figure 3. The relationship between BMS and LST.
Smartcities 08 00119 g003
Figure 4. The spatial correlation between BMS and LST.
Smartcities 08 00119 g004
Figure 5. The relationship between building forms BMS and LST (a). the relationship between building forms and BMS; (b). the two-way partial dependence plot of building density, BMS, and LST during nighttime; (c). the two-way partial dependence plot of building height, BMS, and LST during nighttime).
Smartcities 08 00119 g005
Figure 6. The mechanism of how building material stock influences LST.
Smartcities 08 00119 g006
Table 1. Data sources in our research.
DataTimeResolutionUsageSource
Building data2020Vector dataCalculating building area and building heighthttps://lbsyun.baidu.com/ (accessed on 7 June 2024)
Real estate information2020Vector dataIdentifying building age and building structurehttps://www.anjuke.com/ (accessed on 21 May 2024)
https://www.lianjia.com/ (accessed on 21 May 2024)
MYD11A120201 kmCalculating LST during daytime and nighttimehttps://modis.gsfc.nasa.gov/ (accessed on 23 May 2024)
WorldPop2020100 mAnalyzing the relationship between population and BMShttps://hub.worldpop.org/ (accessed on 17 June 2024)
MOD13A12020500 mAnalyzing the influence of vegetation on the relationship between BMS and LSThttps://modis.gsfc.nasa.gov/ (accessed on 23 May 2024)
Global Urban Boundaries2020Vector dataExtracting urban boundarieshttp://data.ess.tsinghua.edu.cn (accessed on 1 July 2024)
Disclaimer/Publisher’s Note: The statements, opinions and data contained in all publications are solely those of the individual author(s) and contributor(s) and not of MDPI and/or the editor(s). MDPI and/or the editor(s) disclaim responsibility for any injury to people or property resulting from any ideas, methods, instructions or products referred to in the content.

