
Optimization of Bus Dispatching in Public Transportation Through a Heuristic Approach Based on Passenger Demand Forecasting

 , and
, and
Abstract
Highlights
- The adaptive heuristic achieves on average a 95% match to the MILP benchmark’s operational utility with a mean optimality gap below 5%, while preserving high service levels (>90%) across diverse demand profiles.
- Computational times are reduced by up to 98% compared to the exact MILP model, enabling near real-time dispatch decisions on a standard computing platform.
- The framework offers a scalable, implementable dispatching solution for mid-sized urban transport operators, balancing service quality and cost efficiency under uncertain demand.
- By integrating machine-learning forecasts with a lightweight heuristic, the approach bridges the gap between theoretical optimization and practical, data-driven real-time operations.
Abstract
1. Introduction
- We develop a hybrid dispatching framework that integrates short-term demand forecasting using Prophet with a MILP-based exact optimization model and an adaptive heuristic strategy for real-time responsiveness.
- Our approach is tailored to the realities of traditional transportation systems in medium-sized Latin American cities, where dispatching decisions must balance operational costs and service quality under high uncertainty.
- We validate our model using empirical data from Montería, demonstrating significant improvements in service efficiency and operational viability compared to both fixed-schedule and purely heuristic baselines.
2. State-of-the-Art
- While previous works often address dispatch optimization using either stand-alone ML techniques [14] or purely heuristic rules [12], our approach combines a machine learning demand-forecasting module with a discrete-time heuristic to yield both adaptability (to fluctuating passenger loads) and computational efficiency.
- Several studies emphasize exact formulations (e.g., MILP or nonlinear programming) suitable for large metropolitan transit systems [3,7], yet the associated models become prohibitively expensive or over-simplified in mid-sized cities with traditional operation schemes. Our method leverages a space-time model specifically tailored to medium-scale fleets, ensuring that real operational nuances—like flexible stop structures and limited data collection—are captured.
- Exact methods [8] can handle rolling-horizon dispatch but become increasingly costly as the number of buses and time intervals grows. Our proposed heuristic not only adapts to short time intervals but also reduces computational time by over 90%, compared to the tested MILP, making it feasible for near real-time scheduling.
- While many works focus on either high-frequency or low-demand scenarios exclusively [12,15], our model demonstrates robustness across a range of demand profiles (peak versus off-peak) and route lengths, which is crucial for non-metropolitan contexts where demand can vary drastically throughout the day.
- In contrast to heuristic approaches that concentrate on single-route case studies or oversimplify fleet usage [13], we formulate explicit decision rules for bus reallocation (idle repositioning) and endpoint dispatch thresholds, thus providing a structured policy framework that operators can readily implement.
3. Methodological Framework
- Forecasting precision: leverage data-driven methods to generate reliable passenger demand estimates under temporal variability.
- Real-time adaptability: provide a computationally efficient dispatching policy that dynamically reacts to changing system conditions.
- Benchmark validation: use MILP model to validate the heuristic’s performance and quantify suboptimality gaps.
3.1. Assumptions and System Characteristics
3.2. Passenger Demand Forecasting Model
3.2.1. Forecasting Models
3.2.2. Evaluation Protocol
- Root Mean Squared Error (RMSE): Sensitive to large errors, highlighting predictive conservatism.
- Mean Absolute Percentage Error (MAPE): Scale-free and interpretable in relative error terms.
3.3. Space-Time MILP Formulation for Optimal Bus Dispatching
3.4. Bus Dispatch Heuristic
3.4.1. Parameter Definition
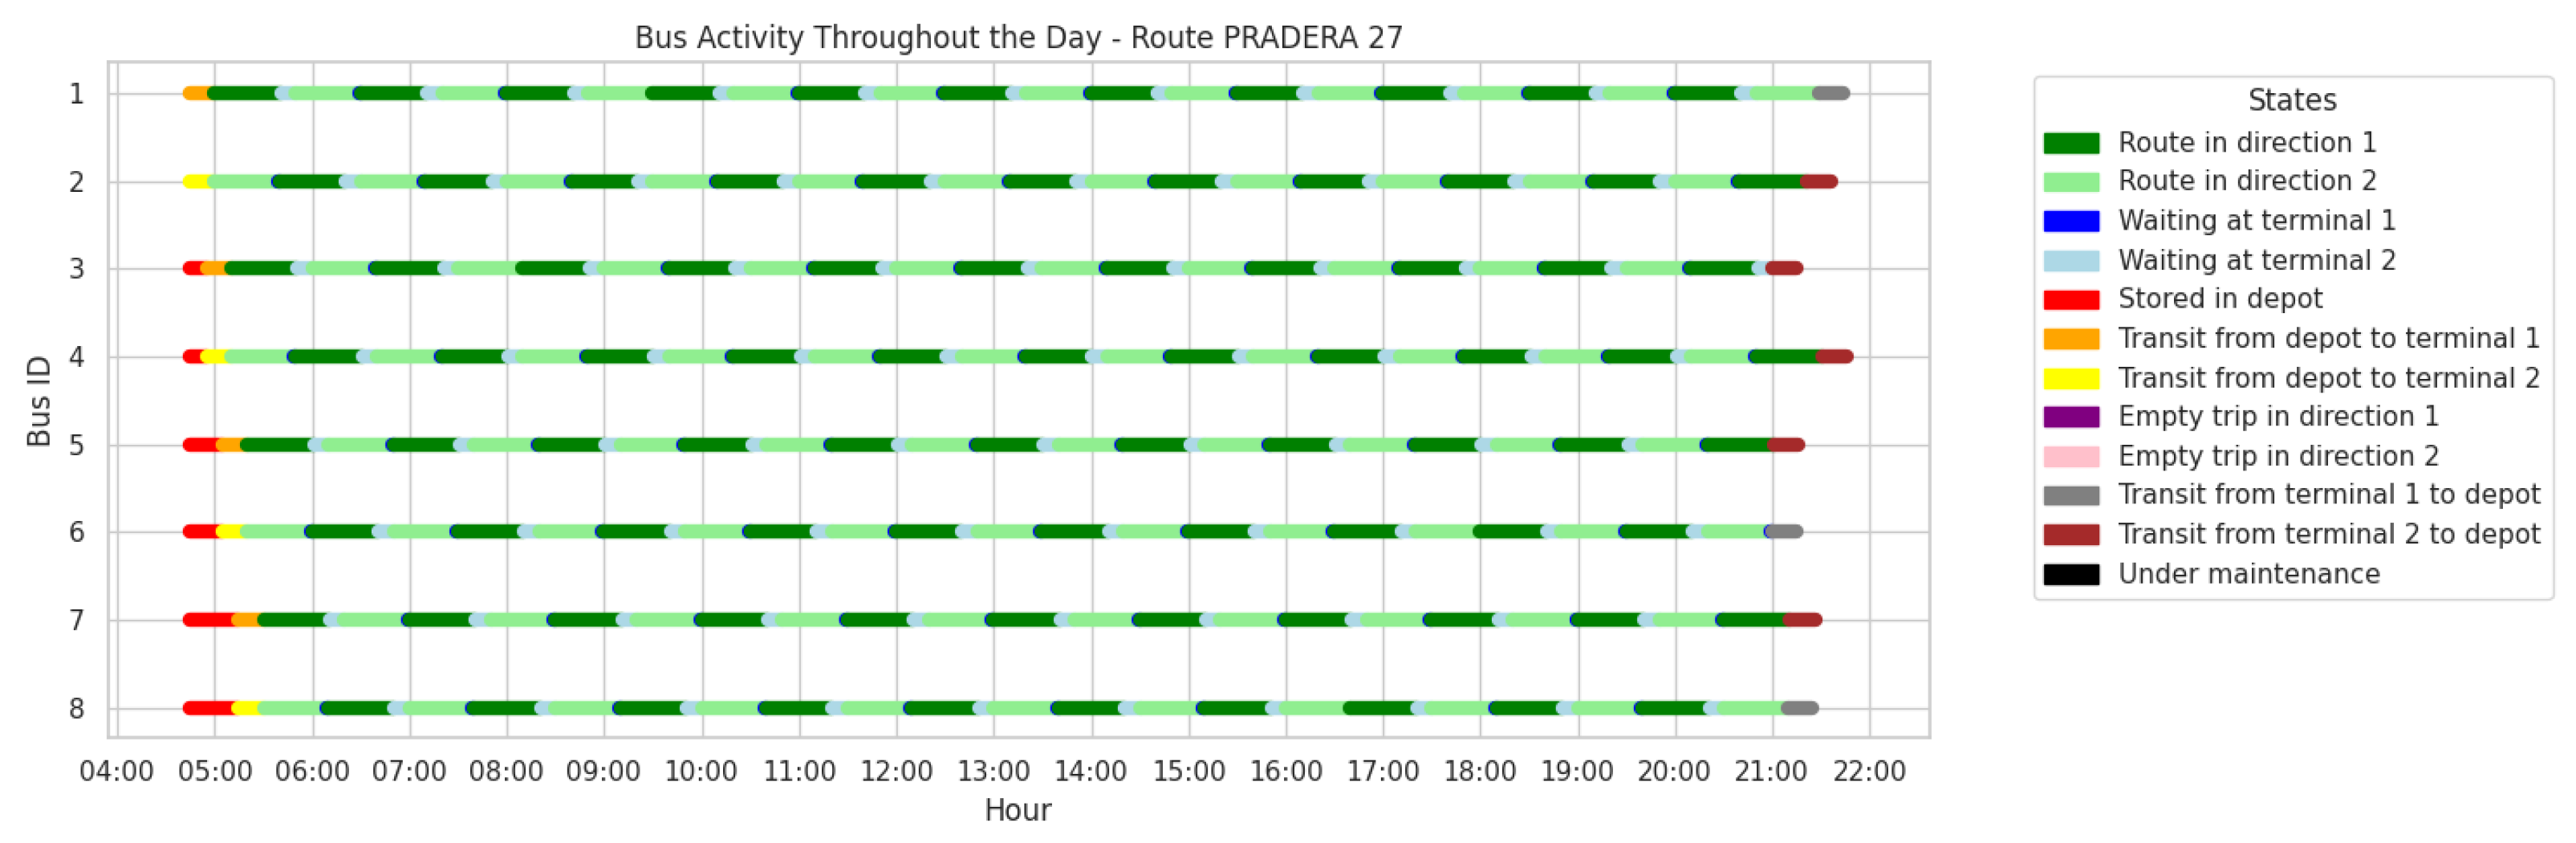
- At depot: the bus is at the depot (stored), available for assignment.
- At terminal s: the bus is at terminal or , waiting to be dispatched.
- In route: the bus is traveling between terminals with passengers.
- In transit to depot: the bus is returning empty to the depot from a terminal.
- In transit to terminal: the bus is heading to a terminal from the depot.
- Empty trip: the bus is traveling between terminals without passengers.
3.4.2. Heuristic Description
- Accumulated demand exceeds the dispatch threshold : this condition implies that the bus has reached a sufficient occupancy level to justify dispatching. If demand continues accumulating without dispatching, the vehicle’s capacity may not be sufficient to accommodate all accumulated demand, generating a service deficit. Therefore, this rule ensures that buses are dispatched before reaching a critical saturation point.
- Accumulated waiting time reaches or exceeds the allowed limit : this condition ensures that passengers do not wait beyond a reasonable time before a bus is dispatched. It also respects operational constraints related to synchronizing trips between terminals. If this time is exceeded, it could affect the overall scheduling of the system, including the arrival and departure times of other buses. Thus, this rule seeks a balance between service level and operational punctuality.
- It is the last time interval, : this condition ensures that all accumulated demand is served before the daily operation ends. Upon reaching the last interval, any remaining demand in the system must be dispatched to maximize the service level at the end of the day. This rule acts as a clearing mechanism to prevent passengers from being left unattended at the end of operations.
| Algorithm 1 Efficient Bus Dispatch Heuristic |
| Input: , , , , Parameters: , , , , , , K, , , , Output: Bus dispatch plan, performance metrics (U, NS, CU, UP, IPK) 1: for each do 2: for each do 3: 4: end for 5: end for 6: for each do 7. 8: end for 9: Initialize Dispatch Plan ← empty 10: for each do 11: time corresponding to interval t 12: for each do 13: for each do 14: 15: 16: 17: 18: if oror then 19: 20: if then 21: Dispatch bus b on route r, direction s, at time 22: 23: if then 24: 25: else 26: 27: end if 28: 29: 30: 31: 32: 33: if then 34: 35: else 36: 37: end if 38: else 39: 40: 41: end if 42: end if 43: Schedule 44: end for 45: end for 46: EvaluateIdleBuses 47: end for 48: SendBusesToDepot 49: ComputeGlobalMetrics 50: return Bus dispatch plan, performance metrics (U, NS, CU, UP, IPK) |
| Algorithm 2 Function EvaluateIdleBuses |
|
Input: r, s, , t, , , Parameters: , , K Output: Updated bus state and availability time for idle buses 1: for each do 2: for each do 3: 4: 5: 6: if then 7: SelectIdleBuses(Bavailable) 8: for each do 9: if else 10: 11: 12: if then 13: SendEmptyBus 14: else 15: SendBusToDepot 16: end if 17: end for 18: end if 19: end for 20: end for 21: return |
- Sending to the opposite terminal: The future demand at the opposite terminal is estimated, along with the available capacity there. If the capacity is insufficient to meet future demand in the opposite direction, the bus is sent empty. The bus state is updated to in transit towards the opposite terminal, and its availability is adjusted, considering the travel time in that direction.
- Sending to the depot: If the capacity at the opposite terminal is sufficient to meet its future demand, the bus is sent to the depot to optimize operating costs and reduce idleness. In this case, the bus state is updated to in transit to depot, and its availability is adjusted to reflect its arrival at the depot.
- Operational Utility (U): evaluates the system’s profitability by calculating the difference between total revenue and total operating costs.Total revenue is calculated as the sum of passengers transported by each bus multiplied by the fare for each route r. On the other hand, total operating costs are computed as the sum of operating costs per unit of time multiplied by the total operating time for each bus b in each route r. This formula represents the total operational utility for each route r in the system.
- Service Level (NS): measures the proportion of total demand met by the system.This metric compares the number of passengers transported to the total predicted demand for each route r, reflecting the system’s efficiency in meeting demand.
- Average Capacity Utilization (CU): indicates the average occupancy percentage of buses during trips.It reflects the proportion of bus capacity that is effectively utilized during trips, comparing the total passengers transported to the total available capacity for each route r.
- Average Utilization (UP): shows the proportion of time buses are in active operation (on route) compared to the total available operational time.This metric is useful for assessing operational efficiency, showing how much time buses actually spend on the route compared to the total available operating time for each route r.
- Passengers per Kilometer Index (IPK): measures efficiency in terms of bus occupancy relative to the distance traveled.This allows the evaluation of the system’s operational efficiency by relating the number of transported passengers to the distance traveled for each route r.
3.4.3. Heuristic Parameter Tuning
3.5. Experimental Design
4. Computational Experiments and Results Analysis
4.1. Case Study Overview and Operational Context
4.2. Passenger Demand Forecasting Performance
4.2.1. Data Preparation and Model Configuration
- Elimination of missing or inconsistent entries.
- Standardization of timestamp formats.
- Alignment of time indices across all routes.
- Aggregation of demand by route and direction within each interval.
- changepoint_prior_scale∈ 0.001, 0.01, 0.1, 0.5
- seasonality_prior_scale∈ 0.01, 0.1, 1.0, 10.0
4.2.2. Model Evaluation and Accuracy Metrics
4.2.3. Illustrative Demand Profiles
4.2.4. Passenger Demand Prediction in Montería
4.2.5. Model Limitations
4.3. Operational Results by Dispatch Strategy
4.3.1. Baseline Performance
4.3.2. MILP Optimization Model
4.3.3. Heuristic Strategy
4.4. Comparative Analysis of Dispatch Approaches
4.4.1. Performance Gaps
4.4.2. Execution Time Comparison
4.5. Statistical Comparison and Results
4.5.1. Descriptive Statistics
4.5.2. Global Significance Tests (ANOVA)
4.5.3. Pairwise Comparisons
5. Conclusions
Author Contributions
Funding
Data Availability Statement
Conflicts of Interest
Abbreviations
| TNSP | Transit Network Scheduling Problem |
| MILP | Mixed-Integer Linear Programming |
| ML | Machine Learning |
| RMSE | Root Mean Square Error |
| ARIMA | AutoRegressive Integrated Moving Average |
| LSTM | Long Short-Term Memory |
| DP | Dynamic Programming |
| LNS | Large Neighborhood Search |
| SHFs | Simulated Historical Forecasts |
| DNP | Departamento Nacional de Planeación |
References
- Guihaire, V.; Hao, J.K. Transit network design and scheduling: A global review. Transp. Res. Part A Policy Pract. 2008, 42, 1251–1273. [Google Scholar] [CrossRef]
- Magnanti, T.L.; Wong, R.T. Network design and transportation planning: Models and algorithms. Transp. Sci. 1984, 18, 1–55. [Google Scholar] [CrossRef]
- Borndörfer, R.; Grötschel, M.; Pfetsch, M.E. A Path-Based Model for Line Planning in Public Transport A Path-Based Model for Line Planning in Public Transport *. Technical Report. 2005. Available online: https://www.google.com/url?sa=t&source=web&rct=j&opi=89978449&url=http://webdoc.sub.gwdg.de/ebook/serien/ah/reports/ZIBreport/ZR-05-18.pdf&ved=2ahUKEwiQrJ6R6pyNAxVjVmwGHYLRJroQFnoECBwQAQ&usg=AOvVaw1KSs6HedcL39KmDr41Voqj (accessed on 5 May 2025).
- Zhou, X.; Wei, G.; Zhang, Y.; Wang, Q.; Guo, H. Optimizing Multi-Vehicle Demand-Responsive Bus Dispatching: A Real-Time Reservation-Based Approach. Sustainability 2023, 15, 5909. [Google Scholar] [CrossRef]
- Pei, M.; Lin, P.; Du, J.; Li, X.; Chen, Z. Vehicle dispatching in modular transit networks: A mixed-integer nonlinear programming model. Transp. Res. Part E Logist. Transp. Rev. 2021, 147, 102240. [Google Scholar] [CrossRef]
- Guan, D.; Wu, X.; Wang, K.; Zhao, J. Vehicle Dispatch and Route Optimization Algorithm for Demand-Responsive Transit. Processes 2022, 10, 2651. [Google Scholar] [CrossRef]
- van Oudheusden, D.L.; Zhu, W. Trip frequency scheduling for bus route management in Bangkok. Eur. J. Oper. Res. 1995, 83, 439–451. [Google Scholar] [CrossRef]
- Gkiotsalitis, K.; van Berkum, E.C. An exact method for the bus dispatching problem in rolling horizons. Transp. Res. Part C Emerg. Technol. 2020, 110, 143–165. [Google Scholar] [CrossRef]
- Gkiotsalitis, K. A model for the periodic optimization of bus dispatching times. Appl. Math. Model. 2020, 82, 785–801. [Google Scholar] [CrossRef]
- Chen, Z.; Li, X.; Zhou, X. Operational design for shuttle systems with modular vehicles under oversaturated traffic: Discrete modeling method. Transp. Res. Part B Methodol. 2019, 122, 1–19. [Google Scholar] [CrossRef]
- Gkiotsalitis, K.; Cats, O. Reliable frequency determination: Incorporating information on service uncertainty when setting dispatching headways. Transp. Res. Part C Emerg. Technol. 2018, 88, 187–207. [Google Scholar] [CrossRef]
- Hadas, Y.; Shnaiderman, M. Public-transit frequency setting using minimum-cost approach with stochastic demand and travel time. Transp. Res. Part B Methodol. 2012, 46, 1068–1084. [Google Scholar] [CrossRef]
- Eranki, A. A Model to Create Bus Timetables to Attain Maximum Synchronization Considering Waiting Times at Transfer Stops. Master’s Thesis, Department of Industrial and Management Systems Engineering University of South Florida, Tampa, FL, USA, 2004. Available online: http://scholarcommons.usf.edu/etd/1025 (accessed on 15 February 2025).
- Gorev, A.; Popova, O.; Solodkij, A. Demand-responsive transit systems in areas with low transport demand of “smart city”. Transp. Res. Procedia 2020, 50, 160–166. [Google Scholar] [CrossRef]
- Berrebi, S.J.; Watkins, K.E.; Laval, J.A. A real-time bus dispatching policy to minimize passenger wait on a high frequency route. Transp. Res. Part B Methodol. 2015, 81, 377–389. [Google Scholar] [CrossRef]
- Gkiotsalitis, K.; Alesiani, F. Robust timetable optimization for bus lines subject to resource and regulatory constraints. Transp. Res. Part E Logist. Transp. Rev. 2019, 128, 30–51. [Google Scholar] [CrossRef]
- Yao, E.; Liu, T.; Lu, T.; Yang, Y. Optimization of electric vehicle scheduling with multiple vehicle types in public transport. Sustain. Cities Soc. 2020, 52, 101862. [Google Scholar] [CrossRef]
- Van Lieshout, R.N.; Bouman, P.C.; van den Akker, M.; Huisman, D. A self-organizing policy for vehicle dispatching in public transit systems with multiple lines. Transp. Res. Part B Methodol. 2021, 152, 46–64. [Google Scholar] [CrossRef]
- Taylor, S.J.; Letham, B. Forecasting at Scale. Am. Stat. 2018, 72, 37–45. [Google Scholar] [CrossRef]
- Sherstinsky, A. Fundamentals of Recurrent Neural Network (RNN) and Long Short-Term Memory (LSTM) network. Phys. D Nonlinear Phenom. 2020, 404, 132306. [Google Scholar] [CrossRef]
- Song, X.; Liu, Y.; Xue, L.; Wang, J.; Zhang, J.; Wang, J.; Jiang, L.; Cheng, Z. Time-series well performance prediction based on Long Short-Term Memory (LSTM) neural network model. J. Pet. Sci. Eng. 2020, 186, 106682. [Google Scholar] [CrossRef]


| Reference | Objective | Methodology | Variables | Constraints | Application |
|---|---|---|---|---|---|
| Borndörfer et al. [3] | Minimize operational costs and waiting times | MILP with column generation | Frequencies, optimized lines | Vehicle capacity, travel times | Potsdam, Germany |
| Zhou et al. [4] | Efficient allocation in on-demand systems | Bipartite graphs + Kuhn-Munkres Algorithm | Real-time allocation | Vehicle capacity, time constraints | Simulation |
| Pei et al. [5] | Optimization of frequencies and modular capacities | MILP | Demand, vehicle capacities | Demand fluctuation | Simulation (China) |
| Guan et al. [6] | Optimize dispatch in variable demand systems | LNS-genetic algorithm | Passenger flows, routes | Vehicle conservation, capacity | Simulation (urban network) |
| Van Oudheusden et al. [7] | Minimize operational costs - reduction of empty trips | Nonlinear programming | Frequencies, travel times | Vehicle capacity, operational costs | Bangkok |
| Gkiotsalitis et al. [8] | Optimize dispatch in a rolling horizon | Convex nonlinear formulation | Dispatch intervals, schedules | Capacity, service regularity | Simulation |
| Gkiotsalitis [9] | Minimize variations in departure intervals | Convex quadratic programming | Intervals, departure times | Regularity, capacity | Line 302, Singapore |
| Chen and Zhou [10] | Optimize frequencies and capacities in oversaturated conditions | MILP + Dynamic Programming | Frequencies, dynamic demand | Vehicle capacity, oversaturated traffic | Beijing and Tampa Bay |
| Hadas et al. [12] | Optimize frequencies and schedules in public networks | Stochastic simulations | Frequencies, schedules | Regularity, historical demand | Simulation |
| Eranki [13] | Maximize arrivals at transfer points | Iterative heuristic | Departure schedules, transfers | Node synchronization | Simulation |
| Gorev et al. [14] | Optimize allocation in low-demand systems | Prediction + heuristics | Demand, vehicle assignment | Fleet availability | European network |
| Berrebi et al. [15] | Mitigate bus bunching in high-frequency routes | Stochastic decision processes | Dispatch times, intervals | Regularity, real-time demand | Circular routes |
| Yao et al. [17] | Adjust real-time dispatches | Dynamic simulations + relaxation | Demand, dispatch times | Dynamic constraints | Asian network |
| Van Lieshout et al. [18] | Optimize decentralized dispatching | Self-organization strategies | Dispatch times, routes | Limited resources, regular intervals | Göttingen, Germany |
| Our work | Optimize operational utility | Dispatch heuristic + demand prediction model | Passenger demand, distances, number of buses, travel times | Vehicle capacity, allowed movements, accumulations | Public transport network of Montería, Colombia |
| Problem Characteristics | Prophet | ARIMA | LSTM |
|---|---|---|---|
| Predictions with small datasets | √ | √ | X |
| Seasonalities–calendar effects | √ | X | √ |
| Training speed | √ | √ | X |
| Explainability | √ | √ | X |
| Robustness against outliers | √ | X | √ |
| Configuration complexity | √ | X | X |
| Adjustment to complex nonlinear trends | √ | X | √ |
| Symbol | Type | Description |
|---|---|---|
| Set | Set of available routes in the system. | |
| Set | Set of directions, . | |
| Set | Set of time intervals, , where H is the total number of intervals in the planning horizon. | |
| Set | Set of available buses assigned to route r. | |
| Set | Set of locations relevant for route r, . | |
| Parameter | Passenger demand on route r for direction in time interval . | |
| Parameter | Maximum capacity of each bus assigned to route r (in number of passengers). | |
| Parameter | Travel time in intervals from location to on route r. | |
| Parameter | Fixed fare per transported passenger on route r. | |
| Parameter | Fixed operating cost per bus in service per interval on route r. | |
| Parameter | Binary indicator for route r: 1 if movement between corresponds to direction s, 0 otherwise. | |
| Variable | 1 if bus moves from at time t to at time , 0 otherwise. | |
| Variable | 1 if bus is at location at time t, 0 otherwise. | |
| Variable | 1 if bus is in operation (outside the depot P) at time t, 0 otherwise. | |
| Variable | Number of passengers transported by bus in direction s in interval t. | |
| Variable | Unmet demand on route r in direction s in interval t. | |
| Variable | 1 if bus performs a movement associated with direction s during interval t, 0 otherwise. |
| Symbol | Type | Description |
|---|---|---|
| Parameter | Occupancy threshold (%) for dispatching on route r, direction s. | |
| Parameter | Maximum time a bus can remain at terminal s waiting to be dispatched, in minutes. | |
| Parameter | Duration of each time interval in minutes. | |
| K | Parameter | Future demand evaluation horizon in number of intervals. |
| Parameter | Transit time from terminal to depot P for route r, in minutes. | |
| Parameter | Transit time from terminal to depot P for route r, in minutes. | |
| Parameter | Transit time from depot P to terminal for route r, in minutes. | |
| Parameter | Transit time from depot P to terminal for route r, in minutes. | |
| Parameter | Fare per transported passenger. | |
| Parameter | Operating cost per bus in service per time interval. | |
| Variable | Accumulated demand on route r, direction s, up to interval t. | |
| Variable | Accumulated waiting time on route r, direction s, up to interval t. | |
| Variable | List of hours with unmet accumulated demand for route r, direction s, up to interval t. | |
| Variable | Accumulated unmet demand on route r, direction s, up to interval t. | |
| Variable | Current state of bus b. | |
| Variable | Time at which bus b will be available for operation. | |
| Variable | Total number of passengers transported by bus b. | |
| Variable | Kilometers traveled by bus b. |
| Route | Prophet | ARIMA | LSTM | |||
|---|---|---|---|---|---|---|
| RMSE | MAE | RMSE | MAE | RMSE | MAE | |
| Pradera 27 | 13.24 | 11.28 | 24.27 | 16.09 | 7.00 | 4.41 |
| Panzenu | 8.92 | 7.27 | 17.31 | 11.31 | 5.58 | 3.55 |
| Santander | 9.21 | 7.67 | 17.33 | 11.39 | 5.58 | 3.42 |
| Mogambo 22 | 0.77 | 0.33 | 15.55 | 10.06 | 5.31 | 3.45 |
| Tambo Circunvalar | 5.49 | 4.59 | 8.91 | 5.34 | 3.59 | 2.27 |
| KM30 | 4.57 | 3.10 | 7.89 | 4.69 | 5.25 | 3.64 |
| Dorado | 4.73 | 3.95 | 7.40 | 4.39 | 3.16 | 1.93 |
| KM15 | 0.72 | 0.18 | 5.84 | 3.24 | 3.46 | 1.93 |
| Route | Changepoint Scale | Seasonality Scale | RMSE |
|---|---|---|---|
| Pradera 27 | 0.500 | 10 | 14.89 |
| Panzenu | 0.010 | 0.10 | 8.94 |
| Santander | 0.001 | 0.10 | 9.94 |
| Mogambo 22 | 0.010 | 0.10 | 9.01 |
| Tambo Circunvalar | 0.010 | 0.1 | 6.67 |
| KM30 | 0.001 | 1 | 4.56 |
| Dorado | 0.010 | 10 | 5.27 |
| KM15 | 0.010 | 10 | 3.19 |
| Route | Total Passengers | Trips Completed | Total Kilometers | Service Level (%) | Global IPK | Capacity Utilized (%) | Utilization (%) | Utility ($) |
|---|---|---|---|---|---|---|---|---|
| Pradera 27 | 4021 | 82 | 1640.00 | 49.10 | 2.45 | 93.63 | 41.72 | 4145.50 |
| Panzenu | 3554 | 75 | 1405.50 | 71.02 | 2.53 | 89.22 | 40.76 | 3689.50 |
| Santander | 3291 | 71 | 1704.50 | 62.21 | 1.93 | 87.55 | 49.58 | 3158.00 |
| Mogambo 22 | 3682 | 77 | 1097.00 | 100.00 | 3.36 | 91.87 | 32.01 | 4065.00 |
| Tambo Circ. | 2228 | 53 | 968.5 | 92.03 | 2.30 | 82.65 | 42.95 | 2406.00 |
| KM30 | 182 | 5 | 94.00 | 15.44 | 1.94 | 70.00 | 18.99 | −131.00 |
| Dorado | 2938 | 77 | 1155.00 | 100.00 | 2.54 | 66.32 | 33.68 | 2576.00 |
| KM15 | 695 | 19 | 219.00 | 70.06 | 3.17 | 70.50 | 22.12 | 400.00 |
| Route | MILP Gap (%) | Utility ($) |
|---|---|---|
| Pradera 27 | 0.49 | 12,481 |
| Panzenu | 0.48 | 9328 |
| Santander | 0.24 | 7962 |
| Mogambo 22 | 0.41 | 5897 |
| Tambo Circunvalar | 0.36 | 4109 |
| KM30 | 0.18 | 815 |
| Dorado | 0.10 | 4272 |
| KM15 | 0.50 | 1033 |
| Route | Buses Used | Total Passengers | Trips Completed | Global IPK | Service Level (%) | Capacity Utilization (%) | Utilization (%) |
|---|---|---|---|---|---|---|---|
| Pradera 27 | 8 | 8038 | 169 | 2.31 | 97.55 | 91.41 | 96.92 |
| Panzenu | 6 | 5844 | 124 | 2.56 | 98.55 | 90.31 | 82.67 |
| Santander | 6 | 5296 | 112 | 2.08 | 98.29 | 90.83 | 83.07 |
| Mogambo 22 | 3 | 3526 | 78 | 3.18 | 98.60 | 86.70 | 40.87 |
| Tambo Circ. | 3 | 2602 | 56 | 2.50 | 98.49 | 86.16 | 56.11 |
| KM30 | 1 | 615 | 22 | 1.54 | 49.36 | 53.76 | 96.39 |
| Dorado | 2 | 2616 | 64 | 2.81 | 97.90 | 78.61 | 27.68 |
| KM15 | 2 | 899 | 53 | 1.22 | 94.23 | 32.63 | 96.08 |
| Route | Dispatch Threshold (%) | Waiting Time (min) | Utility ($) |
|---|---|---|---|
| Pradera 27 | 96 | 30 | 11,868.50 |
| Panzenu | 88 | 30 | 9182.50 |
| Santander | 94 | 30 | 7984.00 |
| Mogambo 22 | 70 | 20 | 5422.00 |
| Tambo Circunvalar | 94 | 20 | 3622.50 |
| KM30 | 60 | 20 | 776.00 |
| Dorado | 68 | 20 | 4354.00 |
| KM15 | 30 | 20 | 960.00 |
| Route | Buses Used | Total Passengers | Trips Completed | Global IPK | Service Level (%) | Capacity Utilized (%) | Utilization (%) |
|---|---|---|---|---|---|---|---|
| Pradera 27 | 8 | 7844 | 152 | 2.58 | 94.17 | 99.25 | 85.25 |
| Panzenu | 6 | 5930 | 118 | 2.68 | 100.00 | 96.68 | 85.68 |
| Santander | 6 | 5386 | 104 | 2.16 | 100.00 | 99.60 | 89.68 |
| Mogambo 22 | 4 | 3576 | 88 | 2.85 | 100.00 | 78.72 | 79.51 |
| Tambo | 5 | 2587 | 55 | 2.57 | 97.92 | 91.42 | 68.21 |
| KM30 | 1 | 623 | 22 | 1.52 | 50.00 | 54.46 | 79.16 |
| Dorado | 2 | 2672 | 64 | 2.78 | 100.00 | 80.29 | 89.76 |
| KM15 | 2 | 950 | 58 | 1.42 | 99.58 | 31.50 | 82.36 |
| Route | Utility Gap (%) | Service Level Gap (%) | Capacity Util Gap (%) | Utilization Gap (%) | ||||
|---|---|---|---|---|---|---|---|---|
| Heuristic | Baseline | Heuristic | Baseline | Heuristic | Baseline | Heuristic | Baseline | |
| Pradera 27 | 4.91 | 66.78 | 3.50 | 49.61 | −8.58 | 85.00 | −14.53 | 95.00 |
| Panzenu | 1.56 | 60.47 | −1.47 | 27.94 | −7.05 | 82.00 | −9.61 | 88.00 |
| Santander | −0.28 | 60.34 | −1.74 | 36.76 | −9.66 | 80.00 | −4.41 | 90.00 |
| Mogambo 22 | 8.05 | 31.10 | −1.42 | 1.42 | 9.20 | 50.00 | 5.17 | 55.00 |
| Tambo Circ. | 11.84 | 41.42 | 0.58 | 6.54 | −6.10 | 70.00 | −11.48 | 75.00 |
| KM30 | 4.79 | 116.05 | −1.30 | 68.72 | −1.30 | 60.00 | 9.50 | 65.00 |
| Dorado | −1.92 | 39.70 | −2.15 | 2.10 | −2.14 | 75.00 | −0.11 | 80.00 |
| KM15 | 7.07 | 61.23 | −5.68 | 25.47 | 3.46 | 48.00 | 26.14 | 55.00 |
| Route | Method | Utility ($) | Service Level (%) |
|---|---|---|---|
| Pradera 27 | Baseline | 4164 ± 54 | 49.1 ± 0.84 |
| Heuristic | 8727 ± 214 | 72.8 ± 1.92 | |
| MILP | 10,997 ± 81 | 94.8 ± 1.57 | |
| Panzenu | Baseline | 3700 ± 45 | 70.9 ± 1.01 |
| Heuristic | 7664 ± 171 | 86.3 ± 0.82 | |
| MILP | 8758 ± 133 | 98.2 ± 0.33 | |
| Santander | Baseline | 3131 ± 60 | 62.3 ± 0.79 |
| Heuristic | 4118 ± 119 | 70.2 ± 0.62 | |
| MILP | 6794 ± 81 | 97.8 ± 0.38 | |
| Mogambo 22 | Baseline | 4053 ± 25 | 100.0 ± 0.00 |
| Heuristic | 7363 ± 133 | 100.0 ± 0.00 | |
| MILP | 7477 ± 98 | 98.1 ± 0.36 | |
| Tambo Circ. | Baseline | 2403 ± 49 | 91.9 ± 0.76 |
| Heuristic | 2896 ± 49 | 95.8 ± 0.70 | |
| MILP | 3347 ± 45 | 98.2 ± 0.46 | |
| KM30 | Baseline | −132 ± 5 | 15.4 ± 0.30 |
| Heuristic | 607 ± 15 | 49.5 ± 0.61 | |
| MILP | 692 ± 24 | 49.1 ± 0.83 | |
| Dorado | Baseline | 2569 ± 82 | 100.0 ± 0.00 |
| Heuristic | 3035 ± 84 | 100.0 ± 0.00 | |
| MILP | 4249 ± 71 | 97.4 ± 0.41 | |
| KM15 | Baseline | 400 ± 16 | 70.0 ± 1.01 |
| Heuristic | 448 ± 21 | 83.4 ± 0.75 | |
| MILP | 588 ± 32 | 88.1 ± 1.39 |
| Route | Utility | Service Level | ||||
|---|---|---|---|---|---|---|
| F | df | p | F | df | p | |
| Pradera 27 | 21,734.4 | (2.29) | 19,779.4 | (2.29) | ||
| Panzenu | 25,083.6 | (2.29) | 9346.5 | (2.29) | ||
| Santander | 23,753.8 | (2.29) | 28,450.1 | (2.29) | ||
| Mogambo 22 | 23,726.8 | (2.29) | 813.7 | (2.29) | ||
| Tambo Circ. | 58,510.9 | (2.29) | 28,062.0 | (2,29) | ||
| KM30 | 23,415.3 | (2.29) | 27,458.2 | (2.29) | ||
| Dorado | 89,713.1 | (2.29) | 1214.7 | (2.29) | ||
| KM15 | 24,330.3 | (2.29) | 19,191.7 | (2.29) | ||
| Route | Comparison | Mean Δ | CI Lower | CI Upper | p |
|---|---|---|---|---|---|
| Pradera 27 | Baseline vs. Heuristic | 4563.4 | 4479.7 | 4647.1 | <0.001 |
| Baseline vs. MILP | 6833.6 | 6749.9 | 6917.4 | <0.001 | |
| Heuristic vs. MILP | 2270.2 | 2186.5 | 2354.0 | <0.001 | |
| Panzenu | Baseline vs. Heuristic | 3963.1 | 3884.4 | 4041.8 | <0.001 |
| Baseline vs. MILP | 5057.7 | 4978.9 | 5136.4 | <0.001 | |
| Heuristic vs. MILP | 1094.6 | 1015.8 | 1173.3 | <0.001 | |
| Santander | Baseline vs. Heuristic | 987.1 | 931.7 | 1042.5 | <0.001 |
| Baseline vs. MILP | 3663.1 | 3607.7 | 3718.5 | <0.001 | |
| Heuristic vs. MILP | 2676.0 | 2620.5 | 2731.4 | <0.001 | |
| Mogambo 22 | Baseline vs. Heuristic | 3309.9 | 3250.6 | 3369.2 | <0.001 |
| Baseline vs. MILP | 3424.1 | 3364.8 | 3483.4 | <0.001 | |
| Heuristic vs. MILP | 114.2 | 54.9 | 173.5 | <0.001 | |
| Tambo Circ. | Baseline vs. Heuristic | 493.3 | 336.0 | 677.4 | <0.001 |
| Baseline vs. MILP | 944.2 | 914.9 | 973.5 | <0.001 | |
| Heuristic vs. MILP | 450.9 | 382.6 | 520.2 | <0.001 | |
| KM30 | Baseline vs. Heuristic | 739.8 | 693.5 | 775.4 | <0.001 |
| Baseline vs. MILP | 824.3 | 813.9 | 834.6 | <0.001 | |
| Heuristic vs. MILP | 860.2 | 849.9 | 870.5 | <0.001 | |
| Dorado | Baseline vs. Heuristic | 464.7 | 415.8 | 513.5 | <0.001 |
| Baseline vs. MILP | 1680.1 | 1631.2 | 1728.9 | <0.001 | |
| Heuristic vs. MILP | 1215.4 | 1166.6 | 1264.2 | <0.001 | |
| KM15 | Baseline vs. Heuristic | 98.8 | 65.2 | 118.7 | <0.001 |
| Baseline vs. MILP | 187.8 | 173.3 | 202.3 | <0.001 | |
| Heuristic vs. MILP | 89.0 | 75.6 | 106.2 | <0.001 |
| Route | Comparison | Mean | CI Lower | CI Upper | p |
|---|---|---|---|---|---|
| Pradera 27 | Baseline vs. Heuristic | 23.67 | 22.73 | 24.60 | <0.001 |
| Baseline vs. MILP | 45.71 | 44.78 | 46.64 | <0.001 | |
| Heuristic vs. MILP | 22.04 | 21.11 | 22.98 | <0.001 | |
| Panzenu | Baseline vs. Heuristic | 15.39 | 14.92 | 15.87 | <0.001 |
| Baseline vs. MILP | 27.32 | 26.85 | 27.80 | <0.001 | |
| Heuristic vs. MILP | 11.93 | 11.45 | 12.41 | <0.001 | |
| Santander | Baseline vs. Heuristic | 7.93 | 7.55 | 8.31 | <0.001 |
| Baseline vs. MILP | 35.56 | 35.18 | 35.94 | <0.001 | |
| Heuristic vs. MILP | 27.63 | 27.25 | 28.01 | <0.001 | |
| Mogambo 22 | Baseline vs. Heuristic | 0.00 | −0.13 | 0.13 | 1.000 |
| Baseline vs. MILP | −1.88 | −2.01 | −1.75 | <0.001 | |
| Heuristic vs. MILP | −1.88 | −2.01 | −1.75 | <0.001 | |
| Tambo Circ. | Baseline vs. Heuristic | 3.90 | 1.82 | 4.58 | <0.001 |
| Baseline vs. MILP | 6.25 | 5.85 | 6.65 | <0.001 | |
| Heuristic vs. MILP | 2.35 | 1.95 | 3.75 | <0.001 | |
| KM30 | Baseline vs. Heuristic | 39.10 | 37.28 | 40.52 | <0.001 |
| Baseline vs. MILP | 33.68 | 33.30 | 34.06 | <0.001 | |
| Heuristic vs. MILP | −0.41 | −0.96 | 0.77 | <0.001 | |
| Dorado | Baseline vs. Heuristic | 0.00 | −0.14 | 0.14 | 1.000 |
| Baseline vs. MILP | −2.59 | −2.73 | −2.44 | <0.001 | |
| Heuristic vs. MILP | −2.59 | −2.73 | −2.44 | <0.001 | |
| KM15 | Baseline vs. Heuristic | 13.39 | 12.27 | 14.94 | <0.001 |
| Baseline vs. MILP | 18.12 | 17.46 | 18.79 | <0.001 | |
| Heuristic vs. MILP | 4.73 | 4.06 | 5.39 | <0.001 |
Disclaimer/Publisher’s Note: The statements, opinions and data contained in all publications are solely those of the individual author(s) and contributor(s) and not of MDPI and/or the editor(s). MDPI and/or the editor(s) disclaim responsibility for any injury to people or property resulting from any ideas, methods, instructions or products referred to in the content. |
© 2025 by the authors. Licensee MDPI, Basel, Switzerland. This article is an open access article distributed under the terms and conditions of the Creative Commons Attribution (CC BY) license (https://creativecommons.org/licenses/by/4.0/).
Share and Cite
Barrera Hernandez, J.E.; Tarazona Torres, L.E.; Tabares, A.; Álvarez-Martínez, D. Optimization of Bus Dispatching in Public Transportation Through a Heuristic Approach Based on Passenger Demand Forecasting. Smart Cities 2025, 8, 87. https://doi.org/10.3390/smartcities8030087
Barrera Hernandez JE, Tarazona Torres LE, Tabares A, Álvarez-Martínez D. Optimization of Bus Dispatching in Public Transportation Through a Heuristic Approach Based on Passenger Demand Forecasting. Smart Cities. 2025; 8(3):87. https://doi.org/10.3390/smartcities8030087
Chicago/Turabian StyleBarrera Hernandez, Javier Esteban, Luis Enrique Tarazona Torres, Alejandra Tabares, and David Álvarez-Martínez. 2025. "Optimization of Bus Dispatching in Public Transportation Through a Heuristic Approach Based on Passenger Demand Forecasting" Smart Cities 8, no. 3: 87. https://doi.org/10.3390/smartcities8030087
APA StyleBarrera Hernandez, J. E., Tarazona Torres, L. E., Tabares, A., & Álvarez-Martínez, D. (2025). Optimization of Bus Dispatching in Public Transportation Through a Heuristic Approach Based on Passenger Demand Forecasting. Smart Cities, 8(3), 87. https://doi.org/10.3390/smartcities8030087