Article

Predicting Urban Vitality at Regional Scales: A Deep Learning Approach to Modelling Population Density and Pedestrian Flows

1
Department of Urban Planning and Design, The University of Hong Kong, Hong Kong, China
2
Urban Systems Institute, The University of Hong Kong, Hong Kong, China
*
Author to whom correspondence should be addressed.
Smart Cities 2025, 8(2), 58; https://doi.org/10.3390/smartcities8020058
Submission received: 3 February 2025 / Revised: 25 March 2025 / Accepted: 28 March 2025 / Published: 30 March 2025

Abstract

:

Highlights

What are the major findings?
  • The UVPN model’s innovative architecture—integrating SE block and RCA bottleneck—effectively captures intricate spatial relationships and feature interdependencies, surpassing conventional deep learning models in urban vitality prediction.
  • Static and dynamic urban vitality are shaped by distinct spatial features: macro-scale road networks influence regional residential patterns, micro-scale streetscape elements drive localized pedestrian activity, and meso-scale factors such as built density and POI distribution influence both—highlighting the multi-layered nature of urban vibrancy.
What are the implications of the main findings?
  • The model’s ability to produce fine-grained, dual-dimensional vitality maps helps uncover how different scales of urban form—from regional infrastructure to local design—affect where and how people live and move.
  • UVPN provides urban planners and policymakers a powerful tool for evidence-based decision-making, supporting the design of targeted interventions at multiple spatial scales to create more sustainable, functional, and livable cities.

Abstract

Understanding and predicting urban vitality—the intensity and diversity of human activities in urban spaces—is crucial for sustainable urban development. However, existing studies often rely on discrete sampling points and single metrics, limiting their ability to capture the continuous spatial distribution of urban vibrancy. This study introduces the UVPN (urban vitality prediction network), a novel deep-learning architecture designed to generate high-resolution predictions of static and dynamic vitality at regional scales. The architecture integrates two key innovations: a SE (squeeze-and-excitation) block for adaptive feature recalibration and an RCA (residual connection with coordinate attention) bottleneck for position-aware feature learning. Applied to New York City, UVPN leverages diverse urban morphological features such as streetscape attributes and land use patterns to predict continuous vitality distributions. The model outperforms existing architectures, achieving reductions of 34.03% and 38.66% in mean squared error for population density and pedestrian flow predictions, respectively. Feature importance analysis reveals that road networks predominantly influence population density, while streetscape features strongly affect pedestrian flows, with built density and points of interest contributing to both dimensions. By advancing urban vitality prediction, UVPN provides a robust framework for evidence-based urban planning, supporting the creation of more sustainable, functional, and livable cities.

1. Introduction

Urban vitality, characterized by the intensity and diversity of human activities in urban spaces, is fundamental to creating sustainable and livable cities [1,2,3,4,5,6,7]. This vitality manifests through various forms of human activity, from daily residential routines to dynamic street life, and plays a crucial role in promoting economic development, social cohesion, and environmental sustainability [8,9,10,11,12,13,14,15,16,17]. In the context of rapid urbanization and growing urban complexity, understanding and predicting vitality patterns becomes increasingly crucial for evidence-based urban planning and management [2].
Urban vitality is intrinsically linked to urban morphology—the physical form and structure of urban environments [18,19]. Theoretical frameworks highlight that morphological factors such as urban density, diversity, and connectivity significantly shape urban vitality by influencing how spaces are used and how activities are distributed [20,21,22,23]. At the macro scale, road networks and infrastructure systems shape regional movement patterns and development intensity [22]. At the meso scale, land use configurations and built density influence both residential choices and daily activity patterns [24]. At the micro-scale, streetscape features and local amenities directly impact pedestrian behavior and street-level vibrancy [25]. Understanding these multi-scale relationships provides valuable insights for making informed decisions on infrastructure investments, public space design, and urban service provision, ultimately fostering more effective vibrant city initiatives.
Despite considerable progress in the study of urban vitality, significant challenges persist. Traditional approaches often focus on discrete sampling points or isolated locations, which fail to account for the continuous spatial distribution of vitality across urban regions. Many existing models rely heavily on statistical features for vitality estimation, limiting their ability to achieve the spatial resolution needed to capture both localized variations and broader regional trends. These shortcomings underscore the necessity for advanced modeling techniques that can address the multidimensional and complex nature of urban vitality while delivering high-resolution, spatially continuous predictions applicable to diverse and heterogeneous urban environments.
To address these challenges, this study develops UVPN (urban vitality prediction network), a novel deep-learning architecture designed for high-resolution prediction of urban vitality patterns. The objectives of this study are as follows:
(1)
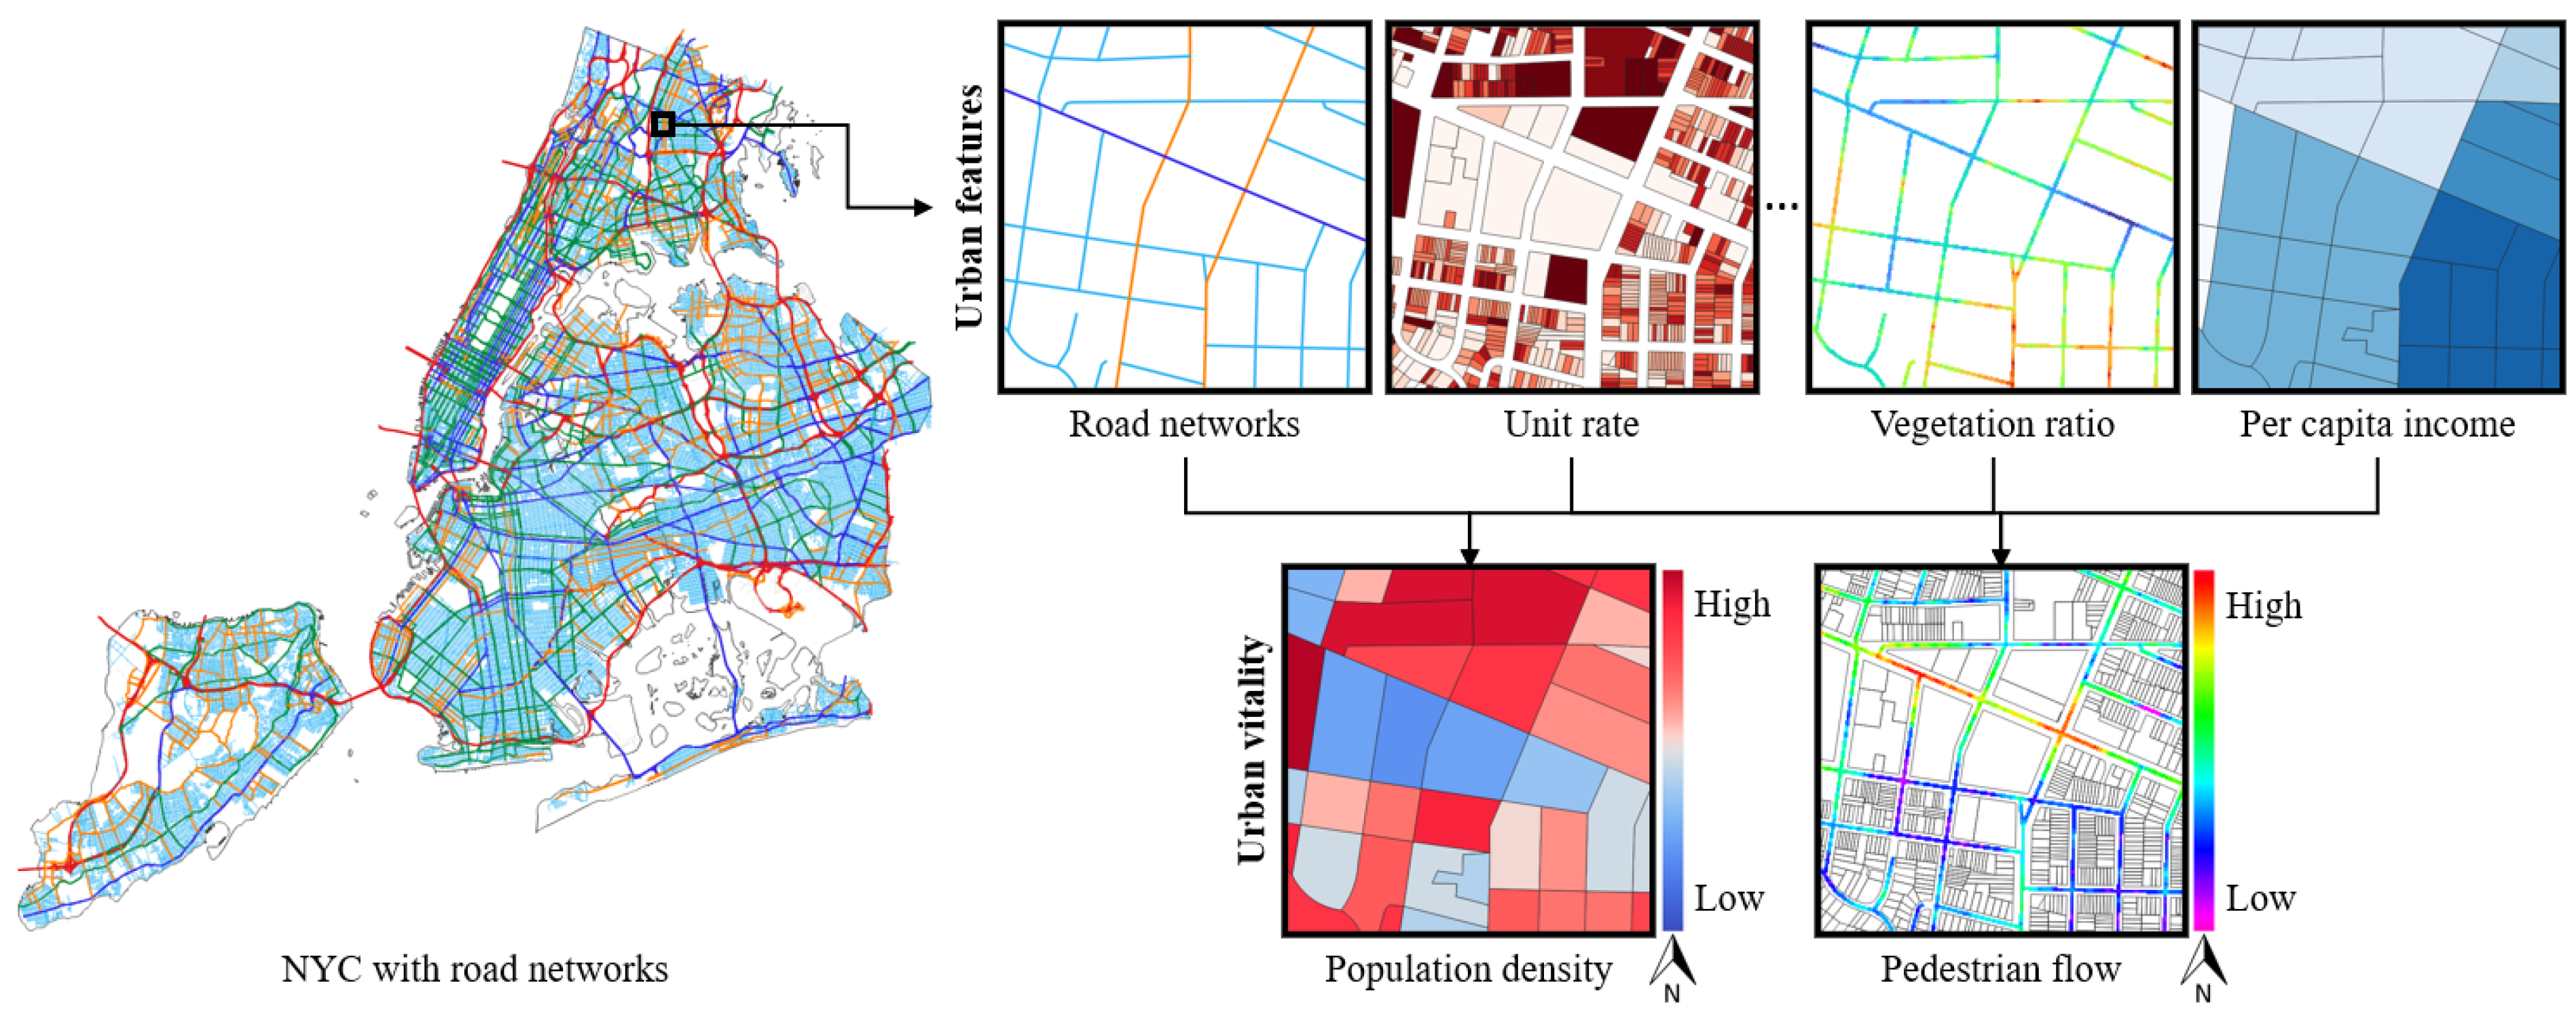
This study aims to create a unified computational framework that simultaneously predicts both static (e.g., population density) and dynamic (e.g., pedestrian flow) dimensions of urban vitality. This dual-dimensional approach addresses the limitation of single-metric models by providing a more holistic understanding of human activity patterns, capturing both long-term residential patterns and short-term street-level dynamics.
(2)
The study seeks to overcome the constraints of discrete sampling points by producing continuous spatial distributions of urban vitality at fine granularity. Leveraging advanced deep-learning techniques, the UVPN model aims to capture both localized variations and broader regional trends, enabling high-resolution predictions crucial for informed urban planning and management.
(3)
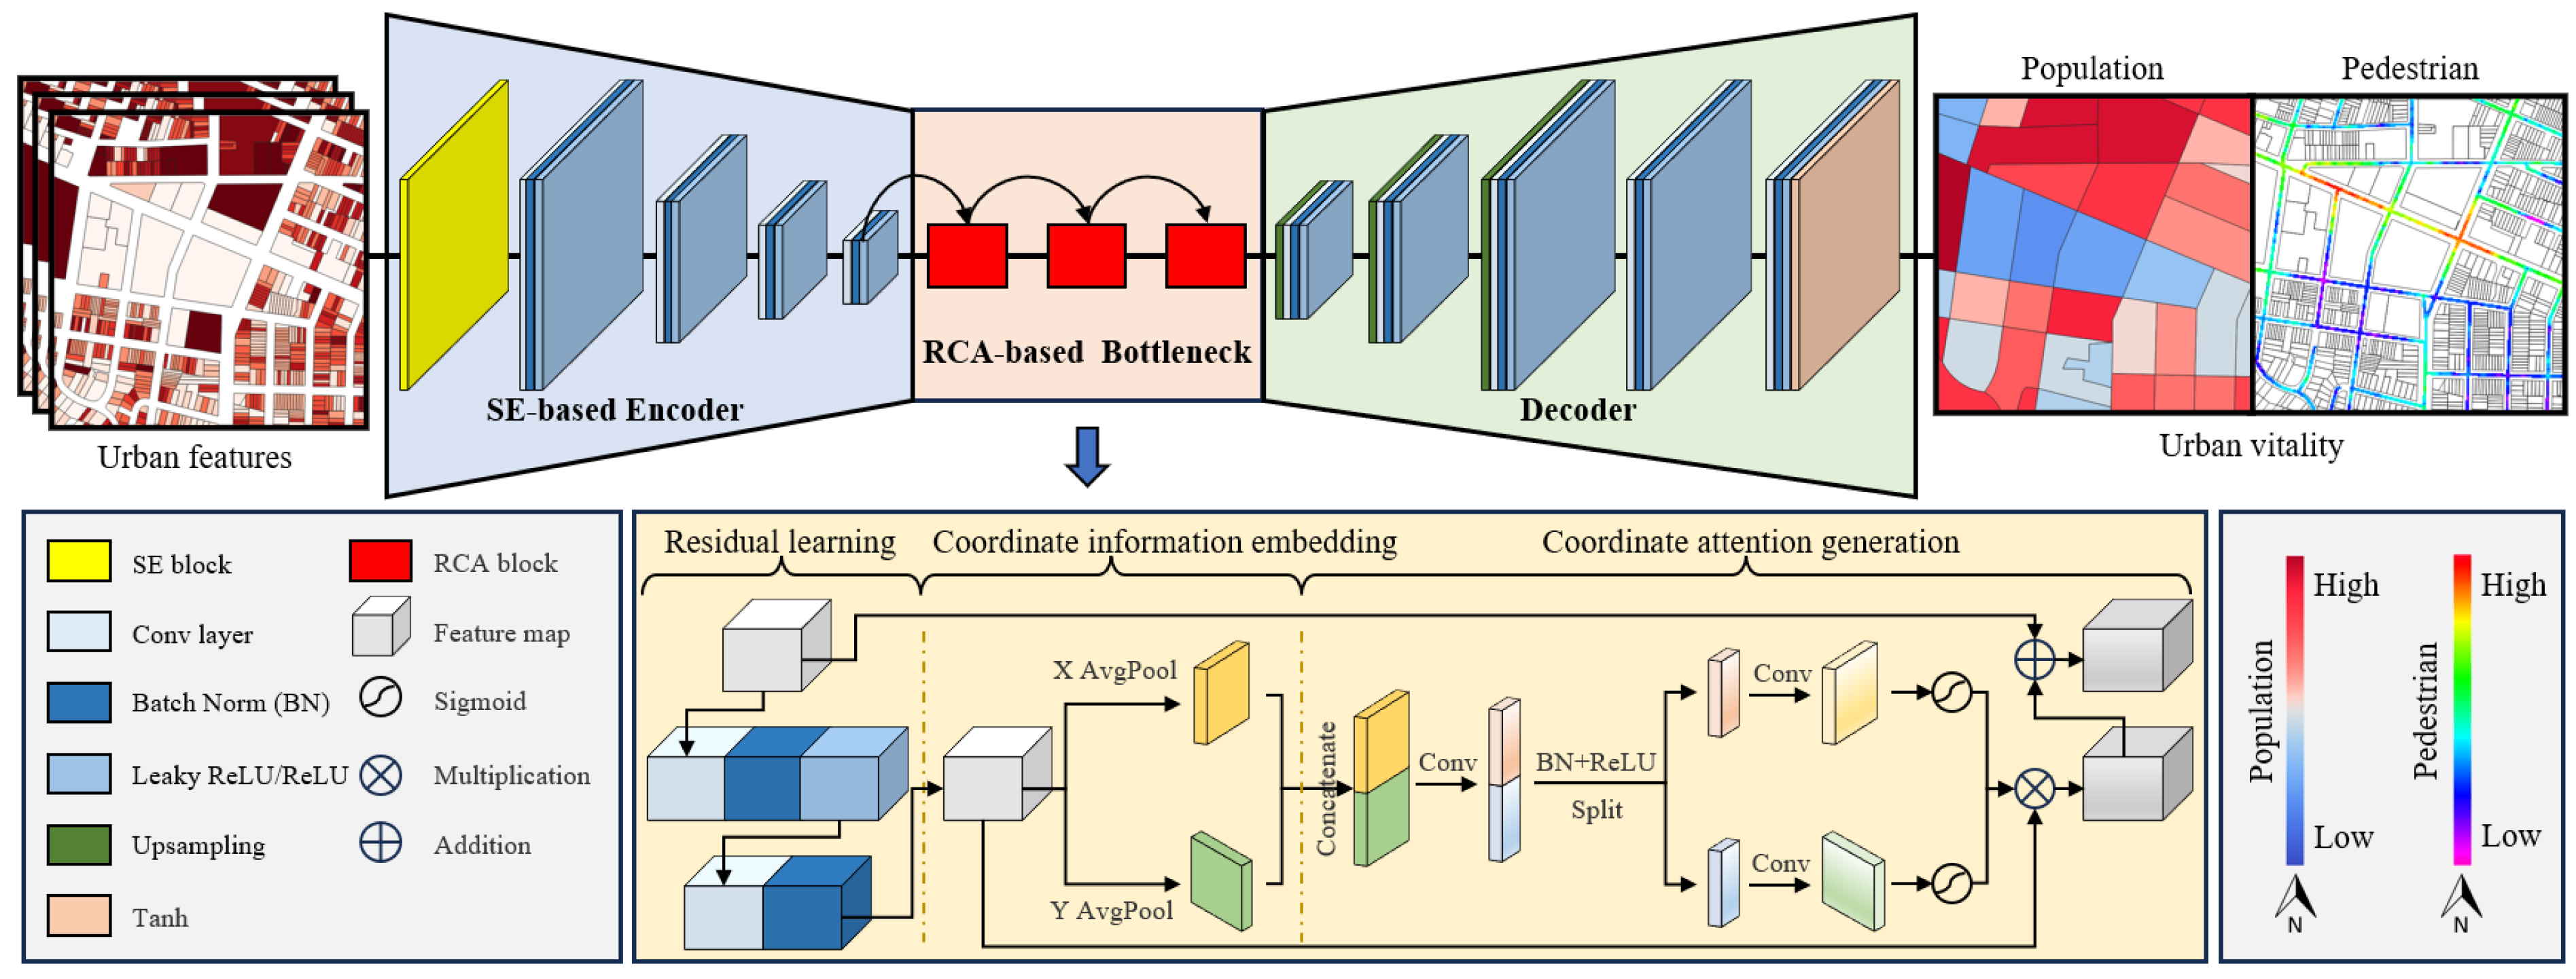
This study aims to design a model that performs reliably across diverse and heterogeneous urban environments. By integrating encoder-decoder architecture with advanced attention mechanisms—specifically, the SE (squeeze-and-excitation) block and the RCA (residual connection with coordinate attention) bottleneck—the UVPN model is designed to adaptively recalibrate feature importance and capture position-aware spatial relationships. This ensures robust performance in capturing the complex interplay between urban morphological features and vitality patterns, even in highly varied urban contexts.
Using New York City (NYC) as a case study, this research integrates multiple urban datasets, including building characteristics, land use patterns, street networks, points of interest (POI), and sociodemographic indicators, to predict continuous distributions of urban vitality. The model’s effectiveness is demonstrated through comprehensive evaluations across different boroughs and urban contexts, providing insights into how various urban elements contribute to vitality patterns. These findings not only advance the theoretical understanding of urban vitality dynamics but also offer practical implications for evidence-based urban planning and management.

2. Literature Review

2.1. Urban Vitality Concepts and Measurement

Urban vitality is a multifaceted concept that reflects the intensity, diversity, and dynamism of human activities in urban spaces. Jane Jacobs pioneered and popularized this concept, identifying four essential elements for vibrant urban areas: mixed land uses, small block sizes, varied building conditions, and high population density [26]. These principles underscore the significance of diversity, accessibility, and human-scale design in fostering dynamic and engaging urban environments. Subsequent research, building on Jacobs’ foundational ideas, has expanded the scope of urban vitality to encompass social, economic, cultural, and environmental dimensions (e.g., retail activity, business diversity, public life, and community interactions) [27,28,29]. This theoretical evolution has culminated in more comprehensive frameworks that conceptualize urban vitality as a complex, multidimensional phenomenon shaped by the interplay of physical urban morphology and human behavioral patterns, making it a critical indicator of a city’s livability, functionality, and sustainability.
Within these frameworks, urban vitality is commonly analyzed through static and dynamic dimensions, which reflect the intensity and diversity of both enduring and transient human activities in urban spaces. Static vitality, often quantified through metrics such as population density and nighttime light [22,30], captures the long-term, stable patterns of human presence and residential settlement. These patterns are influenced by factors such as housing availability, infrastructure, and urban planning policies, providing a foundational understanding of how urban spaces are utilized over time. In contrast, dynamic vitality, typically measured through pedestrian flows and public transit usage [25,31], represents the short-term, fluctuating movements and interactions of people within urban environments. This dimension highlights the immediate rhythm of urban life, illustrating how spaces enable movement, social encounters, and daily activities. Together, these static and dynamic dimensions form a comprehensive framework for analyzing urban vitality, bridging the gap between long-term residential patterns and short-term, everyday urban dynamics.
In real-world applications, measuring urban vitality faces challenges related to data availability, scalability, and the integration of diverse data sources. Early efforts relied on field surveys and observational studies to capture street-level activities and social interactions, offering valuable localized insights but lacking scalability and applicability to broader urban contexts. The emergence of urban sensing technologies has revolutionized this field, enabling researchers to leverage diverse data sources such as mobile phone records, social media check-ins, and smart card data to analyze urban vitality across various spatial and temporal scales [4,22,25]. These advanced techniques provide a nuanced understanding of the dynamic and multifaceted nature of urban vibrancy, delivering actionable insights to integrate theoretical frameworks into practical strategies for evidence-based urban planning and policymaking.

2.2. Urban Vitality Models

Many statistical models have been developed for urban vitality estimation, with empirical research demonstrating that urban morphological features such as density, diversity, and transportation accessibility significantly influence urban dynamic patterns [28]. Traditional approaches often utilize regression models to analyze these relationships [31,32]. For example, Chen et al. [32] applied ordinary least squares (OLS) regression to evaluate urban nature vitality in San Francisco, using data from census records, built environments, and social media platforms. However, these models often rely on linear assumptions, which fail to capture the inherently complex and nonlinear dynamics in real-world urban systems.
To address these limitations, machine learning methods have emerged as robust alternatives capable of modeling nonlinear interactions and accommodating high-dimensional datasets [24,25]. For example, Doan et al. [25] applied XGBoost to predict urban vitality in Manhattan by integrating data on the built environment, road vehicle usage, and air pollution levels. These models have demonstrated superior predictive performance compared to traditional regression methods, showcasing their ability to uncover intricate relationships within urban systems. However, many machine learning models focus on discrete sampling points or isolated locations, which fail to capture the continuous spatial distribution of vitality across urban regions. This limitation presents challenges for urban analysis and planning, where high-resolution and spatially continuous predictions are essential for understanding the complex spatial patterns of vitality and crafting effective, data-driven urban strategies.
Deep learning has emerged as a transformative tool in urban prediction tasks, offering unparalleled capabilities in capturing complex spatial patterns and supporting applications in regional urban design, site planning, and land value estimation [33,34,35,36]. Despite these advancements, its application in urban vitality estimation at high spatial resolutions across diverse urban environments remains limited. Expanding the use of deep learning techniques to address these gaps holds significant potential for generating more comprehensive and actionable insights into urban vitality.

2.3. Research Gaps

While urban vitality studies have made significant advancements, several critical gaps remain in the current literature. First, while existing studies have examined various aspects of urban vitality, few have attempted to simultaneously model both its static and dynamic dimensions through a unified computational framework. Second, current prediction methods often lack the spatial resolution and continuity needed to accurately represent vitality distribution, hindering their effectiveness in supporting informed decision-making for urban planning and management. Additionally, most existing studies rely on statistical urban features, limiting their ability to capture both localized variations and broader trends in regional vitality distribution. This study addresses these gaps by developing a novel deep-learning architecture that enables high-resolution prediction of both static and dynamic dimensions of urban vitality, while effectively capturing multi-scale spatial relationships across diverse urban contexts.

3. Methodology

3.1. Methodology Framework and Problem Formulation

The research methodology for estimating regional vitality distributions consists of three interconnected phases: data preparation, model development, and result analysis. The data preparation phase involves processing urban vitality labels and morphological features from diverse databases to construct high-quality training datasets. The UVPN model is then developed using an encoder–decoder architecture enhanced with channel-spatial attention mechanisms, enabling it to capture complex relationships and generate high-resolution vitality distributions. Finally, the model’s performance is rigorously evaluated across diverse urban contexts, including benchmarking against advanced deep learning models, to validate its efficacy and robustness.
In terms of urban vitality metrics (as introduced in Section 2.1), this study employs population density to represent static vitality (reflecting long-term human presence and residential patterns) and pedestrian flow for dynamic vitality (capturing street-level activities and social interactions) due to data availability. This dual-dimensional approach offers distinct yet complementary aspects of urban vitality with the following advantages: it captures both the stable foundation and fluid dynamics of urban life, providing a more complete picture than single-metric approaches. Moreover, these metrics are quantifiable and spatially continuous, making them suitable for computational modeling and high-resolution prediction.
As illustrated in Figure 1, the proposed framework leverages a deep learning approach to estimate continuous distributions of static and dynamic urban vitality measures. By processing multiple feature layers—such as built environment characteristics, land use patterns, and infrastructure networks—the model simultaneously predicts population density and pedestrian flow distributions across the urban landscape. This framework offers three key innovations over traditional methods. First, it generates continuous spatial distributions of urban vitality at fine granularity across the regional urban landscape, moving beyond the limitations of discrete sampling locations. Second, it effectively captures both localized variations and regional dynamics across diverse spatial contexts, ensuring robust predictive performance in heterogeneous urban environments. Third, it enables the estimation of continuous vitality distributions from planned urban contexts, supporting more informed urban planning and policy-making strategies during early development stages.
The problem is mathematically formulated as follows: Given an urban region R , urban morphological features are represented by X R C × H × W , where C denotes feature dimensionality (e.g., streetscape, land use, built form), and H × W represents the spatial dimensions of the region. The corresponding urban vitality distribution is denoted by P R 1 × H × W , where each element P i , j represents an urban vitality metric (population density or pedestrian flow), at a specific location R i , j . The objective of this study is to learn mapping functions f :   X     P that accurately estimate the continuous distribution of urban vitality while preserving spatial coherence across the region.

3.2. UVPN Model

Urban vitality patterns exhibit significant spatial heterogeneity, with the relationships between morphological features and vitality measures varying across different urban contexts. These patterns span multiple spatial scales, from fine-grained street-level interactions to broader neighborhood-level dynamics. Effectively addressing these complexities requires a deep learning architecture that not only integrates localized dependencies with regional dynamics but also deciphers intricate spatial interactions to accurately capture the subtleties of urban vitality. In response to these challenges, this study presents the UVPN model, a robust and innovative solution for high-resolution urban vitality prediction.
As illustrated in Figure 2, the UVPN model adopts an encoder–decoder architecture enhanced with specialized attention mechanisms for regional vitality estimation. This design introduces two key innovations: (1) the integration of a SE block, which adaptively recalibrates channel-wise feature responses to prioritize morphological features most relevant to urban vitality [37], and (2) the incorporation of an RCA-based bottleneck, which enables precise position-sensitive feature representation while preserving efficient information flow through the network [38]. The detailed configurations of these two modules are shown in Figure 3, highlighting their pivotal roles in enhancing the model’s capacity to generate high-resolution, context-sensitive urban vitality predictions.

3.2.1. SE-Based Encoder

The encoder is designed to efficiently extract and compress hierarchical representations from urban morphological features, forming the foundation for accurate urban vitality estimation. It begins with an SE module for initial channel-wise feature recalibration, followed by a series of down-sampling blocks that progressively reduce spatial dimensions while increasing the depth of feature maps.
The SE module improves feature quality by modeling channel interdependencies, enabling the network to emphasize informative features and suppress irrelevant ones. This recalibration process consists of two key operations: squeeze and excitation. The squeeze operation aggregates spatial information using global average pooling to condense the spatial dimensions ( H × W ) into a compact set of channel descriptors. For a feature map X R C × H × W , the c t h channel descriptor s c is defined as:
s c = 1 H × W   i = 1 H j = 1 W X c ( i , j )
To learn a non-mutually exclusive relationship in the squeezed information, the excitation operation models channel-wise dependencies through a gating mechanism with sigmoid activation:
e = σ ( W 2 δ ( W 1 s ) )
where δ is the ReLU function, σ is the sigmoid activation, and W 1 R C / r × C and W 2 R C × C / r are learnable parameters with reduction ratio r . The final output of the SE block is obtained by rescaling X with the activation e :
X ~ c = e c · X c
The down-sampling blocks, positioned after the SE block, consist of a convolutional layer followed by batch normalization, and LeakyReLU activation. This architecture progressively captures features at multiple scales, from fine-grained local patterns to broader urban contexts, while the reflection padding helps maintain spatial continuity at feature boundaries. The final output of the encoder produces a multi-channel feature map at a reduced spatial resolution, providing a rich hierarchical representation of urban morphological features for urban vitality estimation.

3.2.2. RCA-Based Bottleneck

The RCA-based bottleneck plays a pivotal role in the encoder–decoder architecture, enabling enhanced feature learning and multi-scale feature integration critical for accurate urban vitality estimation. This bottleneck combines residual connections with coordinate attention mechanisms to effectively refine urban feature representations. The coordinate attention mechanism embeds positional information into channel attention to highlight the region of interest, while the residual block supports hierarchical feature learning through skip connections, mitigating the degradation problem in deep networks. The architecture of the RCA-based bottleneck is illustrated in Figure 3 and consists of three stages:
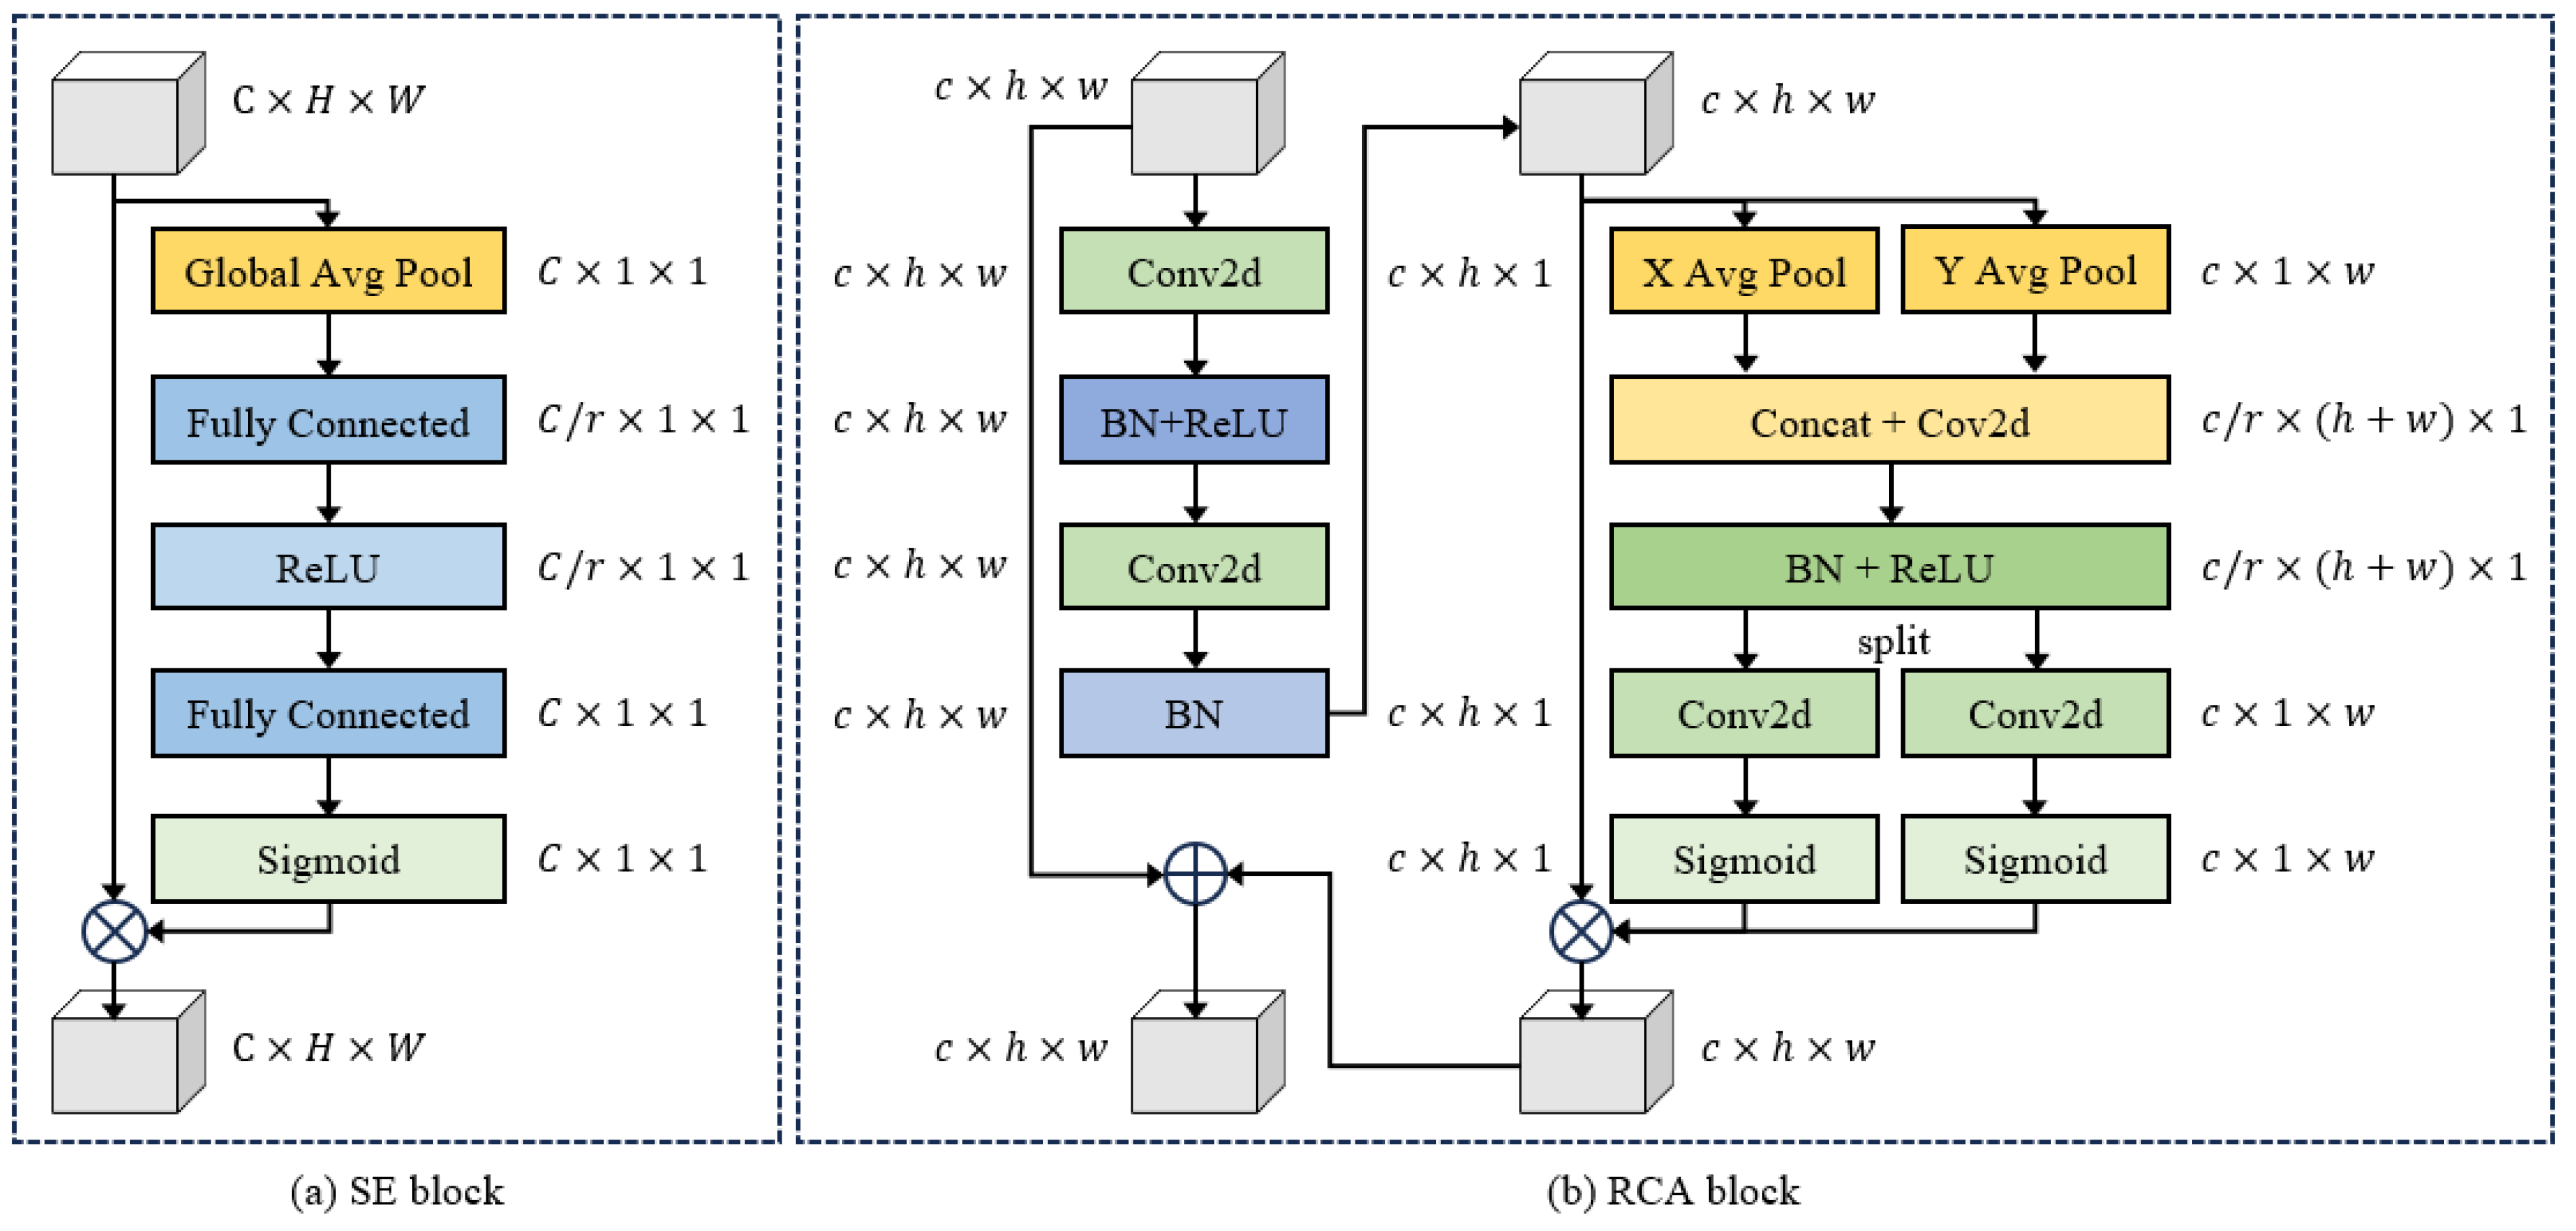
  • Residual learning: The residual block employs the principle of residual learning to facilitate adaptive feature refinement while addressing degradation issues in deep networks. For an input feature map x R c × h × w , the residual transformation is applied through a sequence of convolutional layer ( C o v ), batch normalization layer ( B N ), and ReLU activation ( δ ), defined as:
    R e s ( X ) = B N ( C o v ( δ ( B N ( C o v ( x ) ) ) ) )
  • Coordinate information embedding: To capture long-range spatial dependencies and encode precise positional information, the coordinate attention mechanism embeds direction-aware information through separate horizontal and vertical pathways. These pathways employ pooling operations with kernels h , 1 or ( 1 ,   w ) to extract position-sensitive information along the height and width dimensions to highlight objects of interest. For the c t h channel, the pooled outputs z c h ( h ) (height-specific) and z c w ( w )   (width-specific) are computed as:
    z c h ( h ) = 1 w i = 1 w x c ( h , i )
    z c w ( w ) = 1 h j = 1 h x c ( j , w )
  • Coordinate attention generation: The embedded coordinate information is used to generate attention maps that emphasize spatially and contextually significant relationships among features. This process enhances the network’s ability to capture interdependencies across spatial positions and channels, offering adaptive weightings that reflect the importance of different feature combinations. The attention generation involves the following steps: (a) The pooled feature maps z h and z w are concatenated to create an intermediate feature map f R c / r × ( h + w ) × 1 , which encoders channel-spatial dependencies by capturing feature interactions across horizontal and vertical dimensions (Equation (7)). (b) The intermediate map f is split into two separate components: f h R c / r × h × 1 for horizontal attention and f w R c / r × 1 × w for vertical attention. (c) Both f h and f w are expanded to match the original spatial dimensions, generating attention maps g h and g w that adaptively weight the features by leveraging their spatial positions and inter-channel relationships (Equations (8) and (9)). (d) Finally, the output y c ( i , j ) is computed by modulating the input features x c ( i , j ) with the corresponding attention weights g c h ( i ) and g c w j (Equation (10)).
    f = δ ( B N ( C o v ( [ z h , z w ] ) ) )
    g h = σ ( C o v ( f h ) )
    g w = σ ( C o v ( f w ) )
    y c ( i , j ) = x c ( i , j ) × g c h ( i ) × g c w ( j )
The coordinate attention mechanism enables precise spatial weighting and models inter-channel dependencies, significantly enhancing feature representation quality for urban vitality prediction. By embedding positional awareness and leveraging residual learning, the RCA-based bottleneck strengthens the network’s ability to capture complex channel–spatial relationships, ensuring robust, high-resolution, and context-sensitive performance.

3.2.3. Decoder

The decoder is responsible for reconstructing high-resolution vitality maps from the enriched feature representations generated by the RCA-based bottleneck. It employs a hierarchical structure consisting of multiple upsampling operations interleaved with convolutional layers, batch normalization, and LeakyReLU activations. This architecture enables the decoder to progressively refine compact feature maps, translating them into detailed spatial vitality distributions that capture complex patterns and dynamic relationships inherent to diverse urban environments. The final layer of the decoder utilizes a Tanh activation function, which has been empirically shown to outperform the conventional sigmoid function by effectively capturing the dynamic range and variability of urban vitality across different contexts.
To achieve precise urban vitality estimation, the network is trained end-to-end using the Adam optimizer and an L1 loss function. L1 loss, also known as mean absolute error (MAE), is chosen for its robustness to outliers and its ability to preserve fine-grained details, which is critical for modeling subtle variations in urban vitality patterns. Given a predicted vitality map P ^ and the corresponding ground truth P , the L1 loss is computed as:
L 1 = 1 n i = 1 n | P i P ^ i |
where n is the total number of elements in the vitality map, and | · | denotes the absolute value operation. This loss formulation ensures that the model captures both the global trends and fine-grained variations critical for accurate urban vitality prediction.

4. Experiments

4.1. Data Collection

New York City (NYC) is an exemplary case study for analyzing urban vitality, characterized by its intense urban concentration, diverse land use, and complex mobility dynamics. The city’s heterogeneous environment, ranging from Manhattan’s dense skyscraper districts to the more residential neighborhoods of the outer boroughs, offers a rich setting for exploring how built configurations influence urban vibrancy. In this study, urban vitality refers to the intensity and distribution of human activities across urban spaces, captured through two complementary dimensions: static vitality and dynamic vitality. Static vitality, measured by population density, reflects long-term patterns of human presence and residential choices, providing insights into how built environments shape settlement patterns [22]. Dynamic vitality, assessed through pedestrian flows, captures the rhythm of street-level activities and social interactions, highlighting how urban spaces facilitate movement, encounters, and daily life [25]. Population data are derived from the 2020 census redistricting data (CRD) at the census block level, while pedestrian flow is quantified using object detection techniques applied to Google Street View imagery.
To investigate how urban morphological features influence vitality distribution, this study integrates a diverse array of complementary datasets. As shown in Table 1, the PLUTO (primary land use tax lot output) dataset provides detailed information on building attributes and land use patterns, while OSM (OpenStreetMap) offers granular data on street network topology and POI distribution. Sociodemographic context is captured through the 2020 ACS (American community survey) and CRD datasets, which provide insights into population composition and demographic patterns. Additionally, streetscape features are enriched using Google Street View imagery, offering detailed visual and structural information about the micro-scale environment. This comprehensive integration of spatial, social, and structural data enables a robust analysis of urban vitality across diverse urban contexts. Table 1 summarizes the datasets, including their spatial resolutions, formats, and sources, highlighting the methodological robustness of this approach.

4.2. Data Preprocessing

Figure 4 depicts the data preprocessing pipeline, which converts diverse urban datasets into structured, standardized samples tailored for model training. The pipeline consists of two key stages, each addressing distinct aspects of data preparation. In the first stage, multiple data sources are integrated into cohesive feature maps through operations such as coordinate transformation, spatial joining, and feature engineering. This step ensures spatial consistency and data compatibility, unifying disparate datasets within a coherent feature framework. In the second stage, the integrated feature maps are transformed into standardized samples by aligning spatial resolutions and harmonizing feature distributions. This involves operations like rasterization, clipping, and normalization to prepare the data for effective model training. Detailed procedures for processing individual features and labels are discussed in the subsequent sections.

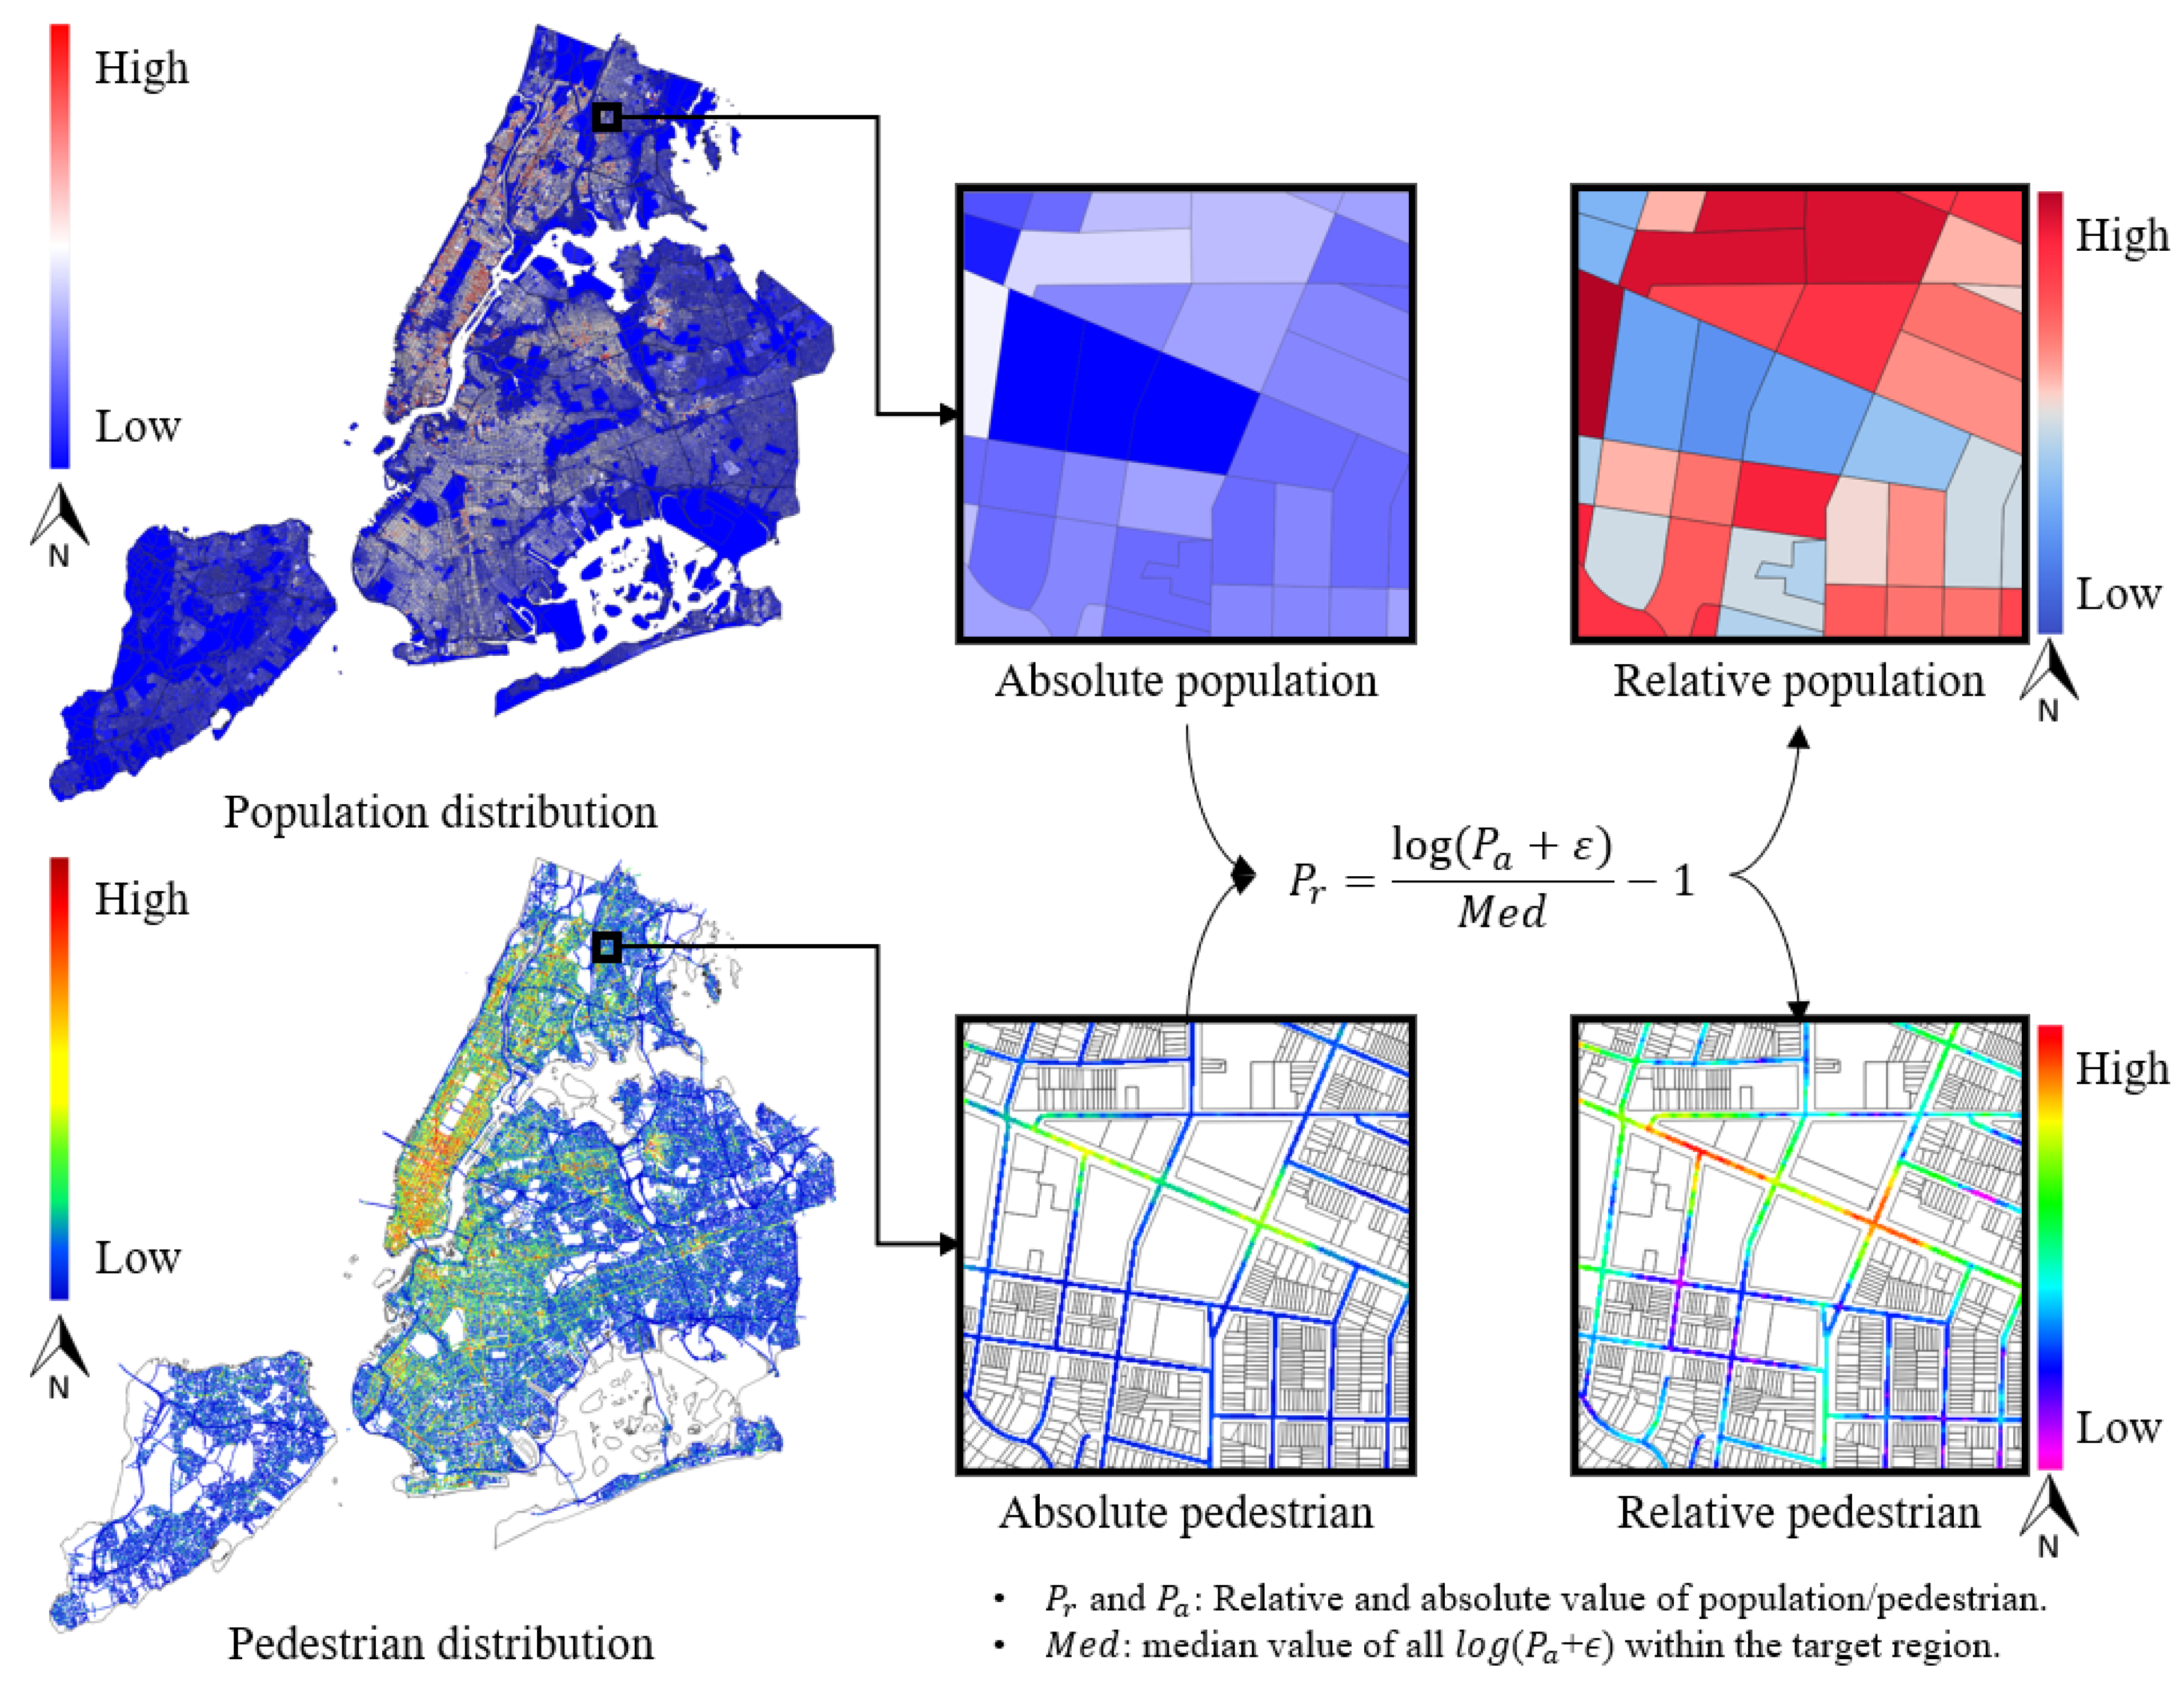
4.2.1. Label Preprocessing

Urban vitality in this study is quantified using two metrics: population density and pedestrian flows. Population density is calculated from the 2020 CRD dataset at the census block level by normalizing population counts with the corresponding block areas. Pedestrian counts are detected using a pre-trained Faster R-CNN model (ResNet-50 backbone with FPN architecture) from 1,519,908 Google Street View perspective images (Figure 5). Pedestrian counts are systematically sampled at 100-foot intervals and interpolated into a continuous spatial distribution using the inverse distance weighting (IDW) method. The spatial distributions of population density and pedestrian flows are visualized in Figure 6, revealing detailed patterns of urban vitality across NYC.
To facilitate regional vitality analysis, the urban landscape is divided into sampling windows of 2048 × 2048 feet, represented as 256 × 256 p i x e l images where each pixel corresponds to 8 feet of ground distance. This resolution strikes a balance between spatial coverage and fine-grained detail, enabling comprehensive neighborhood-level analysis while preserving high-resolution feature representation. To ensure model generalizability across diverse urban contexts, absolute measurements are transformed into relative distributions using Equation (12), which expresses pixel values as deviations from the regional median. This method captures local variation patterns while accounting for baseline differences across contexts. Statistical outliers are identified and adjusted using the interquartile range (IQR) method, followed by normalization of values to the range [−1, 1]. This standardization improves computational stability and enhances model performance by ensuring consistent scaling across all vitality labels.
P r = l o g ( P a + ε ) M e d 1
where P r and P a are relative and absolute value of vitality labels; M e d is the median value of all log( P a + ϵ) within the target region; ε is used to ensure all logged values are non-negative.

4.2.2. Feature Preprocessing

Urban vitality prediction requires the integration of diverse environmental features that capture the physical, functional, and socioeconomic characteristics of urban spaces influencing human activity. These features range from detailed streetscape attributes to broader land use patterns, demanding a systematic preprocessing approach to ensure robustness and consistency across heterogeneous urban contexts. The proposed preprocessing framework, illustrated in Figure 4, addresses two primary categories of features: numerical features representing continuous urban measurements and categorical features reflecting discrete spatial attributes.
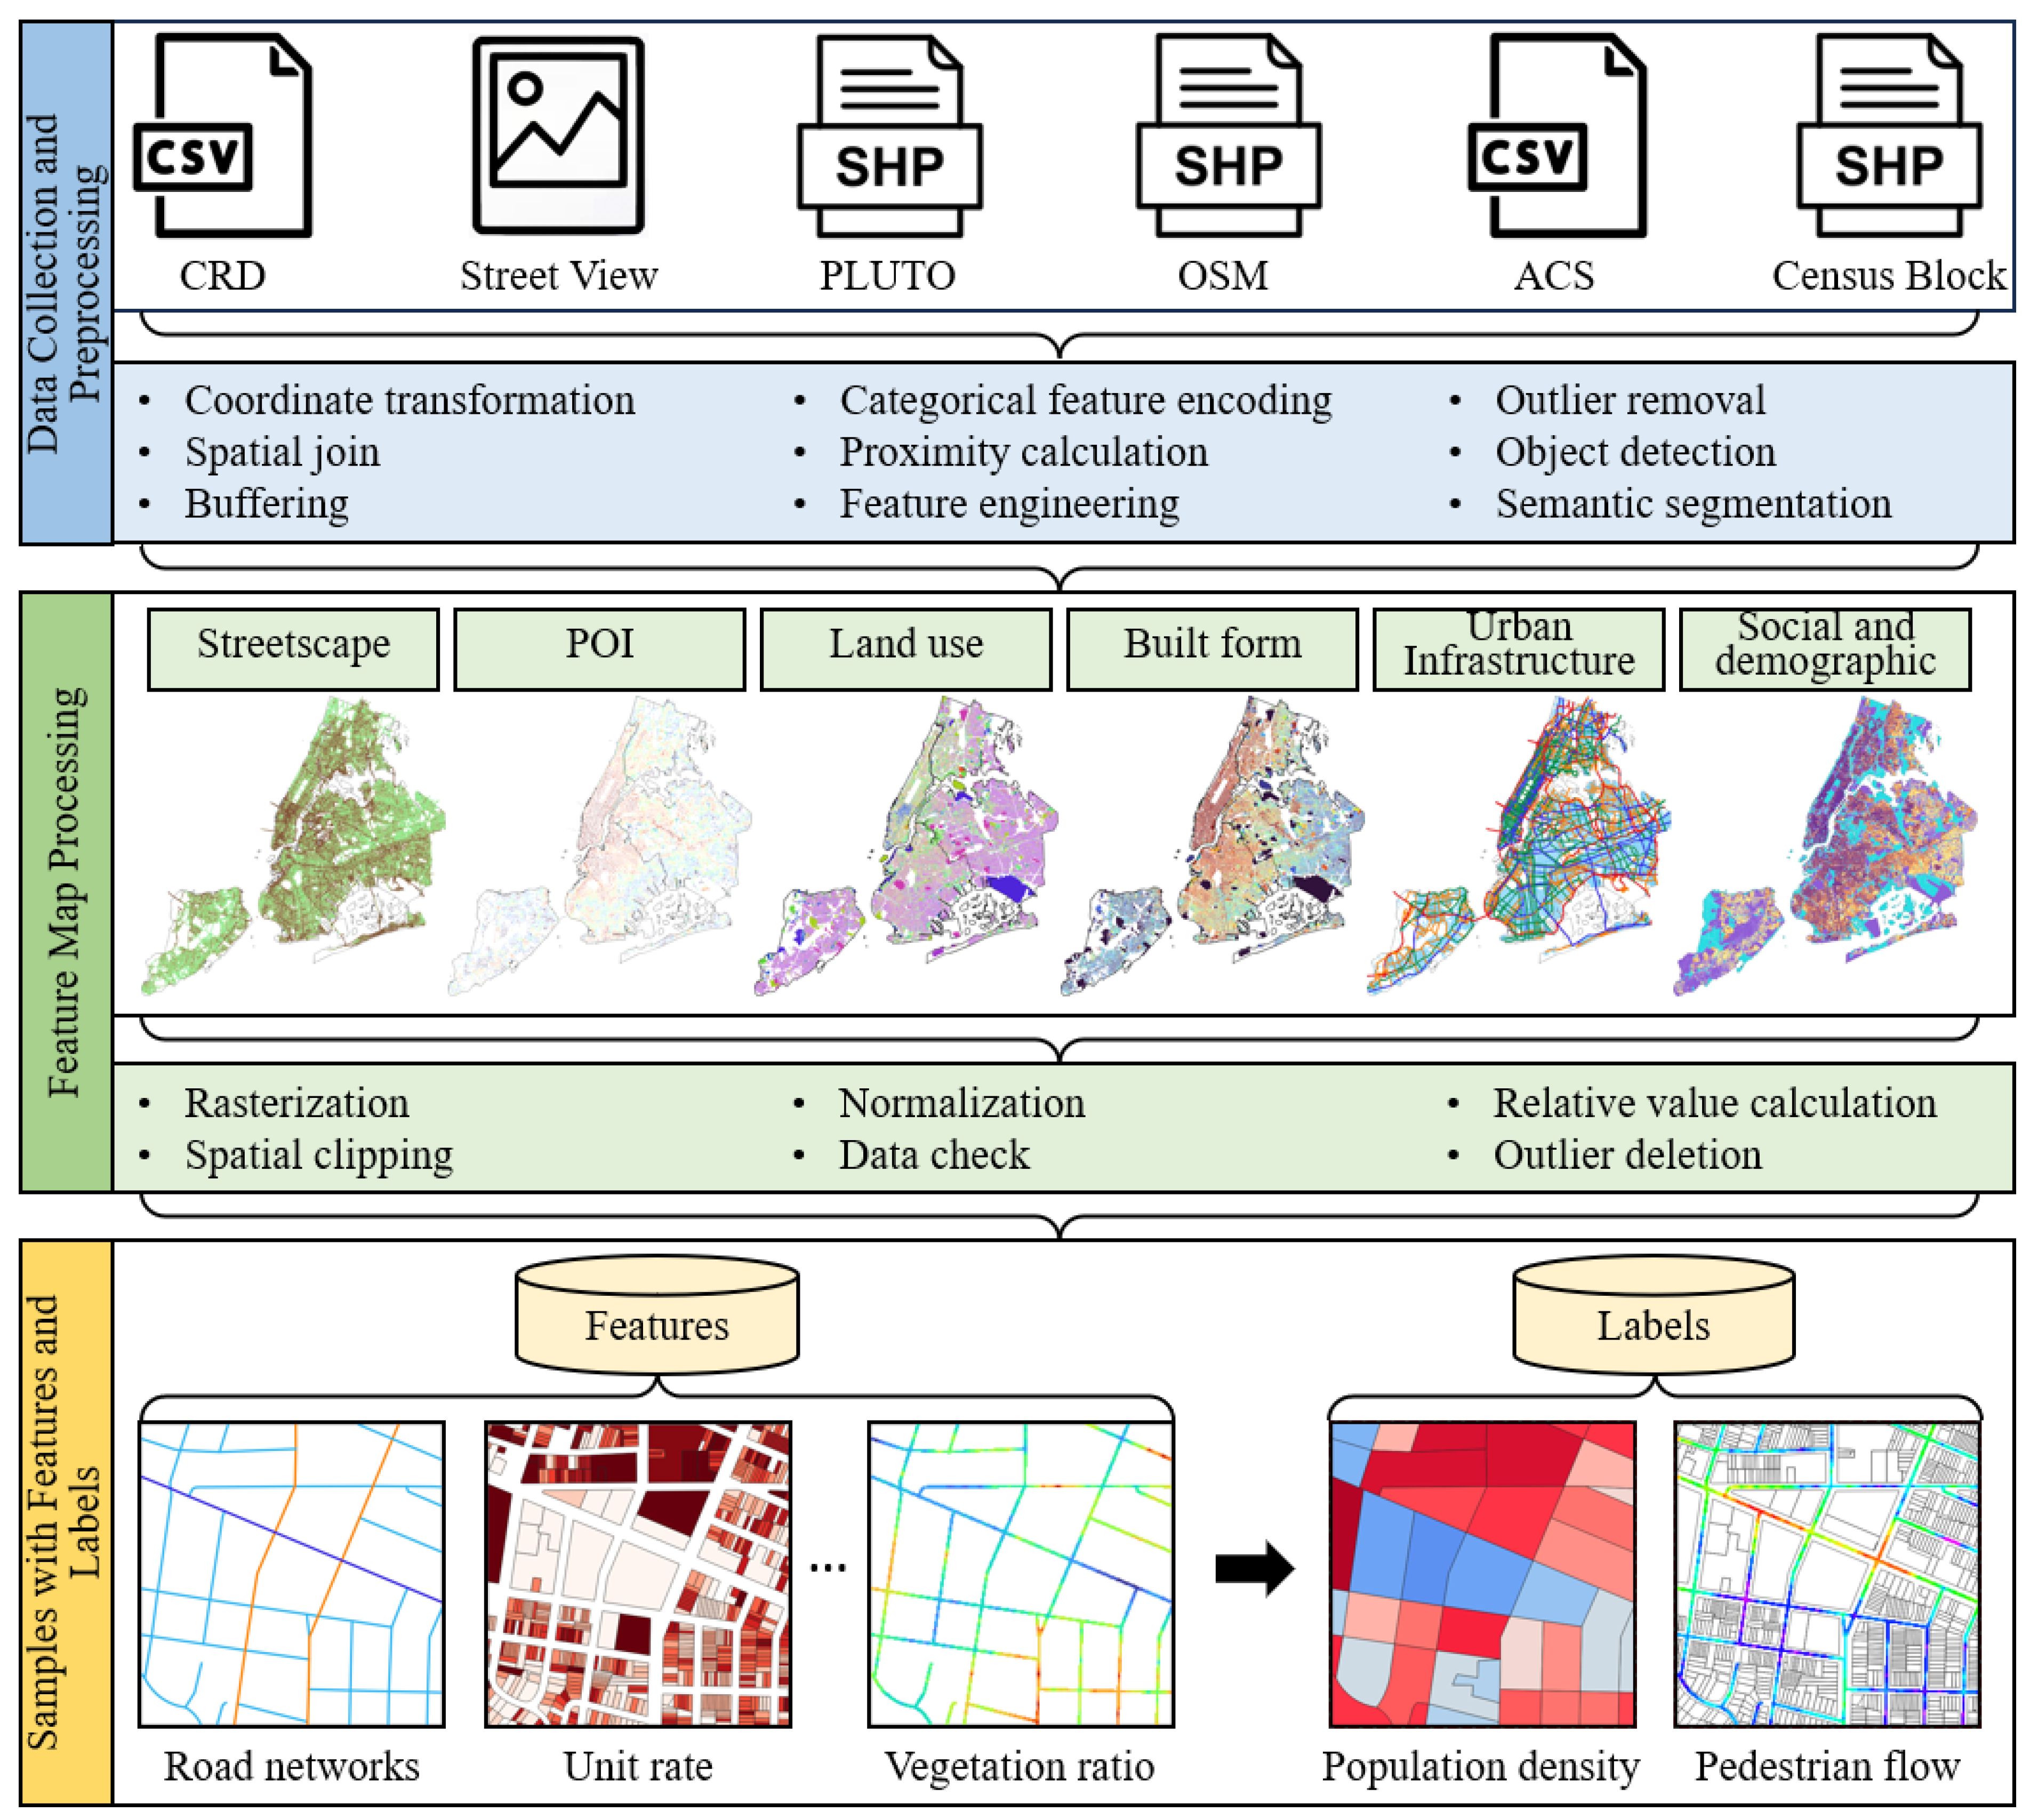
  • Numerical features: The preprocessing of numerical features aligns closely with the label processing pipeline. Unlike conventional methods relying on statistical summaries, this study represents streetscape and POI features as continuous spatial distributions to provide a more dynamic and functional characterization of urban environments. Streetscape attributes, such as building facades, vegetation coverage, and sidewalk ratios, are extracted from Google Street View imagery using SegFormer for semantic segmentation. These point-based measurements are spatially interpolated into continuous feature maps using the IDW method, effectively capturing their spatial distributions and regional effects. POI data are processed using two complementary techniques: kernel density estimation with adaptive bandwidth selection to generate density features, and network-based calculations to compute accessibility metrics as distances to the nearest facility for each POI category. To ensure consistency and enhance model generalizability, all numerical features undergo a relative value transformation using Equation (12), normalizing them relative to their regional median, consistent with the label processing strategy.
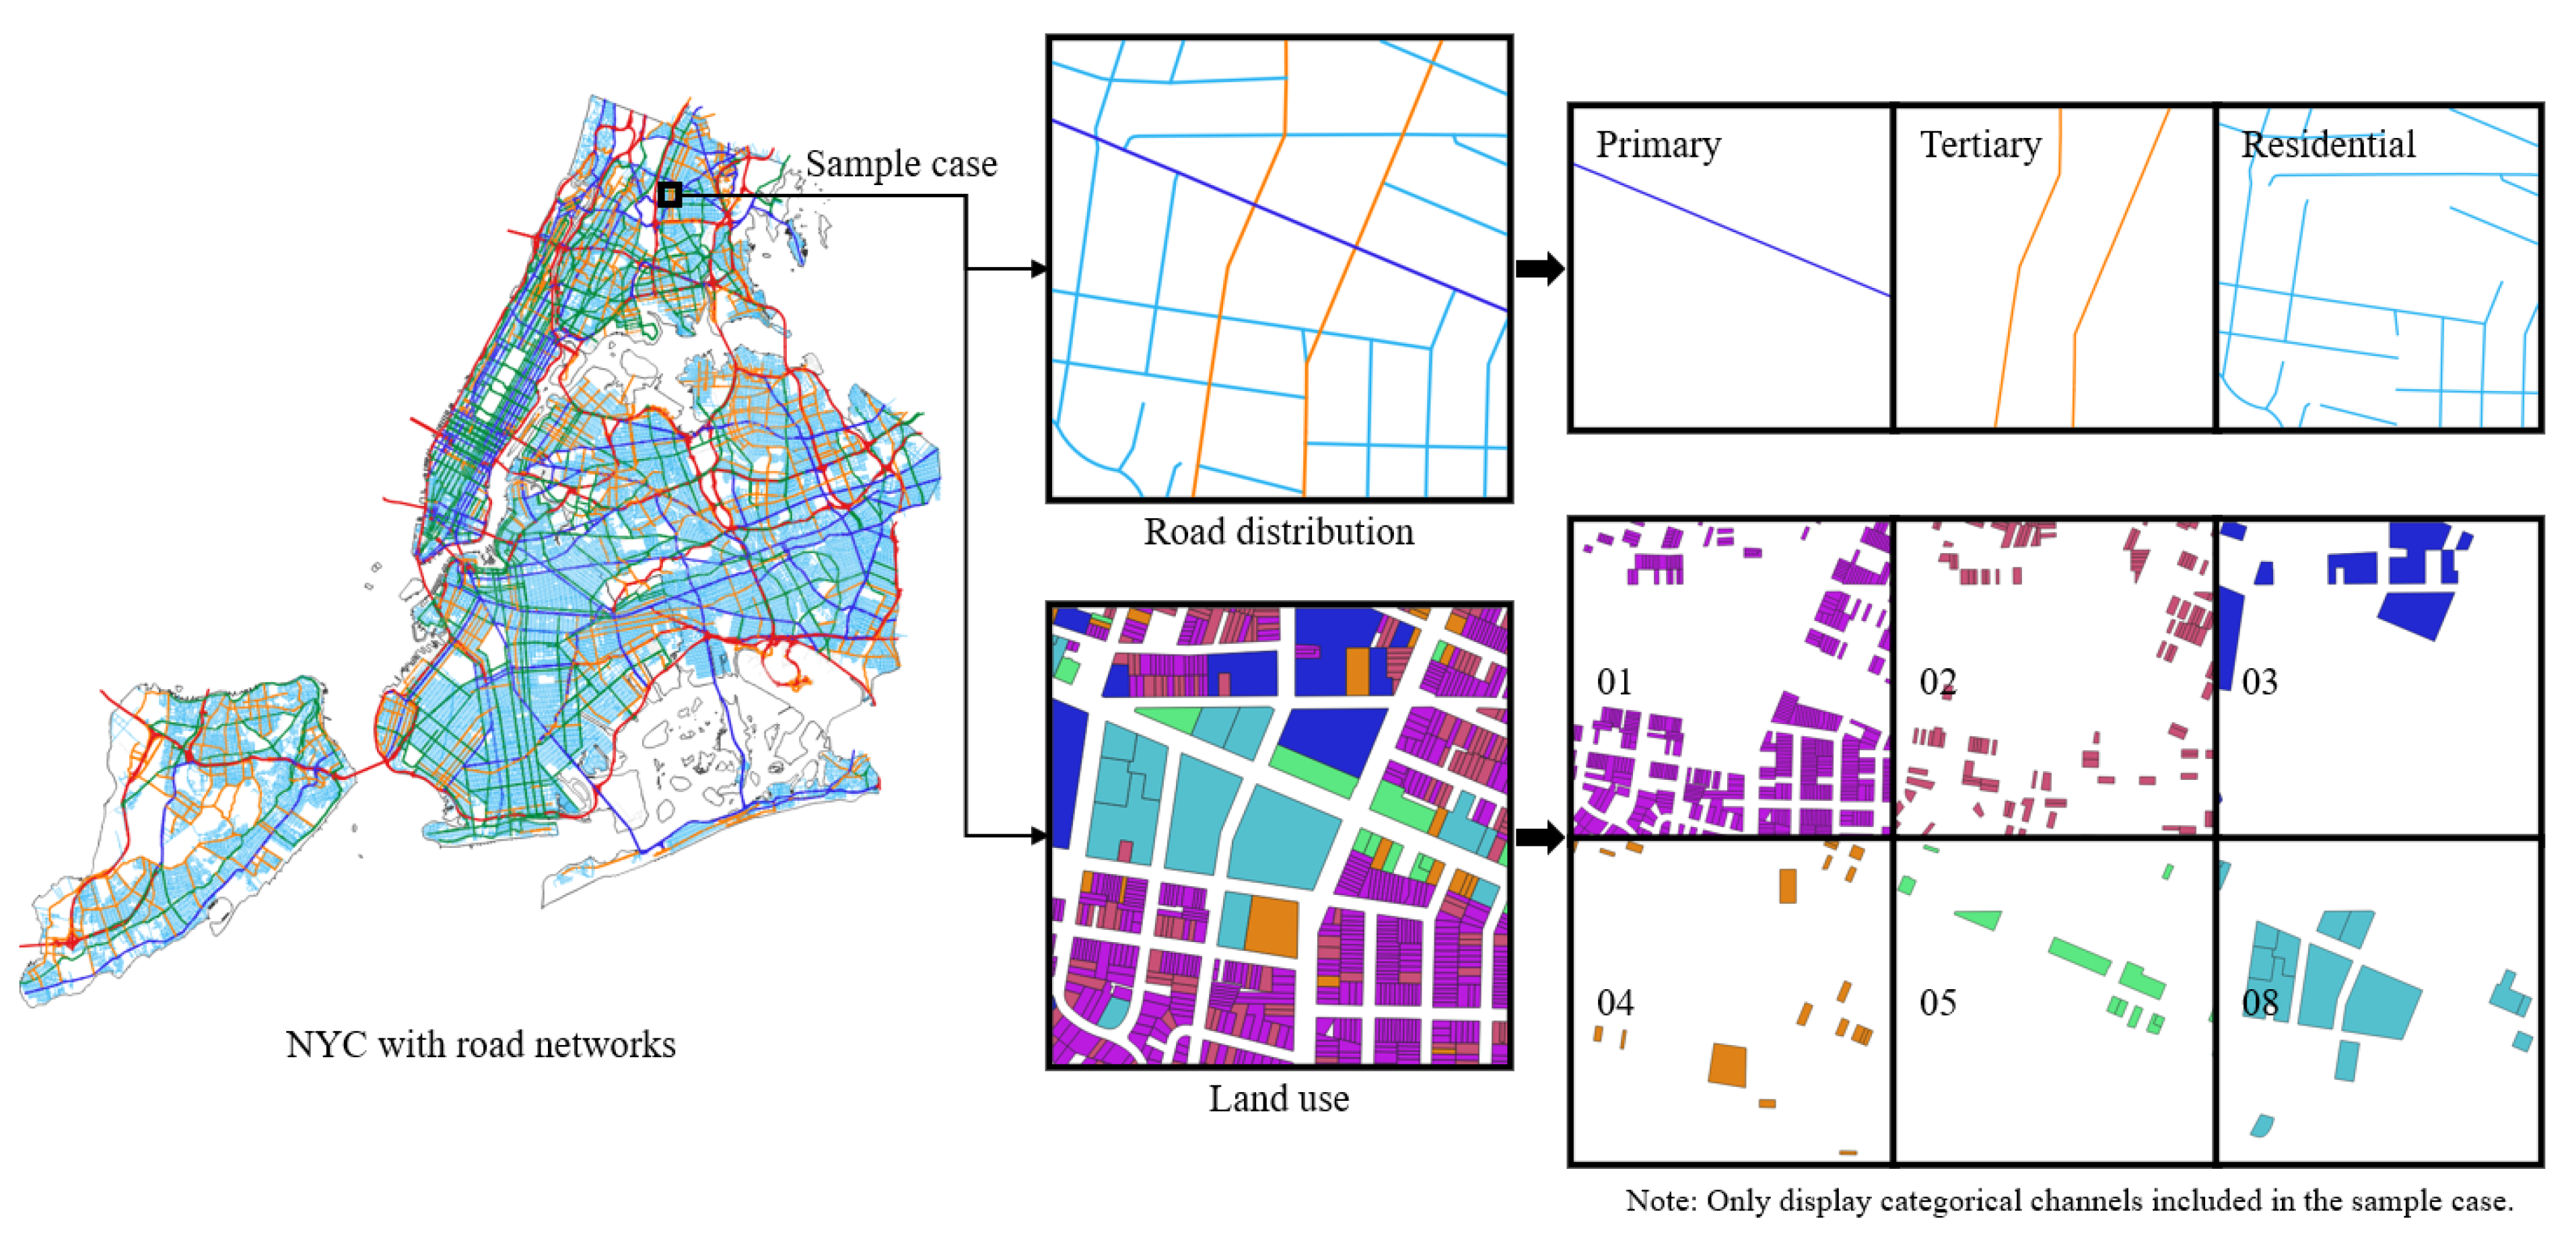
  • Categorical features: Categorical features are processed through a one-hot encoding scheme, transforming discrete spatial attributes into a multi-channel representation optimized for deep learning networks. This encoding method generates binary feature channels, where a value of 1 indicates the presence of a specific attribute and 0 indicates its absence. As shown in Figure 7, land use patterns are encoded into 11 channels, representing key urban functions such as mixed, commercial, industrial, and other categories. Similarly, road networks are encoded into 8 channels to capture hierarchical street classifications and network topology. This encoding strategy not only preserves the categorical nature of urban elements but also retains their spatial relationships, enabling seamless integration with deep learning models for effective feature learning and vitality prediction.
Following data collection and preprocessing, a comprehensive set of 67 features is compiled to facilitate urban vitality prediction, encompassing six key urban dimensions: streetscape characteristics, POI distribution, land use patterns, built form metrics, urban infrastructure, and social and demographic indicators (Table 2). The dataset includes 24 categorical features and 43 numerical features, systematically organized across multiple spatial scales to reflect the hierarchical and diverse nature of urban environments. Specifically, social and demographic indicators are measured at the CB/CT levels, land use and built form at the BBL level, and streetscape, POI, and urban infrastructure at the road network level. This multi-scale feature organization captures the complexity of urban environments, providing a robust foundation for predictive modeling of urban vitality.

4.3. Model Training and Evaluation

The experimental framework employs a random split strategy, allocating 90% of the data samples to the training set and 10% to the testing set. Model training is conducted using the PyTorch Lightning framework (v2.4.0) on an NVIDIA GeForce RTX 3090 Ti GPU. The Adam optimizer is utilized with a learning rate of α = 0.0002 and momentum parameters β 1 = 0.5 and β 2 = 0.999 . Training is performed with a batch size of 8 over a maximum of 200 epochs, with model performance evaluated every 4 epochs. To prevent overfitting, an early stopping mechanism halts training if the loss function does not improve over five consecutive evaluation checkpoints. Model validation is quantified using the L1 loss function, which measures the reconstruction error between predicted and ground truth vitality distributions. This configuration is designed to ensure robust learning dynamics while balancing computational efficiency and convergence stability.
According to existing studies, model performance is evaluated using four complementary metrics: MAE, mean squared error (MSE), structural similarity index measure (SSIM), and peak signal-to-noise ratio (PSNR) [33,34,35]. MAE and MSE quantify prediction accuracy by measuring the absolute and squared differences between predicted and ground truth values, with lower values indicating better performance and a minimum value of 0 signifying perfect accuracy. SSIM evaluates structural fidelity by assessing the similarity of spatial patterns between estimated and actual distributions, where a value of 1 denotes perfect similarity, −1 indicates complete dissimilarity. PSNR gauges the quality of the generated distributions by comparing the signal strength of the prediction relative to noise; while it has no strict upper bound, higher values indicate better quality, with values above 20 generally considered acceptable. Together, these metrics provide a comprehensive assessment of the model’s accuracy, structural fidelity, and overall prediction quality. The mathematical formulations for these metrics are defined as follows:
M A E = 1   n i = 1 n | P i P ^ i |
where P and P ^ are ground truth and predicted distribution of urban vitality distributions, with n representing the total number of pixels.
M S E = 1 n   i = 1 n ( P i P ^ i ) 2
S S I M x , y = ( 2 μ x μ y + c 1 ) ( 2 σ x y + c 2 ) ( μ x 2 + μ y 2 + c 1 ) ( σ x 2 + σ y 2 + c 2 )
where μ x and μ y are the means, σ x and σ y the standard deviations, and σ x y the covariance of pixel intensity in two image windows x and y . Constants c 1 and c 2 are introduced to stabilize the division.
P S N R = 20 log 10 M A X P 10 log 10 ( M S E ( P , P ^ ) )
where M A X P is the maximum possible pixel value in P .

4.4. Results

4.4.1. Model Performance

This study applies the proposed UVPN model to estimate regional distribution of urban vitality in NYC. As depicted in Figure 8, the model leverages urban morphology features—such as land use, road networks, and built form (partially shown in Column 1)—to predict spatial distributions of population density (Column 3) and pedestrian flow (Column 5). For comparison, ground truth distributions are provided in Columns 2 and 4. The strong visual alignment between the predicted and real-world distributions underscores the model’s effectiveness in capturing urban vitality patterns. For population density, the model effectively delineates areas of high and low concentrations, reflecting urban living patterns and residential choices across diverse urban contexts. Similarly, for pedestrian flow, the model accurately identifies high-activity corridors and low-traffic zones, capturing the intensity of foot traffic and street-level activity.
Quantitative evaluation further supports the robustness of the UVPN model in urban vitality estimation. For population density, the model achieves an MAE of 0.0679, MSE of 0.0162, SSIM of 0.6479, and PSNR of 20.0128. Pedestrian flow predictions yield even stronger performance, with an MAE of 0.0480, MSE of 0.0052, SSIM of 0.9784, and PSNR of 24.2188. These metrics validate the model’s ability to accurately capture both large-scale distribution patterns and fine-grained spatial variations. The results underscore the model’s versatility to learn and generalize the complex relationships between urban morphology features and vitality indicators, confirming its reliability across diverse urban contexts.

4.4.2. Feature Importance

To identify the key factors influencing urban vitality, feature importance is analyzed using the attention weights derived from the SE blocks in the UVPN model. The results reveal that urban vitality patterns are shaped by a hierarchical interplay of urban morphological features across different spatial scales. Road networks, particularly tertiary, residential, secondary, and primary types (with feature importance exceeding 0.99), emerge as the primary determinants of population density, as their hierarchical structure inherently reflects urban development intensity and residential density variations across regions. For pedestrian flows, streetscape elements such as roads, sidewalks, sky, buildings, and vegetation (with feature importance of 1, 0.97, 0.73, 0.68, and 0.63) exhibit the strongest influence, as their physical configuration creates natural movement pathways that guide pedestrian circulation and space utilization. Additionally, built density and POI distribution exhibit significant importance in influencing both dimensions of urban vitality, as they directly affect residential capacity and daily movement patterns. These findings underscore the complex interplay between macro-scale infrastructure (e.g., road networks), meso-scale characteristics (e.g., built density and POI distribution), and micro-scale elements (e.g., streetscape features) in shaping static and dynamic vitality patterns in urban environments.
The UVPN model not only excels at predicting the regional distribution of urban vitality but also provides critical insights into the factors shaping it, making it a powerful tool for urban analytics and practical applications. By analyzing the spatial organization of population density and the dynamic patterns of pedestrian flows, the model uncovers how urban morphological and functional elements interact to influence human activities. Its ability to identify key drivers—such as road networks, streetscape features, built density, and POI distribution—enables a deeper understanding of the complex relationships between urban form and vitality. These insights can guide evidence-based urban planning and policymaking, helping stakeholders design targeted interventions to optimize land use, enhance mobility networks, and foster vibrant public spaces. The UVPN model’s capacity to link predictive accuracy with actionable urban intelligence positions it as a valuable tool for creating more sustainable, livable, and resilient urban environments.

4.5. Performance Comparison

4.5.1. Algorithm Comparison

To validate the effectiveness of the UVPN model for urban vitality estimation, its performance is compared against several commonly used deep learning architectures, including U-Net, EncoDeco (ResBlock), and EncoDeco (SE and ResBlock). To ensure fair comparisons, all models are trained under identical conditions using the Adam optimizer with a learning rate of 0.0002 and a batch size of 8. Training is conducted for up to 200 epochs, with an early stopping mechanism that monitors validation loss every four epochs, terminating training if no improvement is observed for five consecutive checks.
Figure 9 and Table 3 present the comparative performance, highlighting substantial improvements achieved by the UVPN model across all evaluation metrics. For population density, the UVPN model achieves significant reductions in error metrics (MAE: −9.94%, MSE: −34.03%) and improvements in quality metrics (SSIM: +0.62%, PSNR: +5.48%) compared to competing architectures. The improvements are even more pronounced for pedestrian flow predictions, with reductions in MAE and MSE by 20.81% and 38.66%, respectively, and increases in SSIM and PSNR by 0.34% and 7.16%. Visual analyses in Figure 9 corroborate these quantitative results, showing that the UVPN model consistently generates predictions that closely align with ground truth distributions, effectively capturing both large-scale vitality trends and fine-grained spatial variations across diverse urban contexts.
U-Net, used in urban studies for tasks such as land value estimation and automated site planning, excels at capturing fine-grained spatial details but can struggle with modeling long-range dependencies in complex urban systems [33,35]. EncoDeco with ResBlock, while effective in handling high-dimensional urban features, may face challenges in precisely modeling localized variations due to its reliance on global feature representations [34]. To address these limitations, the UVPN model integrates the SE block and the RCA bottleneck, which synergistically enhances feature representation and prediction accuracy. The SE block utilizes a squeeze-and-excitation mechanism to adaptively recalibrate channel-wise feature importance, enabling the model to dynamically prioritize relevant urban morphological features. Complementing this, the RCA bottleneck introduces coordinate attention through separate horizontal and vertical attention branches, generating position-specific weights that capture fine-grained spatial interdependencies. This dual attention mechanism improves the model’s spatial sensitivity, allowing it to precisely model how urban elements interact at specific locations to influence activity patterns. Together, these mechanisms synergistically optimize both feature importance and spatial relationships, enabling the UVPN model to deliver superior ability in urban vitality prediction.

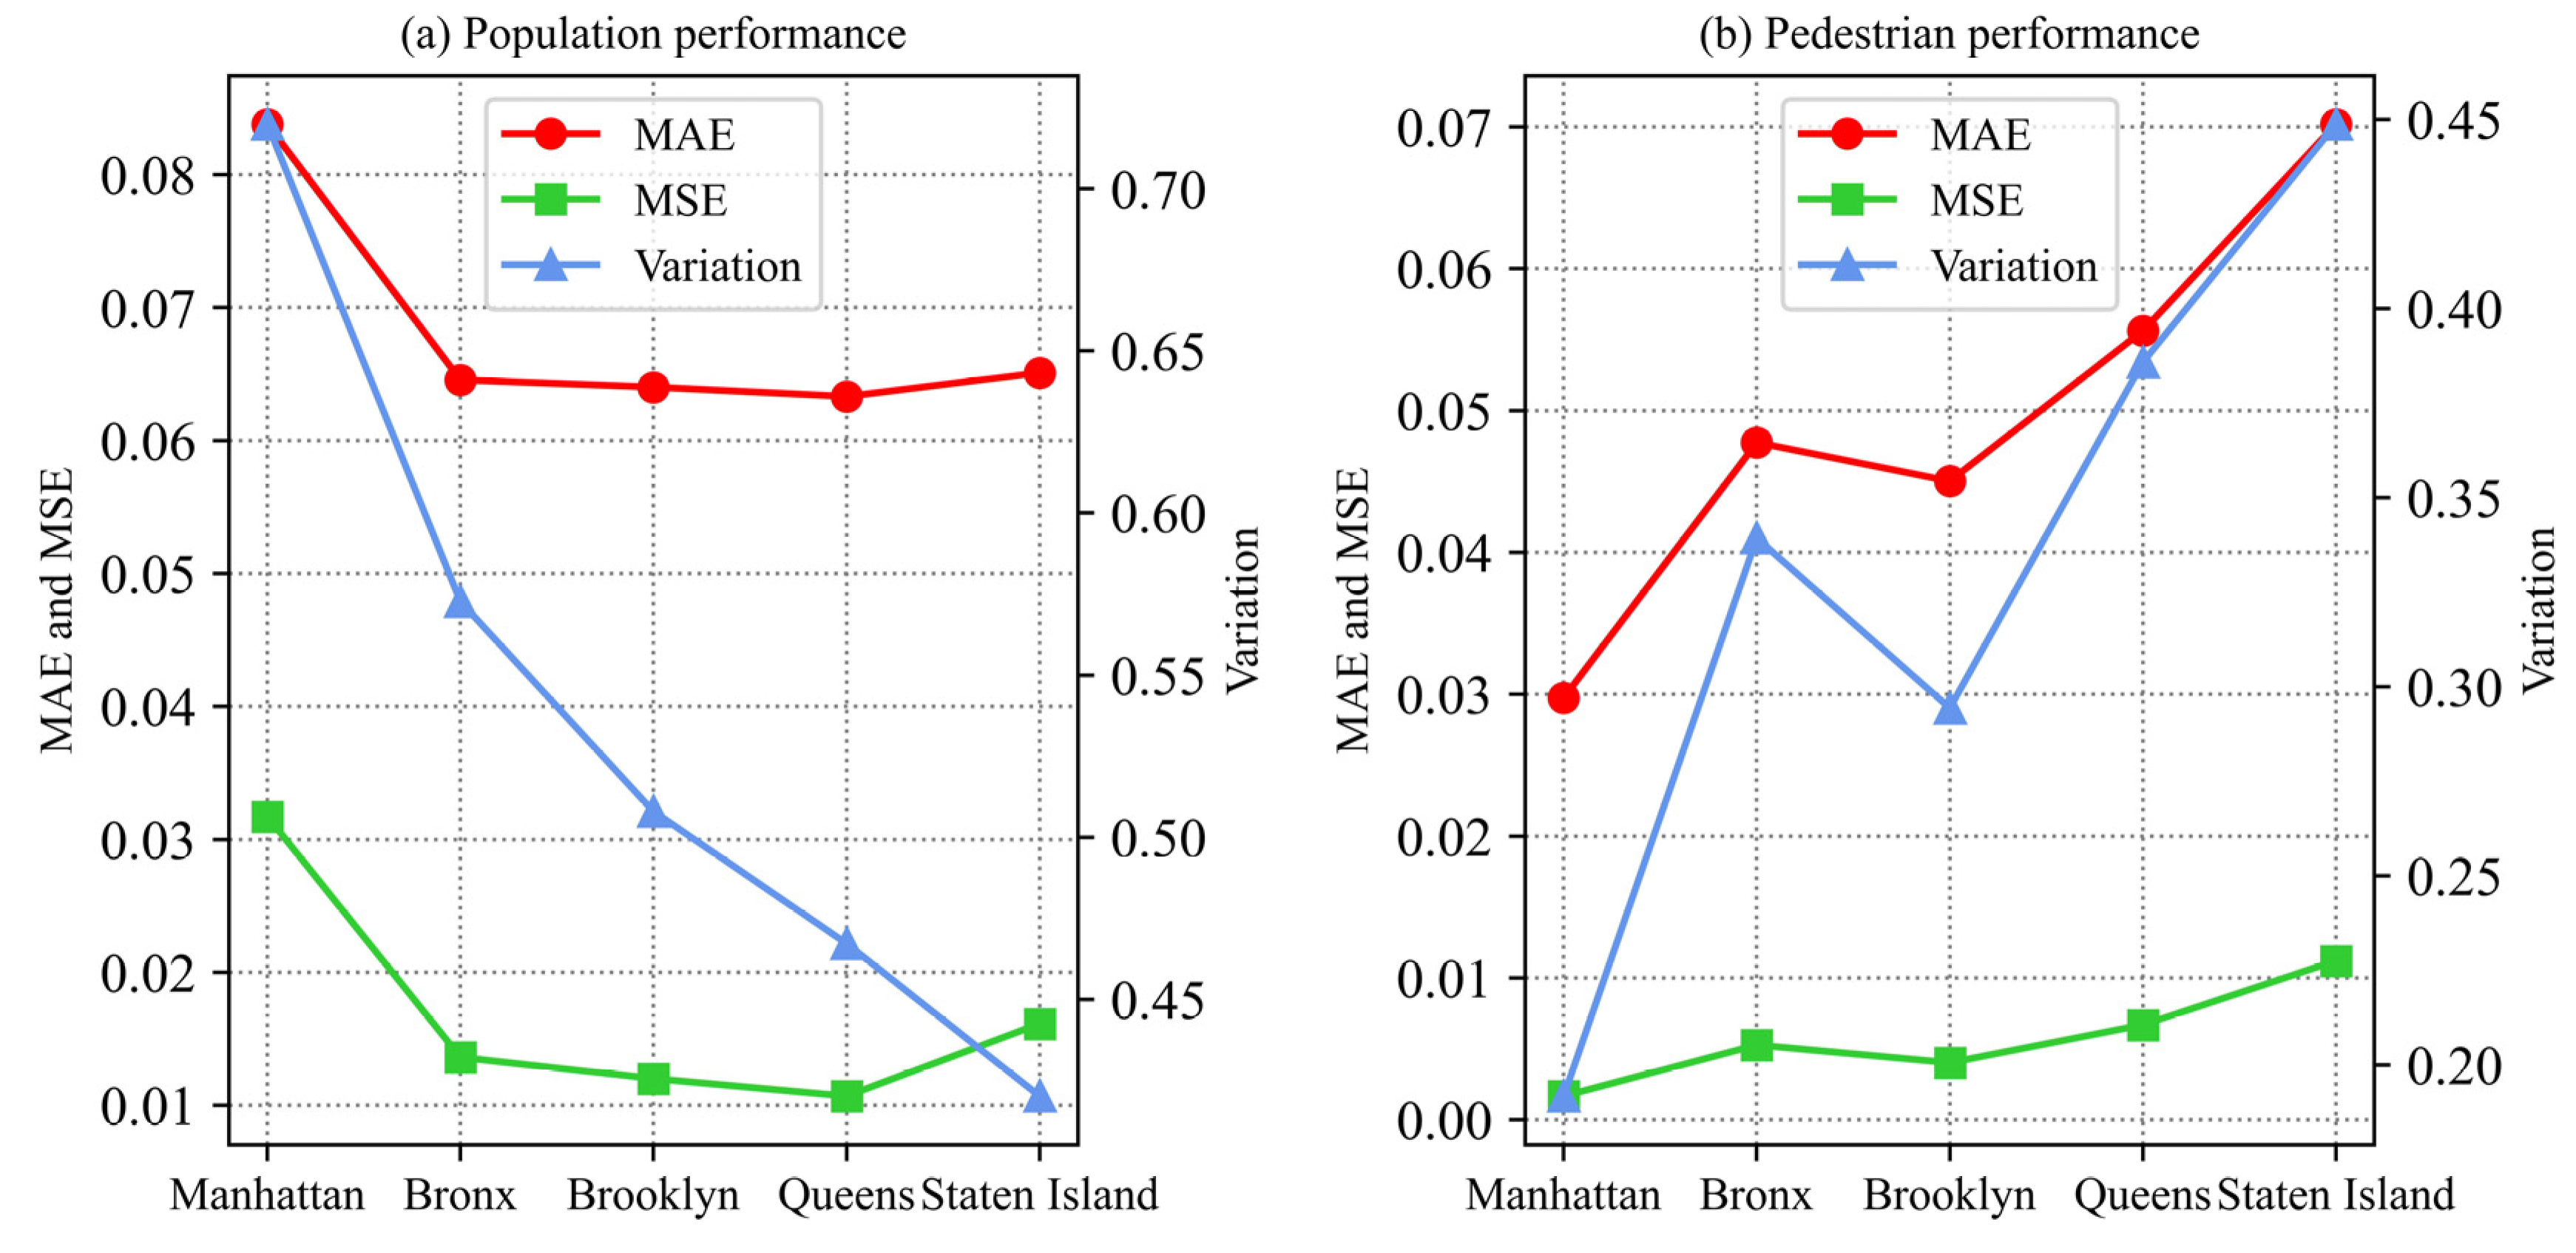
4.5.2. Model Performance in NYC Boroughs

To assess the robustness of the UVPN model across diverse urban contexts, its performance is evaluated in NYC’s five boroughs. Figure 10 illustrates the model’s error metrics (MAE, MSE) alongside urban vitality variation (quantified as the mean distance to regional median vitality values). For population density, a strong correlation is observed between prediction accuracy and vitality variation across most boroughs. Manhattan, with the highest vitality variation (variation = 0.7198), exhibits the largest prediction error (MAE = 0.0838), whereas Queens, characterized by lower vitality variation (variation = 0.4672), achieves improved accuracy (MAE = 0.0633). Staten Island deviates from this pattern, likely due to limited training samples representing its distinctive suburban morphology. For pedestrian distribution, a more pronounced linear relationship emerges between error metrics and vitality variability. Manhattan demonstrates the highest prediction accuracy (MAE = 0.0297) due to its relatively low vitality variation (variation = 0.1918), while Staten Island shows higher errors (MAE = 0.0702) alongside substantial vitality variability (variation = 0.4487).
This borough-level analysis provides two critical insights into urban vitality prediction. First, prediction accuracy is closely linked to the internal variability of urban vitality patterns. Homogeneous distributions yield consistently higher accuracy, whereas regions with extreme deviations from median vitality values present significant modeling challenges. Second, urban morphological characteristics play a pivotal role in influencing model performance. Dense, grid-like structures such as those in Manhattan facilitate accurate pedestrian flow predictions despite high population variability. Conversely, suburban, dispersed patterns typical of Staten Island pose challenges in capturing both population density and pedestrian distributions effectively. These findings underscore the need for refining and tailoring the UVPN model to address the unique characteristics of different urban contexts, enhancing its applicability and accuracy in diverse urban environments.

4.6. Discussion

The UVPN model represents a significant methodological advancement in the prediction of urban vitality, offering high-resolution, spatially continuous distributions of both static and dynamic vitality metrics. The model’s innovative architecture, particularly the integration of the SE block and RCA bottleneck, enables it to capture complex spatial relationships and feature interdependencies, surpassing typical deep learning models in urban vitality prediction. The study underscores the multi-scale nature of urban vitality, where macro-scale factors such as road networks drive regional residential patterns, and micro-scale factors such as streetscape features influence localized pedestrian activity, while meso-scale factors such as built density and POI distribution influence both. These findings align with classical urban theories, such as Jane Jacobs’ principles of mixed-use development and human-scale design, reinforcing the importance of fine-grained urban environments in fostering vibrancy. The model’s ability to disentangle these multi-scale interactions offers a robust framework for understanding how urban morphology shapes human activity patterns.
The implications of these findings hold significant practical value for urban planning and policy-making. By generating high-resolution predictions of urban vitality, the model enables planners and policymakers to evaluate how various urban design strategies influence residential patterns and pedestrian flows and identify areas with imbalanced static and dynamic vitality patterns for targeted interventions. This capability allows for the design of coordinated strategies across macro-, meso-, and micro-scale to foster vibrant urban spaces. Ultimately, the UVPN model serves as a powerful tool for evidence-based decision-making, equipping stakeholders with actionable insights to develop more sustainable and livable cities.
However, this study has limitations that warrant discussion and future exploration. While population density and pedestrian flow are the primary focus due to data availability, urban vitality is a multidimensional concept that also encompasses economic activity, social interactions, and cultural vibrancy. These dimensions, though not addressed here, represent critical areas for future research to deepen the understanding of the complex relationship between the built environment and urban vitality.
Another key concern is the reliance on Google Street View imagery, which presents both spatial and temporal constraints. Spatially, Google Street View coverage remains uneven across urban contexts, particularly in developing regions or areas with restrictive data policies, potentially limiting the model’s applicability. Temporally, while Google Street View provides valuable streetscape data, its static nature captures only discrete moments in time, failing to fully account for diurnal, weekly, or seasonal variations in urban vitality. Although the data collection process mitigates some variability by capturing localized areas in a single pass—ensuring relative consistency for nearby locations (effective in relative pedestrian value estimation)—this approach does not account for broader temporal dynamics. Future research should address these limitations through a multi-faceted approach: (1) integrating alternative data sources, such as satellite imagery, crowdsourced geotagged photos, or real-time sensor networks to enhance spatial coverage in regions with sparse street view data; (2) incorporating longitudinal mobility datasets (e.g., GPS traces, mobile device data) and time-series analyses to better capture temporal vitality patterns across different temporal scales; (3) validating the model across diverse urban contexts with varying densities, morphologies, and cultural characteristics. This comprehensive strategy would enhance the model’s robustness, generalizability, and practical utility as a decision-support tool for urban planning and sustainable development.

5. Conclusions

This study introduces the UVPN, a novel deep learning model designed to predict high-resolution, spatially continuous distribution of urban vitality at regional scales. By integrating generative architecture with advanced attention mechanisms, the UVPN effectively captures the complex relationships between urban morphology and vitality patterns. Applied to NYC, the model outperforms existing architectures, reducing MSE by 34.03% for population density and 38.66% for pedestrian flows, respectively. The findings highlight that road networks primarily influence population density, while streetscape features strongly affect pedestrian flows, with built density and POI contributing to both dimensions of urban vitality.
The UVPN model represents a significant advancement in urban vitality research by offering a unified framework capable of simultaneously predicting both static and dynamic vitality. This dual-dimensional approach provides a comprehensive understanding of how urban morphology influences human activity patterns, enabling evidence-based urban planning and policy development. Its robust performance across diverse urban contexts underscores its potential as a versatile tool for addressing the complexities of urban systems, paving the way for more sustainable, functional, and livable city development.

6. Declaration of Generative AI and AI-Assisted Technologies in the Writing Process

During the preparation of this work, the authors used ChatGPT 4o to improve readability and language. After using this tool, the authors reviewed and edited the content as needed and take full responsibility for the content of the publication.

Author Contributions

Conceptualization, F.J. and J.M.; methodology, F.J.; software, F.J.; validation, F.J.; formal analysis, F.J.; investigation, F.J.; resources, F.J. and J.M.; data curation, F.J.; writing—original draft preparation, F.J.; writing—review and editing, F.J.; visualization, F.J.; supervision, J.M.; project administration, J.M.; funding acquisition, J.M. All authors have read and agreed to the published version of the manuscript.

Funding

This study was supported by the University Research Committee (URC) of The University of Hong Kong through the Seed Fund for Collaborative Research (Grant No. 2207101592).

Data Availability Statement

Data will be made available on request.

Conflicts of Interest

The authors declare no conflict of interest.

References

  1. Jiang, F.; Ma, J.; Li, Z. Pedestrian volume prediction with high spatiotemporal granularity in urban areas by the enhanced learning model. Sustain. Cities Soc. 2022, 79, 103653. [Google Scholar] [CrossRef]
  2. Zhang, Z.; Liu, J.; Wang, C.; Zhao, Y.; Zhao, X.; Li, P.; Sha, D. A spatial projection pursuit model for identifying comprehensive urban vitality on blocks using multisource geospatial data. Sustain. Cities Soc. 2024, 100, 104998. [Google Scholar] [CrossRef]
  3. Wu, C.; Ye, Y.; Gao, F.; Ye, X. Using street view images to examine the association between human perceptions of locale and urban vitality in Shenzhen, China. Sustain. Cities Soc. 2023, 88, 104291. [Google Scholar] [CrossRef]
  4. Chen, Y.; Yu, B.; Shu, B.; Yang, L.; Wang, R. Exploring the spatiotemporal patterns and correlates of urban vitality: Temporal and spatial heterogeneity. Sustain. Cities Soc. 2023, 91, 104440. [Google Scholar] [CrossRef]
  5. Yahia, O.; Chohan, A.H.; Arar, M.; Awad, J. Toward Sustainable Urban Mobility: A Systematic Review of Transit-Oriented Development for the Appraisal of Dubai Metro Stations. Smart Cities 2025, 8, 21. [Google Scholar] [CrossRef]
  6. Tamagusko, T.; Gomes Correia, M.; Rita, L.; Bostan, T.-C.; Peliteiro, M.; Martins, R.; Santos, L.; Ferreira, A. Data-Driven Approach for Urban Micromobility Enhancement through Safety Mapping and Intelligent Route Planning. Smart Cities 2023, 6, 2035–2056. [Google Scholar] [CrossRef]
  7. Jiang, F.; Ma, J. A comprehensive study of macro factors related to traffic fatality rates by XGBoost-based model and GIS techniques. Accid. Anal. Prev. 2021, 163, 106431. [Google Scholar] [CrossRef]
  8. Papageorgiou, G.N.; Demetriou, D.; Tsappi, E.; Maimaris, A. Analyzing the Requirements for Smart Pedestrian Applications: Findings from Nicosia, Cyprus. Smart Cities 2024, 7, 1950–1970. [Google Scholar] [CrossRef]
  9. Garus, A.; Mourtzouchou, A.; Suarez, J.; Fontaras, G.; Ciuffo, B. Exploring Sustainable Urban Transportation: Insights from Shared Mobility Services and Their Environmental Impact. Smart Cities 2024, 7, 1199–1220. [Google Scholar] [CrossRef]
  10. Brodny, J.; Tutak, M.; Bindzár, P. Measuring and Assessing the Level of Living Conditions and Quality of Life in Smart Sustainable Cities in Poland—Framework for Evaluation Based on MCDM Methods. Smart Cities 2024, 7, 1221–1260. [Google Scholar] [CrossRef]
  11. Jiang, F.; Yuen, K.K.R.; Lee, E.W.M. A long short-term memory-based framework for crash detection on freeways with traffic data of different temporal resolutions. Accid. Anal. Prev. 2020, 141, 105520. [Google Scholar] [CrossRef] [PubMed]
  12. Parygin, D.; Anokhin, A.; Anikin, A.; Finogeev, A.; Gurtyakov, A. Models of Geospatially Referenced People Distribution as a Basis for Studying the Daily Cycles of Urban Infrastructure Use by Residents. Smart Cities 2025, 8, 1. [Google Scholar] [CrossRef]
  13. Correa, F.; Bartorila, M.; Ribeiro-Palacios, M.; Pérez-Soto, G.I.; Rodríguez-Reséndiz, J. Toward the Human Scale in Smart Cities: Exploring the Role of Active Mobility in Ecosystemic Urbanism. Smart Cities 2024, 7, 4002–4024. [Google Scholar] [CrossRef]
  14. Xu, N.; Zhang, X.; Wang, P. Public Vitality-Driven Optimization of Urban Public Space Networks—A Case Study from Nanjing, China. Smart Cities 2025, 8, 18. [Google Scholar] [CrossRef]
  15. Moro-Araujo, A.; Alonso Pastor, L.; Larson, K. Modeling Strategic Interventions to Increase Attendance at Youth Community Centers. Smart Cities 2024, 7, 1878–1887. [Google Scholar] [CrossRef]
  16. Itair, M.; Shahrour, I.; Hijazi, I. The Use of the Smart Technology for Creating an Inclusive Urban Public Space. Smart Cities 2023, 6, 2484–2498. [Google Scholar] [CrossRef]
  17. Jiang, F.; Yuen, K.K.R.; Lee, E.W.M. Analysis of motorcycle accidents using association rule mining-based framework with parameter optimization and GIS technology. J. Saf. Res. 2020, 75, 292–309. [Google Scholar] [CrossRef]
  18. Schuhmann, F.; Nguyen, N.A.; Schweizer, J.; Huang, W.-C.; Lienkamp, M. Creating and Validating Hybrid Large-Scale, Multi-Modal Traffic Simulations for Efficient Transport Planning. Smart Cities 2025, 8, 2. [Google Scholar] [CrossRef]
  19. Zini, A.; Roberto, R.; Corrias, P.; Felici, B.; Noussan, M. Accessibility Measures to Evaluate Public Transport Competitiveness: The Case of Rome and Turin. Smart Cities 2024, 7, 3334–3354. [Google Scholar] [CrossRef]
  20. Wu, J.; Lu, Y.; Gao, H.; Wang, M. Cultivating historical heritage area vitality using urban morphology approach based on big data and machine learning. Computers. Environ. Urban Syst. 2022, 91, 101716. [Google Scholar] [CrossRef]
  21. Jiang, F.; Ma, J. Environmental Justice in the 15-Minute City: Assessing Air Pollution Exposure Inequalities Through Machine Learning and Spatial Network Analysis. Smart Cities 2025, 8, 53. [Google Scholar] [CrossRef]
  22. Chen, W.; Wu, A.N.; Biljecki, F. Classification of urban morphology with deep learning: Application on urban vitality, Computers. Environ. Urban Syst. 2021, 90, 101706. [Google Scholar] [CrossRef]
  23. Jiang, F.; Ma, J.; Li, Z.; Ding, Y. Prediction of energy use intensity of urban buildings using the semi-supervised deep learning model. Energy 2022, 249, 123631. [Google Scholar] [CrossRef]
  24. Wang, Z.; Wang, X.; Liu, Y.; Zhu, L. Identification of 71 factors influencing urban vitality and examination of their spatial dependence: A comprehensive validation applying multiple machine-learning models. Sustain. Cities Soc. 2024, 108, 105491. [Google Scholar] [CrossRef]
  25. Doan, Q.C.; Ma, J.; Chen, S.; Zhang, X. Nonlinear and threshold effects of the built environment, road vehicles and air pollution on urban vitality. Landsc. Urban Plan. 2025, 253, 105204. [Google Scholar] [CrossRef]
  26. Jacobs, J. The Death and Life of Great American Cities, Reissue edition; Vintage: New York, NY, USA, 1992. [Google Scholar]
  27. Doan, Q.C. The spatiotemporal trends of urban-rural green spaces and their heterogeneous relationships with population and economic vitality: Evidence from the Red River Delta, Vietnam. Socio-Econ. Plan. Sci. 2024, 93, 101885. [Google Scholar] [CrossRef]
  28. Sun, Y.; You, X. Do digital inclusive finance, innovation, and entrepreneurship activities stimulate vitality of the urban economy? Empirical evidence from the Yangtze River Delta, China. Technol. Soc. 2023, 72, 102200. [Google Scholar] [CrossRef]
  29. Lee, S.; Kang, J.E. Impact of particulate matter and urban spatial characteristics on urban vitality using spatiotemporal big data. Cities 2022, 131, 104030. [Google Scholar] [CrossRef]
  30. Zhang, Y.; Tu, T.; Long, Y. Inferring ghost cities on the globe in newly developed urban areas based on urban vitality with multi-source data. Habitat Int. 2025, 158, 103350. [Google Scholar] [CrossRef]
  31. Guo, Z.; Luo, K.; Yan, Z.; Hu, A.; Wang, C.; Mao, Y.; Niu, S. Assessment of the street space quality in the metro station areas at different spatial scales and its impact on the urban vitality. Front. Archit. Res. 2024, 13, 1270–1287. [Google Scholar] [CrossRef]
  32. Chen, M.; Cai, Y.; Guo, S.; Sun, R.; Song, Y.; Shen, X. Evaluating implied urban nature vitality in San Francisco: An interdisciplinary approach combining census data, street view images, and social media analysis. Urban For. Urban Green. 2024, 95, 128289. [Google Scholar] [CrossRef]
  33. Jiang, F.; Ma, J.; Webster, C.J.; Chen, W.; Wang, W. Estimating and explaining regional land value distribution using attention-enhanced deep generative models. Comput. Ind. 2024, 159–160, 104103. [Google Scholar] [CrossRef]
  34. Jiang, F.; Ma, J.; Webster, C.J.; Li, X.; Gan, V.J.L. Building layout generation using site-embedded GAN model. Autom. Constr. 2023, 151, 104888. [Google Scholar] [CrossRef]
  35. Jiang, F.; Ma, J.; Webster, C.J.; Wang, W.; Cheng, J.C.P. Automated site planning using CAIN-GAN model. Autom. Constr. 2024, 159, 105286. [Google Scholar] [CrossRef]
  36. Jiang, F.; Ma, J.; Webster, C.J.; Chiaradia, A.J.F.; Zhou, Y.; Zhao, Z.; Zhang, X. Generative urban design: A systematic review on problem formulation, design generation, and decision-making. Prog. Plan. 2024, 180, 100795. [Google Scholar] [CrossRef]
  37. Hu, J.; Shen, L.; Sun, G.; Albanie, S.; Wu, E. Squeeze-and-Excitation Networks. arXiv 2018, arXiv:1709.01507. [Google Scholar] [CrossRef]
  38. Hou, Q.; Zhou, D.; Feng, J. Coordinate Attention for Efficient Mobile Network Design. arXiv 2021, arXiv:2103.02907. [Google Scholar] [CrossRef]
Figure 1. Problem Formulation of the Urban Vitality Prediction Framework.
Smartcities 08 00058 g001
Figure 2. Network Architecture of the Proposed UVPN Method.
Smartcities 08 00058 g002
Figure 3. Structure of the SE Block and RCA Block.
Smartcities 08 00058 g003
Figure 4. Data Preprocessing Pipeline.
Smartcities 08 00058 g004
Figure 5. Pedestrian Detection from Street View Images.
Smartcities 08 00058 g005
Figure 6. Absolute to Relative Transformation of Urban Vitality Labels.
Smartcities 08 00058 g006
Figure 7. An Illustration of Categorical Feature Preprocessing.
Smartcities 08 00058 g007
Figure 8. Qualitative Results of Urban Vitality Prediction.
Smartcities 08 00058 g008
Figure 9. Qualitative Results of Model Comparison.
Smartcities 08 00058 g009
Figure 10. Model Performance in Five NYC Boroughs.
Smartcities 08 00058 g010
Table 1. Datasets and Data Sources.
DatasetSpatial ResolutionData FormatSource
CRDCensus block (CB)TablesU.S. Census Bureau, Suitland, MD, USA. URL: https://www.census.gov/ (accessed on 10 June 2024)
Google Street ViewRoadImagesGoogle Map. URL: https://www.google.com/streetview/ (accessed on 10 June 2024)
PLUTOBorough, block, and lot (BBL)ShapefilesNYC Department of City Planning, NY, USA. URL: https://www.nyc.gov/ (accessed on 10 June 2024)
OSMRoad, pointShapefilesOpenStreetMap. URL: https://www.openstreetmap.org/ (accessed on 10 June 2024)
ACSCensus tract (CT)TablesU.S. Census Bureau, Suitland, MD, USA. URL: https://www.census.gov/ (accessed on 10 June 2024)
Census BlockCBShapefilesNYC OpenData. URL: https://opendata.cityofnewyork.us/ (accessed on 10 June 2023)
Table 2. Urban Features.
VariableRepresentative FeaturesResolutionNumber
StreetscapeBuilding, vegetation, road, sky, sidewalkRoad5
POIDensity (e.g., transportation, healthcare), nearest distance (e.g., entertainment, shop)Road28
Land useZoning district (e.g., residential, commercial, mixed), land use type (1–11)BBL15
Built formBuilt FAR, number of buildingsBBL6
Urban infrastructureRoad types (e.g., motorway, primary), greenRoad/BBL9
Social and demographicEmployment rate, per capita incomeCB/CT4
Total67
Table 3. Quantitative Results of Model Comparison.
ModelPop.MAEPop.MSEPop.SSIMPop.PSNRPed.MAEPed.MSEPed.SSIMPed.PSNR
U-Net0.07820.02580.638518.74140.07510.01250.971120.9040
EncoDeco (ResBlock)0.07520.02570.646218.96040.05600.00700.976623.1318
EncoDeco (SE and ResBlock)0.07290.02230.647119.22000.05080.00610.977623.7659
UVPN0.06790.01620.647920.01280.04800.00520.978424.2188
Improvement9.94%34.03%0.62%5.48%20.81%38.66%0.34%7.16%
Pop.: regional population density estimation; Ped.: regional pedestrian flow estimation.
Disclaimer/Publisher’s Note: The statements, opinions and data contained in all publications are solely those of the individual author(s) and contributor(s) and not of MDPI and/or the editor(s). MDPI and/or the editor(s) disclaim responsibility for any injury to people or property resulting from any ideas, methods, instructions or products referred to in the content.

