1. Introduction
The exploitation of information and communication technologies (ICTs) in many aspects of modern living is accompanied by increased concern about its impact on the environment. Mobile networks as an important part of the ICT sector have revolutionized our daily lives over the past few decades, changing the way we work, communicate, and interact. Positive transformations include examples such as the use of e-commerce, telecommuting, and smart technologies which consequently reduce fuel consumption and greenhouse gas (GHG) emissions in different economic sectors. According to the analysis of the Global eSustainability Initiative (GeSI) SMARTer2030 report [
1], the ICT sector achieves a 9.7 times reduction in carbon dioxide equivalent (CO
2e) emissions when compared with its own CO
2e emissions. Therefore, increased use of mobile networks as an important part of the ICT sector could help balance environmental conservation with economic growth and, thus, simultaneously contribute to the achievement of both objectives. On the other hand, this increased use of mobile networks raises a significant concern related to the energy costs and carbon dioxide (CO
2) emissions in manufacturing, and especially the installation and the operation phase of mobile network elements. This has become one of the major concerns in the ICT sector. Although mobile networks as an important part of the ICT sector can contribute to reductions of carbon emissions and energy conservation in different economic sectors, this ability can be significantly impaired by the energy consumption (EC) and CO
2 emissions of mobile network elements during their operational lifetime [
2].
As the world continues its rapid transformation into the digital age, there has never been a greater need for the development of mobile networks that can ensure high data transfer rates and reliable wireless communications. The latest standardized fifth-generation (5G) mobile network is envisioned to offer much faster data rates than its predecessors and support a wide range of devices in the Internet of Things (IoT) ecosystem. However, the introduction of 5G networks also presents a significant challenge related to EC. As 5G networks start to rapidly deploy globally, there is an urgent need to ensure their efficient operation while minimizing their energy footprint and maximizing their performance. Since energy costs for ensuring the operation of 5G networks take a considerable part of mobile network operators’ (MNOs) operating expenditures (OPEXs), improving energy efficiency (EE) of 5G networks presents not only an environmental but also a financial concern [
3].
In the phase of developing mobile network infrastructure, a major concern of MNOs in the past was primarily related to minimizing network cell outages [
4] and ensuring appropriate bandwidth, coverage, and transmission latency to the users. However, with increasing environmental and economic considerations, the EE of mobile networks has become one of the key performance indicators for the development of next-generation mobile networks. In order to maintain quality of service (QoS) for different applications and use cases, MNOs must adapt to the growing number of user devices (UDs) and consequently to the constant increase in data volume (DV) caused by the rising number of bandwidth-demanding services. Both factors contribute to the increase in EC of 5G mobile network, which introduces further environmental and economic challenges. Consequently, in today’s mobile network planning and operation processes, MNOs have started to prioritize EE as an important key performance indicator (KPI) of network operation [
5].
The International Telecommunication Union (ITU) has established the IMT-2020 guidelines for 5G mobile networks, selecting technologies that support specific 5G network use cases [
6]. These use cases include enhanced mobile broadband (eMBB) with peak speeds reaching 20 Gbps and an average of 100 Mbps in populated areas. They also include ultra-reliable and low-latency communications (URLLC) suitable for implementations in virtual reality (VR) and vehicle connectivity, the increased network capacity to handle massive machine-type communications (mMTC) with more than a million IoT connections per square kilometer, and fixed wireless access (FWA) that delivers fiber-like speeds in the mobile access network of urban and rural areas. To enable the practical realization of these use cases, the 5G mobile network is envisioned as a heterogeneous network (HetNet) with different types of 5G base stations (BSs). This versatility in types of BSs includes outdoor macro BSs that provide wide signal coverage and small BSs (such as micro, pico, and femto BSs) to meet demands for high DVs and capacities in spatially limited areas, either indoors or outdoors.
The saturation of up to 6 GHz radio frequency bands due to the intensive usage of different communication technologies limits the possibility of using wide frequency channels in 5G mobile networks. Consequently, the 5G network-related standards also have proposed communications in millimeter-wave (mmWave) frequency bands (24–47 GHz) [
7]. While communications in mmWave frequency bands can provide users with higher throughputs due to broader frequency channels, mmWave communications also have limitations. These limitations are manifested in reduced signal coverage due to the significant propagation, penetration, and attenuation losses of mmWave signals [
8], and since mmWave signals enable the transfer of large data rates, limitations are also manifested in the inherent need for employing fiber optic links in connecting the BSs radio and baseband units [
9]. Consequently, this impacts the 5G HetNet architecture that will generally in future practical implementations integrate a combination of a smaller number of macro BSs and a larger number of small BSs to offset the limited coverage of small 5G BSs and limited capacity of 5G macro BSs.
Therefore, the total number of deployed macro and small 5G BSs in specific areas of the 5G networks will be affected by user device (UD) density and traffic capacity needs. Thus, different device densities and traffic requirements in certain areas will require different 5G network BS allocations in terms of the number, type, and capacities of BSs. This in turn affects the EC of the 5G mobile network. Although some BS generations in the future will be removed from the network (such as the third generation (3G) BSs) and thus contribute to the improvement of EE of mobile networks, the need for the continuous allocation of new macro and small 5G BSs will persist and this will have a negative impact on the EC of the 5G network.
Thus, in this paper, the analyses of the impact of continuous increase in the number of mobile users on 5G network EE for the period of 2020–2030 have been thoroughly analyzed. The algorithms enabling simulation analyses of future trends in changes of 5G HetNet EE metrics for different 5G BS deployment and operation management scenarios have been developed. An analysis is performed on the example of the two European countries on the national level, which differs in terms of the number of UDs and country geography. The paper presents comprehensive analyses of the trends in changes of the 5G HetNet EC and two standardized network EE metrics, exploiting four different 5G BS installation and operation management scenarios that have different impacts on 5G network EE metrics. Hence, the main objective of the paper is to give an answer on how the constantly growing number of 5G UDs and consequently increasing mobile network data traffic volumes will impact the EE of 5G mobile networks by the end of 2030.
The rest of the article is organized as follows. In
Section 2, an overview of the previous research work related to improving EE of mobile networks is presented. In
Section 3, the standardized data and coverage mobile network EE metrics are introduced. The methodology and simulation models of the 5G network used for the estimation of the 5G network EE of a given country are described in
Section 4. The developed analytical framework and algorithms used for estimating 5G network EE are presented in
Section 5. In
Section 6, the obtained results related to the visualization of EE metrics of 5G networks for each country and analyzed simulation scenarios are described. A comprehensive discussion tackling different aspects of obtained results related to the impact of the increase in the number of UD on 5G network EE is given in
Section 7. Finally, concluding remarks are given in
Section 8.
2. Related Work
Over the past ten years, the academic and industrial sectors have shown a growing interest in enhancing the EE of wireless access networks. The dynamic radio resource management (RRM) and power supply from renewable energy sources of wireless network equipment was one of the first solutions envisioned for improving wireless network EE [
10]. In [
11], a sustainable communication model for 5G networks was introduced. This model suggests that the increased EC in wireless networks consisting of dense BS small cell deployments can be compensated by employing BS sleep mode operation. Similarly, authors in the study [
12] proposed an energy-efficient resource management technique for 5G HetNets. The proposed technique employs an analytical model that determines the optimal number of active small cells based on traffic demands, which contributes to reducing 5G HetNets power consumption without compromising QoS. Findings in [
13] further support the idea that heterogeneous cellular networks can boost EE by integrating small BSs with an existing network of macro BSs and by reducing the transmission power of macro BSs. In another study [
14], we proved that BSs transmit (Tx) power scaling according to variations in data traffic can contribute to the improvement of wireless cellular network EE. A separate study [
15] introduced an analytical framework emphasizing that the key to improved EE in 5G networks lies in network densification and the adoption of advanced multiple input multiple output (MIMO) transmission technology.
The paper [
16] analyzes the EC of 4G and 5G radio access networks (RANs) in Belgium from 2020 to 2025 with a focus on BSs as the primary energy consumers in mobile networks. While the research highlights 5G network potential for improving EE, particularly through the implementation of sleep mode of BS operation, it also highlights the uncertain energy implications of 5G BS deployment. Using on-site measurements, power models were developed for both 4G and 5G BSs, confirming that the simultaneous operation of both networks is more energy intensive.
Using the UK as a case study, authors in [
17] examined the future deployment of 5G networks, focusing on EC from both economic and environmental viewpoints. A unique agent-based model integrating multi-dimensional data visualization was developed for the analyzed case study. The study found that in comparison with macro BSs, micro BSs are the primary energy consumers in 5G networks, and this poses a challenge to local energy infrastructures and increases OPEX for MNOs.
In our preliminary paper [
5], we analyzed the challenges of implementing 5G mobile networks, with a particular emphasis on their EE across different communities differing in user densities. We presented standardized EE metrics for a 5G mobile network covering an area of one square kilometer. We also explored the impact of various 5G BS deployments and operation strategies on the EE of 5G networks. Furthermore, we developed interpolation functions to illustrate the relationship between DV and EE metrics for each BS coverage area and deployment scenario.
Our recent work [
18] examined the effects of projected data DV growth on the EE of one square kilometer 5G radio network using standard EE metrics. We evaluated five distinct 5G BS deployment and operational strategies across different device density classes. The analysis shows a significant impact of increasing DV trends on the standardized data and coverage EE metrics of 5G HetNets. Also, in [
18], the method for determining the optimal and suboptimal combinations of data and coverage EE metrics for every examined 5G BS deployment and operation strategy is presented.
The results and insights obtained in this initial work [
18] serve as a key reference point for more comprehensive analyses presented in this work. Thus, in this paper, we further extend the model developed in [
18] to assess the impact of the expected DV increase on EE of the 5G network on the level of the complete country. The developed model is analyzed for two European countries having 5G mobile networks with national signal coverage, as representatives of countries having different population densities and geographical terrains. Thus, the paper analyses the impact of the increase in transferred DV and the number of 5G UDs on EE metrics of the 5G network during the period of 2020–2030 at the overall country level. The performed analyses explain how 5G network EE will be changed by 2030, due to the increase in the number of 5G users and DVs.
3. Standardized Mobile Network Energy-Efficiency Metrics
In this work, the selected metrics for the evaluation of the 5G RANs EE are defined by standards of the European Telecommunications Standards Institute (ETSI) [
19], the 3rd Generation Partnership Project (3GPP) [
20] and the International Telecommunication Union—Telecommunication sector (ITU-T) [
21]. According to these standards, the MNO equipment considered for EE estimations can include BSs, BSs site equipment, radio controllers, and backhaul equipment. Due to the complexity of assessing the EE of the entire mobile network, the standards allow for the network to be divided into smaller sub-networks for analysis. The focus of this paper is on the radio part of the mobile network containing only the 5G BS radio equipment.
For evaluating the EE of the mobile network based on varying population densities, the ETSI standard [
19] will be used to define different UD density classes (which will also further in the paper interchangeably be termed as the UD density areas). These UD density classes (areas) can be further categorized based on their geographic UD densities as rural, suburban, urban, and dense urban device-density classes [
19]. For each of these UD density classes, analyses presented in this work are based on two primary 5G network EE metrics defined by telecommunication standards [
19,
20,
21]. The first metric focuses on data capacity and measures the mobile network data energy efficiency (
EEMN,DV) [
19]. The data energy efficiency (
EEMN,DV) is expressed as follows:
where the
DVMN in Equation (1) refers to the total network DV transferred by MNO equipment (e.g., BSs) during the specific time period in the uplink (UL) and downlink (DL) direction. The
ECMN in Equation (1) represents the total energy used by the devices (BSs) in the network during the same time period. Essentially, this metric shows how much data the network can transmit for every Joule of spent energy.
Table 1.
Prediction of the number of 5G devices per inhabitant based on global population trends [
22,
23,
24].
Table 1.
Prediction of the number of 5G devices per inhabitant based on global population trends [
22,
23,
24].
| Year | World Population (Billion) | Number of 5G Smartphone Devices/
Inhabitant | Number of FWA Devices/
Inhabitant | Number of 5G IoT Devices/
Inhabitants | Number of All 5G Devices/
Inhabitant | Total Number of All 5G Devices (Billion) |
|---|
| 2020 | 7.841 | 0.02 | 0.0005 | 0.03 | 0.05 | 0.39 |
| 2030 | 8.546 | 1.16 | 0.08 | 0.37 | 1.61 | 13.75 |
The second standardized metric used in the analyses presented in this work evaluates the EE of the mobile network based on the size of the area covered with the 5G signal. More specifically, mobile network coverage area energy efficiency (
EEMN,CoA) is defined as the ratio between the designated coverage area (
CoA_desMN) of a particular MNO sub-network and its annual energy consumption (
ECMN) [
19]. The network coverage area energy efficiency (
EEMN,CoA) can be expressed as follows:
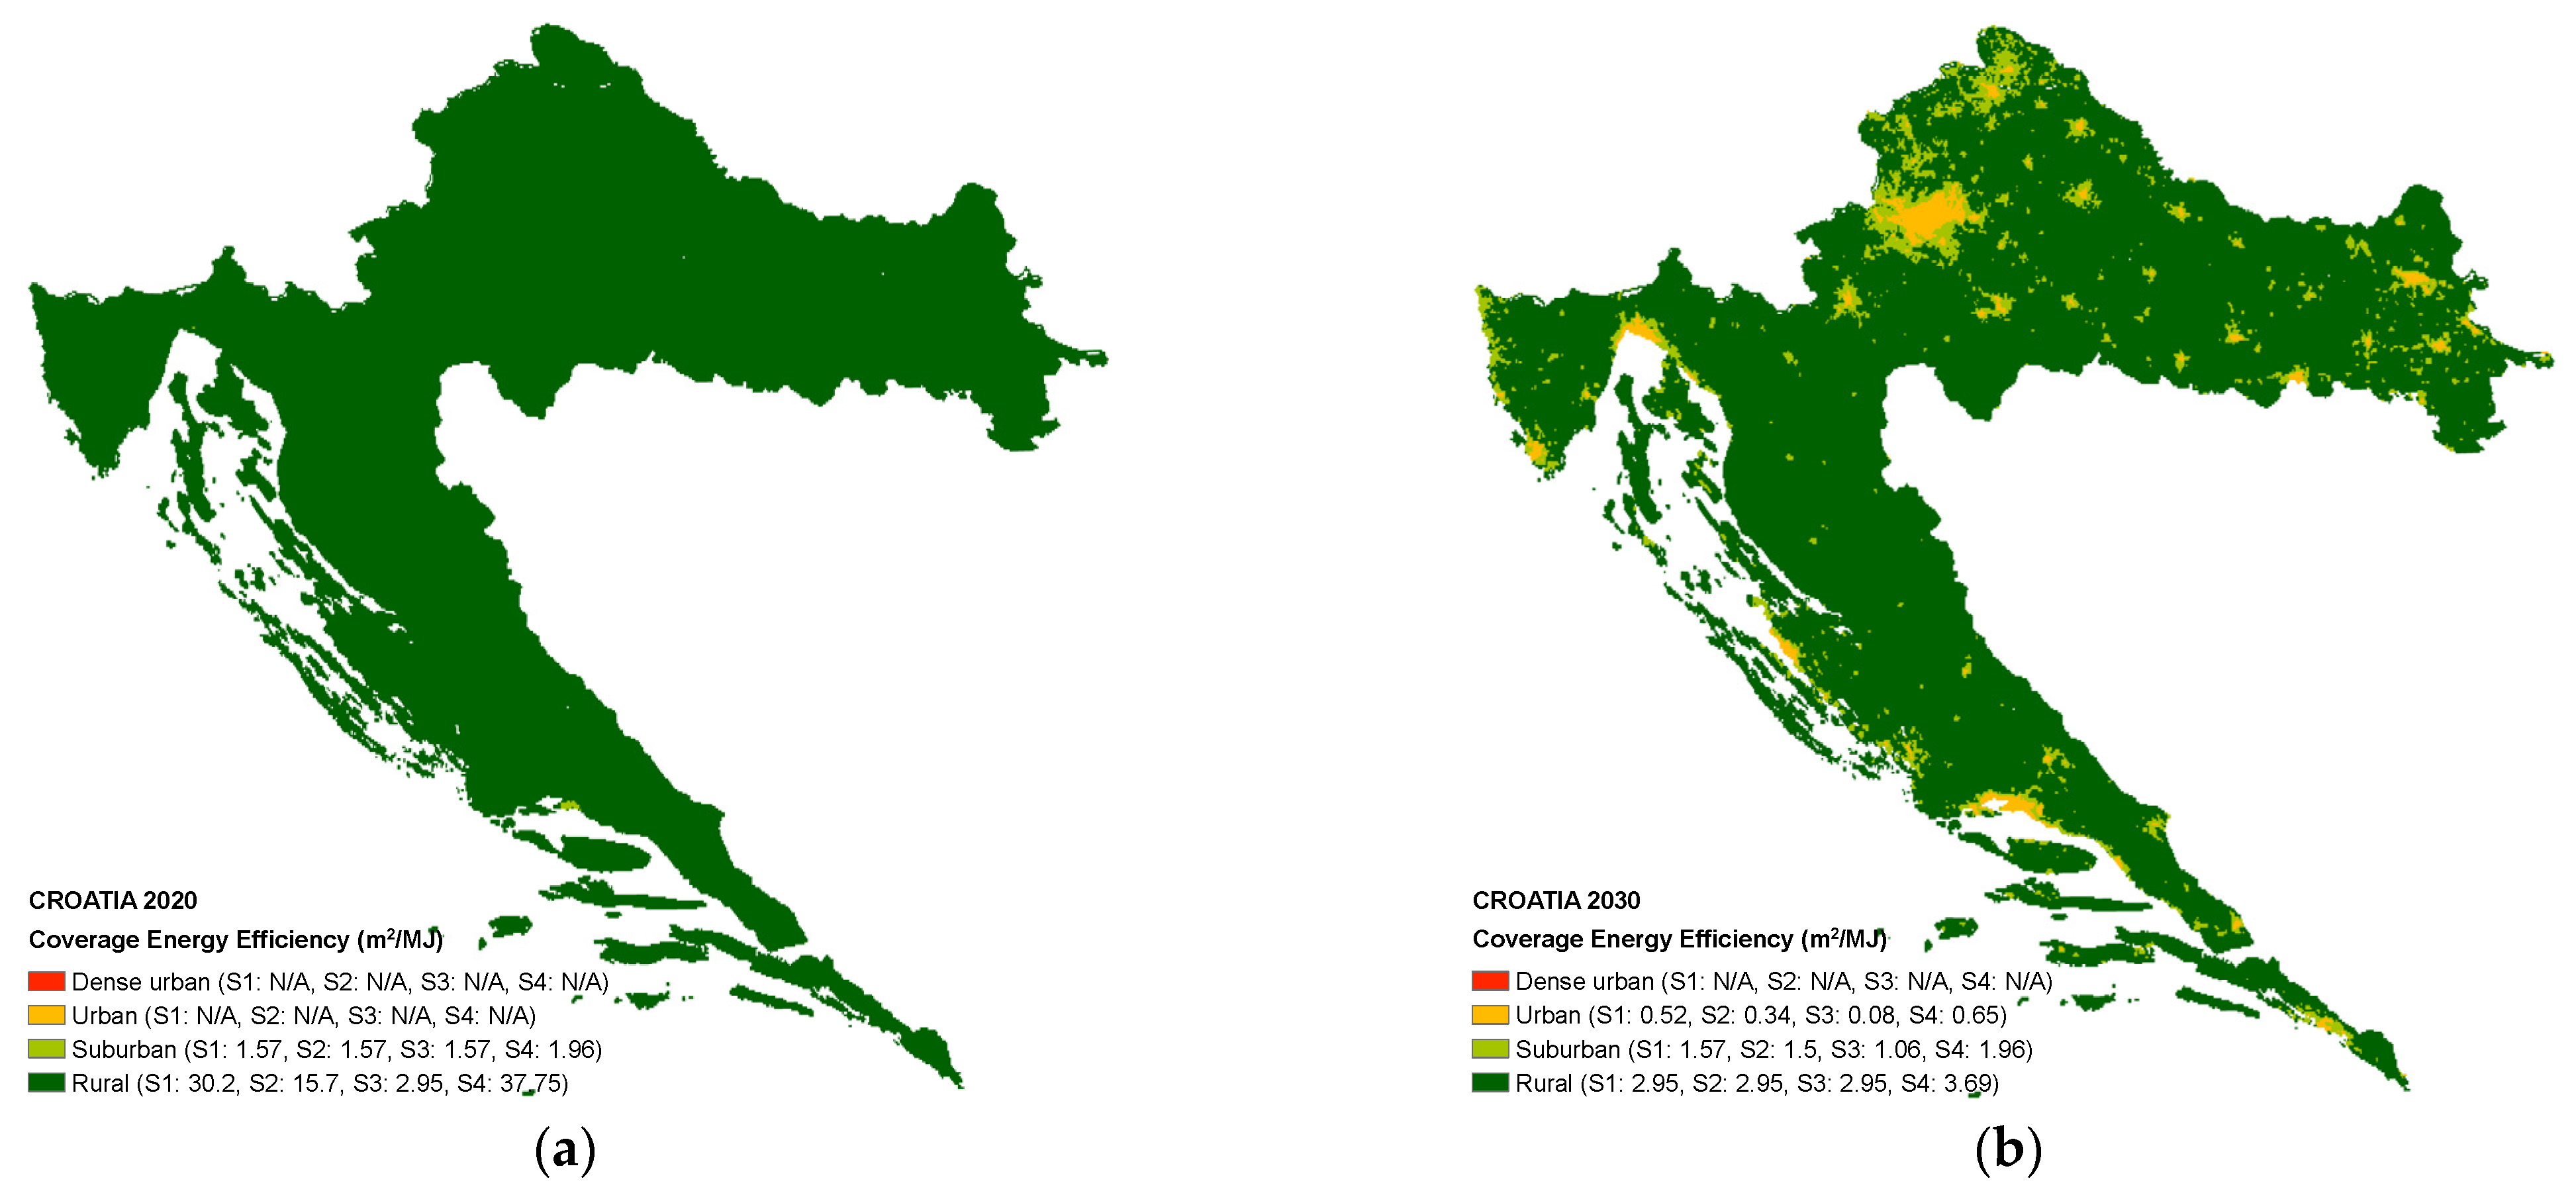
The EEMN,CoA metric determines how much area (in square meters) the mobile network can cover for every Joule of spent energy. The size of the coverage geographic area (CoA_desMN) in this research work was determined for each of the four UD density classes (rural, suburban, urban, and dense urban). This standardized data and coverage EE metrics are further used in this work for analyzing the EE of 5G networks.
4. Methodology and Simulation Model
In this research, simulation of analysis of the data and coverage EE have been performed on the example of two specifically selected countries (Croatia and The Netherlands). The network simulation model used for analysis is structured as 5G HetNet deployed in different UD density classes of each country.
Figure 1 illustrates the snapshot of simulated 5G heterogeneous sub-networks. They correspond to four distinct UD density classes (rural, suburban, urban, and dense urban), comprising various amounts and types of 5G BSs and various numbers of 5G UDs in each sub-network (
Figure 1).
In further subsections, the key simulation aspects that impact the results of analyses are presented. More specifically, the first aspect is related to the methodology of estimation of the projected growth and distribution of 5G UDs in 5G networks of analyzed countries. The next aspect is dedicated to the methodology for determining BS capacity and their allocation in the 5G HetNet environment, taking into account different user requirements and amounts of DV. The methodology for the estimation of BSs EC is presented and the EC model of the three different BS types used in analyses is also elaborated. Finally, the aspect of improving 5G network EE through the implementation of four proposed 5G BS installation and operation scenarios is introduced and explained.
4.1. Assessment of User Device Growth
As the world rapidly moves into the era of 5G mobile networks, understanding the growth and distribution of 5G UDs becomes critical. Technological progress has led to a rapid increase in the adoption of various 5G devices, from smartphones to specialized FWA, mMTC, or IoT devices. One approach to predicting the global increase in the number of different 5G UDs during the 2020s is to relate it with the predictions of the world population trends estimated by relevant authorities [
24].
Table 1 presents for the years 2020 and 2030 an overview of the global changes in the number of various 5G UDs, including smartphones, FWA, and IoT devices in relation to the number of world population inhabitants. In
Table 1, the predictions of the number of 5G smartphones and FWA UDs per global population inhabitants are based on Ericsson’s mobility report [
22]. In addition, the predictions of the number of 5G cellular IoT UDs per global population inhabitants (presented in
Table 1) are performed according to forecasts presented in [
23]. It is worth emphasizing that cellular IoT devices in
Table 1 include both non-mMTC and mMTC devices, while mMTC devices include the previous 4G technology long-term evolution machine-type communication (LTE-MTC) and Narrowband Internet of Things (NB-IoT) UDs. The reason for the inclusion of these UDs in the analyses is related to the fact that these technologies are standardized by 3GPP as low-power wide-area (LPWA) technologies and will continue to evolve as a part of the 5G specification [
25].
The UD growth assessment for a specific country was conducted using the ArcMap 10.7.1. software, which is a component of Esri’s ArcGIS suite [
26]. It is a tool for geographic information system (GIS) mapping and analysis. The primary data source used for this study was an official population dataset, which details the spatial distribution of estimated population densities in the form of GeoTIFF files [
27]. The GeoTIFF files contain raster-based representations of population density per grid cell, expressed as inhabitants per square kilometer for each observed country. The dataset derived from the GeoTIFF files represents the country’s population density with two primary attributes, which are values and counts.
The value attribute indicates the population density in terms of the number of inhabitants per square kilometer in certain grid cells. On the other hand, the count attribute represents the number of grid cells having that particular population density. These attributes can provide a calculation of the population distribution within a country, capturing both population density and the prevalence of each density level across different parts of the country (grid cells).
In this research, ArcMap software was used to project the number of 5G devices based on population density datasets in analyzed countries. These datasets provided detailed information about the population density per one square kilometer of each country for the year 2020. The projected increase or decrease in population density for each country was analyzed up to the year 2030 based on predictions from relevant prediction population density sources [
24]. Using this data, the expected number of inhabitants per square kilometer of analyzed countries for the year 2030 was estimated.
Such calculated population densities for specific countries in the period of 2020–2030 serve as a reference for estimating the number of 5G devices in each grid cell of the analyzed country. To estimate the number of 5G devices in a particular grid cell of the analyzed country, the population density for each square kilometer was multiplied by the projected number of 5G devices per inhabitant (
Table 1) for the years 2020 and 2030. As a result, the projected number of 5G devices per square kilometer in every grid cell of the observed country was determined.
The graphs presented in
Figure 2 show estimated trends in the expansion of the number of 5G UDs from 2020 to 2030, for each of the observed countries. A consistent increase in the number of 5G UDs is visible across all device categories, which indicates the expected gradual adoption of 5G technology and corresponding UDs in various use cases in the future. According to
Figure 1, the largest share of 5G UDs in both analyzed countries refers to 5G smartphones, highlighting the global consumer adoption of these UDs by the end of the 2020s. The 5G mMTC devices hold the second largest share (
Figure 1), which indicates a significant adoption of machine-type communications, which are also crucial for the future implementation of IoT applications.
4.2. Characteristics of Analyzed Base Stations
In this research, three different 5G BS types named BS1, BS2, and BS3 are used for analysis (
Figure 3). The BSs were categorized into three distinct types based on their deployment scenarios and operating characteristics, and they represent three categories of typical BSs for which it is expected to be massively deployed worldwide. It is assumed that the combination of these types of BSs presented in
Figure 3, will be fundamental in satisfying increasing 5G requirements as the demand for higher data rates and seamless connectivity continues to grow. The operating parameters of three different types of 5G BS used in the simulations are presented in
Table 2. According to
Table 2, each BS type is characterized by specific operating parameters that impact the overall transmission capacity of each BS type (
Table 2).
4.2.1. Base Stations Operating Parameters
In the analyses, the BS1 is assumed to be a three-sector 5G base station equipped with a remote radio head and is typically implemented in macro-cell deployment scenarios (
Figure 3). These macro cells provide coverage and transfer traffic over wide geographical regions. Operating in the 800 MHz frequency band (
Table 2), the macro BS1 ensures long signal penetration and propagation over large distances. The BS2 represents the next generation of macro 5G BSs, leveraging an active antenna system (AAS) design (
Figure 2). An AAS integrates the radio and antenna components into a single system, allowing for more dynamic control of the antenna pattern and behavior. Overall, AAS can deliver improved bandwidth and improved spectral efficiency, enabling the massive MIMO and beamforming transmission in 5G networks [
28]. Operating in the 3.6 GHz frequency band (
Table 2), BS2 offers a balanced approach that is appropriate for implementations in urban and dense suburban regions, and also features a three-sector configuration (
Figure 3,
Table 2). The small BS3 is designed to serve areas with high user density in micro-cell applications (
Figure 3). Operating in the mmWave 26 GHz band (
Table 2), the BS3 delivers high data rates within its relatively limited coverage area. It is a one-sector BS that ensures that users within its vicinity have access to significantly higher throughputs than those of BS1 and BS2.
Table 2.
Operating parameters of three different types of 5G BS used in the simulation analyses.
Table 2.
Operating parameters of three different types of 5G BS used in the simulation analyses.
| Type of BS (Number of Tx/Rx) | Operating Frequency/
Transmission Scheme/
Overhead | Direction of Data Transfer/OFDM Modulation Order/OFDM Symbol Duration (µs) | Number of Aggregated Component Carriers/Maximum | Max. no. of MIMO Layers | Bandwidth (MHz)/
Subcarrier Spacing (µ)/Maximum no. of Resource Blocks | No. of Sectors | 5G BS Throughput per BS Sector (Gbit/s) | BS Capacity (Gbit/s) |
|---|
| BS1 (16T16R) | FR1:800 MHz/
TDD/0.14 | DL/
6 (64QAM)/
71.429 | 2 | 8 | BW:10 MHz/
µ:15 kHz/
52 | 3 | 0.52 | 1.77 |
FR1:800 MHz/
TDD/0.08 | UL/
6 (64QAM)/
71.429 | 2 | 4 | BW:10 MHz/
µ:15 kHz/
52 | 3 | 0.08 |
| BS2 (32T32R) | FR1:3.6 GHz/
TDD/0.14 | DL/
6 (64QAM)/
35.714 | 2 | 8 | BW:40 MHz/
µ:30 kHz/
106 | 3 | 2.10 | 7.24 |
FR1:
3.6 GHz/
TDD/0.08 | UL/
6 (64QAM)/
35.714 | 2 | 4 | BW:40 MHz/
µ:30 kHz/
106 | 3 | 0.312 |
| BS3 (64T64R) | FR2:26 GHz/
TDD/0.18 | DL/
6 (64QAM)/
8.929 | 1 | 16 | BW:200 MHz/
µ:120 kHz/
132 | 1 | 9.97 | 11.49 |
FR2:26 GHz/
TDD/0.1 | UL/
6 (64QAM)/
8.929 | 1 | 8 | BW:200 MHz/
µ:120 kHz/
132 | 1 | 1.52 |
According to
Table 2, the operating frequency bands at which BS1 BS2 and BS3 transmit are divided into two different frequency ranges (FRs) known as FR1 and FR2 [
29]. The FR1 refers to the sub-6 GHz frequency bands traditionally used in earlier generations of mobile networks and BS1 and BS2 operate in this FR (
Table 2).
Due to their better propagation characteristics compared to those of higher mmWave frequency bands, these sub-6 GHz frequency bands are typically used for wide-area 5G network signal coverage. Although the majority of networks operating in sub-6 GHz bands use frequency division duplex (FDD) transmission mode [
30], due to the flexibility in UL and DL allocation, in the analyses presented in this work, the time-division duplex (TDD) transmission method in a 5G network was assumed for those BSs (
Table 2).
The FR 2 frequency bands refer to the mmWave frequency bands, which are typically above 24 GHz. Due to the mmWave propagation characteristics making FDD a less viable option for practical implementations in mmWave frequency bands, these high-frequency bands primarily use a time-division duplex (TDD) transmission scheme in practice [
31]. For that reason, the TDD was assumed as a transmission scheme for the BS3 working in the mmWave spectrum (
Table 2). These bands can offer to the UDs ultra-high data rates; however, they have limited 5G network signal coverage and penetration capabilities.
The massive MIMO (mMIMO) technology that employs multiple antennas at both the transmitter (Tx) and receiver (Rx) side enables significant boosts of 5G BS data throughput, network coverage, and capacity without the need for increasing the BS transmit power or bandwidth. In the analyses, BS1 is assumed to exploit MIMO technology with up to 16 transmitters and receivers, while BS2 and BS3 are assumed to exploit mMIMO technology with up to 32 or 64 transmitters and receivers, respectively (
Table 2).
In the context of MIMO transmissions, spatial signal multiplexing as the most important MIMO transmission feature enables the simultaneous transmission of multiple data streams within the same time-frequency symbol, which is also known as spectrum re-use. These transmissions of the concurrent data streams are typically identified as MIMO signal layers, which can be directed to a single UD or distributed among multiple UDs. The primary advantage of spatial multiplexing lies in its potential to enhance both user throughput and overall network capacity [
32]. The maximal number of MIMO layers in DL and UL transmission for BS1, BS2, and BS3 differs between 4 and 16 in accordance with BSs MIMO and mMIMO transmission capabilities (
Table 2).
4.2.2. Base Stations Capacity Modeling
Within the frame of the 5G new radio (NR) technology, various operating parameters can impact the throughput capabilities of a 5G BS. Besides those operating parameters already stated in the previous section, other operating parameters that impact the 5G BS transmission capacity are the number of aggregated signal component carriers, the bandwidth of transmission channel, subcarrier spacing (SCS), signal modulation order, the number of used transmission resource blocks, and the type of transmission mode (UL or DL). In
Table 2, the values of those operating parameters for three different types of 5G BS used in the analyses are presented.
Carrier aggregation (CA) is an important feature of 5G systems that enables aggregating multiple signal component carriers in data transmission and reception to enhance network performance. By combining two or more signal carriers, either within the same frequency band or across different ones, CA creates a unified aggregated wireless channel, thereby optimizing spectrum use [
33]. According to
Table 2, the BS1 and BS2 exploit the concept of CA having two aggregated component carriers (
Table 2). Due to the operation at high frequencies that offer high throughputs, the CA in the operation of BS3 is not modeled and BS3 operates at one component carrier (
Table 2).
Additionally, the 5G BS signal in the time and frequency domains is described using a set of parameters referred to as numerology. The primary parameter in 5G BS numerology is the SCS. The SCS value (
) determines the distance between the two adjacent subcarriers in 5G BS orthogonal frequency division multiplexing (OFDM) transmission [
34]. The maximum OFDM modulation order equal to 6 (64 QAM) is assumed in the analyses for DL and UL communication for BS1, BS2, and BS3 (
Table 2). The flexibility in 5G numerology allows the 5G BS transmission system to be optimized for different use cases, ranging from serving UDs in high-speed vehicle mobilities to dense urban deployments, or from massive IoT connectivity to URLLC communications. By adjusting the numerology, 5G BSs can meet the different requirements for versatile 5G network use cases. For analyses performed in this paper (
Table 2), SCS values for BS1, BS2, and BS3 are selected to be 15 kHz, 30 kHz, and 120 kHz, respectively. These SCSs are selected as values that are appropriate for satisfying most of the 5G network use cases served by the corresponding BS type.
Furthermore, the BS1, BS2, and BS3 are assumed to operate at 10 MHz, 40 MHz, and 200 MHz channel bandwidths (
Table 2), respectively. These values of bandwidths
represent a typical channel bandwidth of 5G BSs operating at 800 MHz, 3.6 GHz, and 24 GHz (
Table 2), respectively. The resource block as the fundamental unit of the BS frequency-time resource distribution divides the available bandwidth of the 5G BS into a grid of time and frequency resources, with 12 subcarriers in one time slot of the resource block. Based on SCS and channel bandwidths, the BS1, BS2, and BS3 use 52, 106, and 132 resource blocks (
Table 2), respectively. Also, different overheads representing the portion of the available bandwidth and resources that are consumed by necessary control, management, and protocol functions have been used in the calculation of each BS capacity (
Table 2). According to
Table 2, the selected transmission overheads correspond to values ranging from 0.08 to 0.14 for different UL and DL transmission configurations of BSs.
According to the stated BS operating parameters, the 5G NR BS data rates (
DR) can be calculated as in [
35], which is based on expression standardized by 3GPP TS 38.306 [
36]:
where
Rmax = 948/1024, the
C represents the maximal number of aggregated signal component carriers indexed as
c = 1, …,
C, within a specific frequency band or combination of bands,
refers to the value of numerology parameter SCS, and
denote the average duration of an OFDM symbol within a subframe for the given numerology parameter SCS which is equal to
. For the
c-th component carrier in Equation (3), the
represents the number of MIMO layers supported for both DL and UL communication,
indicates the OFDM modulation order for DL and UL communication (equal to 6 for 64QAM),
is the scaling factor (with possible values of 1, 0.8, 0.75, and 0.4),
defines the number of maximum allocated resource blocks in bandwidth
BW (c) with the specified SCS, and
represents overhead for the
c-th component carrier.
Each BS has a certain maximum capacity, which indicates the largest amount of data that the BS can transfer in a certain period of time. The maximal BS capacities used in simulation analyses performed in this paper have been calculated in this work according to Equation (3).
Table 2 indicates the calculated maximal capacities per sector and overall capacities of BS1, BS2, and BS3.
4.2.3. Base Stations Allocation Principle
ETSI standard in [
19] defines rural, suburban, urban, and dense urban UD density classes (areas). The UD density classes are defined as square kilometer areas containing the specific overall number of UDs.
Table 3 shows different UD density classes (areas) that are categorized as defined in [
19]. Each class has an associated UD density range, which indicates the range of density of UDs per square kilometer (
Table 3). For the research presented in this paper, the area of the complete country is divided into square kilometers UD density classes (areas) and characteristic examples of these UD density areas are illustrated in
Figure 1.
Table 3.
UD density class parameters and number of allocated BS1 per UD density class.
Table 3.
UD density class parameters and number of allocated BS1 per UD density class.
| UD Density Class (Area) | UD Density
per km2 | Average Data Rate per Active UD (UL + DL) Gbps | Allocated
No. of BS1/km2 | UD Activity Factor |
|---|
| Rural | 0–200 | 0.075 | 0.1 | 20% |
| Suburban | 200–1000 | 0.075 | 1 | 20% |
| Urban | 1000–10,000 | 0.35 | 2 | 10% |
| Dense urban | >10,000 | 0.22667 | 4 | 30% |
Table 4.
5G BS power consumption and shares of variable BSs in the total number of variable BS [
17,
37,
38].
Table 4.
5G BS power consumption and shares of variable BSs in the total number of variable BS [
17,
37,
38].
| Type of BS | Instantaneous Power Consumption of BSS with BS Operating in Active Mode (W) | Instantaneous Power Consumption of BSS with BSs Operating in Sleep Mode (W) | Average Instantaneous Power Consumption of BSS with BSs Operating in Tx Power Scaling Mode (W) | Distribution of Variable BSs in the Total Number of Variable BSs |
|---|
| BS1 (16T16R) | 10,500 | N/A | 8400 | N/A |
| BS2 (64T64R) | 8500 | 850 | 6800 | 30% |
| BS3 (64T64R) | 1200 | 120 | 960 | 70% |
In addition, to make the simulation model as realistic as possible, an activity factor for each UD density class is used for expressing the real UD activity in the network. Simulation of UD activity in the analyses is performed according to UD activity factors presented in
Table 3, which are defined according to technical specifications [
39,
40]. The activity factors shown in
Table 3 represent the percentage of the amount of simultaneously active UDs in relation to the overall number of UDs, where active means that the UDs are actively transmitting or receiving data over the network. Since most UDs do not constantly transmit or receive the data during the day, the activity factors for each UD density area represent the percentage of UDs that are simultaneously active, meaning they are engaged in data transmission or reception at a given time, relative to the total number of UDs in that area. For example, an activity factor of 20% in
Table 3 for rural UD density areas indicates that, on average, at the same time 20% of UDs are actively exchanging data over the network.
Table 3 additionally presents the simulated average UL and DL data rates per active UD for each UD density class (area) defined in the technical specification [
39,
40]. The average UL and DL data rates present the sum of data rates that need to be supported by the BSs in UL and DL transmission per active user. To accommodate such UL and DL traffic volumes of UDs in different UD density areas, where each area has a different activity factor representing the percentage of UDs that are simultaneously active, different numbers of BSs are allocated within a square kilometer area for each UD density class (
Figure 1).
In the analyses, the fixed number of installed base station sites (BSSs) having one BS1 per corresponding UD density class is assumed (
Table 3). According to
Figure 1 and
Table 3, in the case of rural UD density area, one macro BS1 is permanently allocated per 10 km
2, and one, two, and four macro BS1s are assumed to be allocated per the one square kilometer of the suburban, urban, and dense urban UD density areas (
Table 3), respectively. Such an assumption in the allocation of macro BS1s in simulations is a consequence of the need to ensure minimal signal coverage and minimal DV capacities in the corresponding UD density areas.
The remaining types of BSs (BS2 and BS3) are allocated according to the assessment of the needs dedicated to accommodating variations in the number of UDs and corresponding DVs in specific UD density areas. For that reason, the BS2 and BS3 types of BSs are named in this paper as “variable” BSs, since their allocation number varies in time (period from 2020 to 2030) according to UD densities (DV variations) and the needs for satisfying network EE constraints. According to
Table 4, the share of BS2 and BS3 in the total allocated number of variable BSs is set to 30%/70% ratio (
Figure 1), respectively. These BSs share is set arbitrarily according to the reasonable assumption that a significantly larger number of small BS3 are expected to be allocated in practice in comparison to the macro BS2 type of BSs.
4.3. Base Station’s Power Consumption
In terms of the number and amounts of EC, the BSs in 5G RAN are predominant components that have a considerable contribution to the total EC of the MNO network. A study in [
41] emphasizes that the RAN and especially the 5G BSs are the primary energy consumers in mobile networks, accounting for 57% of total network energy use. This fact points out that the 5G BSs represent a key network element that can be exploited for the potential improvement of 5G network EE.
The three main contributors to the 5G BS site (BSS) power consumption are BS site ancillary equipment, the activities related to the BS transmission, and signal processing [
42,
43]. The power consumption related to the radio transmission processes refers to the energy utilized by BS power amplifiers, AAUs, and radio frequency (RF) transceivers involved in converting baseband signals to wireless signals and their transmission. The power consumption related to signal processing involves the energy that BS baseband units (BBU) consume for digital signal processing, BS management, and BS communication with the backhaul (core) network. The power consumption of ancillary equipment includes the power losses due to conversions from the grid power supply to the primary power supply (AC/DC conversion and backup power systems), the power losses due to different DC-DC conversions and, for some types of macro BS sites (BSSs), the power consumption of active cooling, internal lighting, security system, and monitoring devices.
Table 4 summarizes the levels of the BSS instantaneous power consumption used in the analyses presented in this work. The presented BSS power consumptions are assumed for BSSs having only one 5G BS installed on the BSS. According to
Table 4, three different activity modes of BSs are assumed in simulations (active, sleep, and Tx power scaling mode), and for each of the BS activity modes, the BSS instantaneous power consumption has been presented. In
Table 4, the instantaneous power consumption of BSS with BS at full load assumes the active operating mode of BSs and transmission utilizing full BS capacity at maximum Tx power in all BS sectors. The instantaneous 5G BSS power consumption at full load presented in
Table 4 for BSS having installed single BS1 [
37], BS2 [
38], and BS3 [
17] are typical power consumptions of 5G BSS operating with BS radio configurations presented in
Table 2. In
Table 4, the presented BSS instantaneous power consumptions for 5G BSs in active mode at full load take into account all three main contributors to the 5G BSS power consumption that are previously described. Only in the case of small BS3, the power consumption of the ancillary BSS equipment is not accounted in maximal instantaneous power consumption at full load, since such types of BSs use natural air cooling and do not need an external cooling system or other ancillary BS site equipment.
Considering that many BSs in active operating mode are underutilized for a significant amount of their operational time and yet continue to consume energy, the analyzed 5G BS installation and operation scenarios exploit this observation for potential energy savings. In particular, analyses presented in [
44,
45] suggest a strategy that involves switching BSs to sleep operating mode during low-traffic periods, which can result in significant EC reductions.
Thus, besides the active mode of 5G BSs,
Table 4 also indicates the values of the 5G BSS instantaneous power consumption for BSs operating in sleep modes. It is assumed in simulations that the sleep BS operating mode is an energy-saving operation mode of BS that accounts for 10% of the instantaneous power consumption of active 5G BSs operating with full load [
46]. The sleep BSs operating mode is assumed in simulations as the inactive operating mode of BSs in which all major BSs components (power amplifiers, AAUs, RF chains, BBUs, etc.) are turned off for energy saving and only essential components needed for quick translation of BSs from sleep into active mode are operating.
Table 4 also indicates that the power-saving operating mode is not applicable for macro BS1, since this BS type is assumed to be constantly active for ensuring basic network signal coverage and capacity.
Besides the 5G BSs sleep mode of operation,
Table 4 also indicates the values of 5G BSs instantaneous power consumption operating in the power-saving mode. The power-saving mode is the 5G BS operating mode that assumes the usage of Tx power scaling techniques dedicated to improving the EE of BSs. Such techniques include the BS Tx power scaling performed according to the variations in the number of served UDs and corresponding DVs. According to
Table 4, the maximal instantaneous power consumption of the 5G BSs operating in power-saving mode is estimated to be 80% of the total instantaneous power consumption of active BSs operating at full load at maximal Tx power. This mode of operation is utilized in analyses since it was confirmed in [
14], emphasizing that adjusting the transmission power of the BSs according to spatial and temporal DV fluctuations can further improve the EE of mobile networks. Therefore, this analysis adopts a conservative assumption, proposing a 20% reduction in average instantaneous BSS power consumption compared to the power consumption of BSS having BS always operating in active mode at maximum Tx power and loads.
4.4. 5G BSs Deployment and Operation Scenarios in RAN
Due to the permanent increase in the number of 5G UDs and the need to ensure higher data rates for the 5G UDs in the future, a significant increase in the number of 5G UDs and DVs within the 5G HetNet of each of the analyzed countries is predicted during the 2020s (
Figure 2). To accommodate this increase in the number of UDs and DVs, in this research, four different 5G BSs installation and operation scenarios are simulated and analyzed at the level of the complete countries.
Table 5 summarizes information about all simulated 5G BSs deployment and operating scenarios. Different 5G BSs deployment and operation scenarios have different impacts on 5G HetNet EE metrics, and the scope of this impact is analyzed in this work.
In all simulated scenarios, the 5G BS installation approaches take into account the common practice of MNOs, which involves the initial deployment of a predetermined fixed number of macro 5G BSs (simulated as BS1 in this work) in each UD density area (
Figure 1). The amount of allocated BS1 BSs in each simulated UD density area corresponds to the number of BSs needed to provide basic signal coverage and capacities within a given UD density area. According to
Table 3, the number of these BSs is fixed for each UD density area (class), and it is equal for each simulated scenario (
Table 5). On the other hand, in different simulation scenarios, the number of variable BSs (BS2 and BS3) varies based on changes in the number of UDs that need to be served and their DV variations. Also, in different scenarios, usage of 5G BSs activation and operation strategies differs from the lack of any BS installation and RRM techniques that can contribute to the improvement of network EE, or to exploiting different RRM techniques that contribute to the 5G network EE improvement (
Table 5). These differences in terms of installation and the operation of 5G BSs among the simulation scenarios are described in the next subsection.
4.4.1. Description of Simulation Scenarios
In simulation Scenario 1 (
Table 5), the installation of variable BSs (BS2 and BS3) is based on future trends in DV requirements for the observed country. As DV demand increases in certain locations, the number of variable BSs (BS2 and BS3) is installed accordingly. This scenario does not use any RRM techniques to optimize the EE of BSs. Therefore, 5G BSs operate at their peak power consumption during their operating period with full radio resources activated independently on changes in DV intensity (
Table 5).
Table 5.
Simulated 5G BSs deployment and operating scenarios.
Table 5.
Simulated 5G BSs deployment and operating scenarios.
| Scenario | 5G BS Installation Strategy | 5G BS Activation
Strategy | Implemented EE Technique | Level of EC Optimization |
|---|
| Scenario 1 | Increase in installed number of variable BSs in accordance with future UDs growth by 2030. | The activation of the variable 5G BSs based on the increase in the number of UDs. | All BSs do not use any EE technique. | Reduced network EC due to the gradual installation of new 5G BS according to an increase in the number of UDs. |
| Scenario 2 | Preinstallation of all variable BSs based on projected maximum DV for the observed year. | Preinstalled variable BSs remain in sleep operating mode and enter active operating mode when UD capacity demand increases. | Macro BS1 does not use any EE technique and variable BSs (BS2 and BS3) utilize the sleep operation mode technique. | Reduced network EC due to inactive variable BSs that consume in sleep mode of operation 10% of the full load maximal power consumption. |
| Scenario 3 | Preinstallation of all variable BSs based on projected maximum DV for the observed year. | All BSs are constantly operating at the highest Tx power exploiting all radio resources during their operation. | All BSs do not use any EE technique. | No EC optimization (all BSs operate constantly utilizing all resources without any energy-efficient radio resources management). |
| Scenario 4 | Increase in installed number of variable BSs in accordance with future UDs growth by 2030. | All BSs are constantly operating in an active state. | Macro and variable BSs utilize the Tx power scaling operation technique based on UDs time and space variations. | Reduced EC due to the gradual installation of new 5G BS according to an increase in the number of UDs. Energy savings of up to 20% for BS in the active operating mode utilizing Tx power scaling mode. |
Scenario 2 is based on the preinstallation of all variable BSs required for the projected maximum DV in the specific UD density area (class) for the observed year of every analyzed country (
Table 5). Some of the preinstalled variable BSs remain in sleep operating mode during periods of low UDs network capacity demand and are activated in the periods when the capacity demand increases.
This scenario introduces utilizing an EE BS sleep mode technique which ensures that the maximum number of variable BSs are in this sleep operating state, consuming 10% of BS full load power consumption (
Table 4). As capacity demand increases, any of the variable BSs that are in a sleep state can be activated. However, the macro BS1 BSs remain operating in active mode without applying any of the RRM techniques.
Scenario 3 represents the traditional BS installation and operation strategy where all anticipated variable BSs (BS2 and BS3), needed for satisfying the maximum DV of the specific UD density area for the observed year, are preinstalled according to maximal capacity needs (
Table 5). In this scenario, all BSs remain in an active state during their operation, regardless of the actual need for transmission of DV. In this scenario, all BSs do not employ any RRM techniques for improving EE based on changes in the number and DV of UDs. Therefore, this approach to the installation and operation of 5G BSs in this simulation Scenario 3, does not employ any strategy for the improvement of 5G HetNet EE.
Similar to simulation Scenario 1, in simulation Scenario 4, the variable 5G BSs are progressively deployed according to the DV growth during the 2020s (
Table 5). Additionally, this operation scenario introduces Tx power scaling to dynamically adapt the Tx power of BSs to DV variations, thus partially adjusting the instantaneous power consumption to data traffic variations. By utilizing Tx power scaling based on DV variations, it is possible to achieve energy savings of up to 20% compared to transmissions without the employment of such an RRM technique (
Table 4). Notably, this RRM technique dedicated to improving network EE based on BSs Tx power scaling according to UD traffic activity is applied to both macro and variable BSs.
Due to the simulation model simplification, simulation analyses were performed by assuming full coverage of the analyzed countries with mobile network signal, and this coverage includes areas with demanding geography reliefs that have been unpopulated and in reality are uncovered with mobile network signal. Also, due to the simplification of the simulation model, the performed simulation analyses do not take into account the impact of changes in the number of UDs caused by tourist movements on the mobile network energy consumption.
4.5. Characteristics Comparisons of the Simulation Model
The network simulation model used in this study represents a notable advancement over those in our prior works which were focused on analyzing 5G network EE using static UD areas and DVs [
5,
18]. In contrast, the simulation model in this study incorporates dynamic projections of UD growth based on GIS allocation of UDs in four distinct UD density areas for Croatia and The Netherlands during the 2020s. This provides a significantly more realistic simulation of the increase in the number of UDs and corresponding traffic growth, consequently resulting in a more realistic assessment of 5G HetNet capacity needs over time.
Also, key differences compared with previous studies [
5,
18] include the introduction of three distinct BS types (BS1, BS2, and BS3), each operating across different frequency bands (FR1 and FR2). The introduction of three BS types expands the analysis to different frequency ranges (FR1 and FR2), with BS1 operating at lower frequencies (800 MHz in FR1) for broader coverage, BS2 functioning at mid-band frequencies (3.6 GHz in FR1) to balance coverage and capacity, and BS3 designated to ensuring high-throughputs and localized deployments operating in millimeter-wave frequencies (26 GHz in FR2). This contributes to a significant improvement over the previous simulation models presented in [
5,
18], which are based on the general BS model without the granularity of exploiting specific BS configurations across different frequency ranges and operating parameters. This inclusion of different BS models allows for a more detailed analysis of EC and capacity under real-world conditions.
In our earlier studies [
5,
18], five distinct BS installation and operation scenarios have been used to explore the impact of DV growth on EE metrics. In this work, we retain four of the five original scenarios, shifting the focus toward more comprehensive energy-saving strategies. More specifically, this work emphasizes the possibility of dynamic adaptation of radio resources of all BSs to network conditions, rather than selectively applying Tx power scaling to only certain BS types.
In addition, the BS capacity modeling in this paper introduces more detailed calculations for the BS data volume capacities than those in [
5,
18], incorporating parameters like bandwidth, subcarrier spacing, modulation order, and transmission overheads. This enables the modeling capacities of different BS types that better reflect real-world deployment and performance under different practical implementations.
One significant enhancement of the simulation model used in this work over previously used models in [
5,
18] is the shift from a generalized user activity factor applied uniformly across all UD density classes (areas) to an analysis performed with UD density class-specific activity factor. In previous simulation models used in [
5,
18], the activity factor presents a percentage of the maximum UD density across various UD density classes, and the analysis was conducted without distinction among different UD density classes (areas). However, in this work, the activity factor is specific to each UD density class (rural, suburban, urban, and dense urban). This approach more accurately simulates realistic UD data traffic patterns by taking into account the percentage of UDs that are actively transmitting or receiving data in each UD density class (area). Such an approach enables the model to reflect the actual temporal and spatial variability of network load across different UD density areas (classes). Thus, the use of class-specific activity factors ensures a more realistic and precise estimate of the EE metrics for different UD areas of 5G HetNet, as it captures the behavior of unique DV patterns for each UD density area.
Additionally, a key advancement of the simulation model in comparison with simulation models used in previous works [
5,
18] is in the use of country-specific projected trends in changes of DVs (in Croatia and The Netherlands), for simulating 5G HetNets behavior during the 2020s. This approach differentiates this simulation model from our prior studies that rely on a more generalized representation of changes in DV trends.
Thus, the simulation approach proposed in this work enables a more precise analysis of changes in 5G network EE, that is based on the unique UD density areas of each country.
5. Analytical Framework for Estimating 5G Network Energy Efficiency
A comprehensive analytical framework that establishes the basis for an evaluation of data and coverage 5G network EE for selected countries is introduced in this section. The Equations (1) and (2) serve as a basis for evaluating the changes in the two EE metrics of the 5G mobile network in each country during the 2020s.
Table 6 presents parameters used in this work for expressing the analytical framework based on which the analyses of 5G mobile networks EE for each country were performed. Let
be an index representing UD density classes (areas), defined as
j =
, where
is the total number of UD density classes (
Table 3). Also, let
be an index representing the simulated 5G network installation and operation scenario under consideration, defined as
s =
, where
corresponds to the total number of analyzed simulation scenarios (
Table 5). Let
l be an index representing individual one square kilometer areas within the
j-th UD density class, defined as
l =
, where
represents the total number of individual one square kilometer areas associated with the
j-th UD density class of the
s-th simulation scenario. Additionally, let
be an index representing a 5G UD within the
j-th UD density class, defined as
i =
, where
is the maximal number of 5G UDs in the
j-th UD density class of the
s-th simulation scenario. Lastly, let
k be an index representing BSS with a specific BS type defined as
k , where
represents the total number of different BS types used for the EE assessment (
Table 2 and
Table 3).
In assessing 5G network EE, a key parameter is the total area of the specific UD density class of a country. This parameter measures the total geographic area in square kilometers with a certain density class of 5G UDs and thus indicates the extent of that UD density class within the country. The total area of the UD density class for a specific country (
) is defined as follows:
where
represents the
l-th individual one square kilometer area of the
j-th UD density class in the
s-th simulation scenario.
5.1. Estimation of Transferred Data Volume in UD Density Areas
In the evaluation of mobile network EE, it is important to know how much data is transferred between BSs and UDs in specific UD density classes. The total number of 5G devices for the
j-th UD density class in the
s-th simulation scenario (
) was calculated from the population dataset obtained in the form of GeoTIFF files (
Table 1). It is represented as the sum of all 5G UDs in the specific UD density class (area) as follows:
where
is the number of 5G devices in the
l-th square kilometer area of the
j-th UD density area of the
s-th simulation scenario. This parameter serves as the basis for determining the DV and required number of allocated BSs per UD density class. Thus, the total DV for the
j-th device density class in the
s-th simulation scenario (
is calculated using the next equation:
where
is the average data rate of the
i-th UD in the
j-th device density class that needs to be ensured by the 5G network to each UD at any moment. The values of
are defined in
Table 3 for UL and DL transmission and these values are recommended in technical specification [
39,
40] as estimated values of UD data rates for each UD density class.
Table 6.
Parameters used in analyses.
Table 6.
Parameters used in analyses.
| Index/Parameter | Definition |
|---|
| c | Aggregated signal component carriers () |
| UD density classes/areas () |
| UD in the j-th UD density class/area () |
| Square kilometer areas of the j-th UD density class ( |
| BS types ) |
| Set of BSs installation and operational scenarios ) |
| Total surface of the j-th UD density class (area) of the s-th simulation scenario |
| Number of the l-th individual one square kilometer area of the j-th UD density class in the s-th simulation scenario |
| Number of all UDs in a j-th UD density class (area) of the s-th simulation scenario |
| Number of 5G devices in the l-th square kilometer area for the j-th UD density class (area) of the s-th simulation scenario |
| The average data rate for the j-th UD density class (area) |
| UD activity factor for the j-th UD density class (area) of the s-th simulation scenario |
| Total DV for the j-th UD density class (area) of the s-th simulation scenario |
| Average DV per km2 for the j-th UD density class (area) of the s-th simulation scenario |
| Scaled average DV per km2 for the j-th UD density class of the s-th simulation scenario |
| Maximal/total DV transferred by BS of k-th type in the j-th UD density class |
| Remaining average DV per km2 ( in the j-th UD density class of the s-th simulation scenario |
| Remaining scaled average DV per km2 in the j-th UD density class of the s-th simulation scenario |
| is the maximum DV capacity that BSs of k-th type can transfer |
| DV distribution ratios for the k-th BS type |
| Number of preinstalled BS1 BSs per square kilometer that is equal for each j-th UD density class of every s-th simulation scenario |
| Number of variable BSs in the j-th UD density class of the s-th simulation scenario installed according to the amount of |
| Number of variable BSs in the j-th UD density class of the s-th simulation scenario installed according to the amount of |
| Instantaneous power consumption of 5G network for the j-th UD density class (area) of the s-th simulation scenario |
| Instantaneous power consumption of 5G BS of the k-th type |
| Power consumption of k-th BS type operating in sleep mode |
| Instantaneous power consumption of 5G BS of the k-th type in the Tx power scaling operating mode |
| Data EE metric (amount of data transferred per unit of consumed energy in the observed device density class for different scenarios) |
| Coverage area EE metric (size of area covered per unit of consumed energy in a specific device density class for different scenarios) |
| DR | Overall BS data rate |
| Number of MIMO layers per component carrier c |
| Modulation order for DL/UL communication per component carrier c |
| Scaling factor per component carrier c (1, 0.8, 0.75, and 0.4) |
| Number of resource blocks in bandwidth BW (c) per component carrier c |
| Overhead percentage of the portion of the available bandwidth for the c-th component carrier |
| ECMN | Annual EC of mobile network or sub-network |
| DVMN | Total network DV transferred by MNO equipment in RAN |
| T | Time period equal to one year |
To determine the EE metrics of a 5G mobile network for a specific country, the average DV per square kilometer of the
j-th UD density class in the
s-th simulation scenario
was exploited in the analyses. This parameter provides an understanding of how much average DV is generated by all UDs in every square kilometer area of the
j-th UD density class of a country. The average DV per square kilometer of the
j-th UD density class (area) in the
s-th simulation scenario is formulated as follows:
Based on
, the number of BSs that need to be allocated in the square kilometer of the
j-th UD density area can be determined, and, thus, the EC of allocated BSs can be estimated. However, the average area DV per square kilometer of the
j-th UD density class (
) do not reflect the real DV amounts of UDs in 5G networks and for estimation of real DV variations in the
j-th UD density class, the scaled average DV per square kilometer of the
j-th UD density class (
) need to be utilized. More specifically, the average area DV per square kilometer for the specific UD density class (
) is scaled with an activity factor of UDs in the
j-th UD density area (
) in order to be:
where the activity factor (
is defined according to the technical specification [
39,
40] (
Table 3), and is thus a multiplier that adjusts the average DV to account for the usage of real DV patterns of the UDs in the specific UD density area. Thus,
is the scaled average DV per square kilometer of the
j-th device density class in the
s-th simulation scenario. It is a measure of network demand that reflects both, the number of UDs and their real daily DV intensity variations within the
j-th UD density area.
5.1.1. Estimation of Transferred Data Volume in Specific Simulation Scenarios
For each of the analyzed scenarios, different approaches to 5G network power consumption and EE estimation were utilized. For example, in Scenarios 1 and 4 of the 5G network EE assessment, the focus is on adapting the 5G network infrastructure and RAN resources to meet realistic DV requirements (
Table 5). This adaptation includes adjusting the number of installed variable BSs (BS2 and BS3), the sleep state activations and deactivations of variable BSs (in Scenario 1), and transmission power scaling of all BSs (in Scenario 4). In analyzed scenarios, network planning in terms of the number of installed 5G BSs primarily relies on satisfying the trend of increase in DV caused by an increase in the number of 5G UDs during the 2020s. Additionally, Scenarios 2 and 3 include the preinstallation of all variable BSs needed for accommodating the total average network DV transferred per square kilometer (
for the observed year (
Table 5). Scenarios 2 and 3 also involve preinstalling variable BSs according to projected maximum DV capacity needs during the 2020s and their activation according to realistic DV variations (
) in specific UD density areas (
Table 5). Thus, simulation scenarios require the use of both
and
parameters to accurately simulate network operations and data servicing requirements. These differentiated approaches in using
and
parameters in analyses of different scenarios, reflect the versatile operating conditions of 5G networks which enables a comprehensive simulation analysis of 5G network EE in different countries.
Besides the average (
) and scaled area DV (
) per square kilometer of the
j-th UD density class in the
s-th simulation scenario, the calculation of the remaining average DV per square kilometer (
and the remaining scaled average DV per square kilometer
of the
j-th UD density class in the
s-th simulation scenario is also performed. Both remaining DVs are DVs that are transferred by variable BSs (BS2 and BS3). These DVs exclude the DV transferred by the preinstalled BS1 BSs and are calculated according to the next equations:
The
in Equations (8) and (9) indicate the predetermined number of BS1 BSs installed per square kilometer in the
j-th UD density area (presented in
Table 3 and
Figure 1) and the
represent the maximal DV capacity of the BS1 (calculated according to (3) and presented in
Table 2). Thus, the
in Equation (8) is the remaining average DV per square kilometer of the
j-th UD density area that excludes the DV transferred by the BS1 BSs. This remaining average DV per square kilometer (
) is further utilized in determining the total number of allocated variable BSs (BS2 and BS3) in the
j-th UD density area of the
s-th simulation scenario. The
in Equation (9) indicates the remaining scaled average DV per square kilometer of the
j-th UD density area which excludes the DV transferred by the BS1 BSs. The remaining scaled average DV per square kilometer (
is further utilized in determining the number of variable BSs (BS2 and BS3) operating in active or sleep mode, that are needed for the transfer of remaining DVs which will not be transferred by BS1 BSs.
5.1.2. Estimation of the Number of Installed Base Stations in the UD Density Area
When planning the deployment of telecommunications infrastructure, it is essential to consider the varying demands for DV transfer of different geographic UD density areas. To efficiently allocate resources while meeting these demands, equations for calculating the required variable BSs number for each UD density class are further developed. Based on the determined remaining average DV (
) and the remaining scaled average DV (
) for the
j-th UD density area, the number of variable BS (BS2 and BS3) per square kilometer can be estimated by taking into account the DV capacities of each BS type (presented in
Table 2 and calculated based on (3)). While the number of BS1 BSs remains constant for each square kilometer due to the need for providing basic network coverage and capacity within specific UD density area (
Figure 1,
Table 3), the estimation of the number of installed variable BSs is a simulation scenario dependent and is determined by utilizing either the
or
parameter. This ensures that the network infrastructure is efficiently adapted to meet the different DV demands of different UD density areas of specific countries for every analyzed simulation scenario.
The number of variable BSs (of type
that are required for transferring the
and
R of the
j-th UD density class in the
s-th simulation scenario is calculated according to the following equations:
where
is the number of variable BSs per square kilometer of the
k-th type (BS2 and BS3) allocated for transfer of the
in the
j-th UD density area for the
s-th simulation scenario, the
is the number of variable BSs per square kilometer of the
k-th type allocated for the transfer of the
in the
j-th UD density area of the
s-th simulated scenarios, the
represents the DV distribution ratio among the variable BSs of type
(BS2 and BS3), and
is the maximum DV capacity that BSs of type
(BS2 and BS3) can transfer. To distribute the transfer of
or
among variable BSs (BS2 and BS3), the distribution ratio equal to 30%/70% between the number of installed BS2 and BS3 is utilized (
Table 4). Thus, the values of BS distribution ratios in Equations (11) and (12) equal to
and
(
Table 4). Thus, it is assumed that a larger number of small BS3 will be allocated in practice in comparison with a smaller number of allocated macro BS2, and the 30%/70% distribution ratio is arbitrarily selected based on reasonable assumption.
5.1.3. Estimation of Instantaneous Power Consumption of UD Density Area
Based on the calculated number of variable BSs installed per square kilometer (
and
, the instantaneous power consumption
of BSs allocated in the
j-th device density class of the
s-th simulation scenario can be calculated. Due to differences in BS installation and operation management strategies among simulated scenarios, for each simulation scenario, a different equation for the calculation of the
is developed. Given that there are three types of BSs (
k = 3), each with different instantaneous power consumptions at specific DV loads and modes of activity (
Table 4), the BSS instantaneous power consumption per square kilometer for each UD density class in Scenario 1 (
can be formulated as follows:
where the
is the instantaneous power consumption of the
k-th BS type (
Table 4) and the
is the number of
k-th type BSs allocated in the
j-th UD density class per square kilometer for transfer of
. Accordingly, in Equation (13) the
represents the instantaneous power consumption of BS1 (
Table 4) and
is the number of installed BS1 BSs per square kilometer of the
j-th UD density area in the
s-th simulation scenario.
Simulation Scenario 2 involves preinstalling all variable BSs to ensure the projected maximum DV for the observed year. These variable BSs operate initially in a low-power sleep mode when they are not needed to meet current DV demands and are activated according to an increase in DV of the
j-th UD density area. This simulation scenario anticipates a maximal number of variable BSs installed in advance, which remain inactive until DV increases. On the other hand, in Scenario 2, a fixed number of macro BS1 BSs continue to operate without utilizing any energy-saving technique. Therefore, the BSS instantaneous power consumption per square kilometer of the
j-th UD density area in Scenario 2 (
) can be formulated as follows:
where the
is the instantaneous power consumption of the
k-th BS type (
Table 4), the
represents the instantaneous power consumption of BS1 (
Table 4),
is the number of preinstalled BS1 BSs per square kilometer that is equal for each
j-th UD density class of every
s-th simulation scenario (
Table 3), the
is the number of the allocated BSs of
k-th type in the
j-th UD density class per square kilometer for transfer of
, the
is the number of
k-th type BSs allocated in the
j-th UD density class per square kilometer for transfer of
, the expression
represents the number of BSs of type
that are operating in sleep mode, and
is the power consumption of
k-th BS type operating in sleep mode (according to
Table 4 assumed to be 10% of
maximal power consumption).
Scenario 3 involves the preinstallation of variable BSs that need to satisfy predicted maximum DV capacity demands for the observed year. This scenario does not include any techniques for improving network EE; therefore, all BSs operate in the active state at peak power consumption. The BSS instantaneous power consumption per square kilometer of the
j-th UD device density class in Scenario 3 (
can be formulated as follows:
Scenario 4 includes an increase in the number of variable BSs in accordance with the growth of the DV during the 2020s. In this scenario, the number of installed variable BSs in time is dynamically increased based on the actual DV increase observed during the 2020s. A key feature of Scenario 4 is the introduction of the Tx power scaling technique, where both macro (BS1) and variable BSs (BS2 and BS3) utilize this energy-saving technique. The technique is based on scaling the BS Tx power according to DV fluctuations. The BSS instantaneous power consumption per square kilometer of
j-th UD density class in Scenario 4 (
can be formulated as follows:
where
is the power consumption of the
k-th BS type in the Tx power scaling mode of operation (
Table 4) and
is the number of
k-th type BSs in the
j-th UD density class per square kilometer allocated for the transfer of
.
5.1.4. Estimation of Energy Efficiency Metric of UD Density Area
To formulate the data and coverage EE metrics of the
j-th UD density classes for each of the 5G network simulation scenarios, the parameters and equations defined in the previously presented analytic framework are utilized. According to Equation (1), the data EE is defined as the amount of data transferred per unit of consumed energy. In terms of this analysis, the data EE metric for the
j-th UD density class of the
s-th simulation scenario (
) can be expressed as the ratio of the transferred
per square kilometer in the
j-th UD density class and the energy consumed per square kilometer by the BSS infrastructure allocated in the
j-th UD density class. The data EE metric is formulated as follows:
where the
represents the instantaneous power consumption of BSSs infrastructure per square kilometer allocated in the
j-th UD density class of the
s-th simulation scenario. Equation (17) for the
s-th simulation scenario presents the data EE metric expressed per square kilometer of the
j-th UD density area. Also, according to Equation (2), the coverage area EE is defined as the area covered by the 5G signal per unit of energy consumed. In terms of this analysis, the area EE metric is expressed as the ratio of the total size of the
j-th UD density area of the
s-th simulation scenario (
and the energy consumed by the BSS infrastructure allocated in the
j-th UD density area. The area EE metric (
) is formulated as follows:
where the
expresses the size of the
j-th UD density area in the
s-th simulation scenario and
T refers to the period assumed in the analyses (equals to 1 year).
5.2. Calculation of the Allocated Number of Variable BSs Based on Algorithm 1
The calculation of the number of allocated variable BSs (BS2 and BS3) in every of the
j-th UD density areas for each analyzed country in the
s-th simulation scenario is performed according to Algorithm 1. Based on input parameters (line 1), Algorithm 1 calculates the number of variable BSs (BS2 and BS3) as output parameters for each of the
s-th scenarios (line 2). As specified in lines 3–4, Algorithm 1 iterates for each of the
j-th UD density areas (classes) of the
s-th simulation scenario. This ensures that calculations are performed for all defined UD density areas (classes), including rural, suburban, urban, and dense urban areas.
| Algorithm 1. Calculation of the number of allocated variable BSs |
Input: S, M, , K, Output: , for each simulation scenario s from 1 to S do for each UD density class j from 1 to M do for l from 1 to do += end for for l from 1 to do += end for i for i from 1 to do += end for = / = × = − (× ) = − (× ) = ceiling ((RADVjs × )/)) = ceiling ((RSADVjs × )/)) = ceiling ((RADVjs × )/)) = ceiling ((RSADVjs × )/)) end for end for
|
Based on information related to the specific users’ density allocation of a country obtained for the GeoTiff file, Algorithm 1 in lines 5–7 calculates the total area of each j-th UD density class and in lines 8–10, calculates the total number of UDs in each j-th UD density class. Considering the calculated total number of UDs in the j-th UD density area (class), in lines 11–13, Algorithm 1 calculates the total DV of the j-th UD density class and calculates the average DV per square kilometer of the j-th UD density area (class). Based on the calculated average DV per square kilometer of the j-th UD density area (class), in lines 14–17, the algorithm estimates the average, the scaled average, the remaining average, and the remaining scaled average DV per square kilometer of the j-th UD density area (class), respectively. Based on the previously calculated parameters, in the last execution phase of Algorithm 1 (lines 18–22), the calculation of the number of installed variables BS2 and BS3 for transferring RADVjs and RSADVjs, respectively, is performed. Algorithm 1 ends after calculating the installed variable BSs in all UD density areas for all scenarios (line 23).
5.3. Calculation of the UD Density Area Energy Efficiency Metrics Based on Algorithm 2
Calculating the data and coverage area EE metrics of every
j-th UD density class of the
s-th simulation scenario is performed according to Algorithm 2. Based on input parameters, some of which have been calculated as an output of Algorithm 1 (
,
,, Algorithm 2 calculates data and coverage area EE metrics for every of the
s-th simulation scenarios (line 3). As specified in line 4, Algorithm 2 starts iterating for each of the
j-th UD density areas (classes) of the
s-th simulation scenario.
| Algorithm 2. Calculation of the instantaneous power consumption for different scenarios |
Input: S, M, K, T, ,, Output: , , for each simulation scenario s from 1 to S do for each UD density class j from 1 to M do = 0 if s == 1 then += × for each of the BS types k from 2 to K do += × end for end if if s == 2 then += × for each of the BS types k from 2 to K do SleepBSCount = − += SleepBSCount × += × end for end if if s == 3 then += for each of the BS types k from 2 to K do += × end for end if if s == 4 then += × for each of the BS types k from 2 to K do += × end for end if / = 1/( × T) end for end for
|
After setting the initial instantaneous power consumption of every j-the UD density area to 0 W (line 5), Algorithm 2 iteratively calculates the instantaneous power consumption of every j-th UD density area (class) for Scenario 1 in lines 6–11, for Scenario 2 in lines 12–19, for Scenario 3 in lines 20-25, and for Scenario 4 in lines 26–31. Based on the calculated instantaneous power consumptions of every j-th UD density area and according to calculated (by Algorithm 1) the total area size and DVs of each j-th UD density class, Algorithm 2 in line 32 calculate the data EE metric. Also, in line 33, for a predefined time period of one year, the Algorithm 2 calculates the coverage EE metrics of each j-th UD density class. Algorithm 2 ends after calculating the EE metrics in all UD density areas for all scenarios (line 34).
5.4. Comparison of the Analytical Framework Characteristics
The analytical framework for the evaluation of network EE includes several important elements that add significant differences and enhancements to the analytical framework introduced in [
5,
18]. This framework distinguishes from the one introduced in [
5,
18] by employing UD density allocation that is country specific for Croatia and The Netherlands, enabling more accurate and realistic estimation of EE metrics in diverse, real-world 5G network environments. In contrast to the analytical framework presented in previous studies [
5,
18] that relied on generalized trends in DV variations, the analytical framework proposed in this work adapts the EE analysis to the specific UD density areas and geographic characteristics of the analyzed countries.
A notable advancement of the analytical framework proposed in this work is in the use of UD density area-specific activity factors, which enable the simulation of UDs and corresponding DV changes more realistically across different UD density areas (rural, suburban, urban, and dense urban). This refinement allows capturing the expected UD increase during the 2020s in specific UD areas and DV variations as they occur within different regions of the country, making the analytical framework better suited to reflecting real-world traffic conditions.
Another aspect that contributes to the accuracy improvement of the analytical framework is the introduction of the
SADV parameter. This parameter defines the country-specific
ADV parameter by incorporating the UD density area-specific activity factor, allowing it to more accurately represent real-world variations in a number of active UDs across different UD density areas. The analytical framework in [
5,
18] employed simplified static estimates of DV variations, failing to account for country-specific temporal and spatial changes in the number of UDs and corresponding DVs. By utilizing the
SADV parameter, the analytical framework proposed in this work enables a more detailed and dynamic analysis of network EE metrics, thus addressing one of the key limitations of earlier approaches presented in [
5,
18].
Additionally, the presented analytical framework employs advanced modeling of BSs capacity estimation. This provides a broader and more granular selection of operational parameters of analyzed BS types compared to previous models that relied on uniform and more general BS capacity estimation. By taking into account additional radio resources in BS capacity estimation such as bandwidth, modulation order, resource blocks, subcarrier spacing, and transmission overheads, this enables the proposed analytical framework to offer a more precise perspective on how different BS types perform under varying network capacity demands. Thus, the presented analytical framework differentiates from analytical frameworks in [
5,
18], by offering country-specific insights about UD density variations in different UD density areas during the 2020s, which makes the simulation of 5G HetNet behavior closer to real practical applications.
6. Results
In this section, the different installation and operation scenarios of 5G BSs in the 5G RAN have been analyzed in terms of data and coverage area EE metrics on the example of the two specific countries, which are Croatia and The Netherlands. Due to diversities in geographical reliefs and an overall number of estimated 5G UDs in 2030, the 5G HetNets of those countries have been selected for analysis as prominent examples of 5G networks.
However, it is worth emphasizing that the developed simulation model based on Algorithm 1 and Algorithm 2 enables analyses of EE metrics for any of the world countries in the future period at the countries’ national level.
The analysis performed on the example case of The Netherlands and Croatia was conducted for four distinct 5G BSs installation and operation scenarios presented in
Table 4, at the countries’ national level. In terms of the versatile 5G BSs installation approaches, the concept based on the continuous installation of the 5G BSs according to the increase in 5G UDs through the 2020s (Scenario 1 and 4 in
Table 5) and the concept of preinstallation of all 5G BSs according to estimated needs for capacity in the observed year (Scenario 2 and 3 in
Table 5) were explored. In addition, the analyses were performed in terms of different operation modes of the 5G BSs that include on and off switching of variable BSs (in Scenario 2) and Tx power scaling (in Scenario 4) according to estimated DV variations (
Table 5).
Each of these 5G BS operating modes is characterized by different power consumption parameters, as detailed in
Table 4. The aim of this analysis is to evaluate the changes in data and area EE metrics of 5G HetNet of each country for two observed years (2020 and 2030). The analysis is based on projected DV growth within the 5G HetNet of the selected countries for two observed years according to the simulated BS installation and operational scenarios (
Table 5). The analysis provides insights into the effectiveness of different EE strategies in managing the evolving demands for serving an increased number of 5G UDs in the 5G networks of Croatia and The Netherlands. Also, the analysis sheds light on the future trends in changes in the EE metrics of the 5G RAN on the level of the whole country.
6.1. Data Energy Efficiency Analyses of UD Density Areas
A comparative analysis of the obtained simulation results for the data EE metric of the Croatian and Dutch 5G mobile network in the years 2020 and 2030 is presented in this subsection. In
Figure 4 and
Figure 5, the results of analyses related to the trends in changes in data EE metrics are presented for each simulation scenario. The data EE metrics are presented in
Figure 4 and
Figure 5 for the years 2020 and 2030 of every simulation scenario on a scale of six different levels of data EE metrics, ranging from the lowest (equal to 0.00–0.06 Mbit/J) to the highest (>1.8 Mbit/J).
In the case of results for all simulation scenarios presented in
Figure 4a,c,e,g and
Figure 5a,c,e,g for the year 2020, the low data EE metrics (>0.06 Mbit/J) dominate on the national level. This suggests that the mobile network, in its initial phase of implementation, is characterized by high EC in relation to the amount of data it transfers. Thus, for every simulation scenario in 2020, the largest part of the Croatian and Dutch 5G network operates at the lowest data EE, suggesting that while the 5G network infrastructure is operational, it has not been fully utilized. Still,
Figure 4a,c,e,g and
Figure 5a,c,e,g show differences between data EE of Scenarios 1–4, even at this early stage of the 5G network implementations. In
Figure 4a,c,e,g and
Figure 5a,c,e,g, it can be seen that certain regions, primarily concentrated around urban centers with denser populations and higher data usage, achieve higher (1.0–1.8 Mbit/J) or the highest (>1.8 Mbit/J) data EE metrics. This can be particularly seen for Scenarios 1 and 4 which have, even in 2020, more regions with higher data EE metrics than those of Scenarios 2 and 3. Compared with Scenarios 2 and 3, somewhat larger areas of more data EE regions in the 5G networks are seen for Scenarios 1 and 4, which points to more effective approaches to initial 5G BSs installation and operation in terms of data EE.
For data EE metrics of simulation Scenarios 1–4,
Figure 4b,d,f,h and
Figure 5b,d,f,h present simulation results for Croatia and The Netherlands in the year 2030, respectively. According to
Figure 4b,d,f,h and
Figure 5b,d,f,h, in 5G networks of each country, an improvement in the country’s data EE can be observed for every analyzed simulation Scenario 1–4, respectively. This general improvement of data EE metric by 2030 is reflected in the implementation maturity of the 5G network infrastructure over the decade, which benefits from optimized network deployment and operation management, resulting in more efficient 5G networks in terms of data EE metric. More specifically, this improvement in the number and size of regions having higher data EE metrics (>0.2 Mbit/J) is more evident for Scenario 1 (
Figure 4b and
Figure 5b) and Scenario 4 (
Figure 4h and
Figure 5h) and somewhat less evident for Scenario 2 (
Figure 4d and
Figure 5d), while Scenario 3 has the lowest improvement of data EE metric by 2030 (
Figure 4f and
Figure 5f). For both countries, the results of simulation Scenarios 1 and 4 show that this transition from predominant regions having lower data EE efficiency in 2020 (
Figure 4a,c,e,g and
Figure 5a,c,e,g) to more in the number and size regions having higher data EE metrics in 2030 (
Figure 4b,d,f,h and
Figure 5b,d,f,h) confirms the need for practical implementation of BS installation approaches and operation strategies that contribute to the improvement of 5G network EE. According to results presented in
Figure 4b,d,f,h and
Figure 5b,d,f,h, the higher data EE metrics in 2030 are achieved around urban centers having a higher population density and greater use of the 5G network capacity, which consequently results with more energy-efficient use of the network infrastructure.
Figure 4h and
Figure 5h further highlight that Scenario 4 based on BS scaling of the Tx power and adapting the installation of new BS according to DV growth has the best long-term improvement of the data EE metric on the national level of the 5G network. Nevertheless, Scenario 1 (
Figure 4b and
Figure 5b), based on the adaptive installation of the BSs according to DV growth and lack of any EE management techniques in the operation of 5G BSs, achieved similar long-term improvements of data EE metrics as Scenario 2 (
Figure 4d and
Figure 5d), lacking any adaptive installation of variable BSs while implementing scheduling of sleep and active operation mode of variable BSs. This points to the necessity of implementing simultaneously both BS installation and resource management strategies (as in Scenario 4) to achieve the highest improvement in data EE metrics. Further proof of this point can be found in the worse results of the data EE metric for the case of Scenario 3 in 2030 (
Figure 4f and
Figure 5f), which are consequence of the lack of any 5G BSs installation and resource management strategies dedicated to improving 5G HetNet EE.
6.2. Coverage Area Energy Efficiency Analyses of UD Density Areas
A comparative analysis of the obtained simulation results of the coverage area EE metric for the Croatian and Dutch 5G mobile network in the years 2020 and 2030 are presented in
Figure 6 and
Figure 7, respectively.
Figure 6 and
Figure 7 present the regions of different UD density classes, which for each country and for the years 2020 and 2030 are assumed to have the same ranges of UD densities in each UD density area (class) according to defined in
Table 3. This means that dense urban, urban, suburban, and rural UD density areas presented in
Figure 6 and
Figure 7 have been defined according to the same range of UD densities of every UD density class. For such UD density areas, the values of coverage area EE metrics have been presented in
Figure 6 and
Figure 7 in the years 2020 and 2030, for Croatian and Dutch 5G networks, respectively. According to
Figure 6a and
Figure 7a, in 2020, the rural UD density class dominated in both countries, covering 99.96% of the land area encompassing 97.27% of devices in Croatia and 98.33% of the total land area encompassing 81.36% of the total devices in Dutch. The remaining areas of both countries in 2020 (
Figure 6a and
Figure 7a) belong to suburban areas with a small share of the total area of each country. The absence of the dense urban and urban UD density classes in
Figure 6a and
Figure 7a means that no region in both countries has reached the device density levels specified for these UD density classes. This is a consequence of the inception of the implementation of 5G networks having in this period a lower number of 5G devices in the network.
By 2030, the distribution of UD density classes in both countries undergo a significant transformation (
Figure 6b and
Figure 7b). More specifically, such transformation results in the estimated rural UD density class for the Croatian network equal to 90.27%, while for the Dutch network, the estimated rural UD density class falls to 44.2% of the total area of the country. However, the estimated areas of suburban UD density classes in 2030 for Croatia (equal to 7.78%) and The Netherlands (equal to 36.84%) increased, and even urban (equal for Croatia to 1.95% and for Netherland 18.55%), and in the case of The Netherlands the dense urban UD density class (equal to 0.41%) emerged by 2030 (
Figure 6b and
Figure 7b). In
Figure 6b and
Figure 7b, it can be seen that the largest transformation in the classification of UD density areas is for suburban and urban UD density regions, which become broader on account of the reduced size of rural UD density regions. This expansion of the suburban and urban UD density areas points to a significant increase in the density of 5G devices across both countries by 2030. Additionally, dense urban UD density areas have emerged in certain metropolitan areas of The Netherlands, characterized by high UD densities that are typical for the most densely populated urban environments. This change in UD density areas is the result of the wider adoption of 5G technology in 2030, driven by an increase in the number of UDs per square kilometer. Thus, such a shift in the distribution of UD density classes from 2020 to 2030 in both countries is a reflection of the evolving landscape of UD distribution caused by the expected increase in the number of 5G UD devices (
Figure 2), urbanization, and technological advancements imposing utilization of new use cases in the 5G network.
Changes in the Croatian and Dutch coverage area EE metrics for specific simulation scenarios are presented in
Figure 6 and
Figure 7, respectively. According to
Figure 6 and
Figure 7, significant changes in coverage area EE metrics can only be noted for the rural UD density class in the case of simulated Scenarios 1, 2, and 4 of the Croatian network. This substantial decrease in coverage area EE metrics can be attributed to the increase in the dispersion of 5G devices and DVs over the decade in rural UD density areas of Croatia, lacking the existence of urban and suburban UD density areas by 2030.
This increase in the density of 5G devices imposes a shift in coverage area EE metrics for rural UD density class to significantly lower values due to the necessity of ensuring the transfer of DV for a growing number of UDs through adding additional 5G RAN infrastructure. One exception includes the results obtained for the coverage area EE metrics of Scenario 3 (
Figure 6 and
Figure 7), which remain low and consistent (at 2.95 m
2/MJ) for both countries in 2020 and 2030. Thus, Scenario 3 characterized by all 5G BSs preinstalled according to DV needs in 2030 and 5G BSs actively operating without utilizing any energy-saving techniques, results in 2020 and 2030 with low coverage area EE metrics, on which UDs increase and UDs geographic distribution in both countries do not have any particular impact.
Figure 6.
Distribution of device density classes and coverage area EE metrics in Croatia: (a) for the year 2020 and (b) for the year 2030.
Figure 6.
Distribution of device density classes and coverage area EE metrics in Croatia: (a) for the year 2020 and (b) for the year 2030.
Figure 7.
Distribution of device density classes and coverage area EE metrics in The Netherlands: (a) for the year 2020 and (b) for the year 2030.
Figure 7.
Distribution of device density classes and coverage area EE metrics in The Netherlands: (a) for the year 2020 and (b) for the year 2030.
Contrary to rural UD density areas in Croatia, suburban UD density areas for Scenarios 1, 2, and 4 do not exhibit significant changes in coverage area EE metrics in the period from 2020 to 2030 (
Figure 6 and
Figure 7). This uniform pattern of the coverage area EE metrics for suburban UD density areas having similar values across Scenarios 1, 2, and 4 of both countries in 2020 and 2030, highlights that increases in UD densities and DVs in suburban UD density areas did not have a significant impact on coverage area EE metrics. This indicates that an increase in the size of the suburban UD density areas and corresponding DVs in both countries has been followed by 5G BSs installation and operation approaches that generate a stable increase in EC of 5G BSSs through a decade, maintaining consistent coverage area EE metric across suburban UD density areas. Overall, the results for the coverage area EE metrics confirm that the coverage area EE metrics are highly country dependent, which means that different geographies of the country with different concentrations of UDs and 5G use cases have a significant impact on coverage area EE metrics.
8. Conclusions
In this research, a comprehensive analytical framework for assessing the impact of an increase in the number of UDs during the 2020s on the EE of the 5G network has been developed. Based on the developed analytical framework, simulation analyses of future trends in changes of 5G HetNet EC and EE metrics for four different 5G BSs deployment and operation management scenarios have been performed. A simulation analysis is demonstrated using the example of the Croatian and Dutch 5G networks, which differ in the number of UDs and distribution of UD density areas. The obtained results reveal the trends in changes of the 5G HetNet EC and data and coverage area EE metrics for rural, urban, suburban, and urban dense 5G network UD density areas (classes).
The presented simulation results reveal that an increase in the number of UDs through the 2020s will have a positive impact related to the improvement of the data EE metrics of 5G networks in both countries. However, this positive EE gain is countered by the negative impact reflected in the decreased coverage area EE metric when the number of UDs increases in 5G networks. Although data and coverage EE of rural, suburban, urban, and urban dense UD density areas of analyzed countries might differ due to differences in UD densities and geographic sizes of specific UD density areas of each country, the obtained results show that the total yearly 5G network energy consumption of both countries will increase in the future. This increase will be present independently of implemented energy-saving concepts in the 5G network. However, implementing techniques for improving network EE in the form of the 5G BSs deployment and operation management according to an increase in the number of UDs can contribute to the significant reduction in yearly country network energy consumption and the improvement in data and coverage area EE metrics.
Also, the obtained results provide MNOs with crucial insights into the trade-offs between the necessity of serving a constantly increasing number of 5G UDs and 5G network EC under various 5G BSs deployment and operation management scenarios. The results of the analyses show that scenarios based on implementing the gradual deployment of the 5G BSs, the 5G BSs sleep modes, and Tx power scaling techniques according to UD growth demonstrate significant potential for improving data and coverage area EE metrics and reducing total network energy consumption. Thus, the insights obtained in this work are crucial for MNOs in strategizing the future deployment and operation management of 5G BSs, as they need to balance the necessity for expanding network coverage and capacity and ensuring network sustainability and EE.
Future work will be dedicated to analyses of the impact of the increase in the number of 5G UDs on EE of 5G networks of a large number of different countries differing in their geographic morphology and overall number of UDs.


