

Implementation of a Trust-Based Framework for Substation Defense in the Smart Grid


Abstract
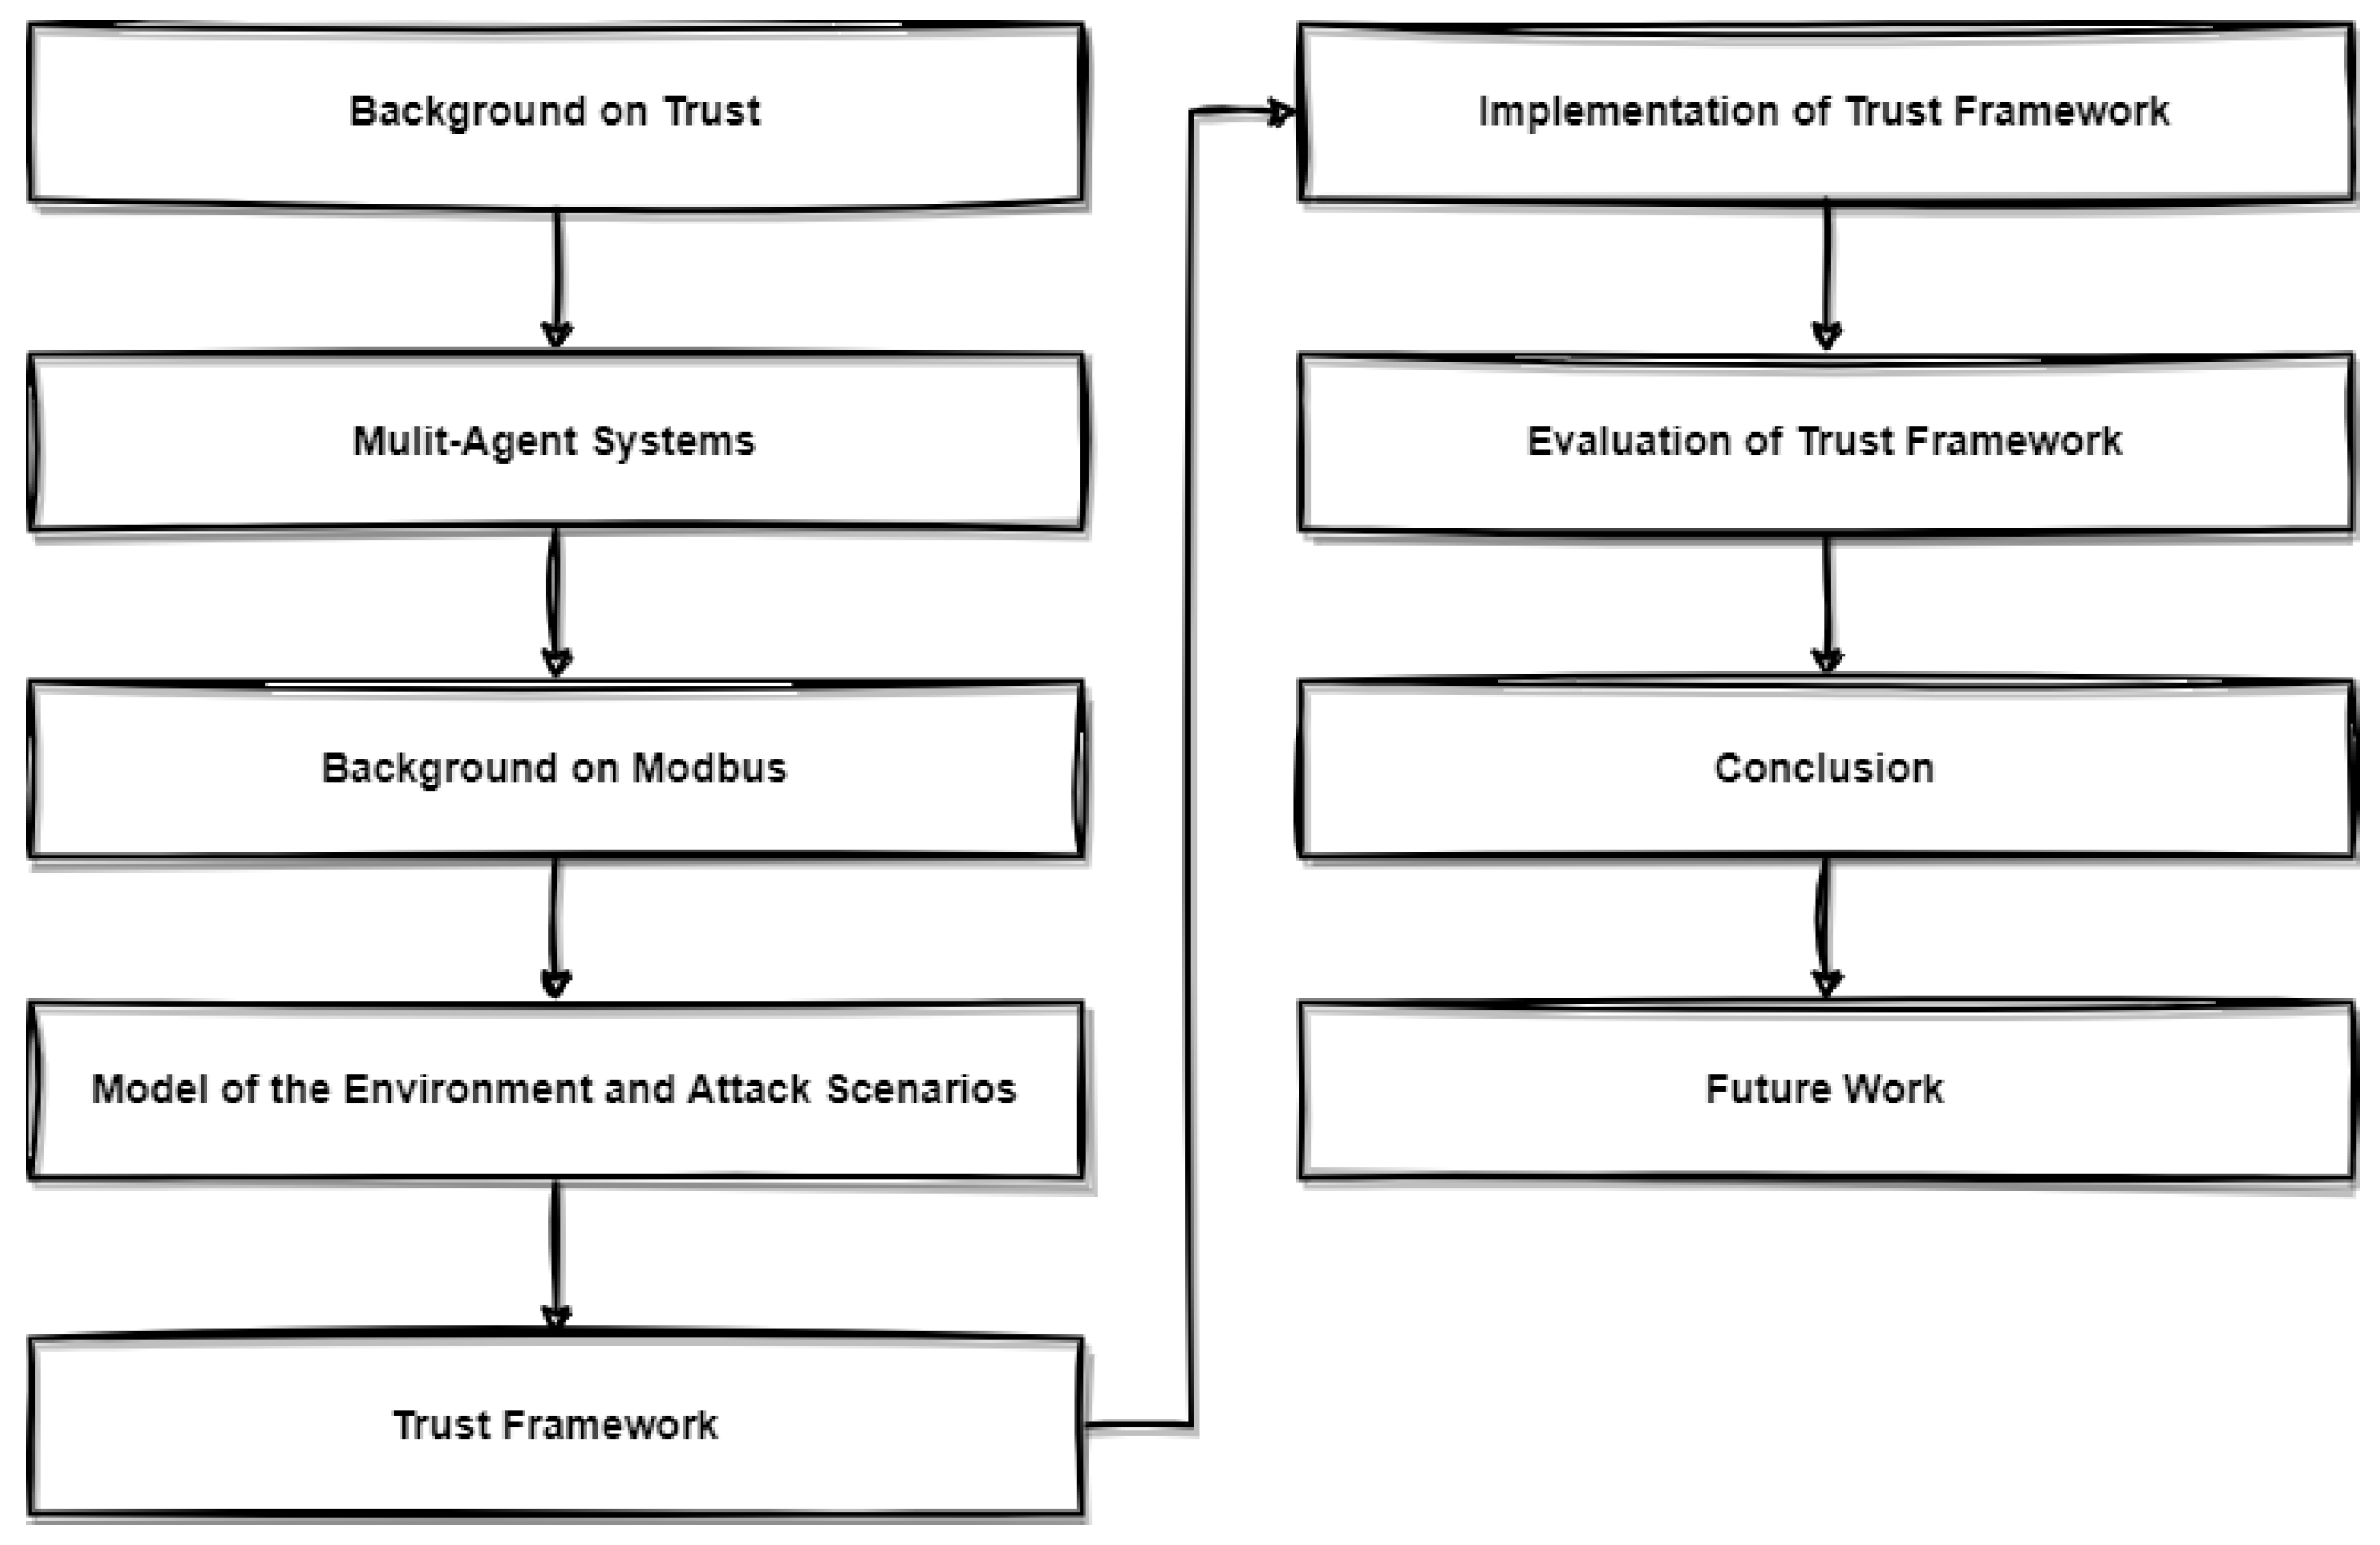
:1. Introduction
- Trust-Based Framework: A comprehensive framework designed to enhance the security of substations by incorporating trust-based mechanisms.
- Trust Model Component: A trust model integrated into the framework, responsible for detecting protocol-based attacks targeting IEDs and SCADA HMI systems.
- Risk Posture Model Component: A component within the framework that determines the substation’s risk posture in response to detected attacks.
- Trust Transferability Model Component: A component within the framework that determines whether a device and its trust capabilities can be transferred to a different substation environment and monitors its integration.
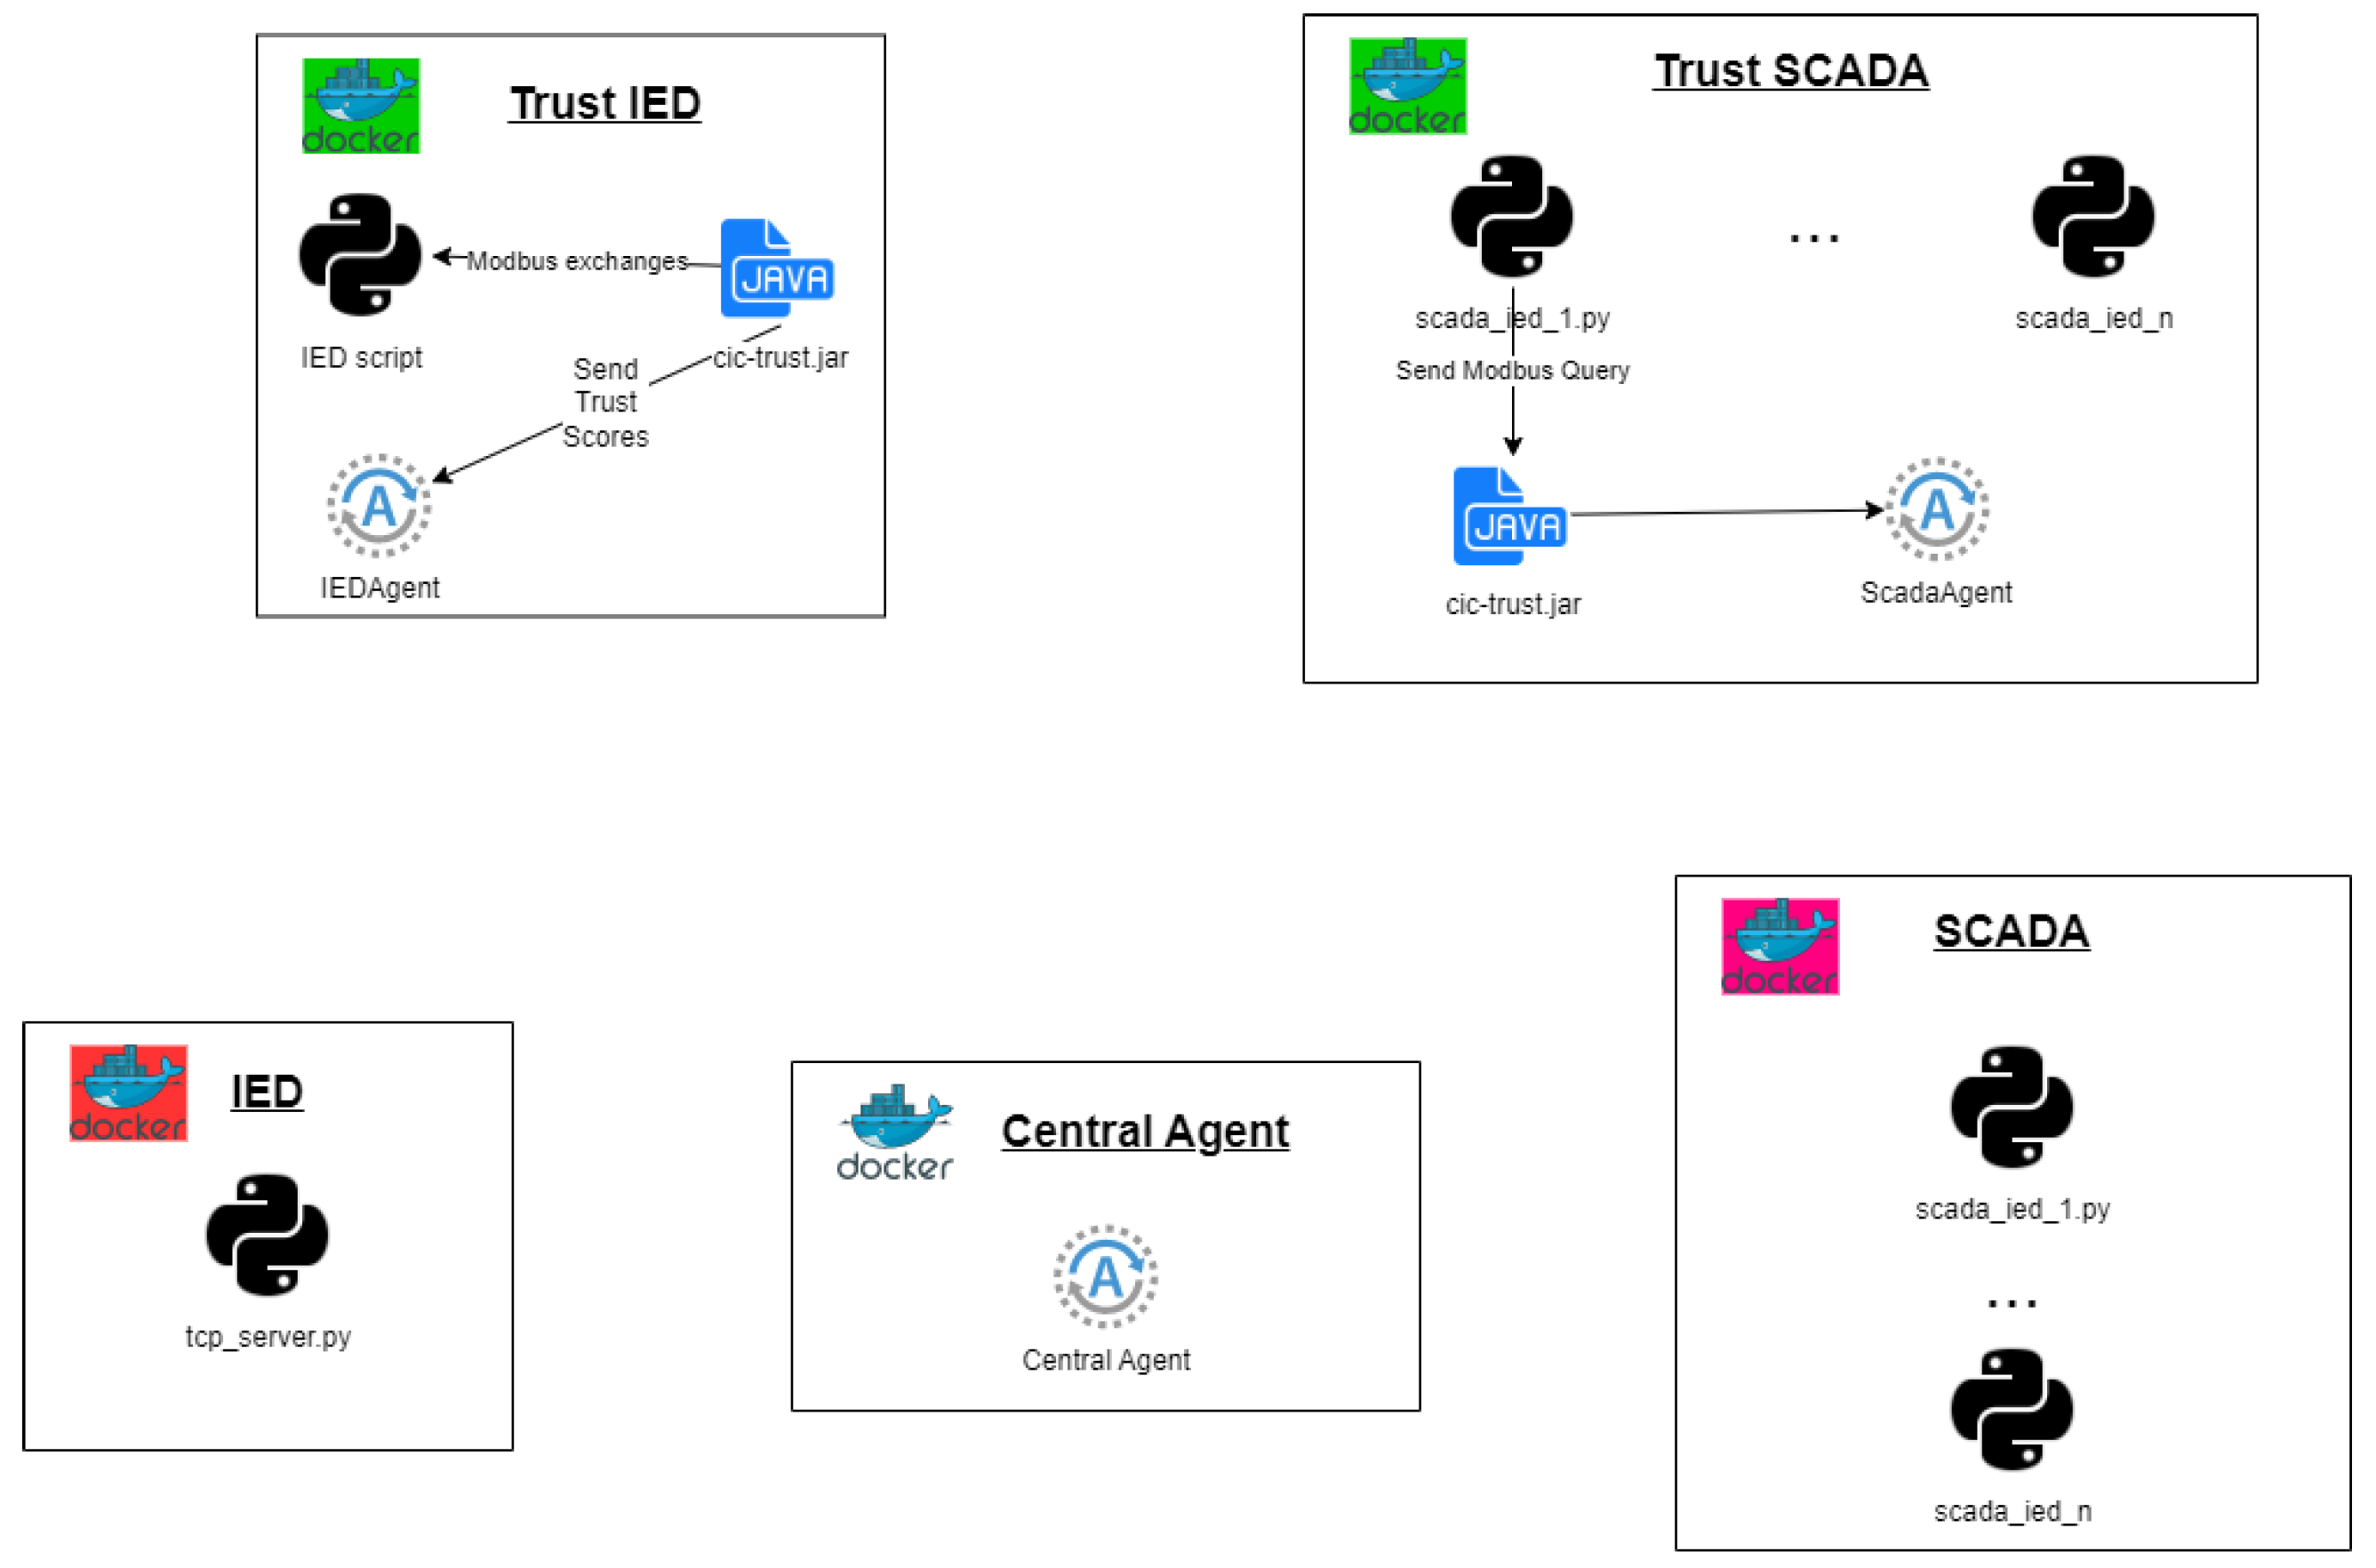
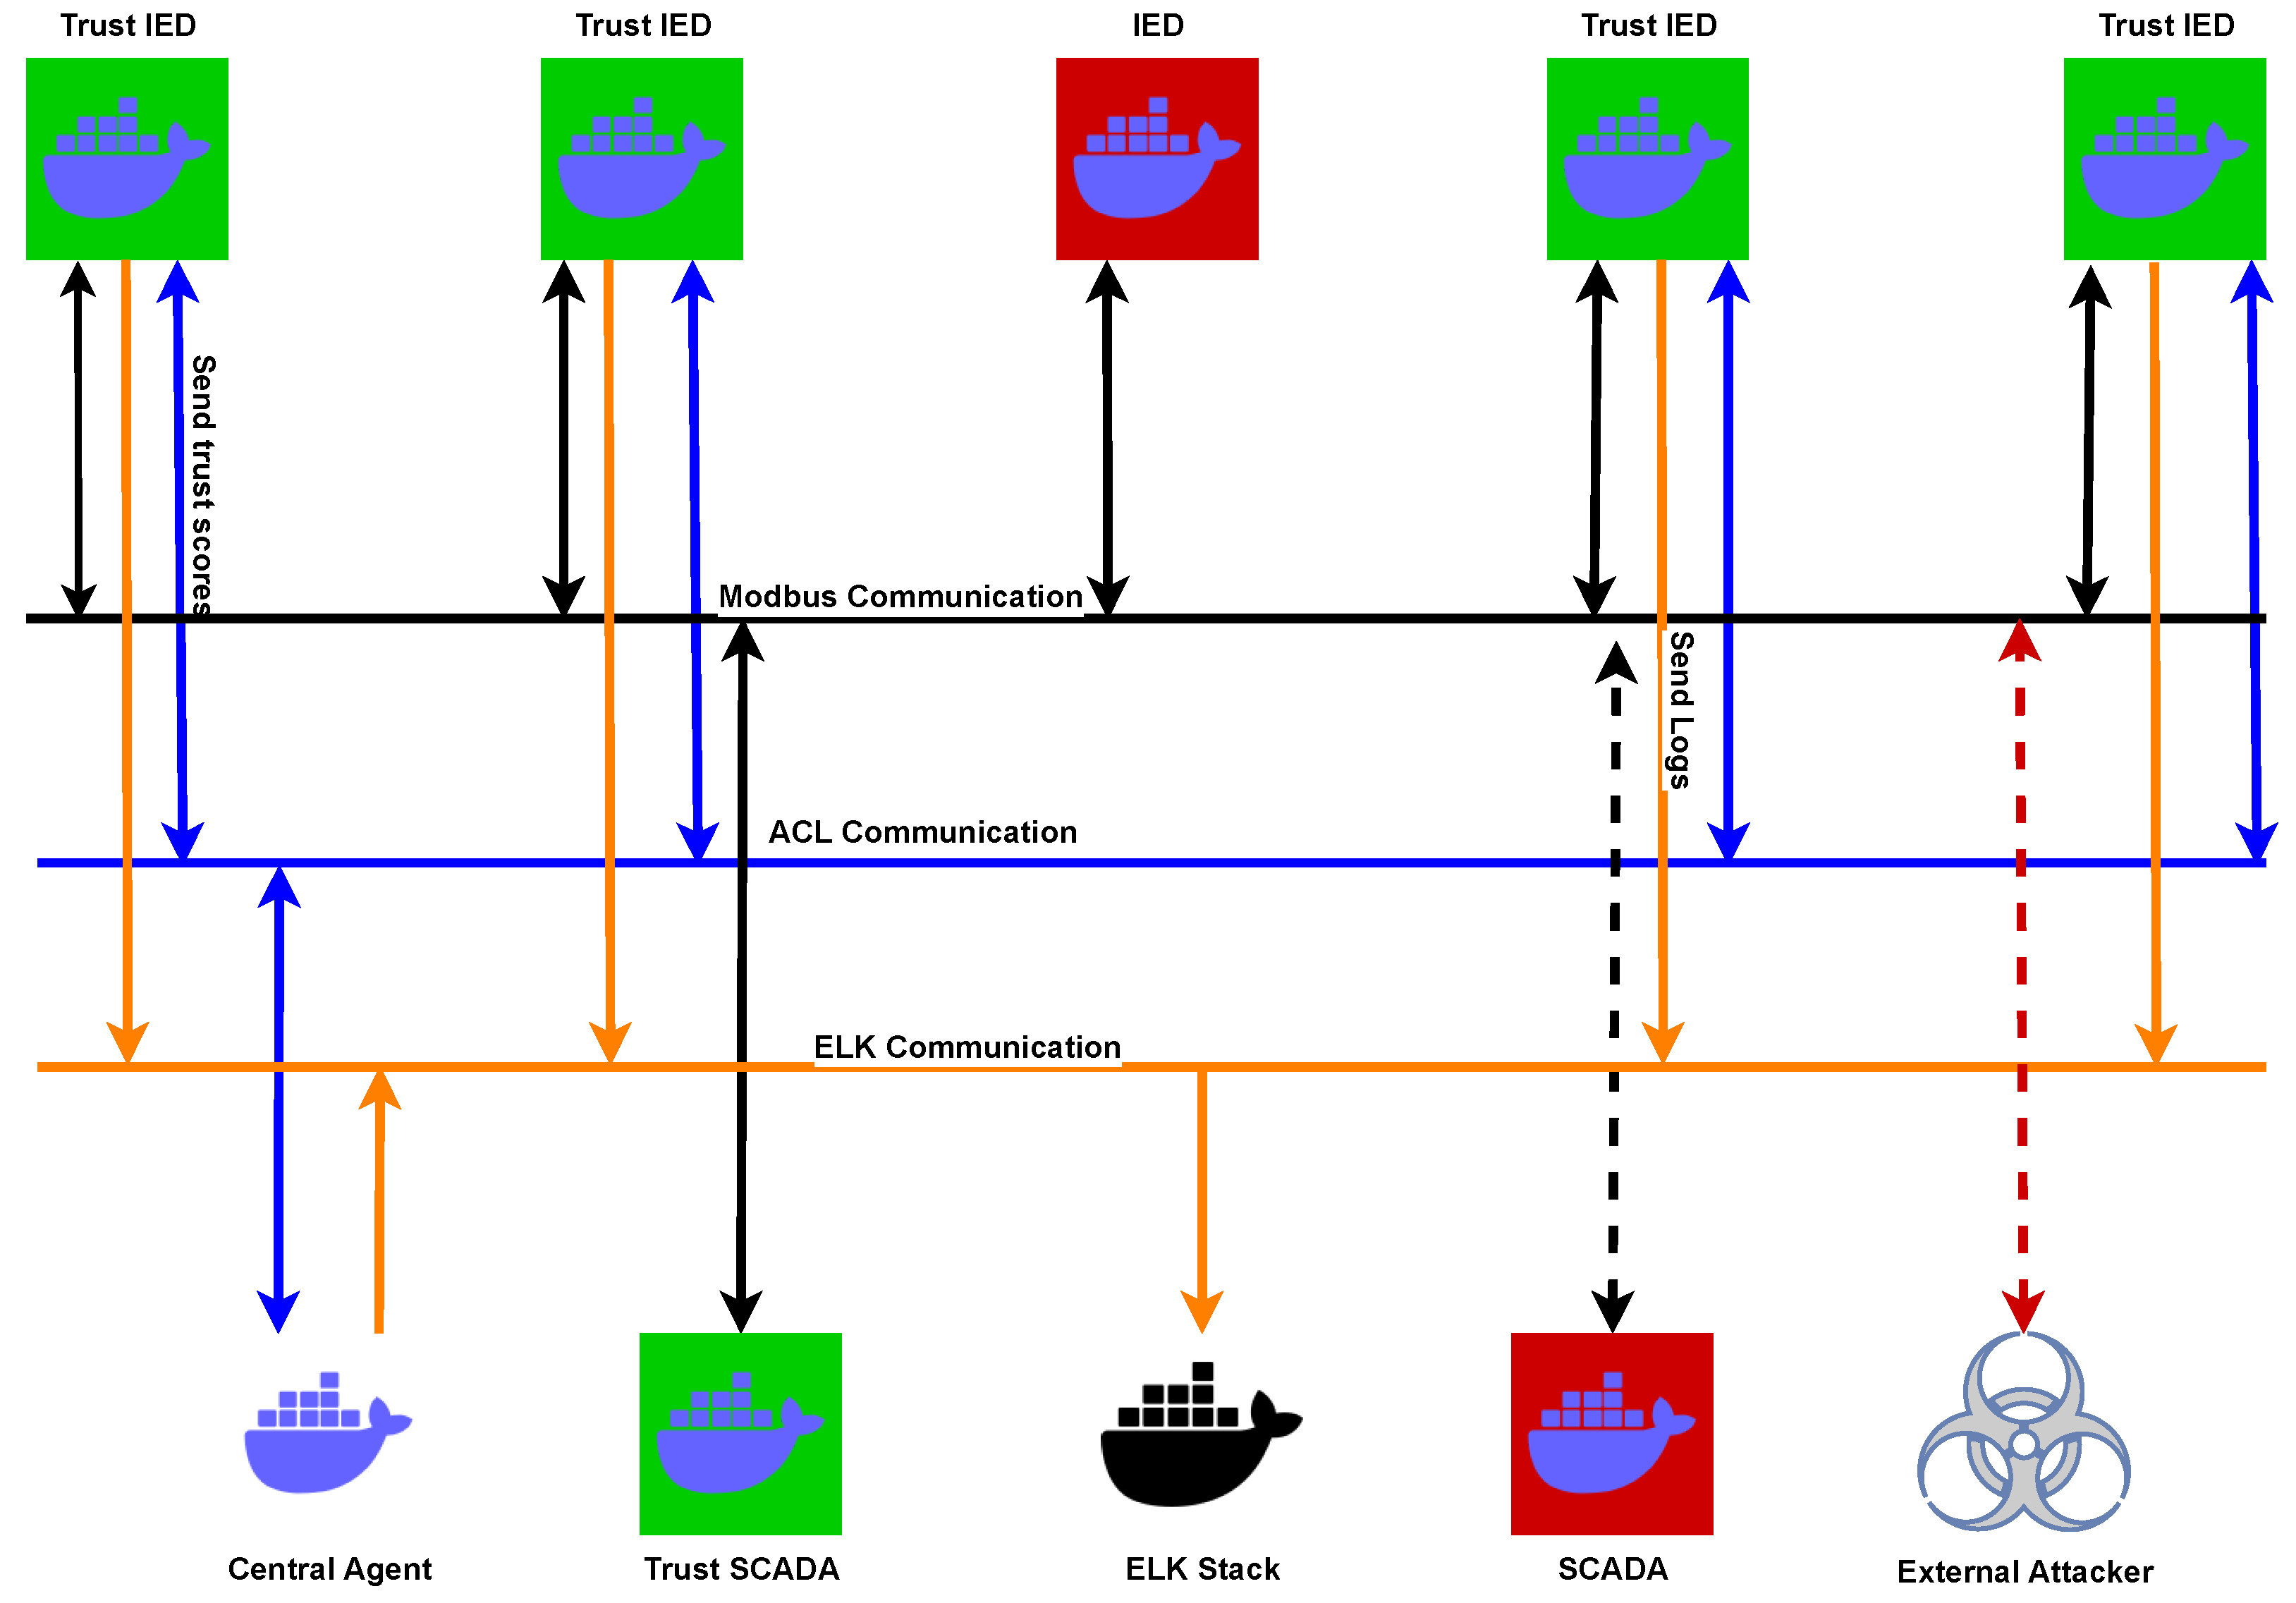
- Docker-Based Substation Testbed: A practical implementation environment created using Docker containers, establishing a multi-agent-based architecture that mirrors the substation’s device ecosystem. An SOC-influenced dashboard provides real-time status updates for the substation and its devices.
- Attack Scenario Evaluations: Testing and evaluation of the framework through simulated attack scenarios, including external attacks, internal attacks from compromised SCADA HMIs, and internal attacks originating from compromised regular IEDs.
- Publicly Available Dataset: A publicly available dataset containing captures of our MAS testbed is provided on the CIC website (https://www.unb.ca/cic/datasets/modbus-2023.html (accessed on 31 August 2023)).
2. Background on Trust
2.1. Trust
2.2. Trust Transitivity and Trust Transferability
2.3. State of the Art
2.4. Motivation
3. Multi-Agent Systems
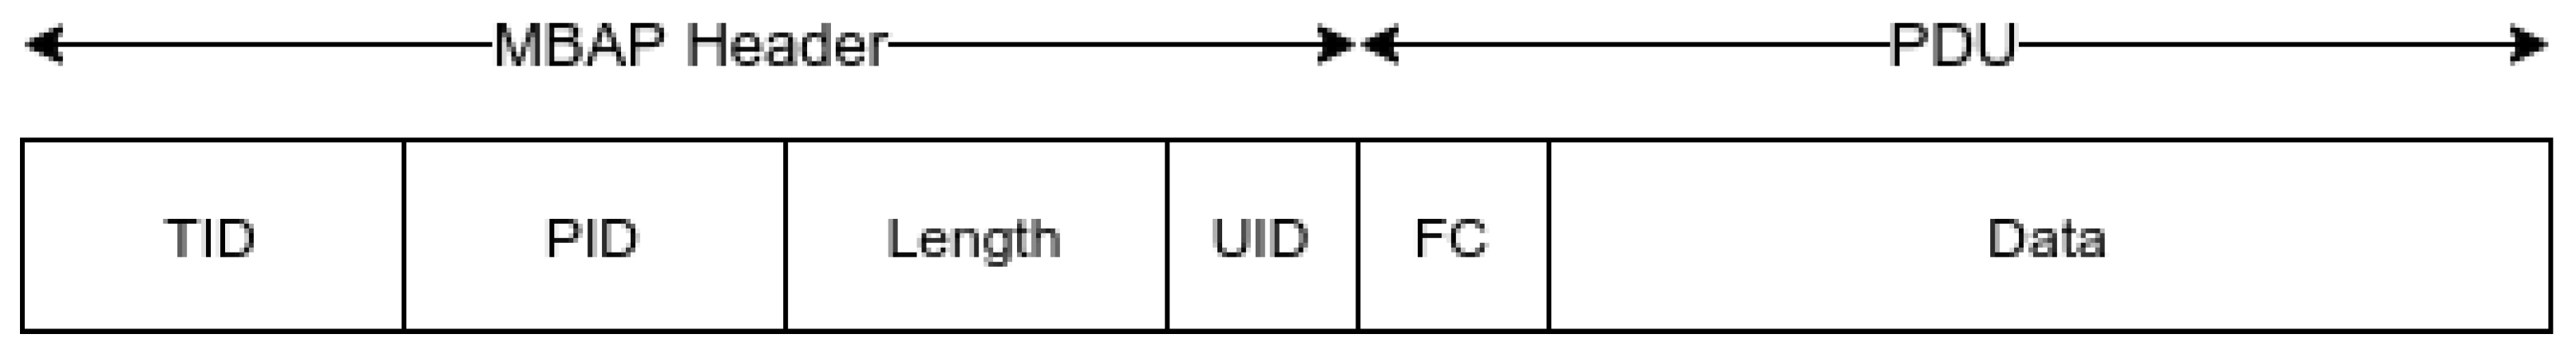
4. Modbus TCP
4.1. Modbus Packet Structure
4.2. Modbus Address Types and Function Codes
5. Models and Scenario
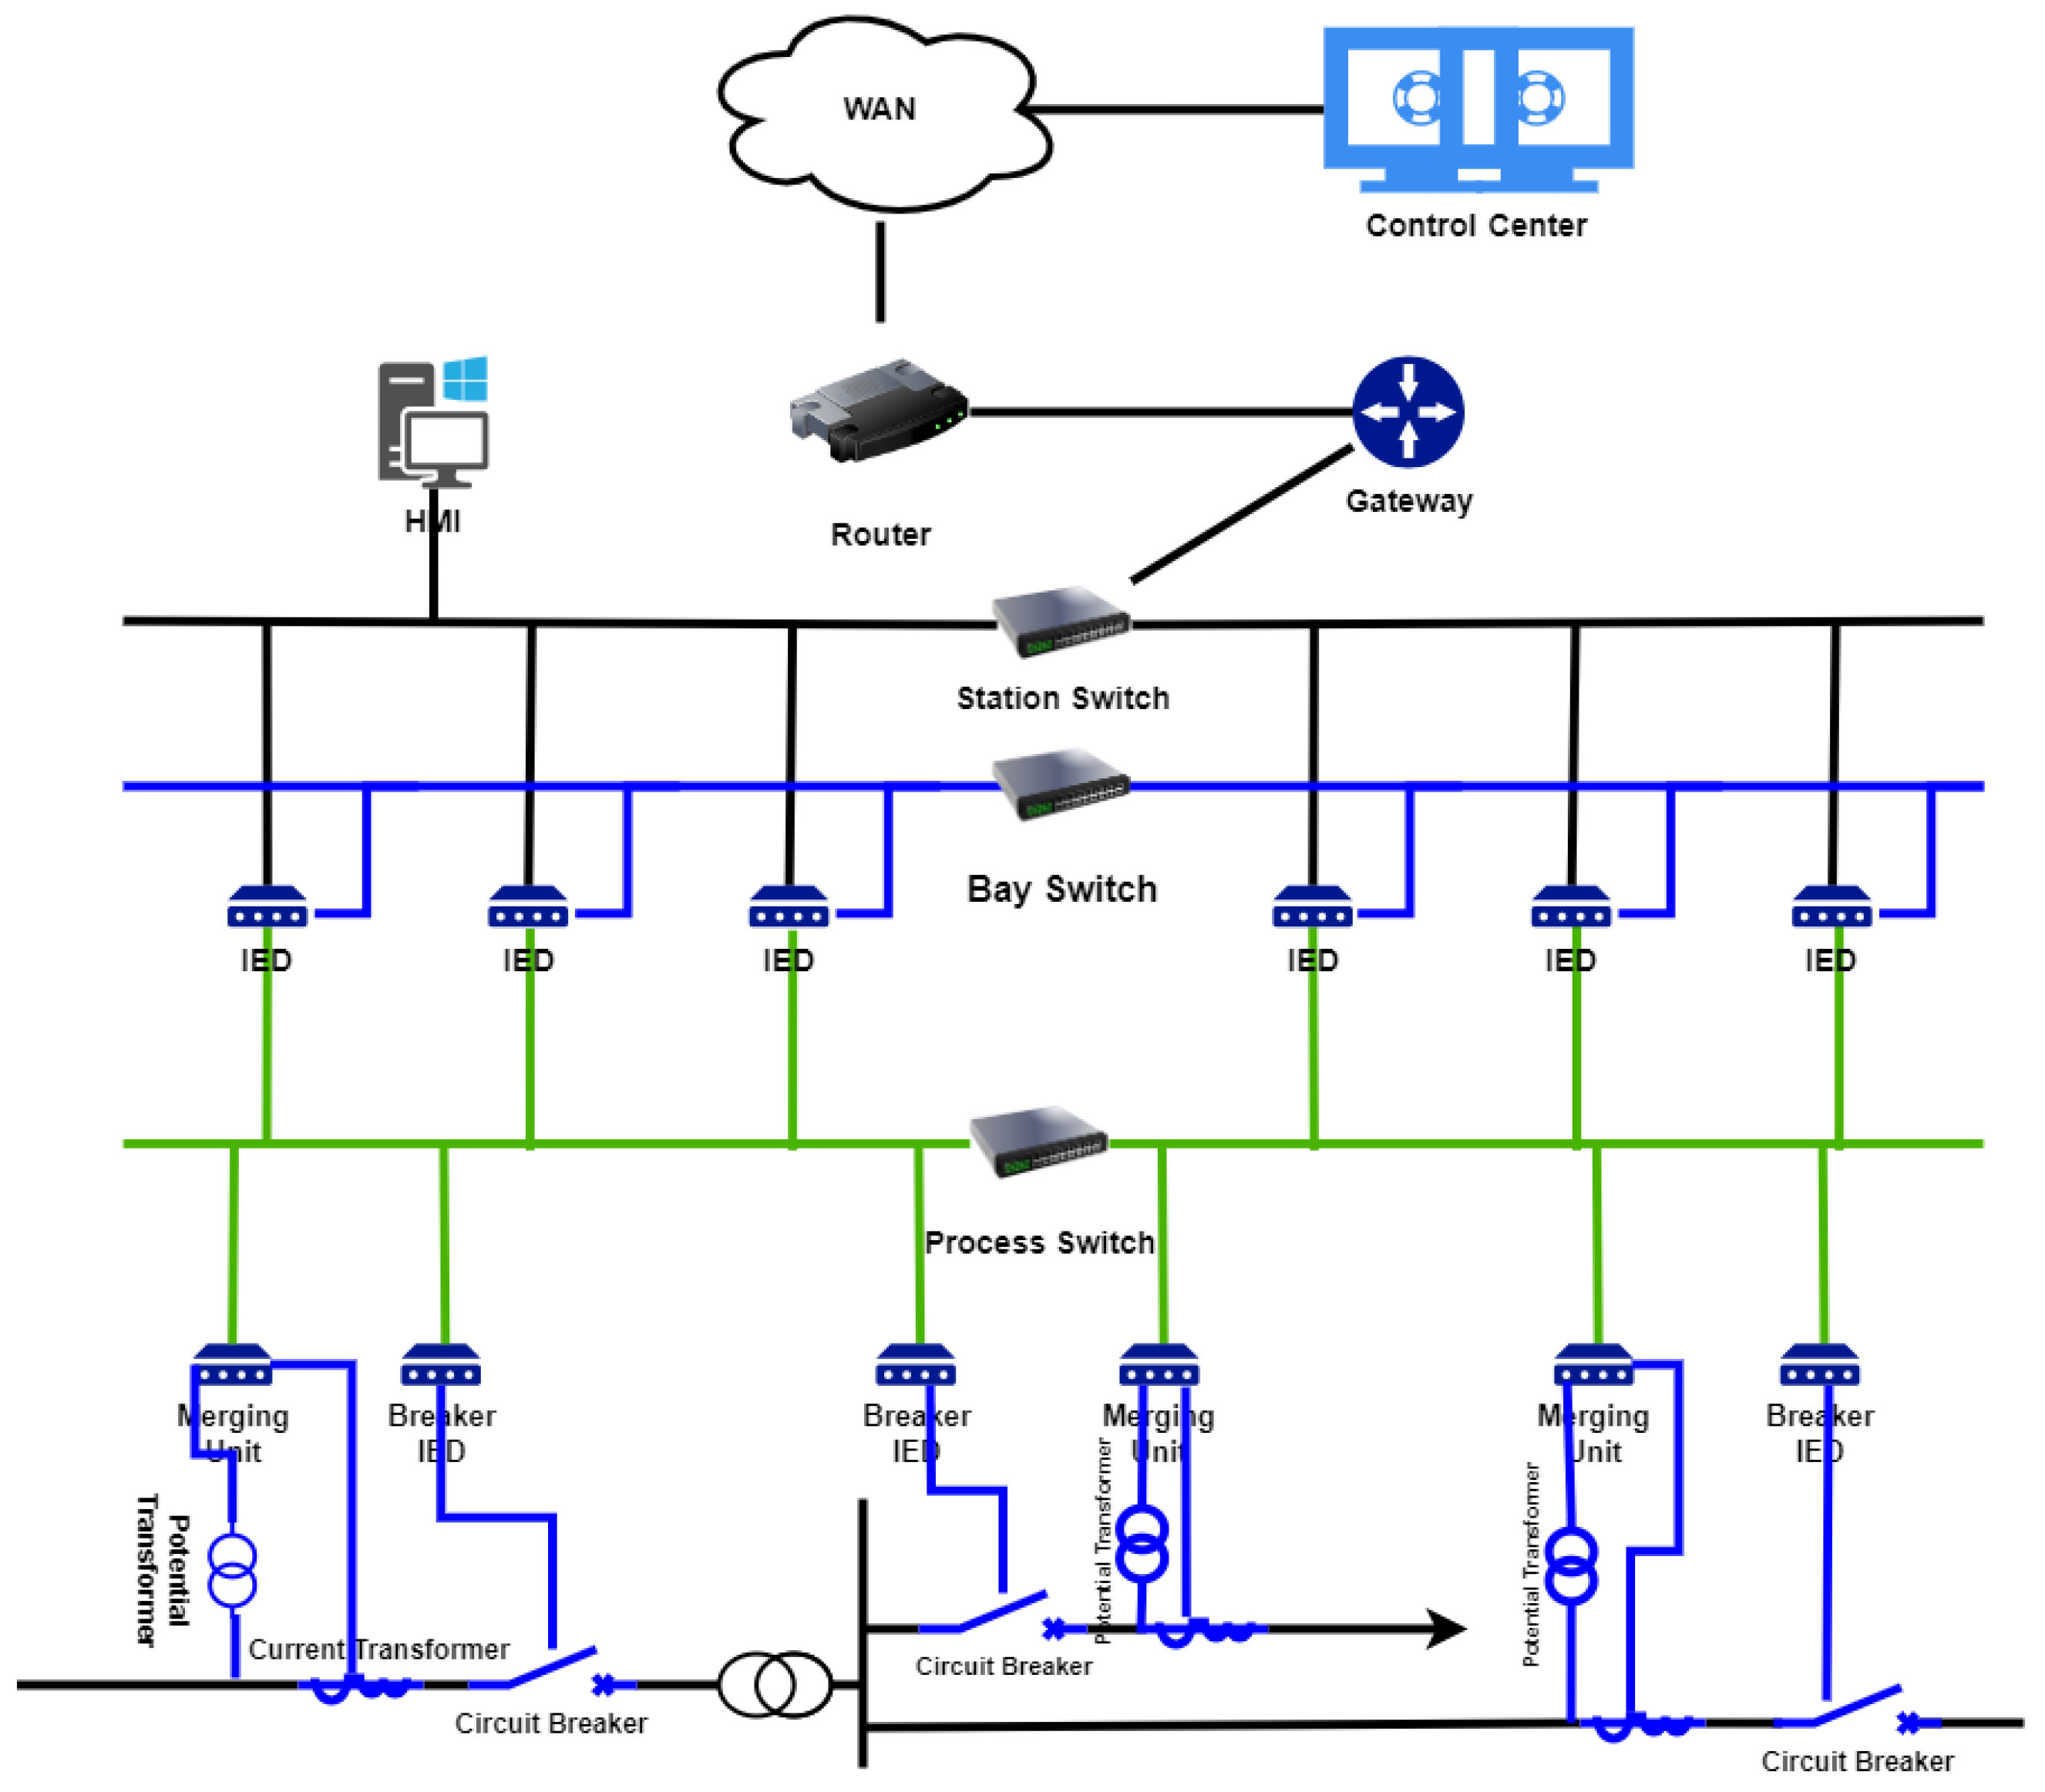
5.1. Substation Model
5.2. Attack Scenarios
- Write Attack: In this attack, bearing is directed towards , targeting all existing Modbus addresses, either without preceding reconnaissance or subsequent to a baseline replay attack. Alternatively, this attack could be tailored to concentrate on a specific address of with , necessitating the successful completion of a reconnaissance attack.
- Query Flooding: In this attack, or inundates a device with an excessive volume of or , subsequently causing the targeted device to deplete its available resources.
- Malicious Packet Crafting: This involves the transmission of a malevolent packet by either or . The crafted packet is designed to execute a payload or initiate a buffer overflow. The packet itself can take the form of or . Examples encompass payload injection, frame stacking, manipulation of packet length, and false data injection.
- Baseline Replay Attack: Following a thorough profiling of the substation, aimed at evading detection, or can initiate the replay of Q or R to a designated device.
- Reconnaissance: When , can dispatch to , systematically covering all existing Modbus addresses. This endeavor is undertaken to accumulate intelligence about the substation.
Mapping to the MITRE ATT&CK ICS Framework
6. Trust Formulation for Substation Devices
6.1. Familiarity-Based Definitions
6.1.1. Familiarity
6.1.2. Exposure Frequency
6.1.3. Exposure Intensity
6.1.4. Similarity
6.2. Consequence
6.3. Trust of a Device
6.4. Out of Sequence Handler
7. Risk Posture
7.1. Identifying Functional Influence of Affected Devices
7.2. Calculating Risk Posture
8. Trust Transferability
9. Implementation
- The network traffic within the substation is predictable due to predefined queries issued by engineers.
- Attacks unrelated to Modbus or IT are addressed using various Common Vulnerabilities and Exposures (CVE) and Common Weakness Enumerations (CWE) mitigation techniques, and as such, they fall beyond the scope of this paper.
- Attackers are limited to manipulating Modbus packets due to the vendor’s robustness against TCP, IP, and Ethernet frame manipulations.
- Devices are confined to utilizing the Modbus port number for network communication.
- We assume that the control center has been compromised without any corresponding detections being made.
- Scenario 1: Trust SCADA HMI Control—In this test, the substation is controlled solely by a trust SCADA HMI container. The attacks will be executed through two different methods. The first attack involves an adversary utilizing their own device to launch an attack on the system. The second type of attack will be simulated by employing regular IEDs to replicate a compromised IED scenario.
- Scenario 2: Regular SCADA Control—For the second test, a regular SCADA container (as indicated by the dotted lines) is employed to manage all the IEDs. As in the first scenario, attacks will be conducted in two ways. The first attack mirrors the approach taken in the initial test. The second type of attack will be orchestrated from the regular SCADA to mimic scenarios that are publicly documented.
- Scenario 1: Normal Replacement—A new trust IED is introduced, replacing an existing trust IED, and it operates as expected, exhibiting normal behavior.
- Scenario 2: Compromised Replacement (Immediate)—A new compromised IED replaces an existing trust IED, but after acceptance, it begins to exhibit malicious behavior.
- Scenario 3: Compromised Replacement (Delayed)—Similar to Scenario 2, a new compromised IED takes the place of an existing trust IED. However, the malicious behavior emerges only after surpassing the consideration period, which constitutes half of the probation period.
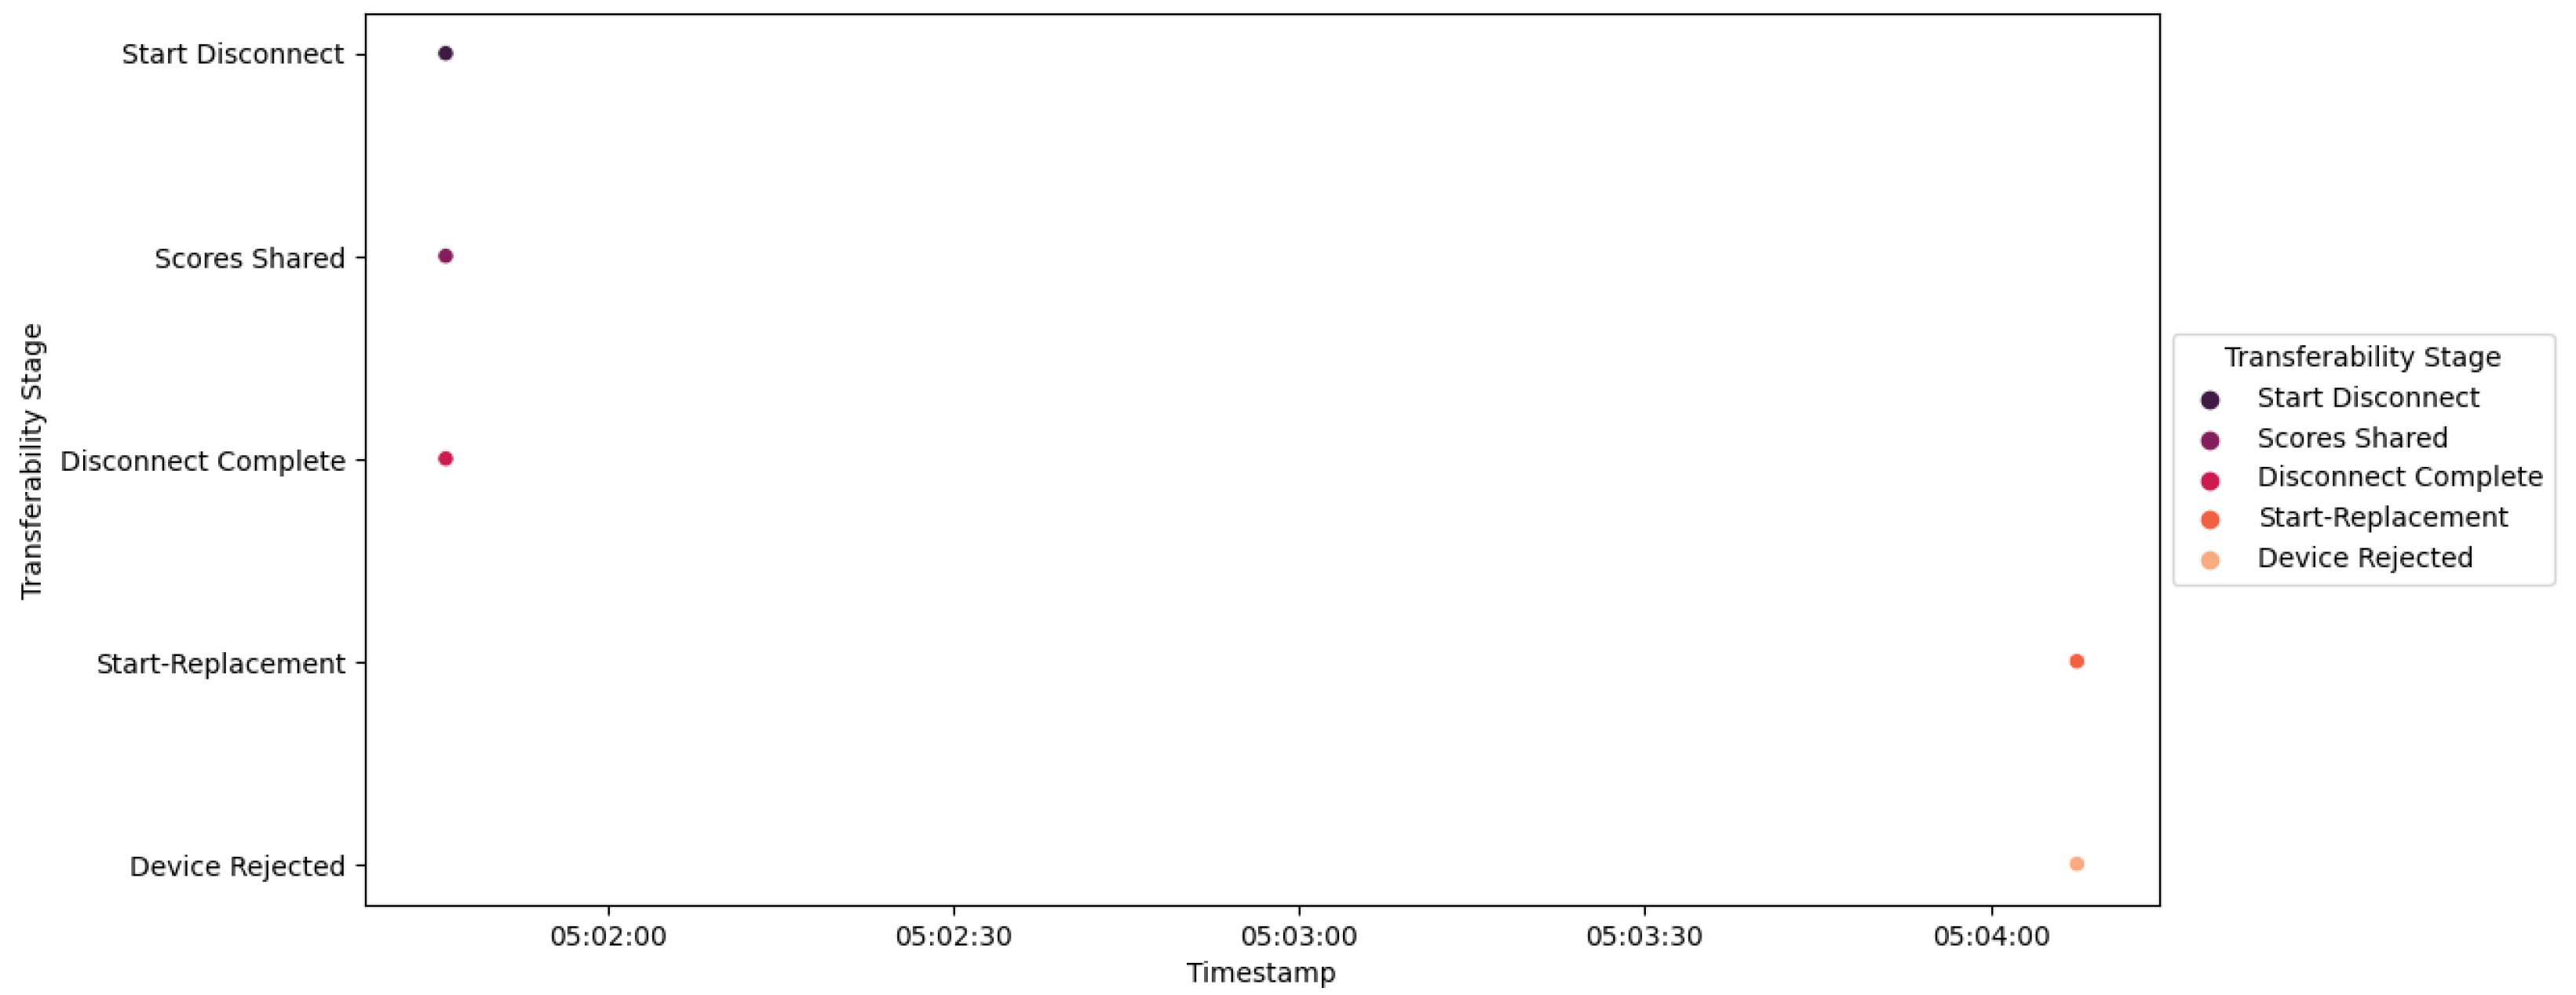
- Scenario 4: Trust IED with Poor Trust Scores—A new trust IED is introduced, replacing an existing IED, but the trust scores associated with it are not deemed favorable.
10. Evaluation
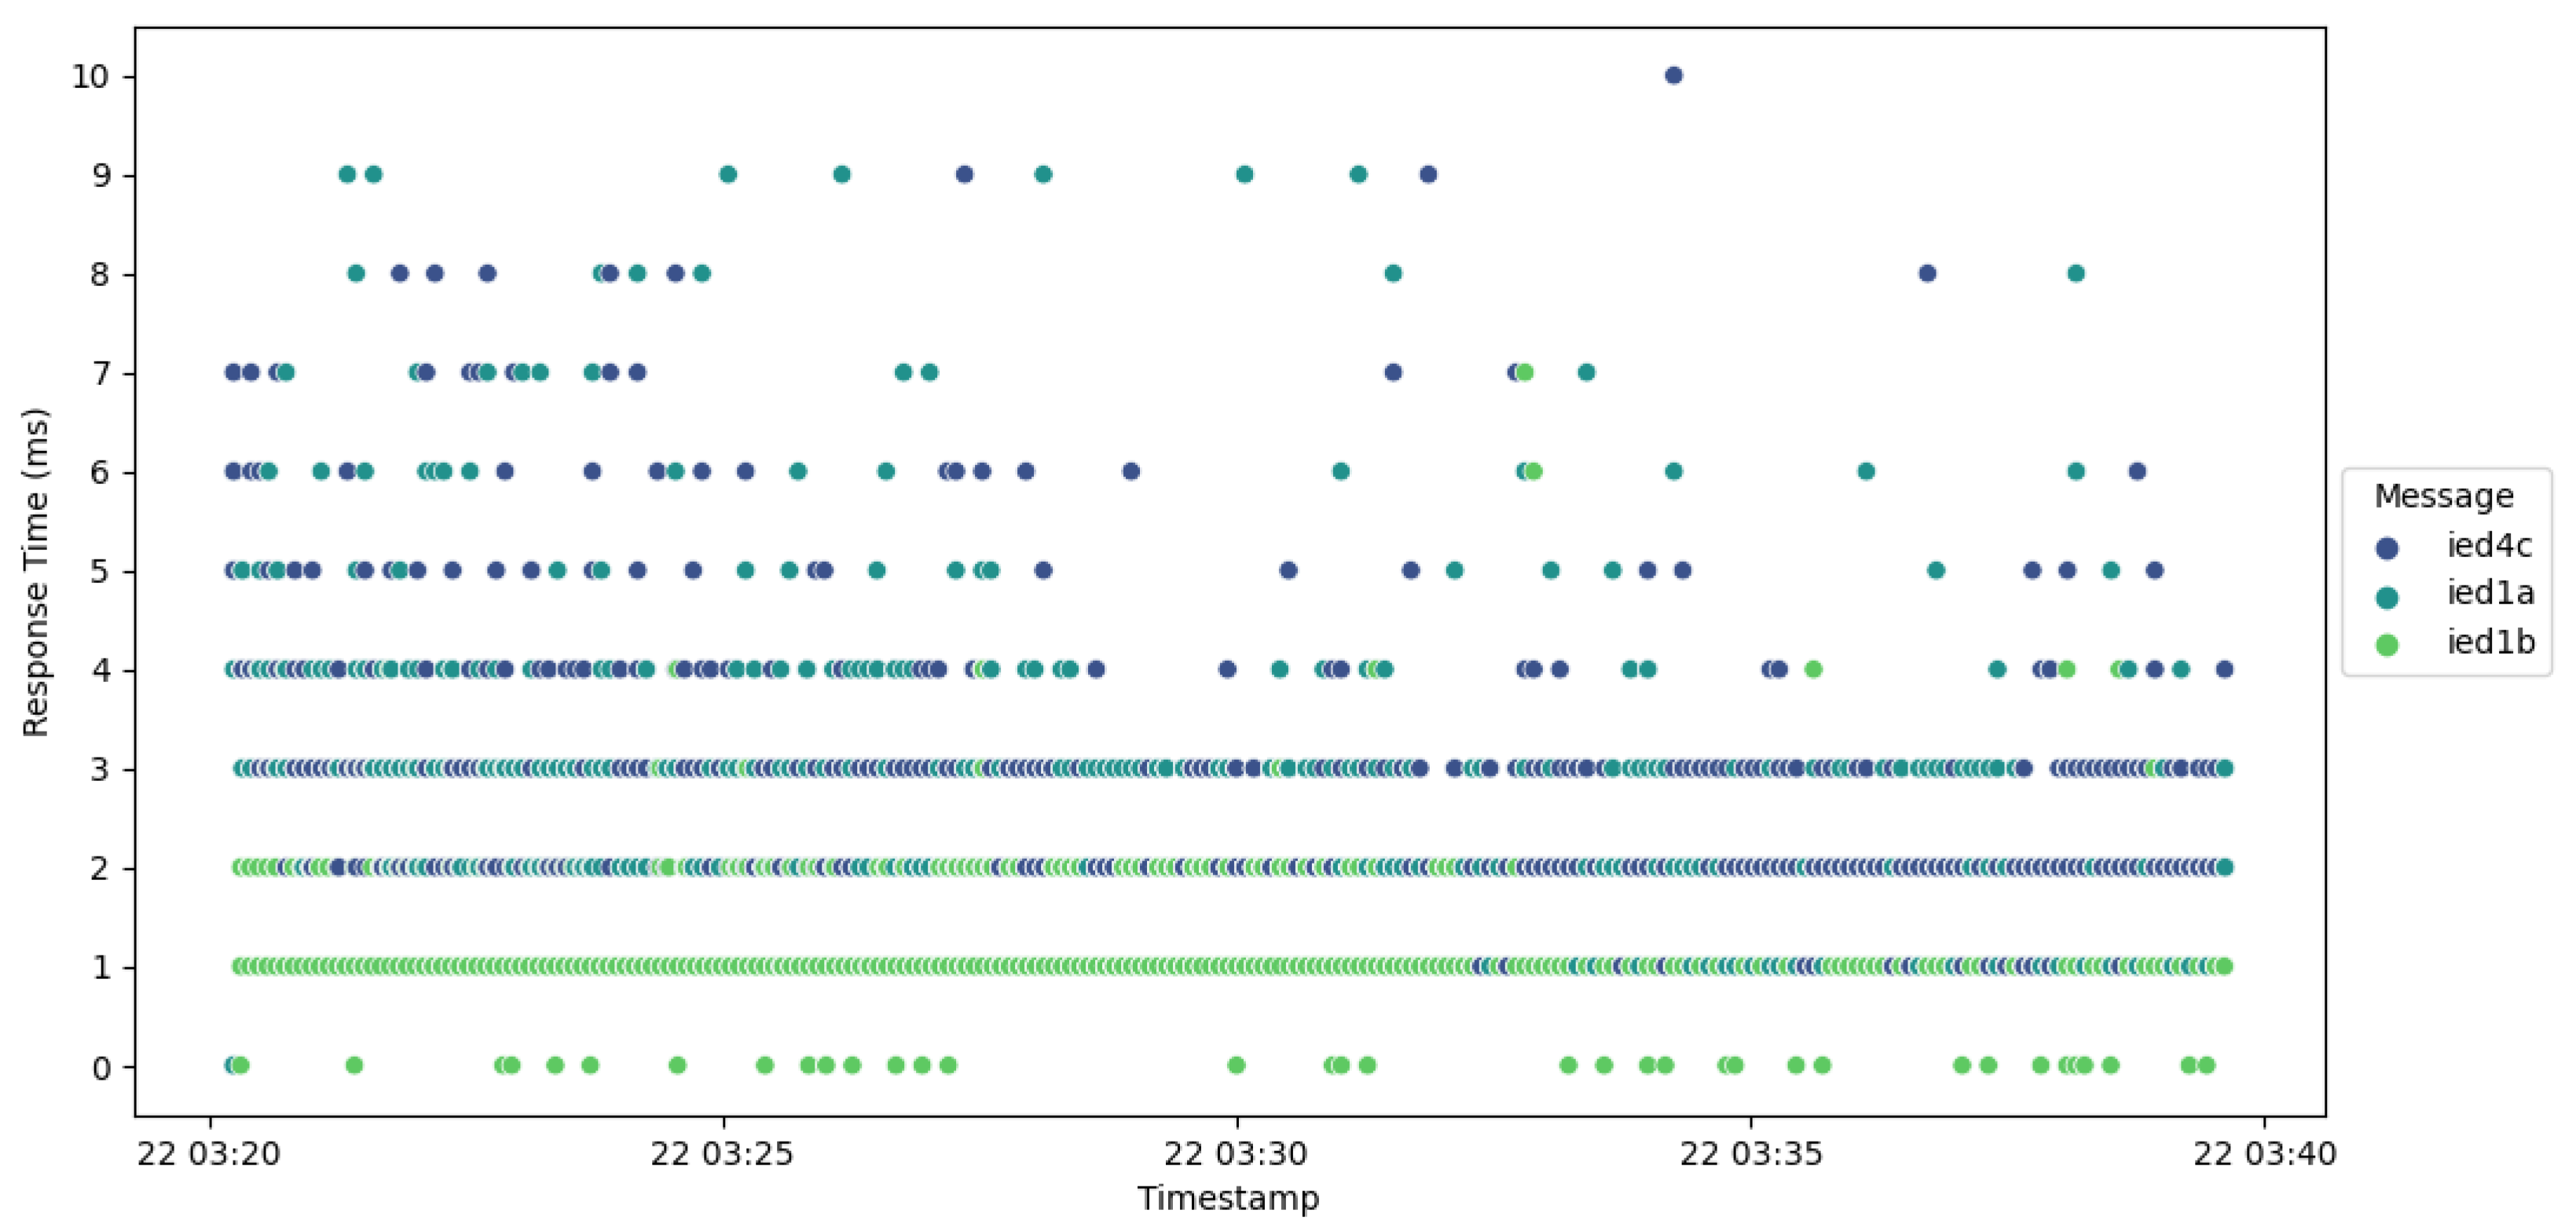
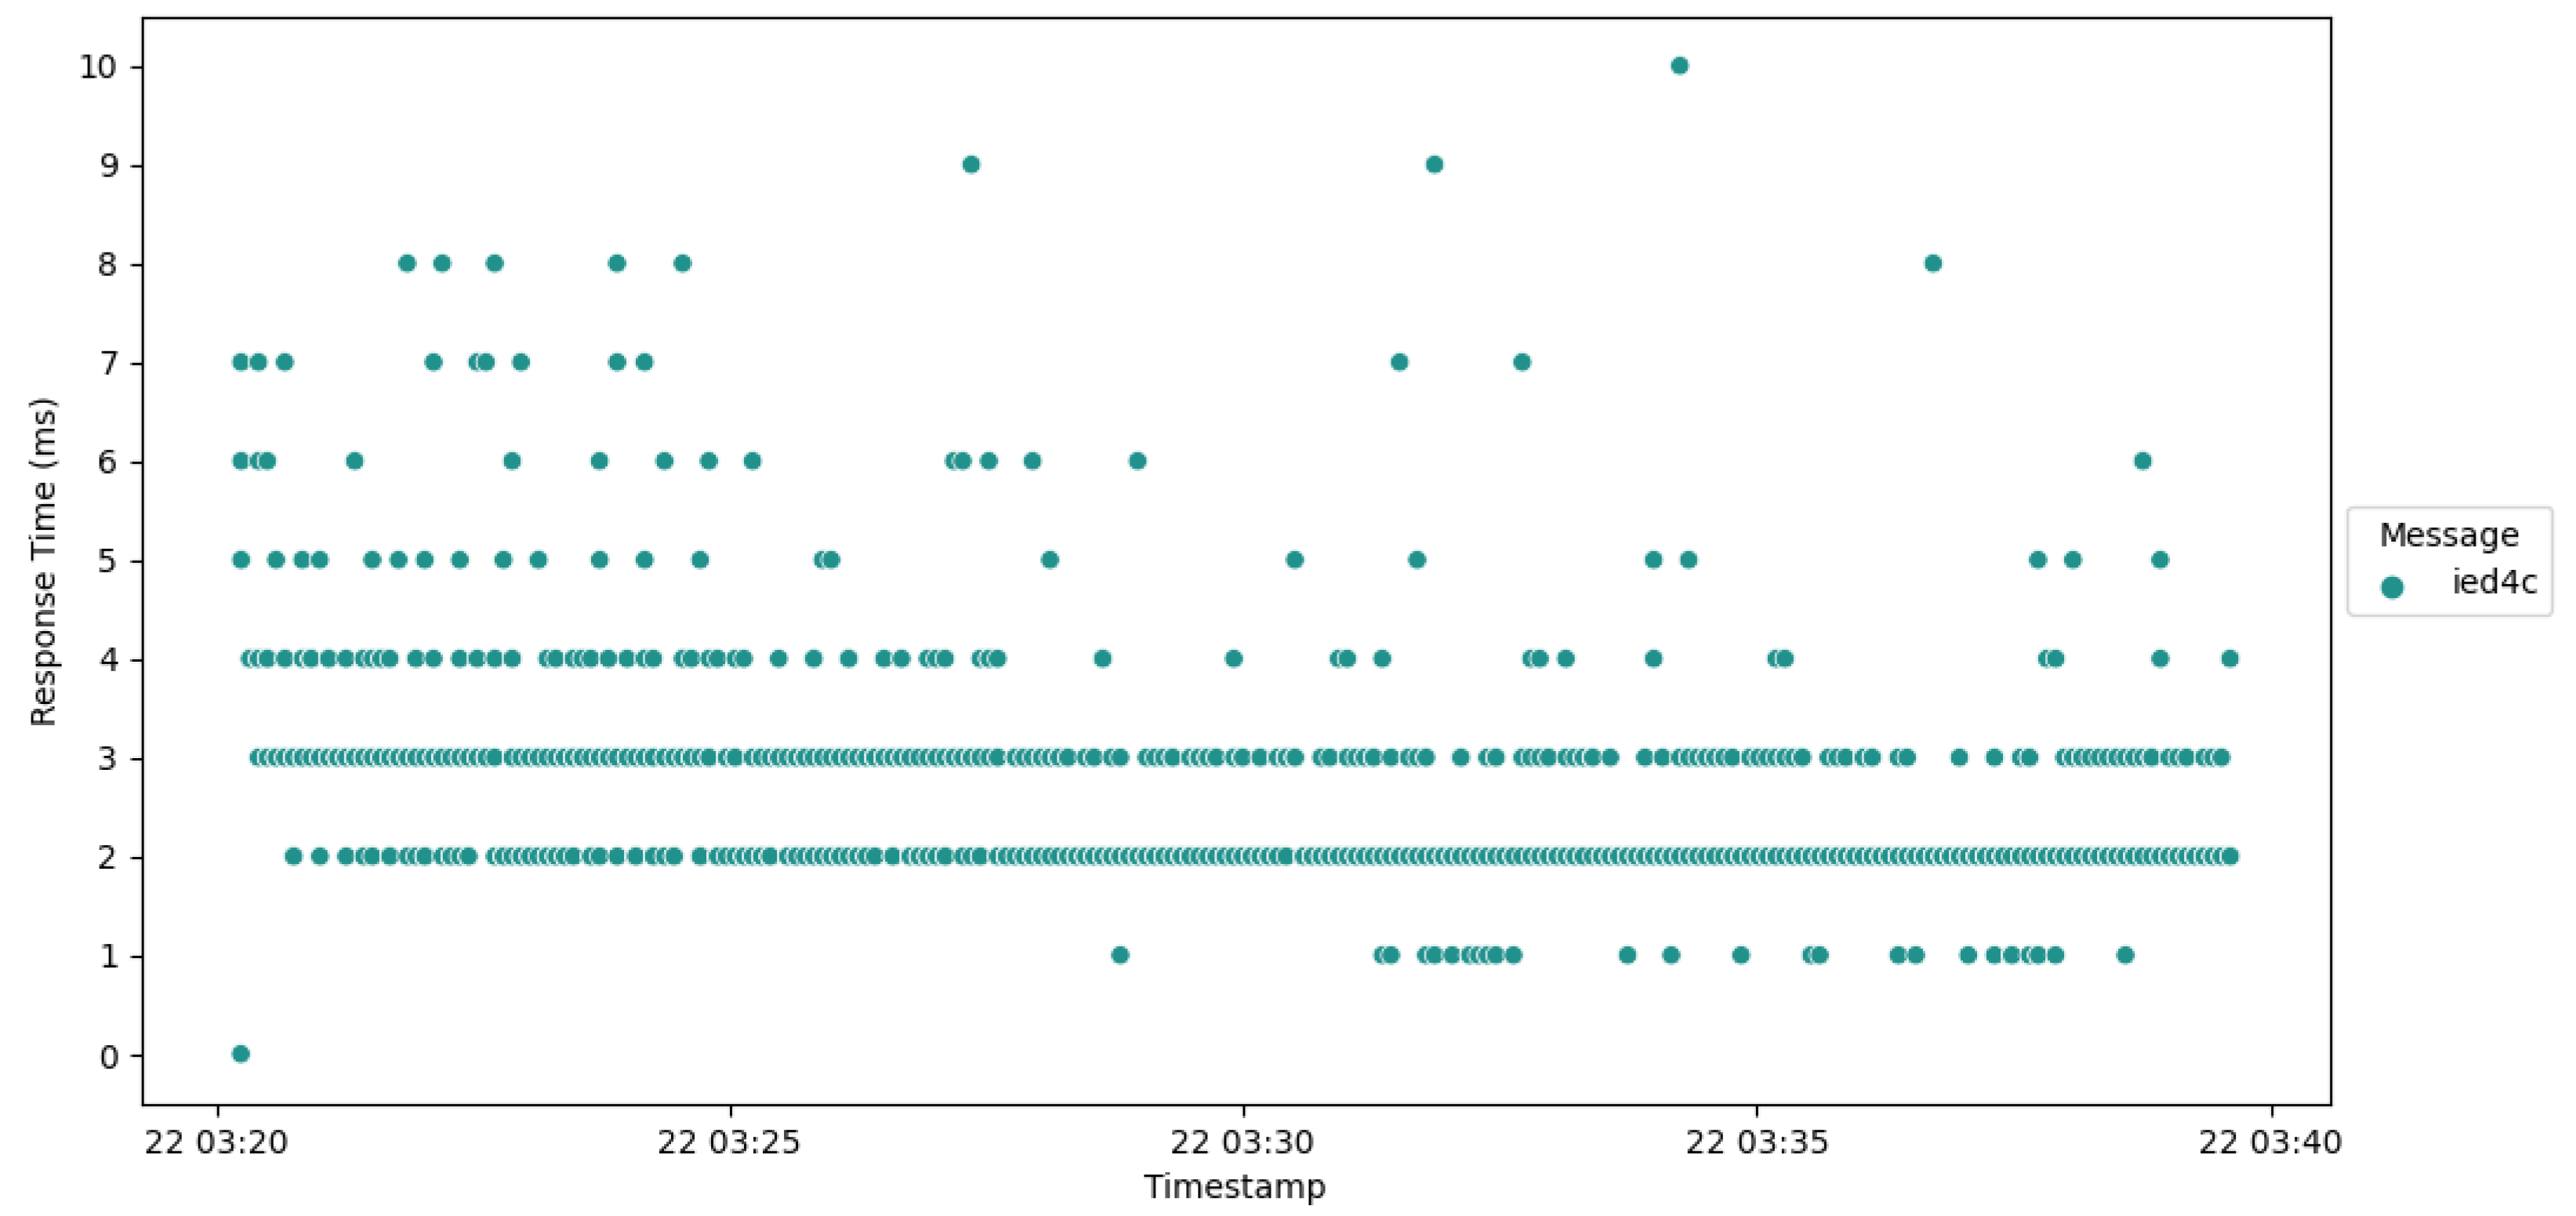
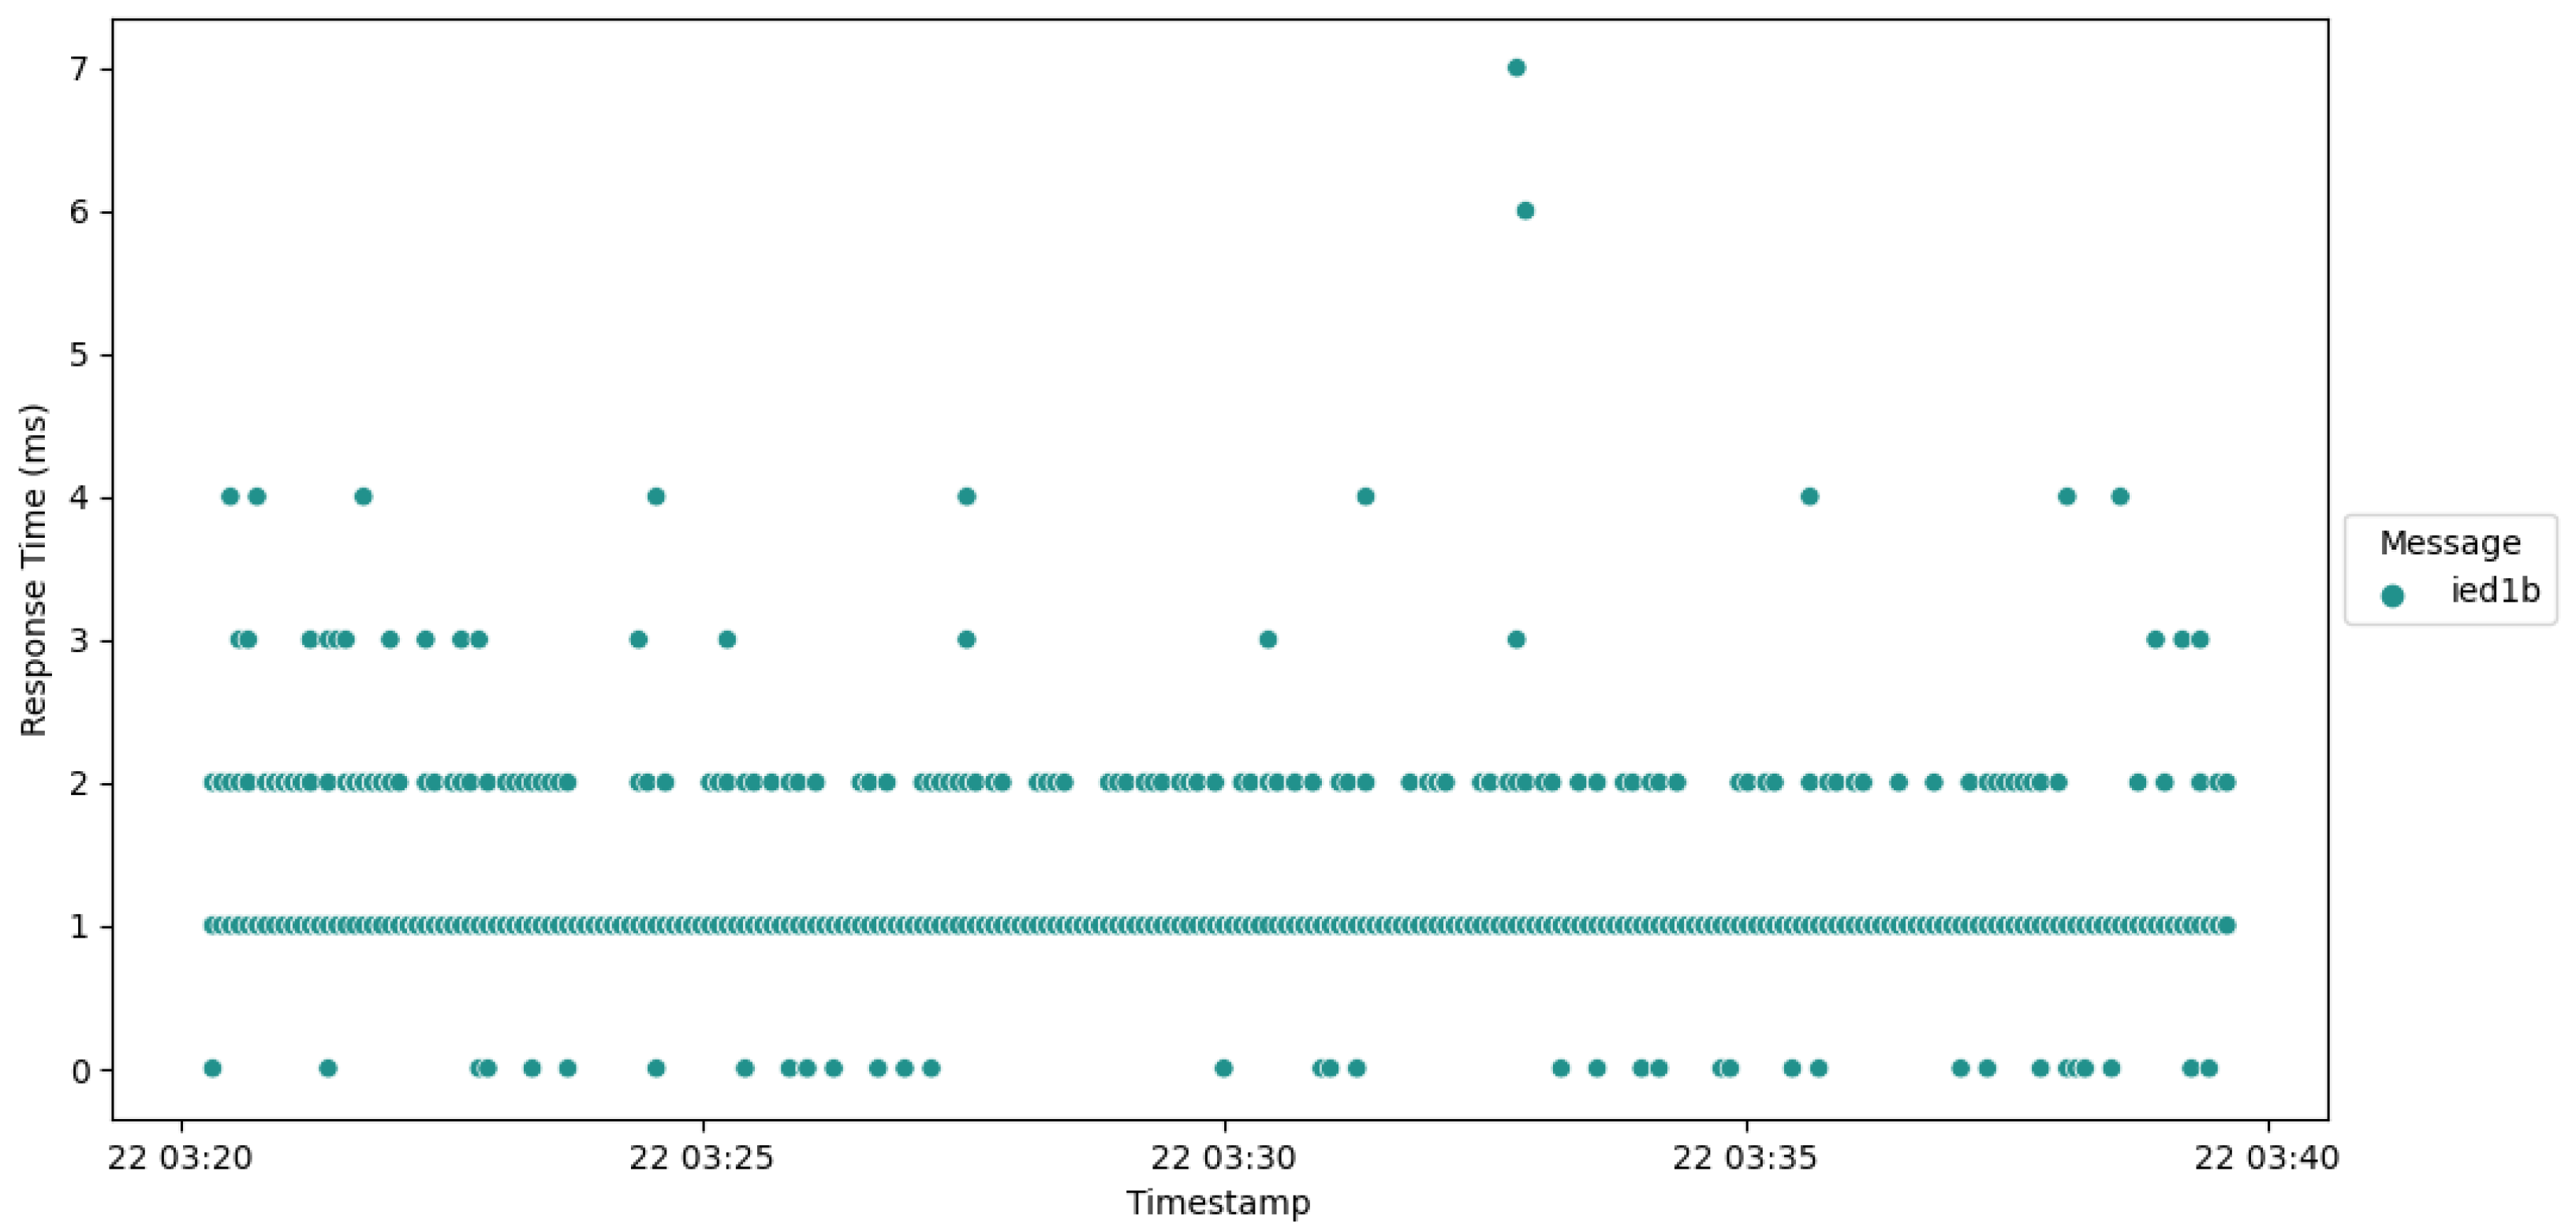
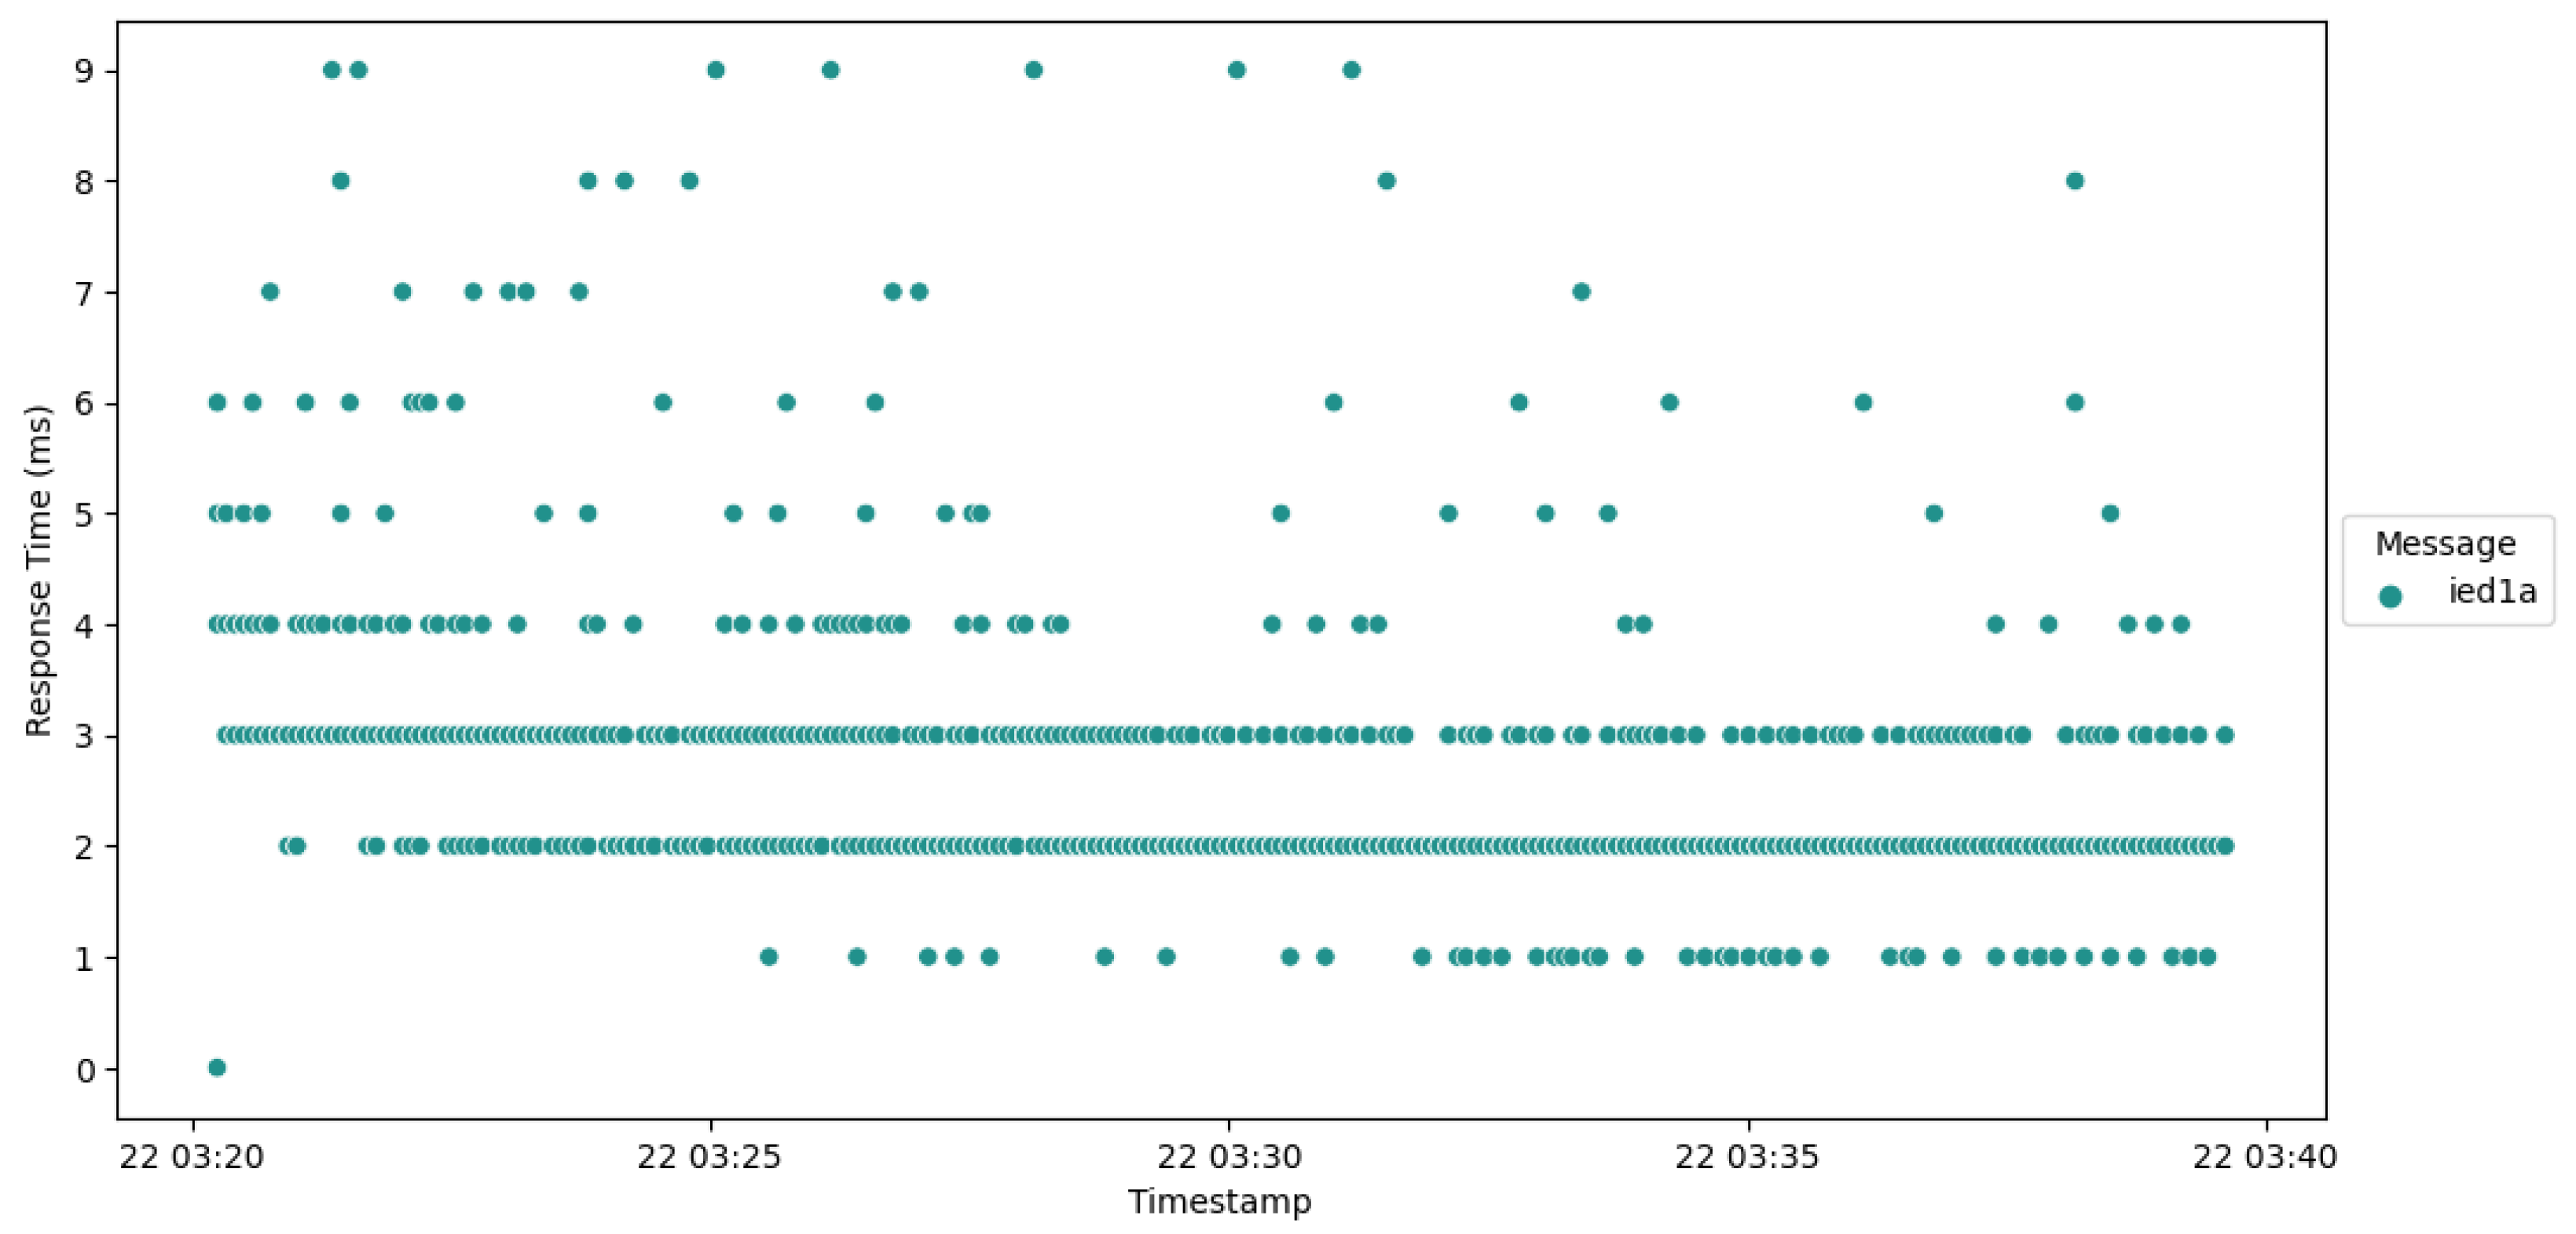
10.1. Performance
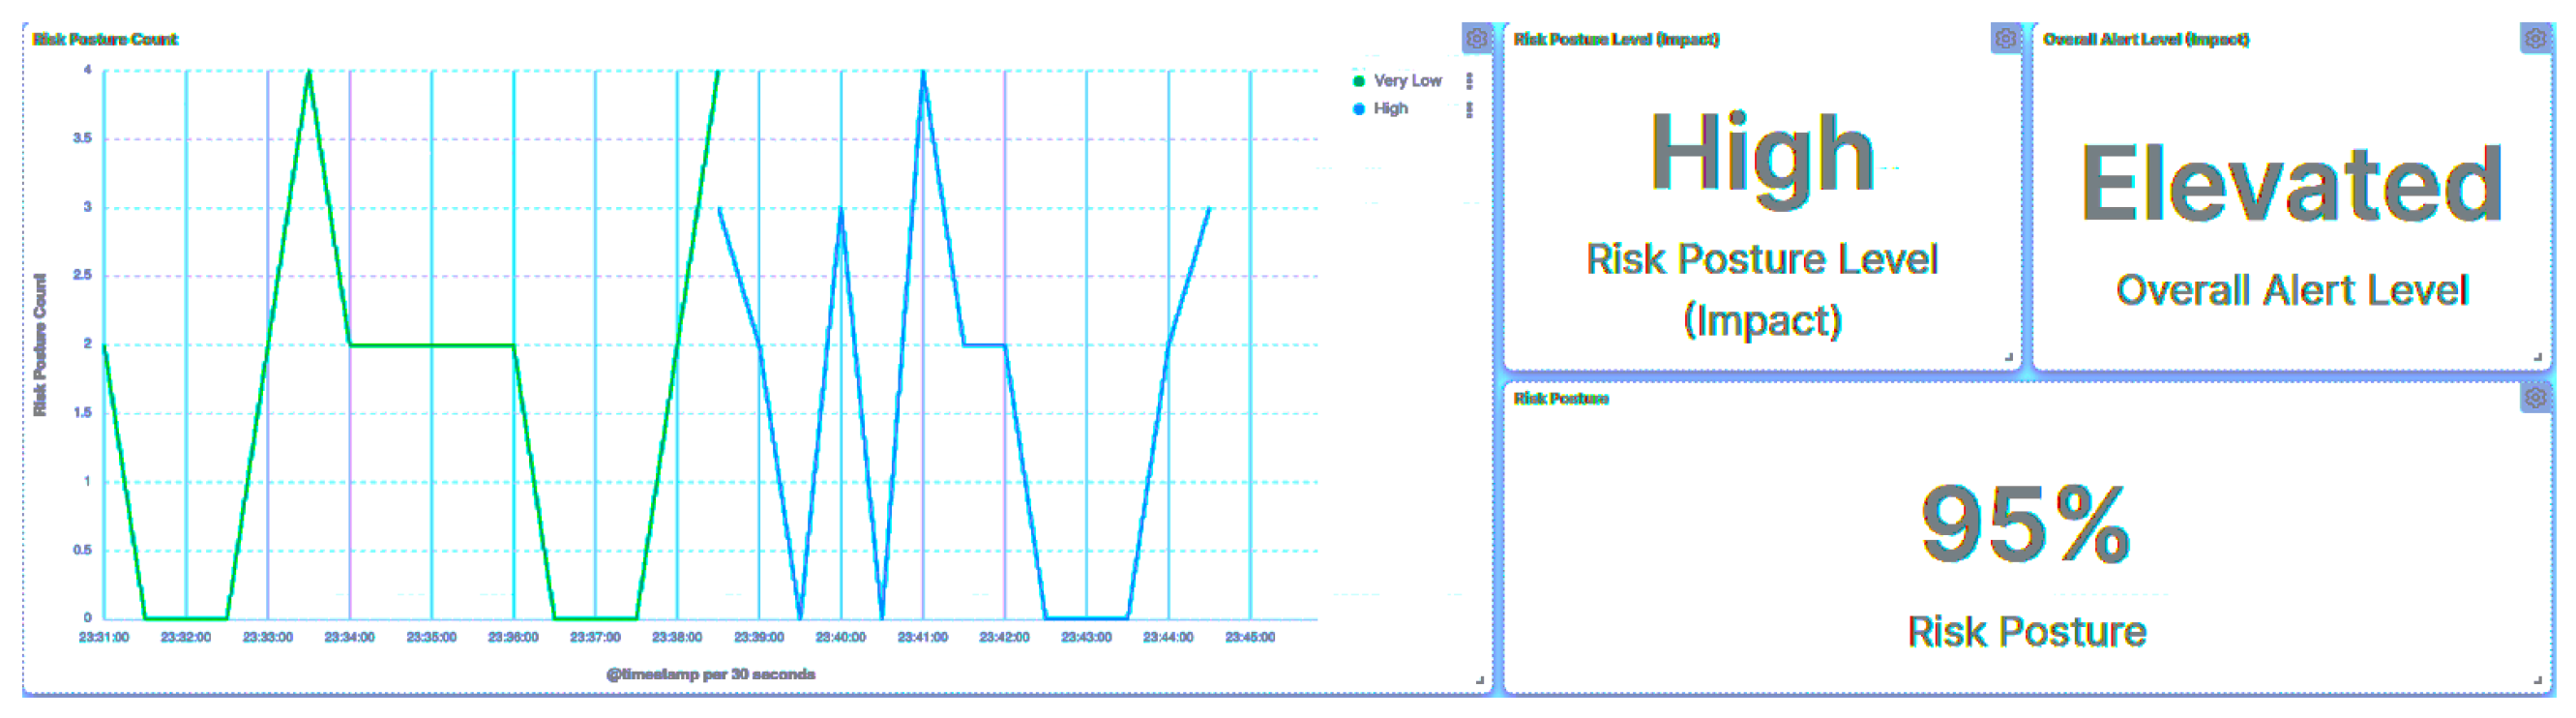
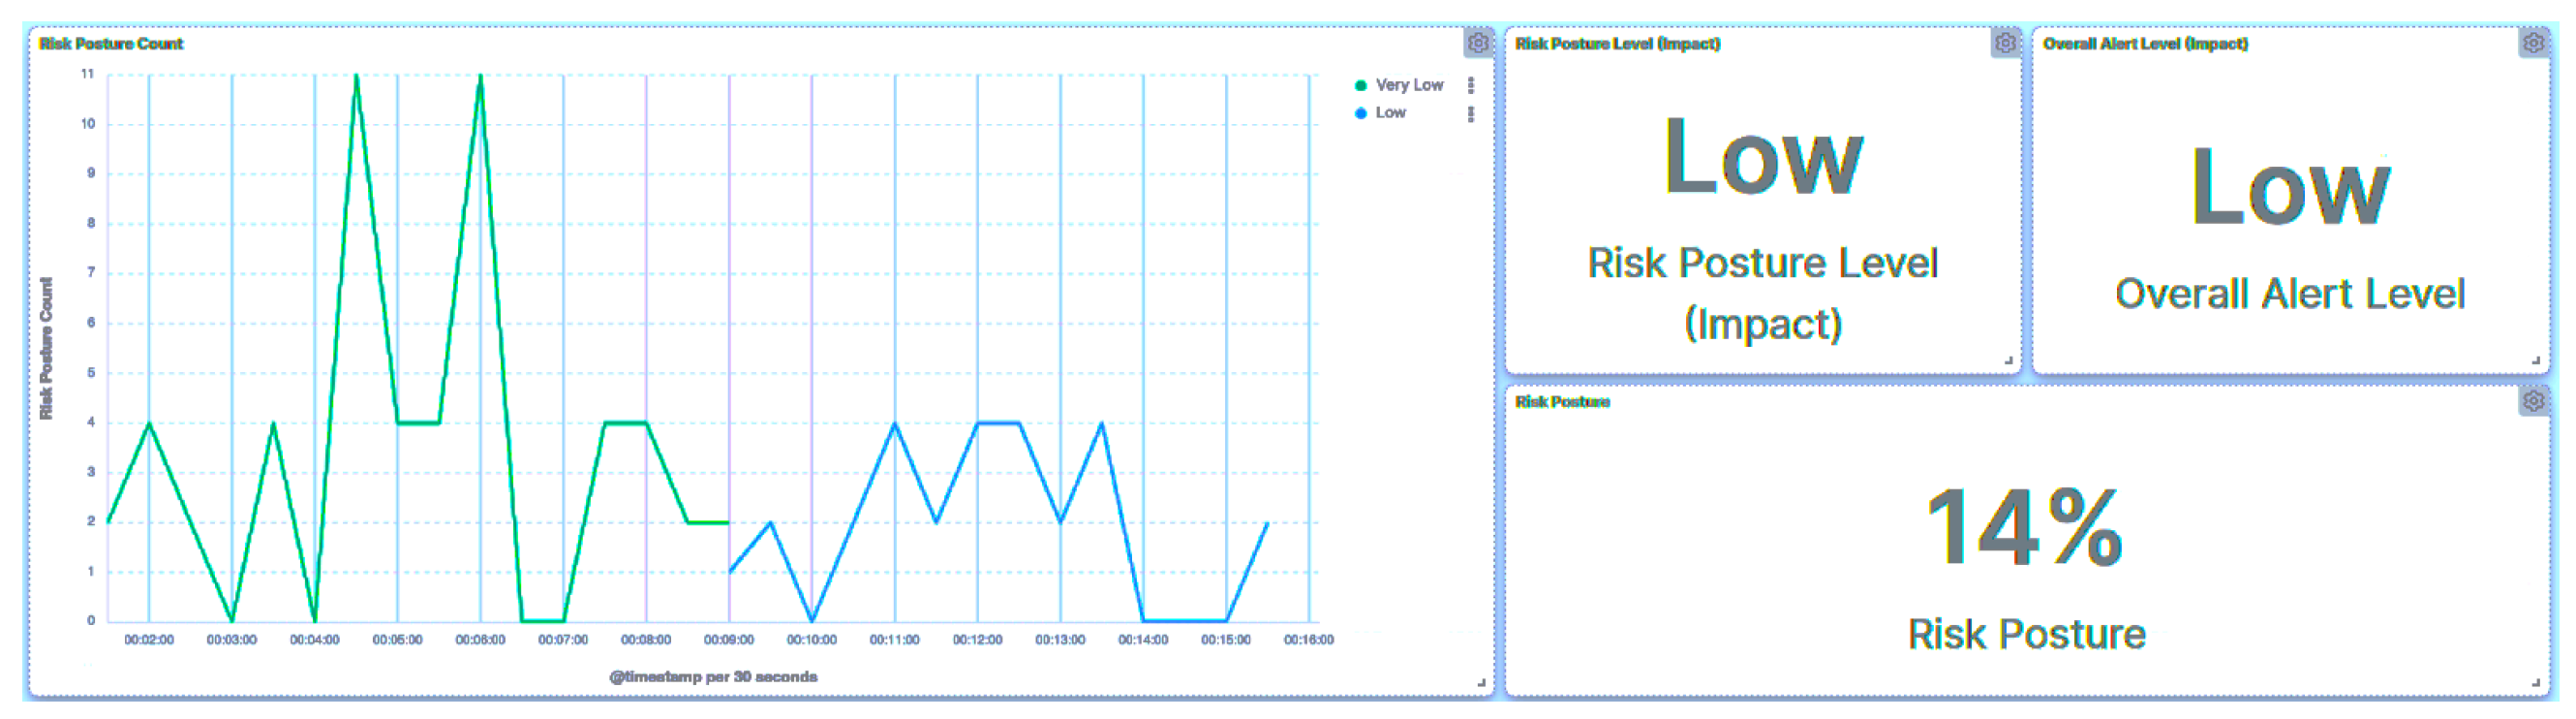
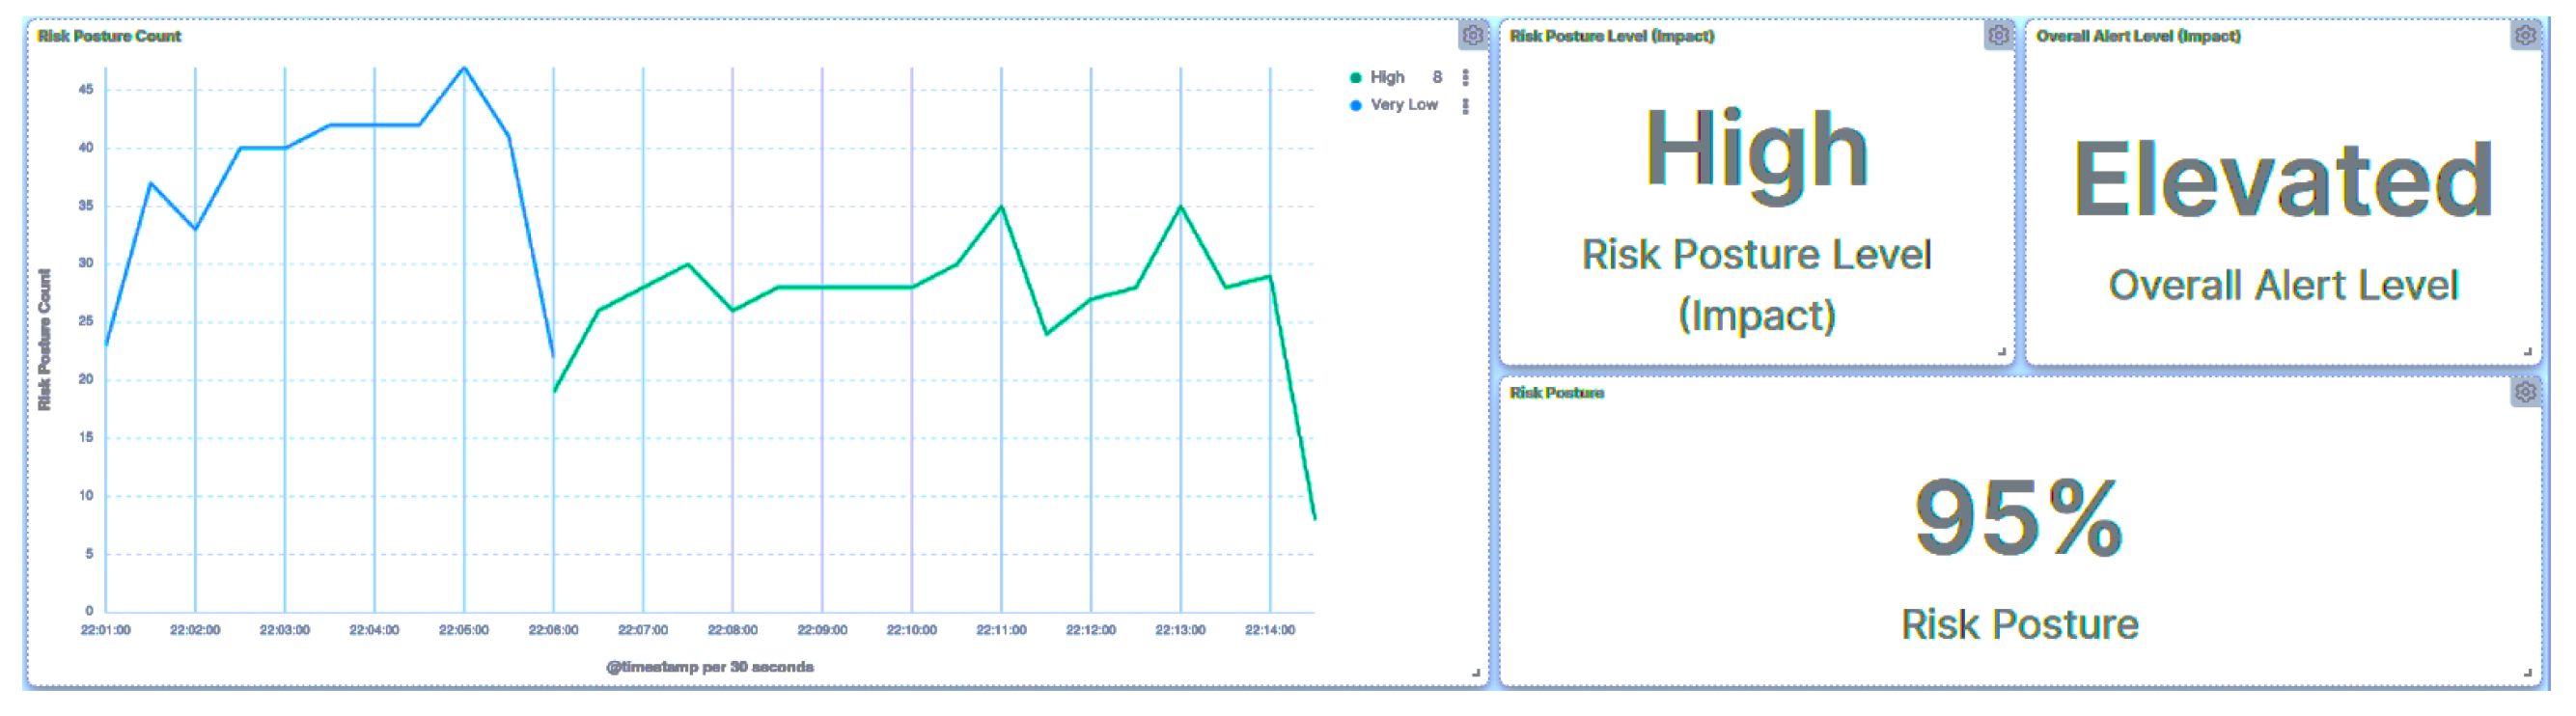
10.2. Risk Posture
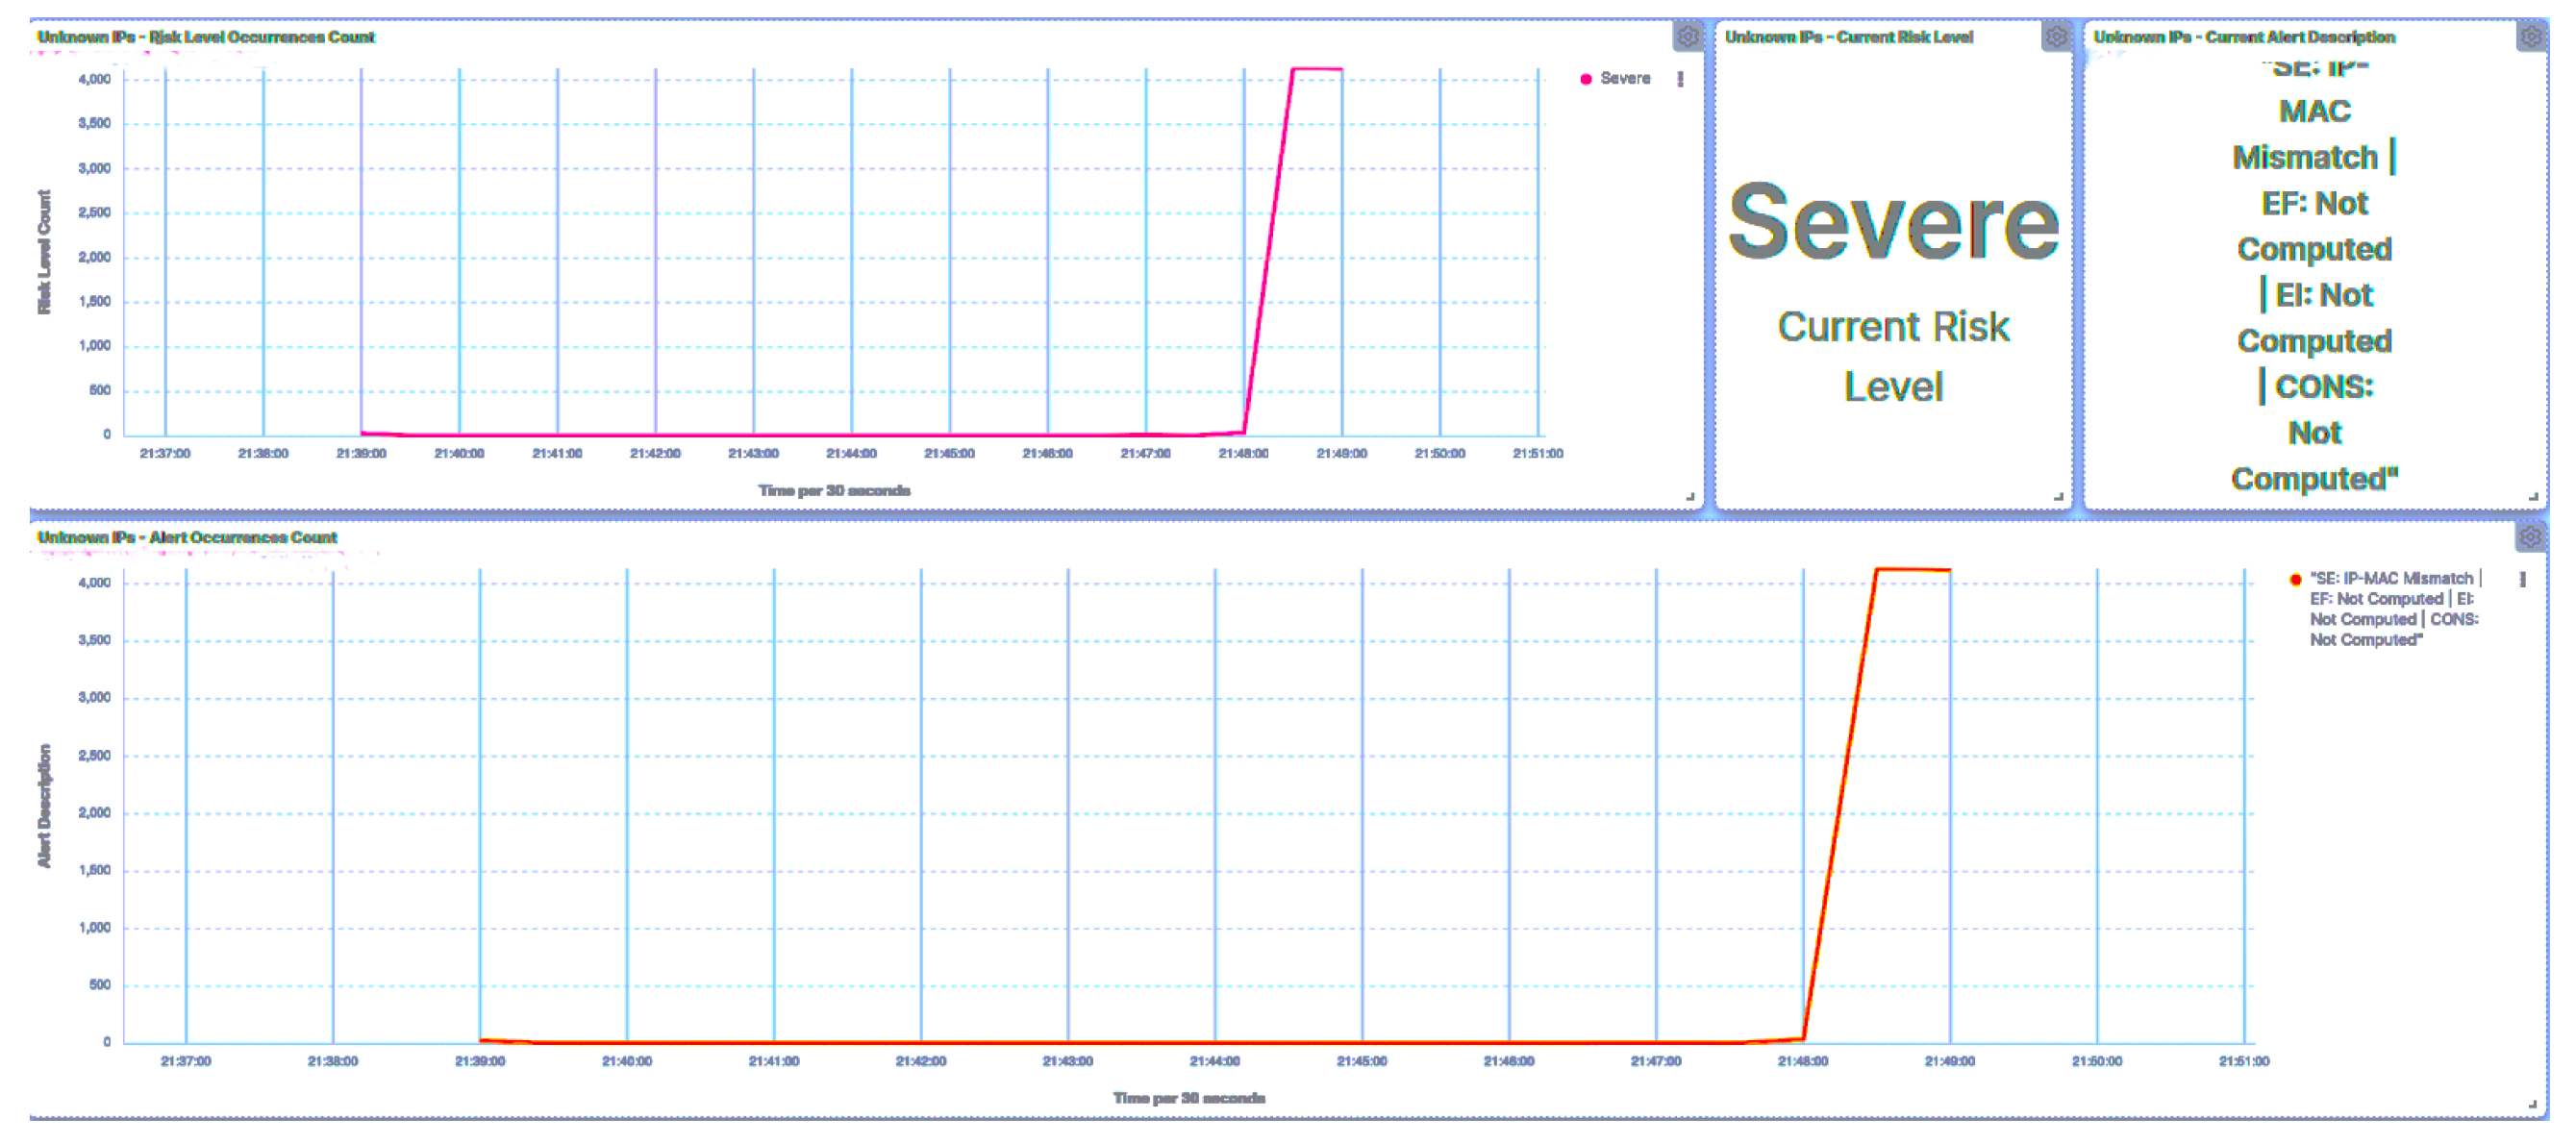
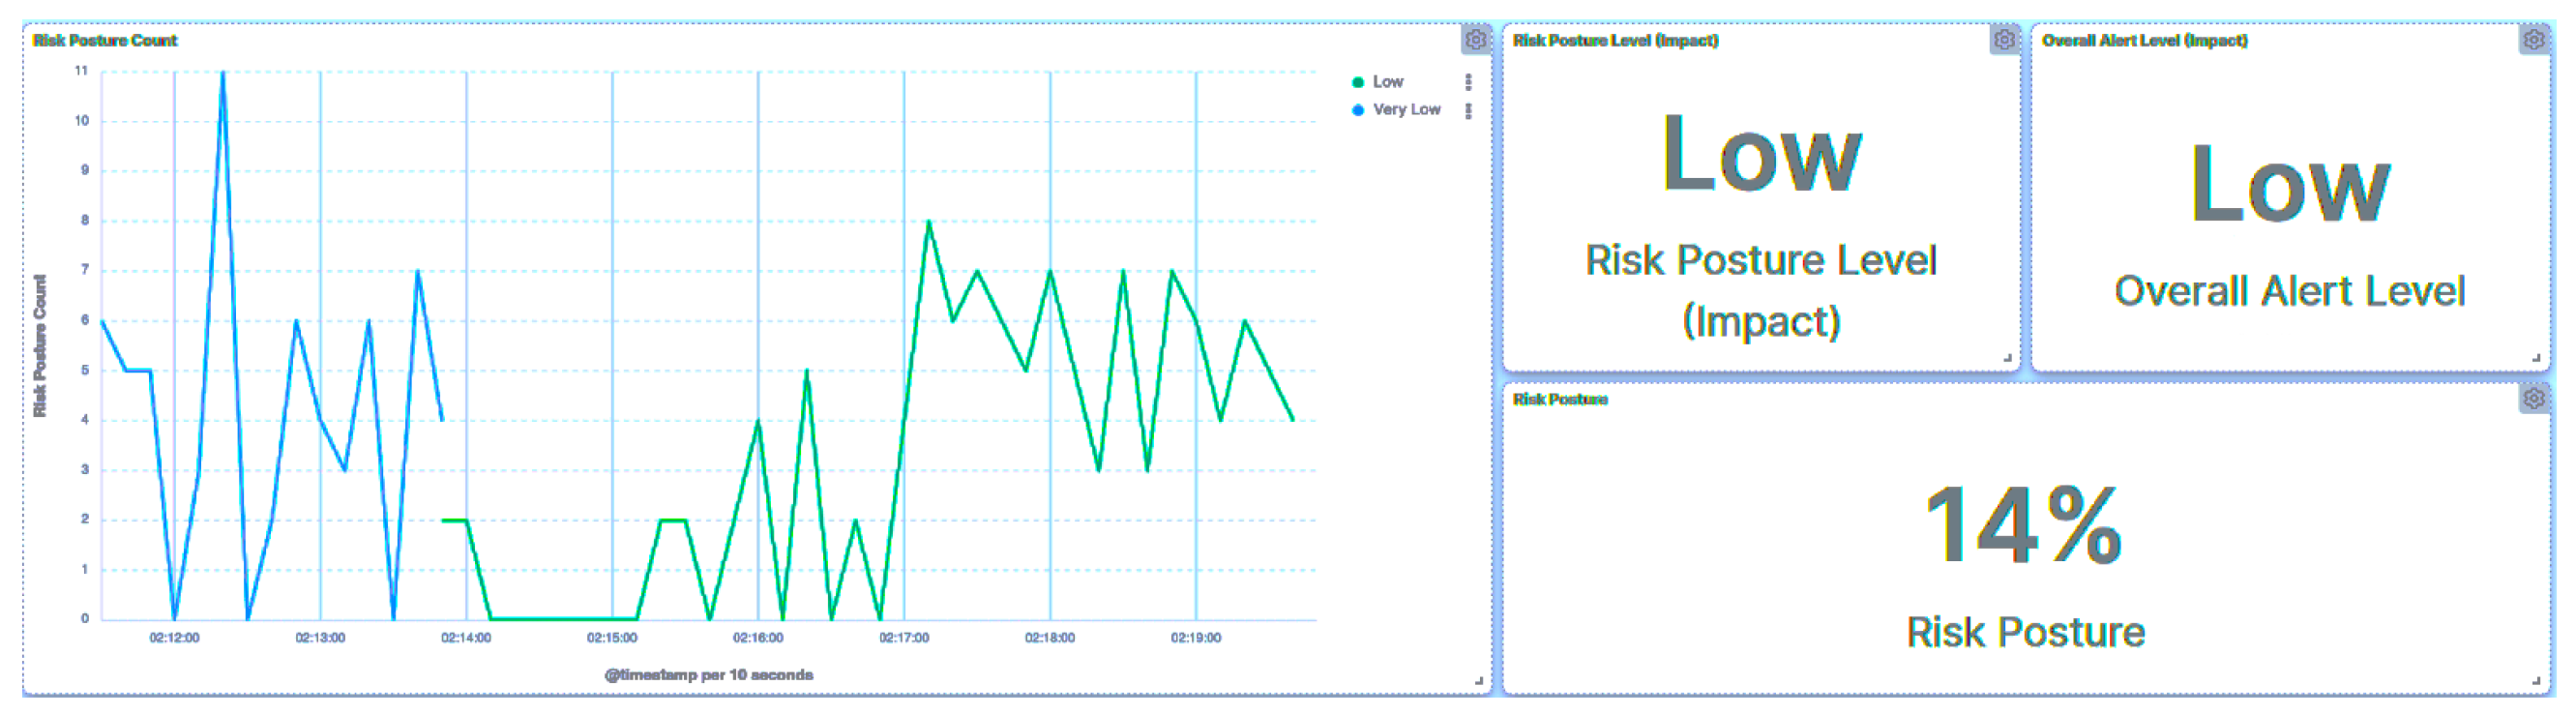
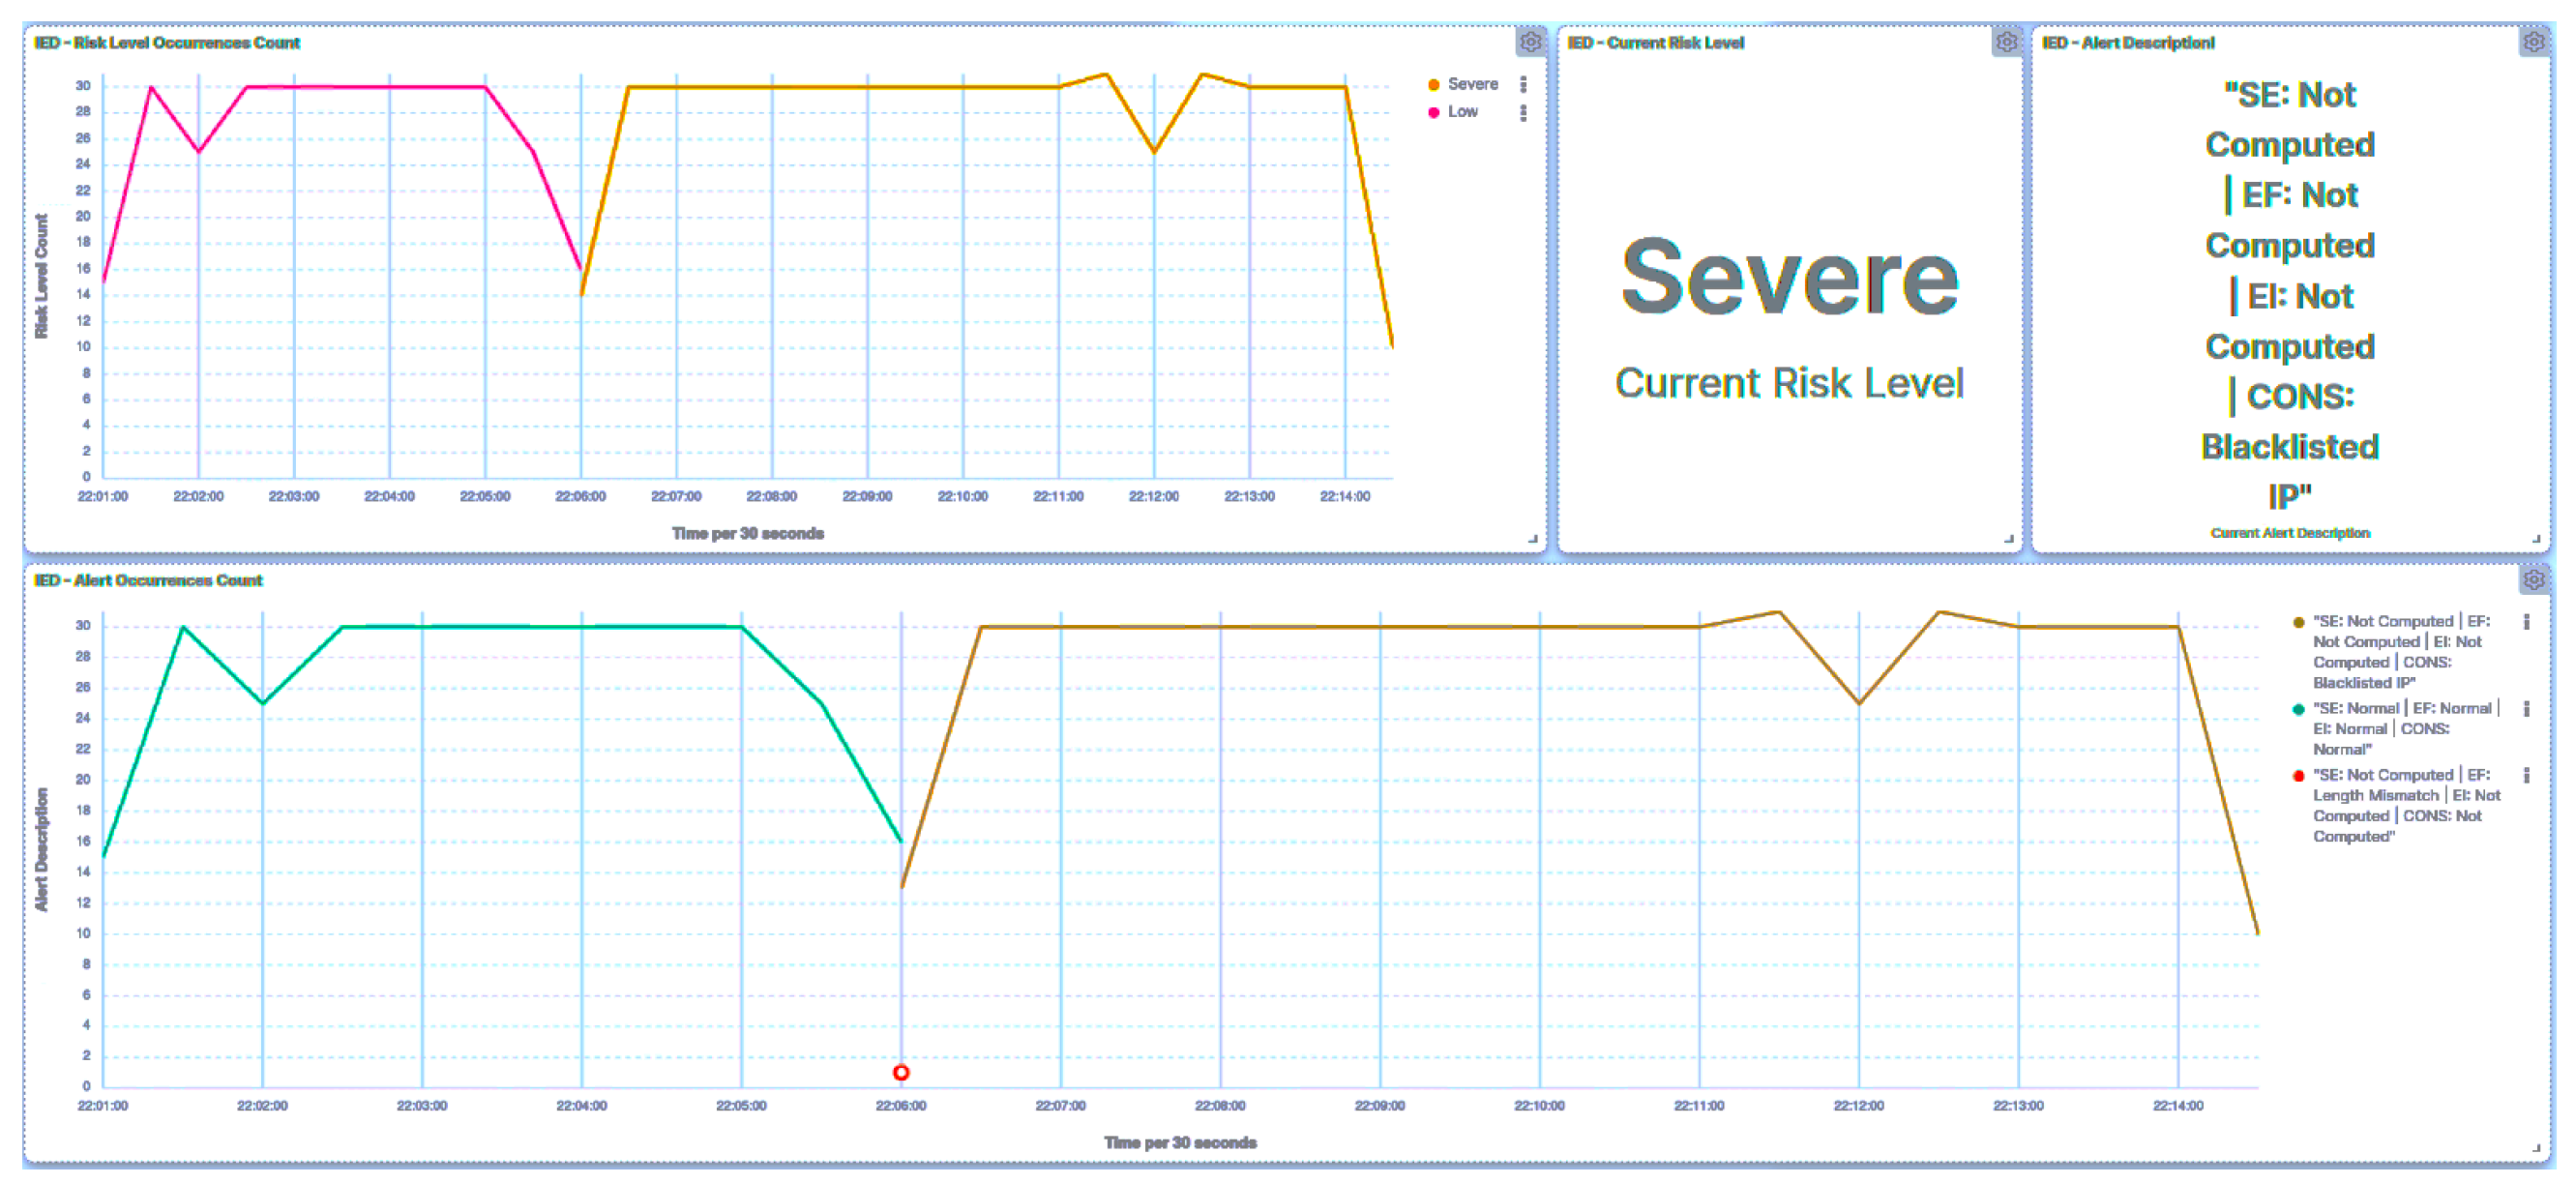
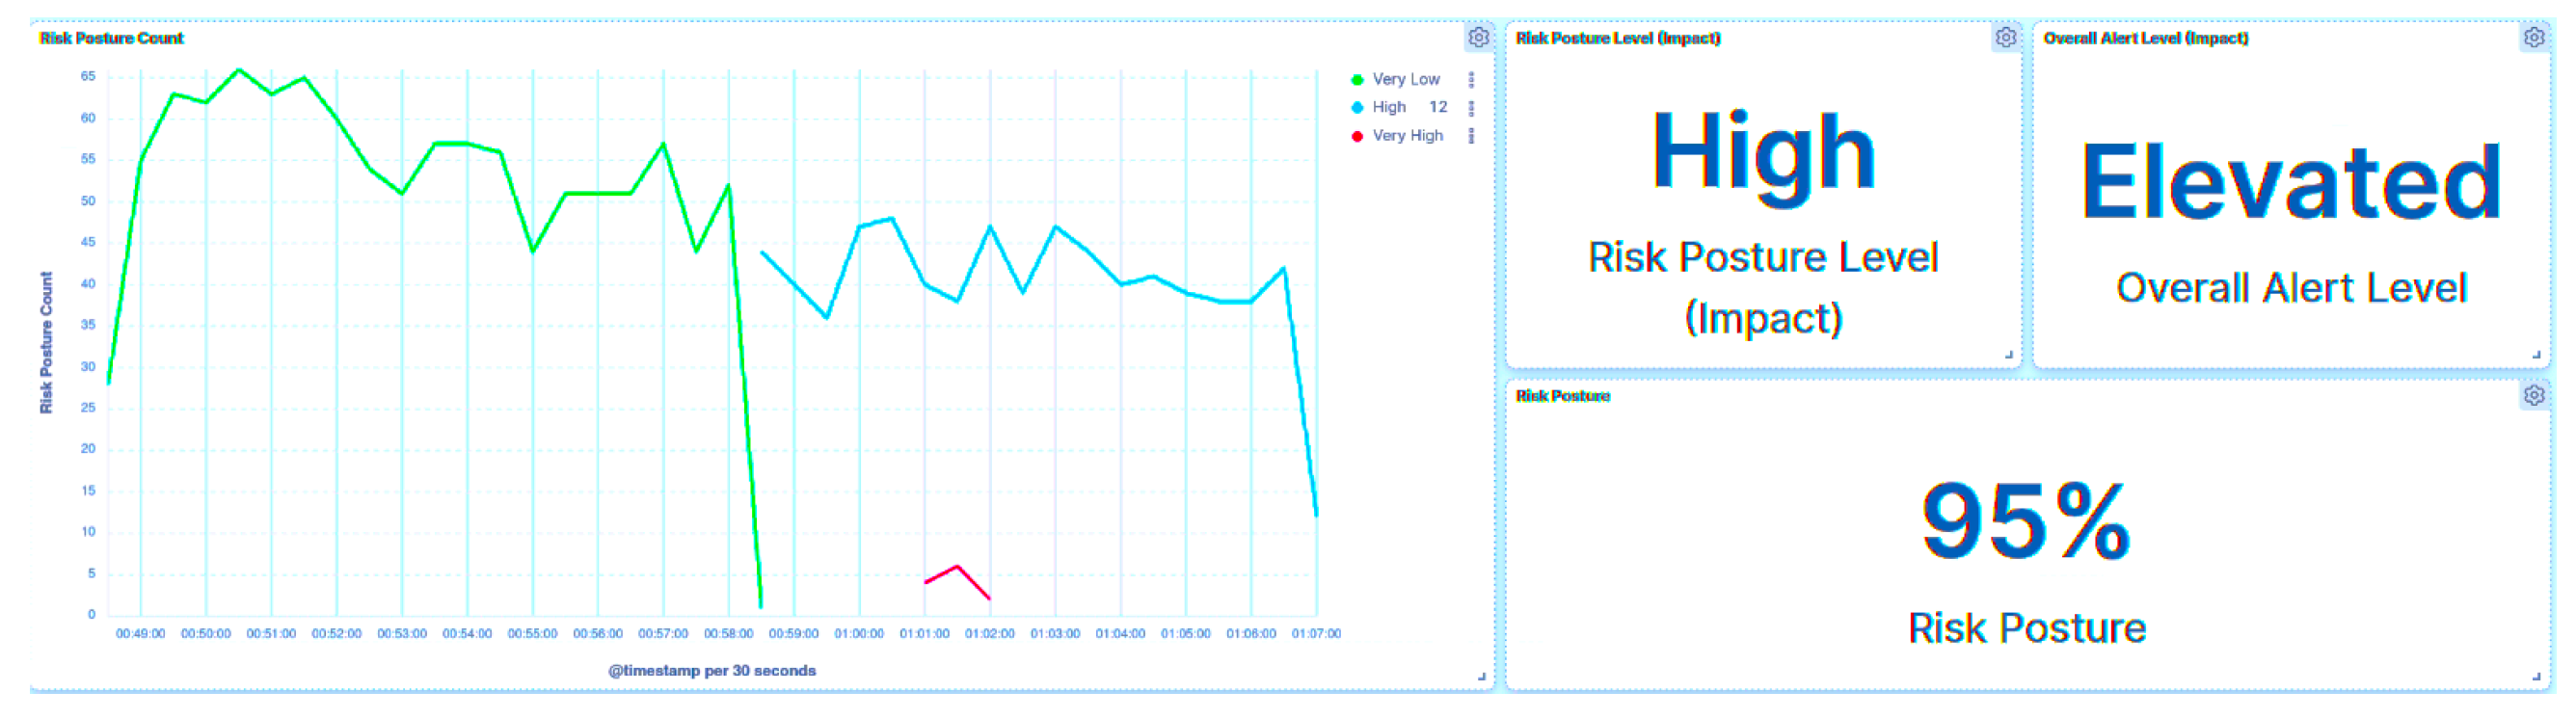
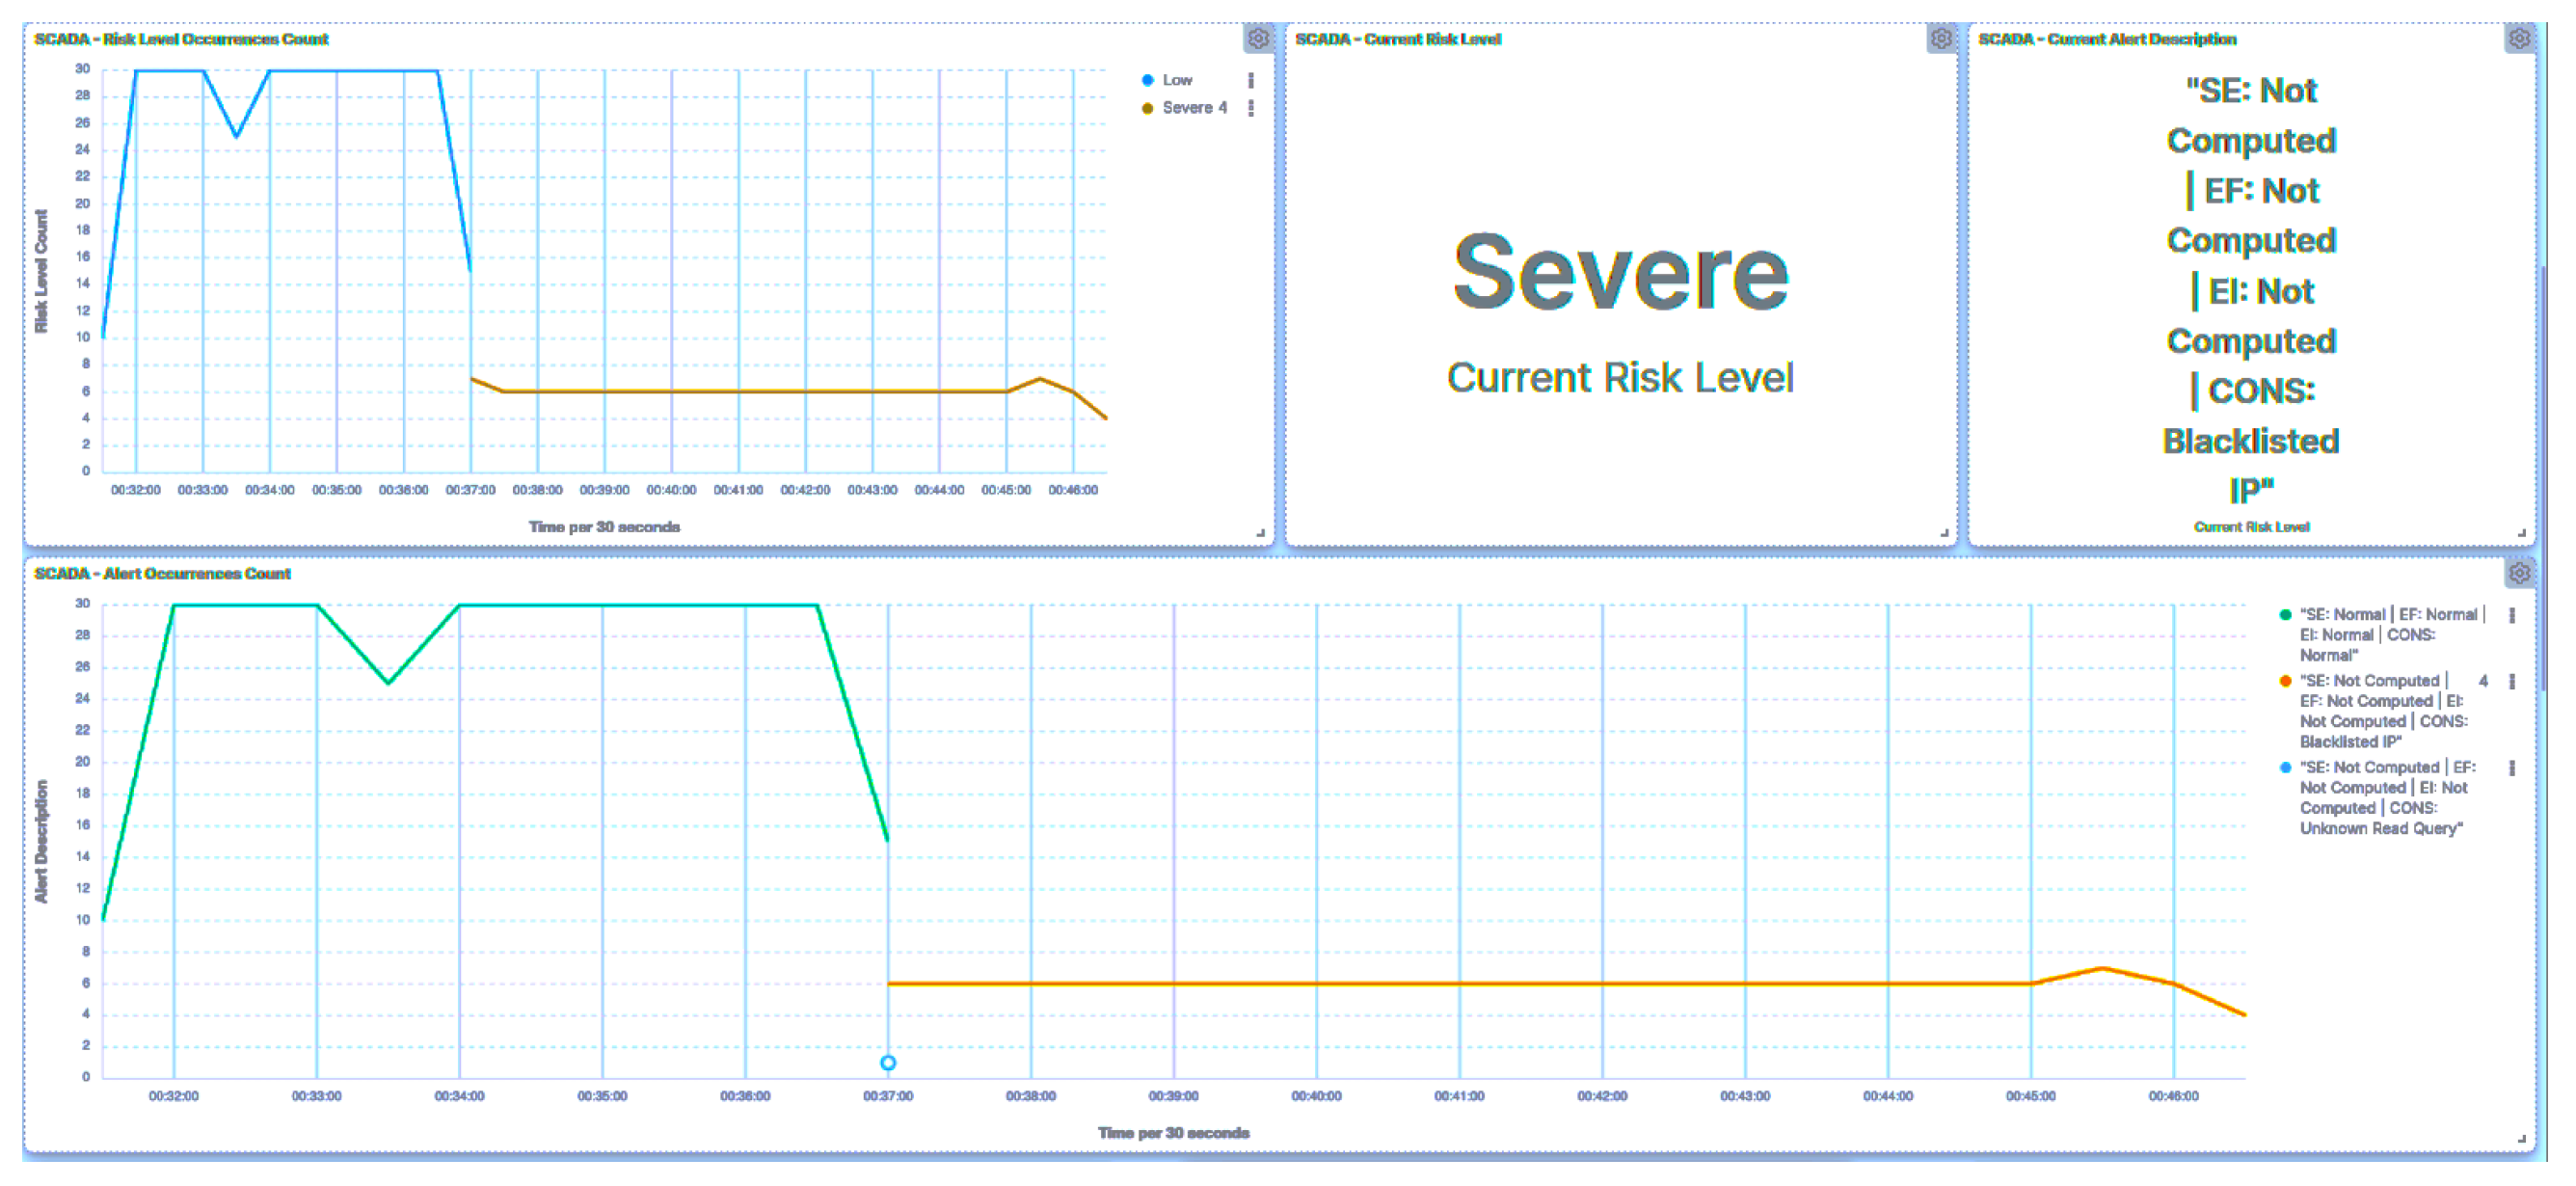
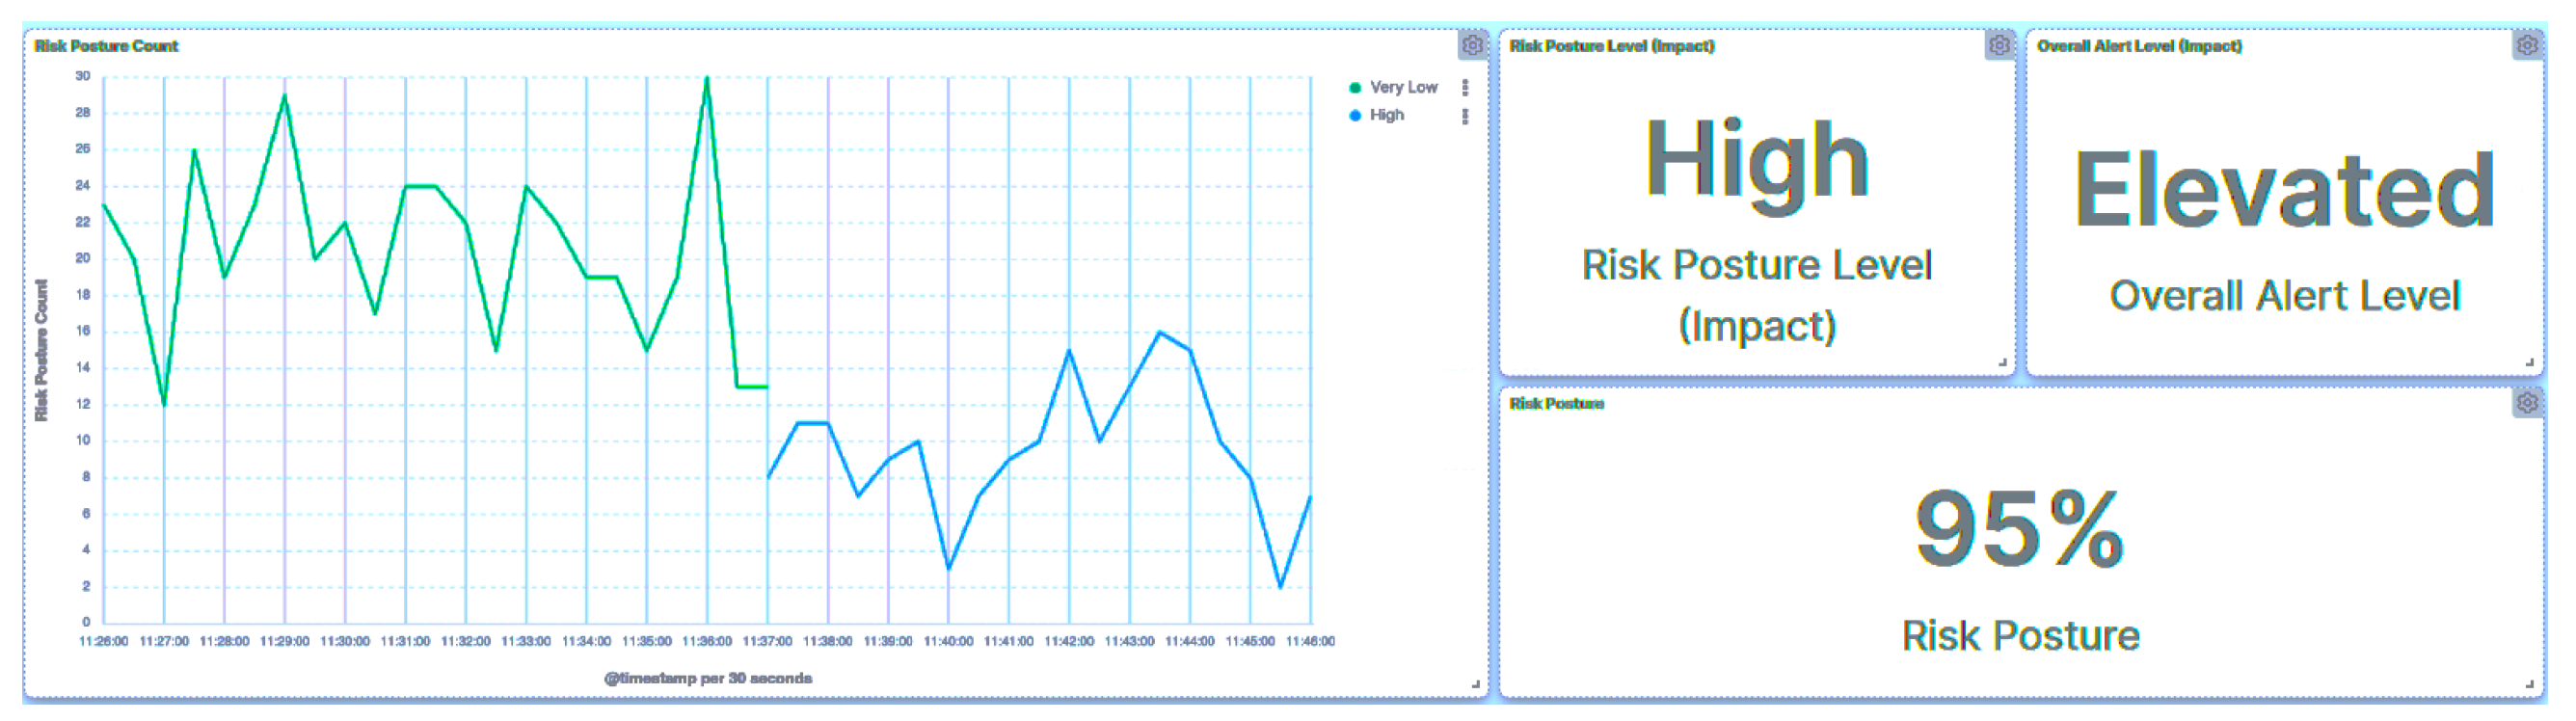
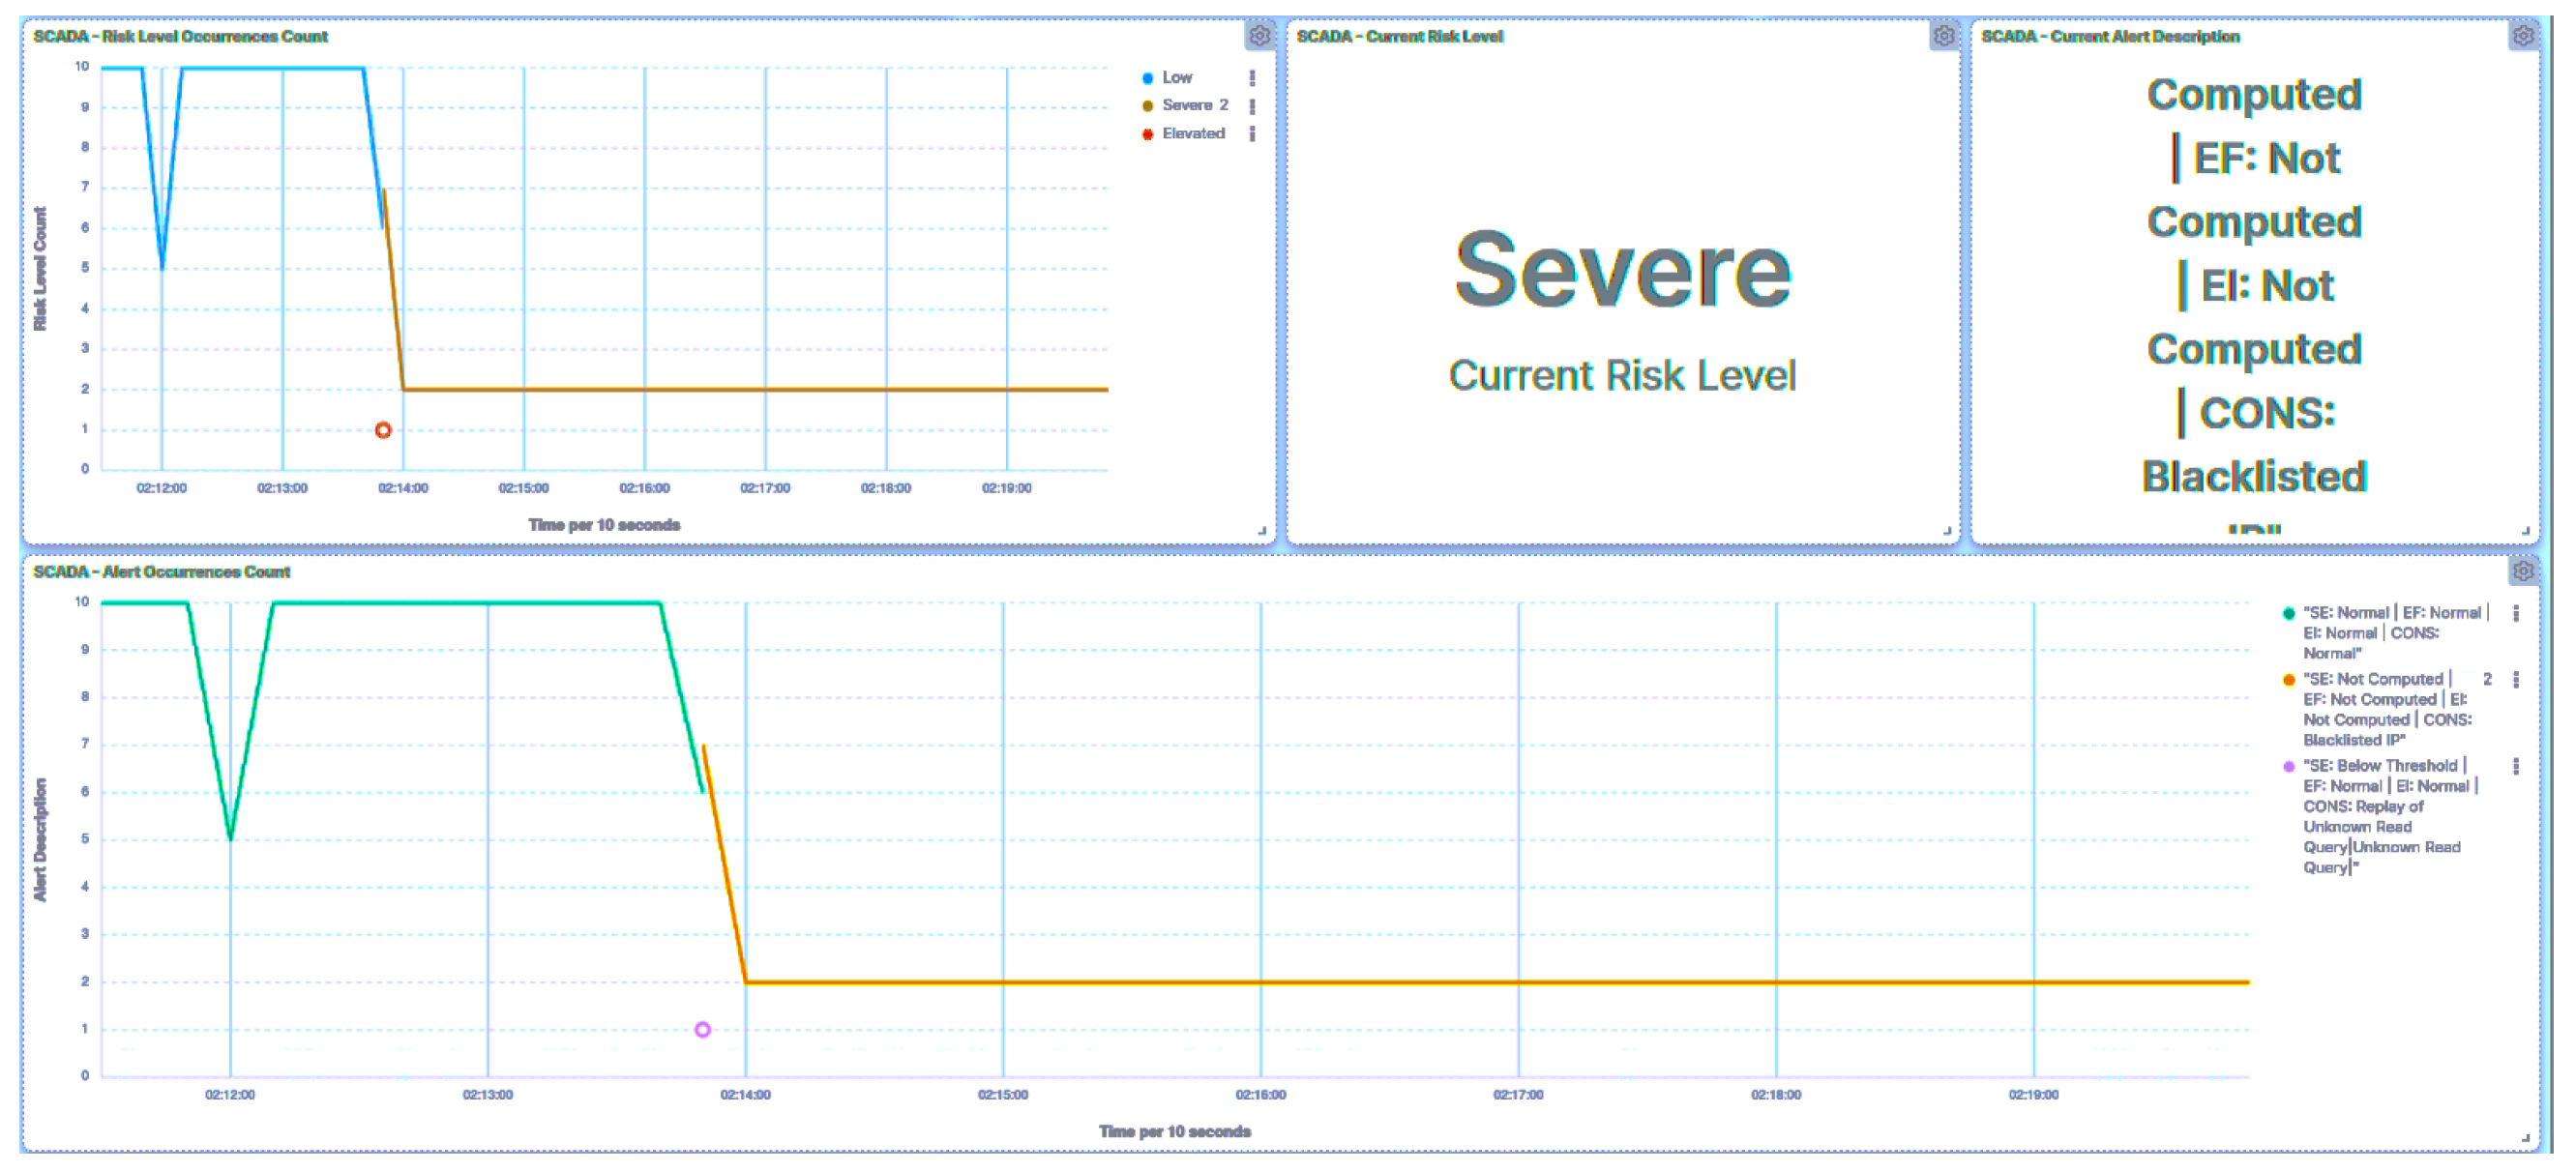
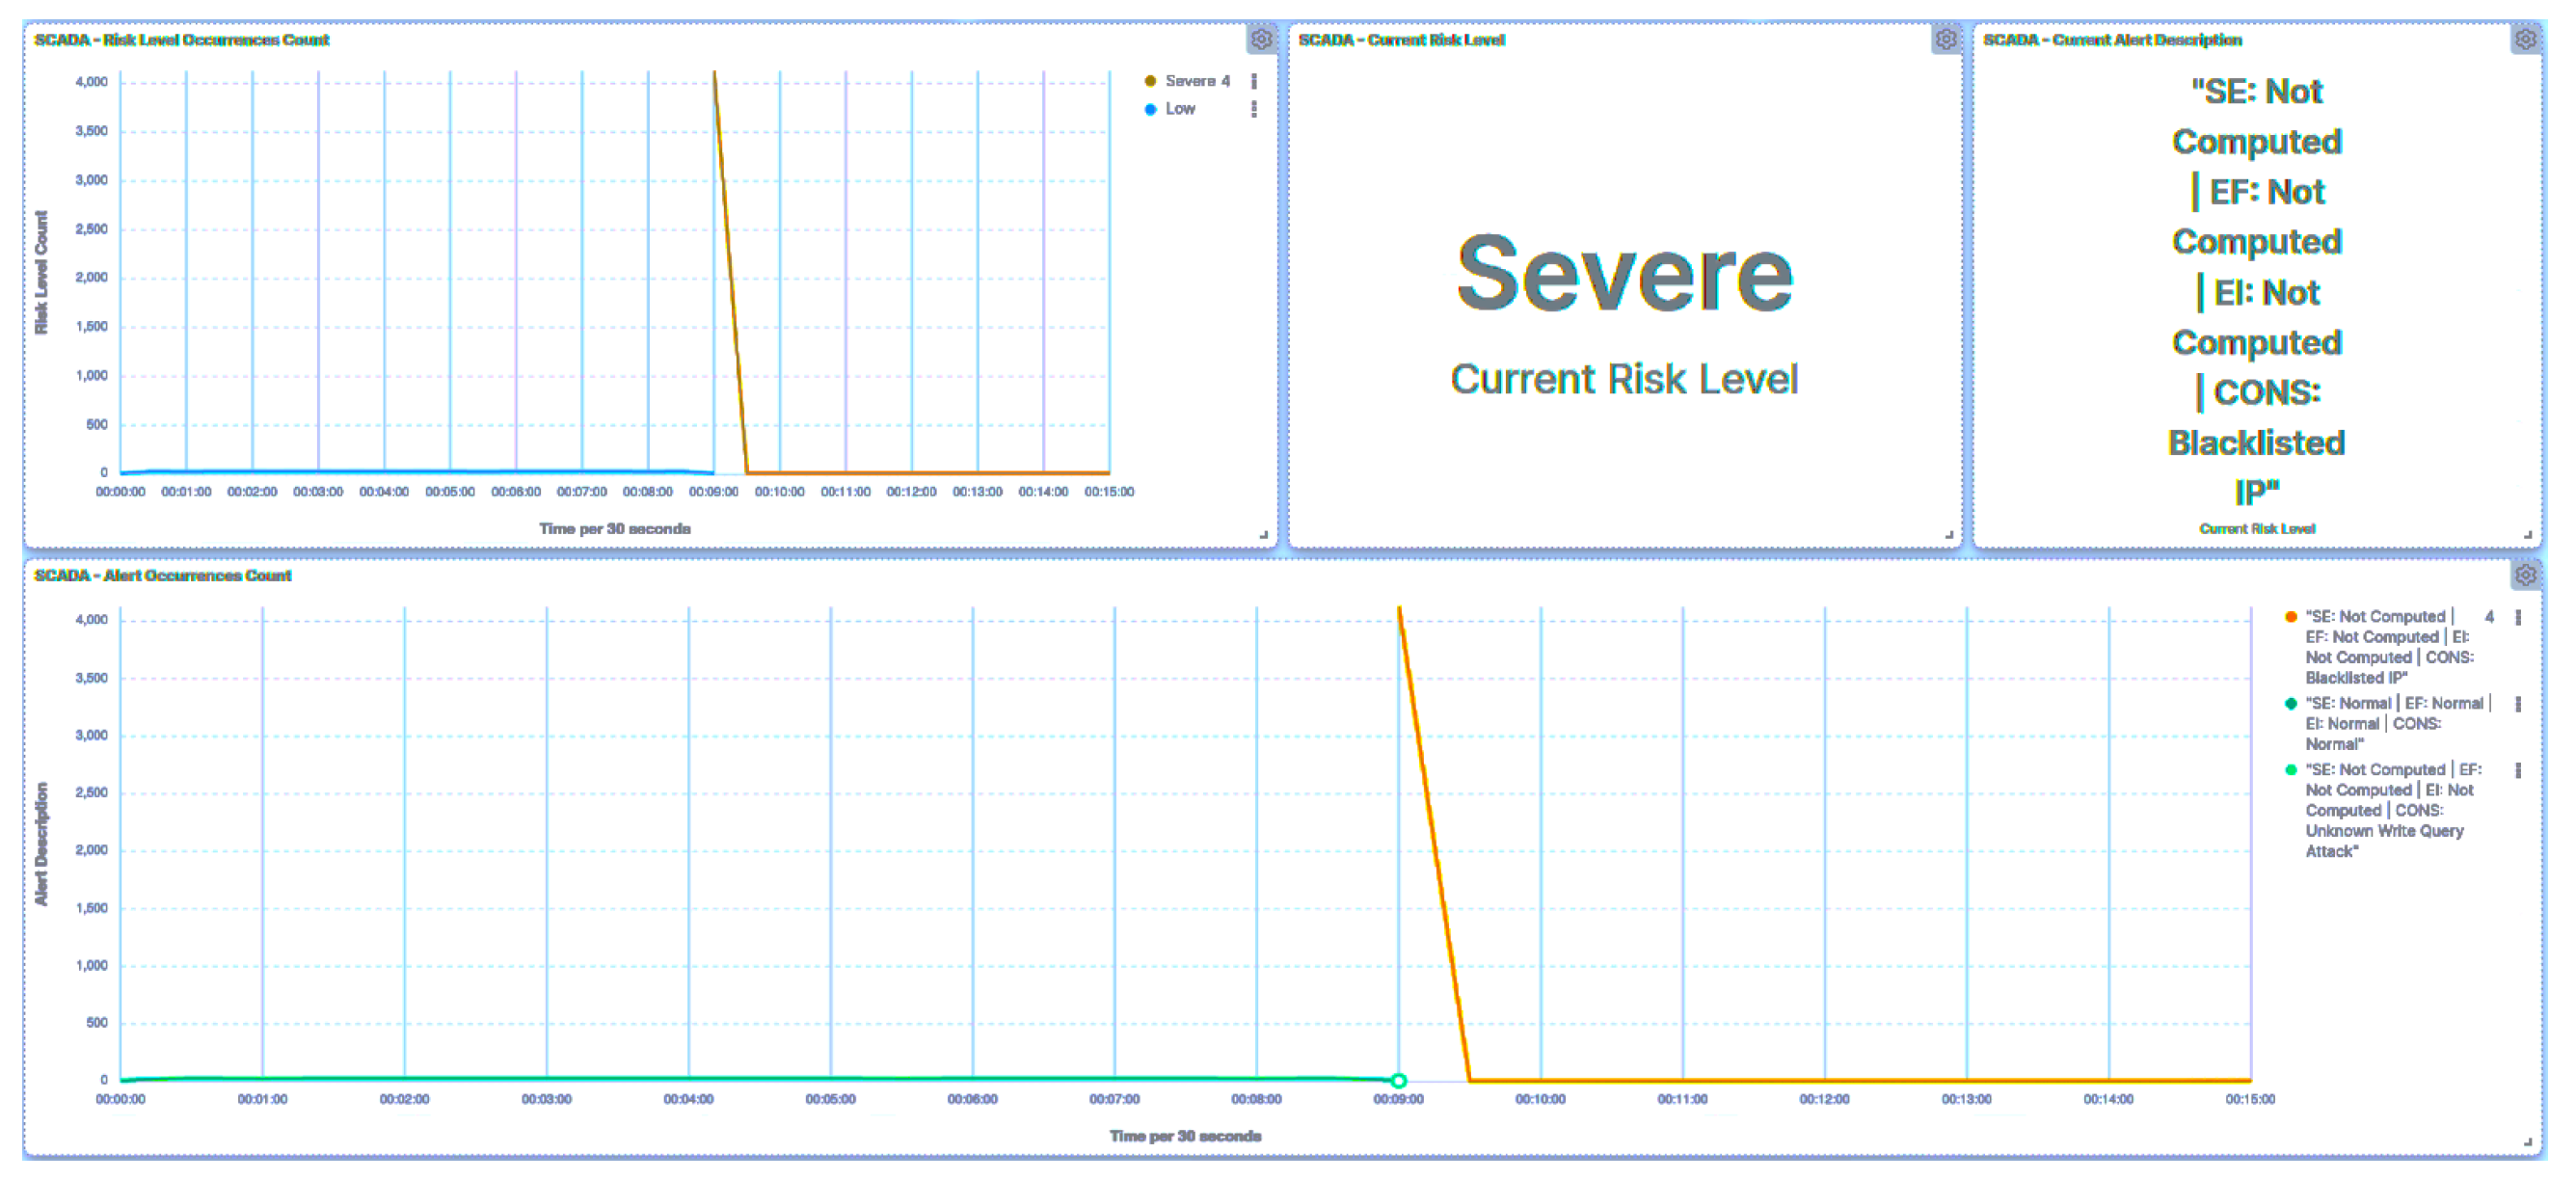
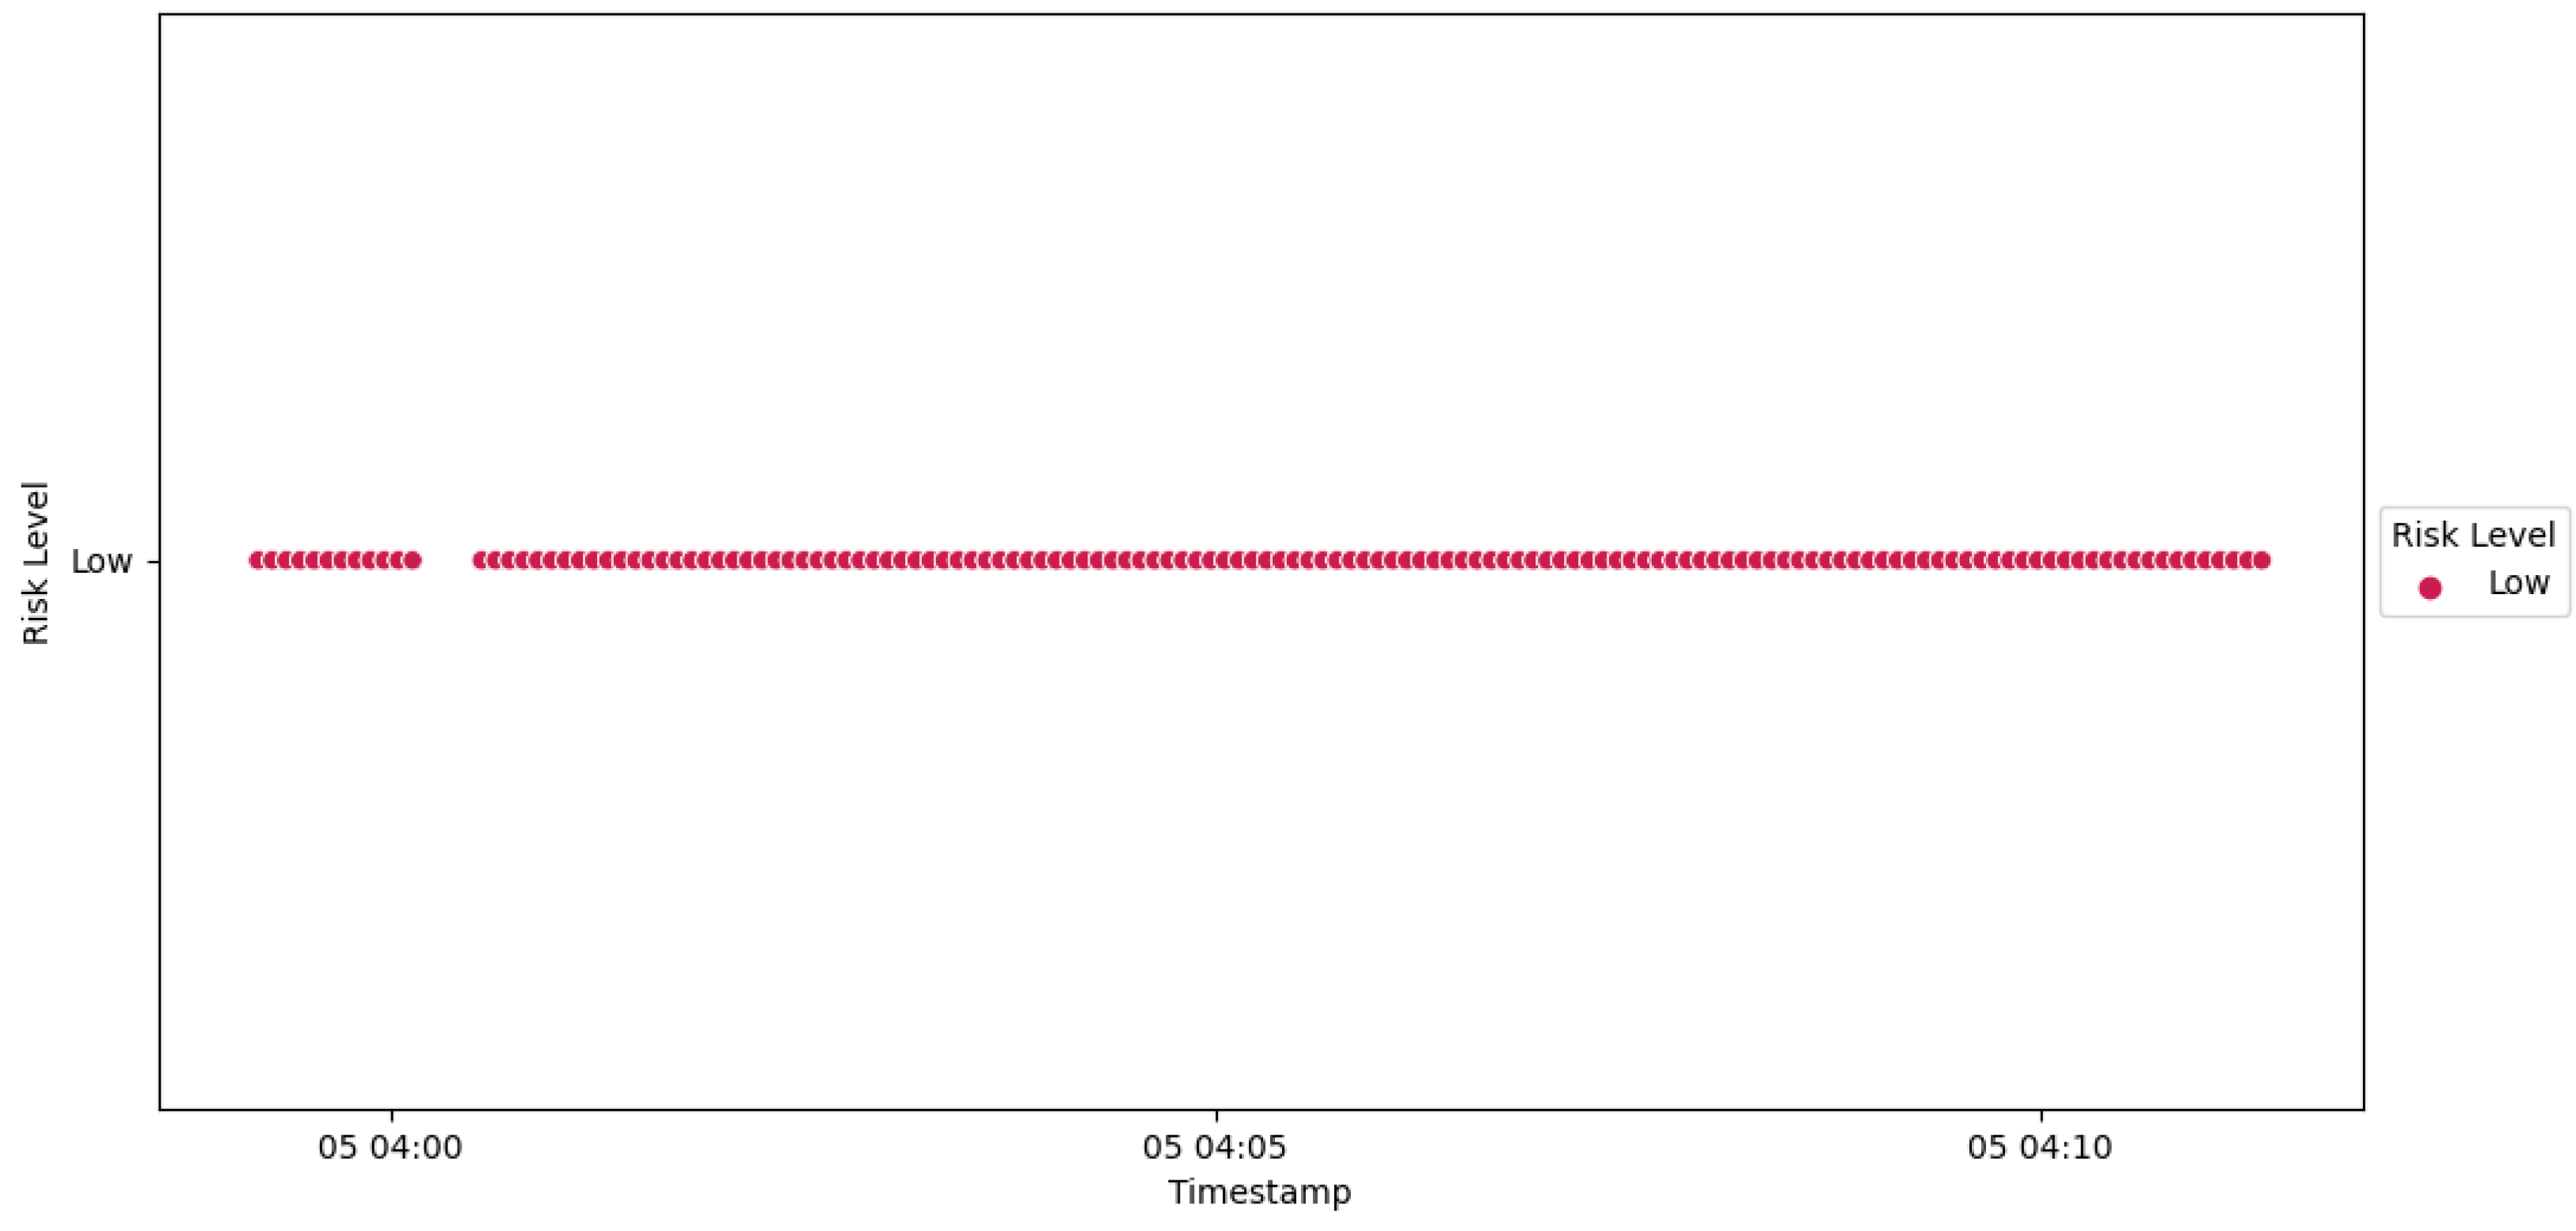
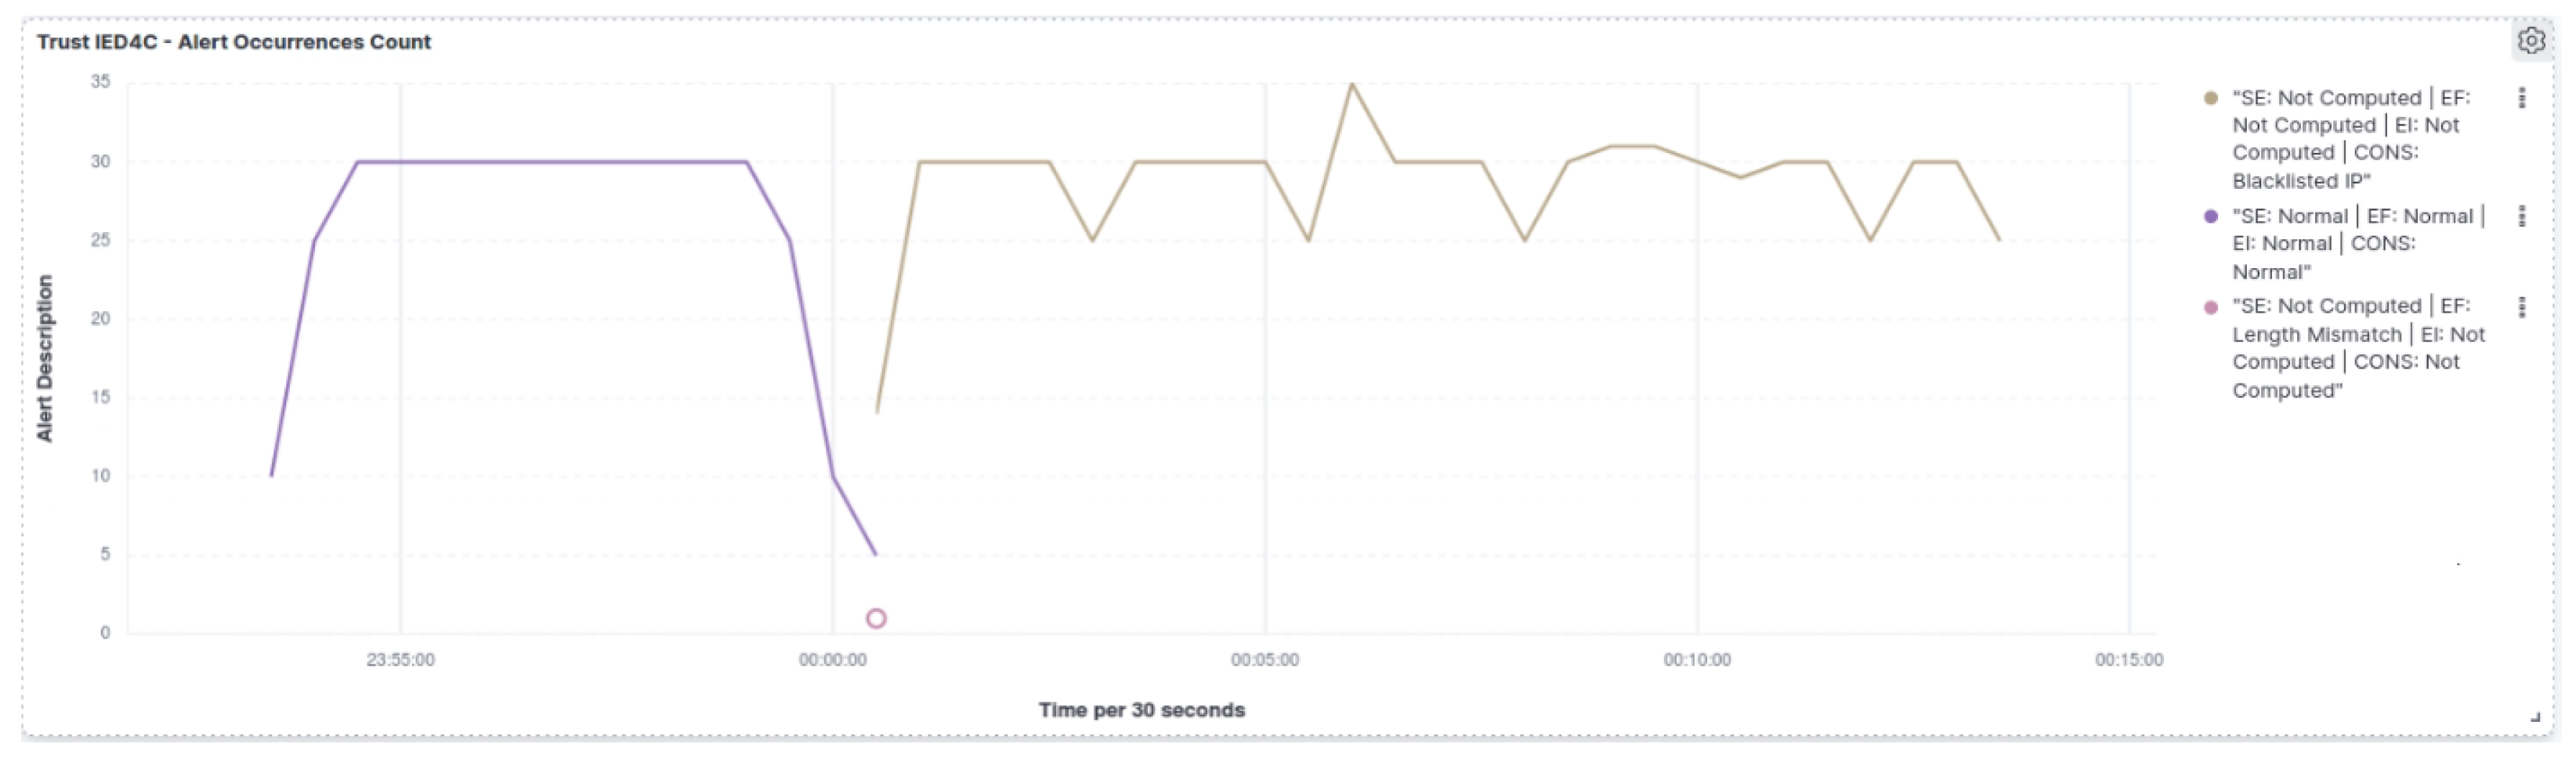
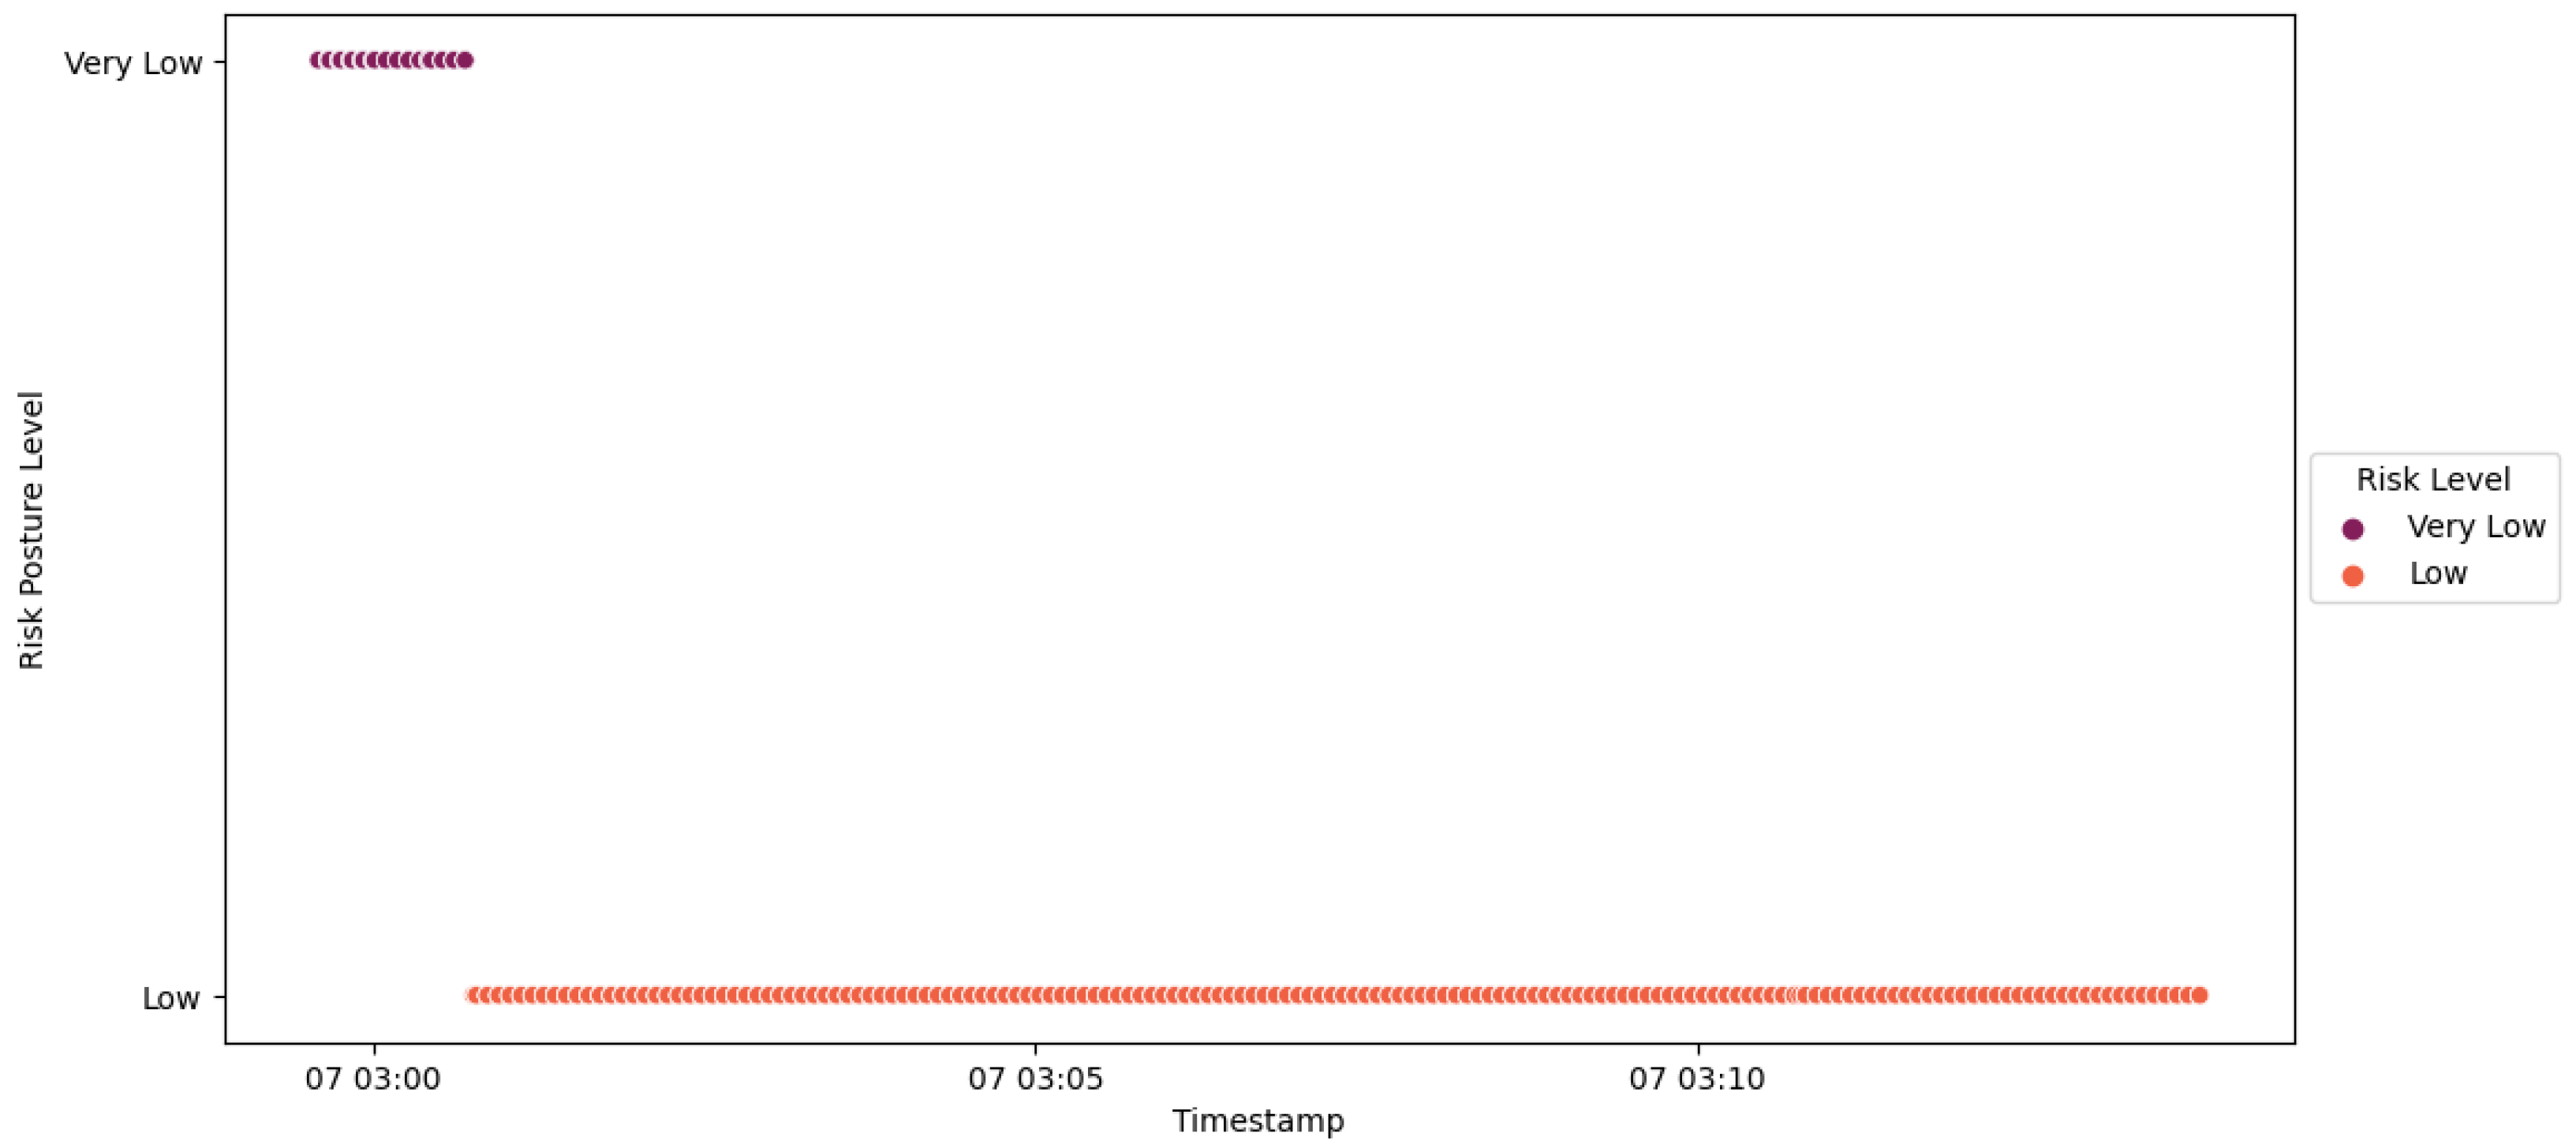
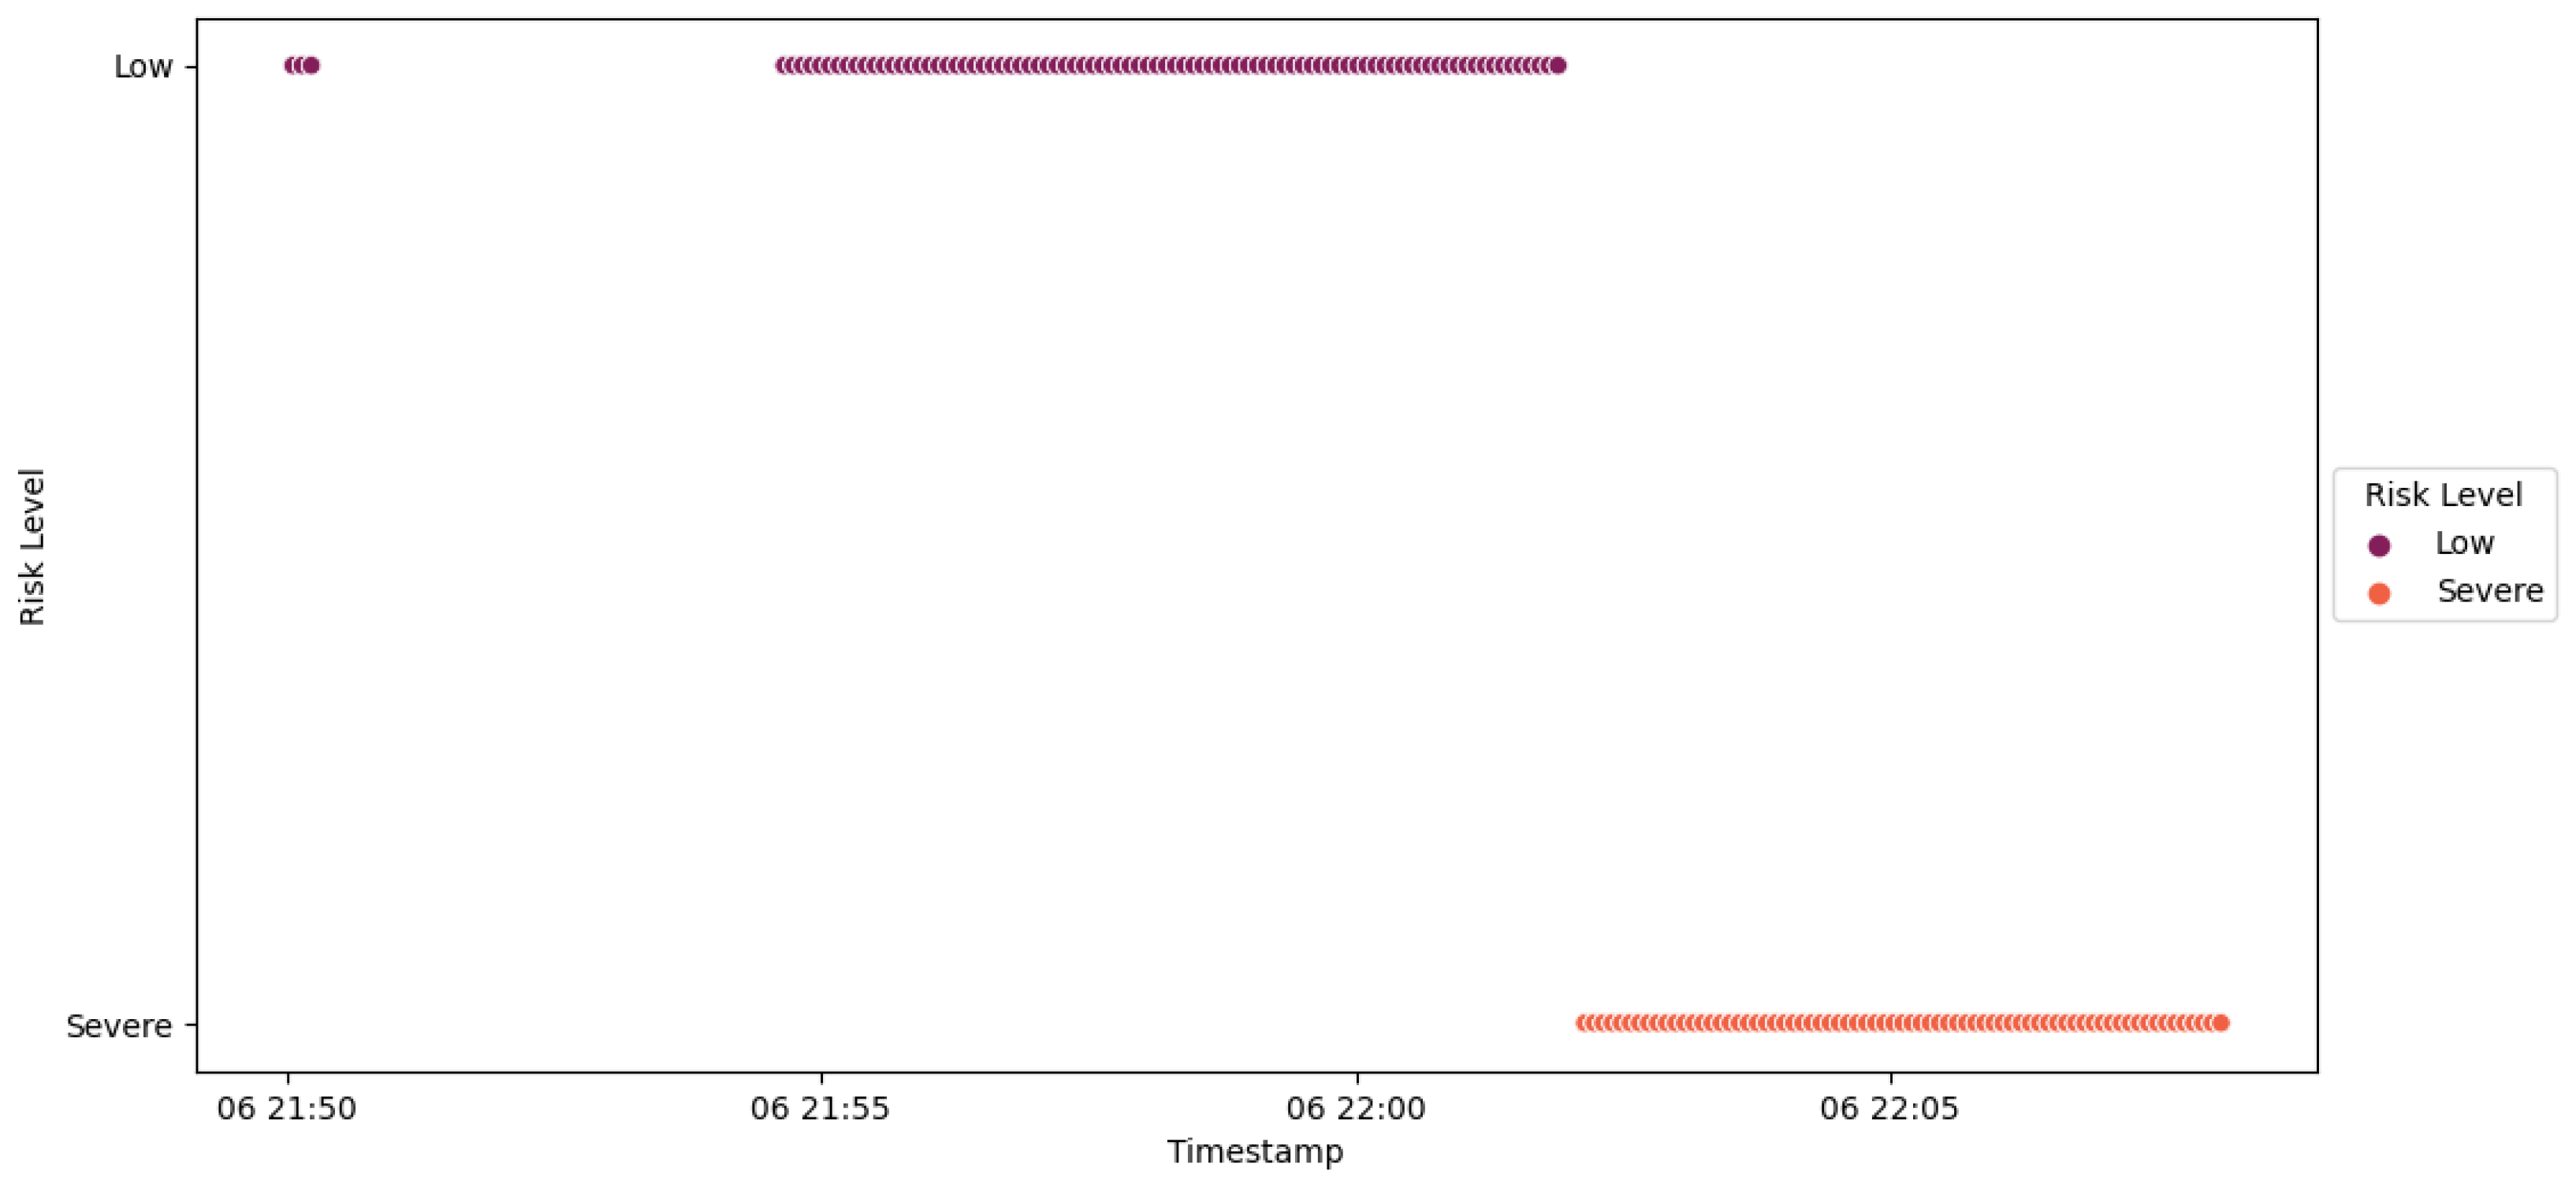
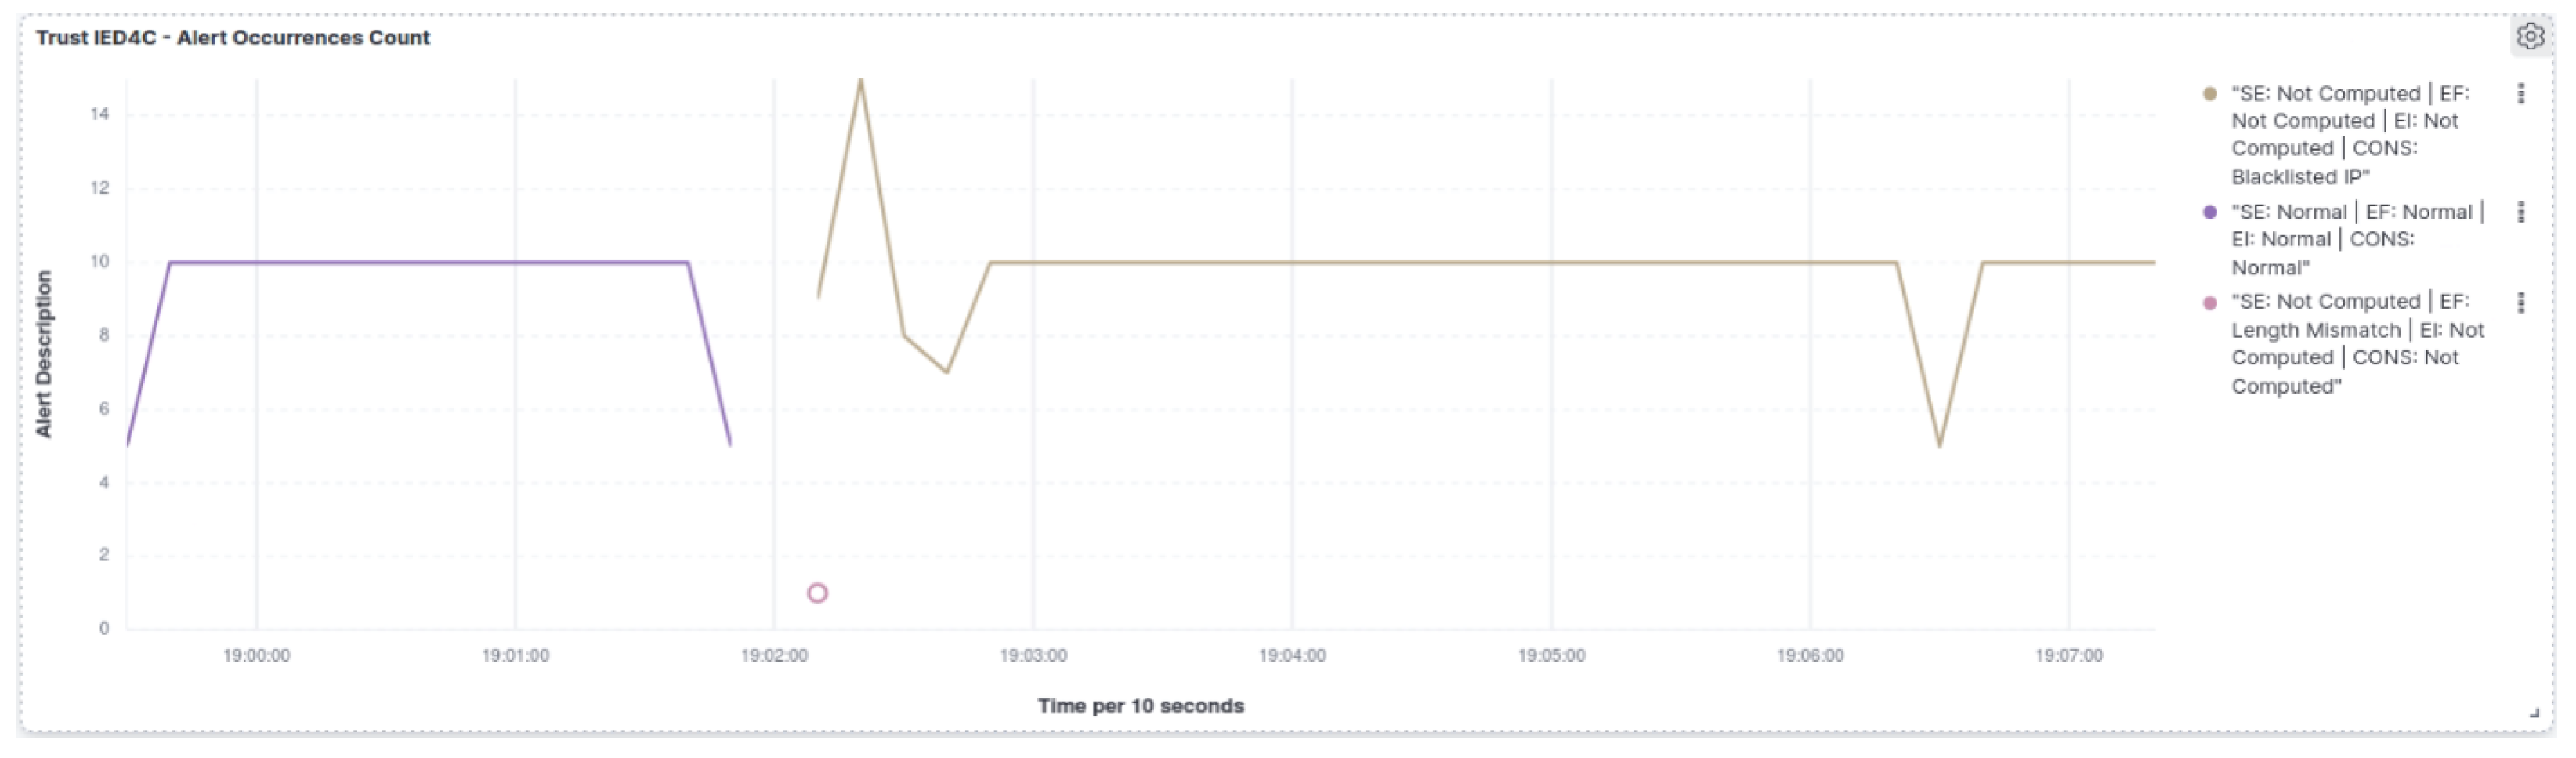
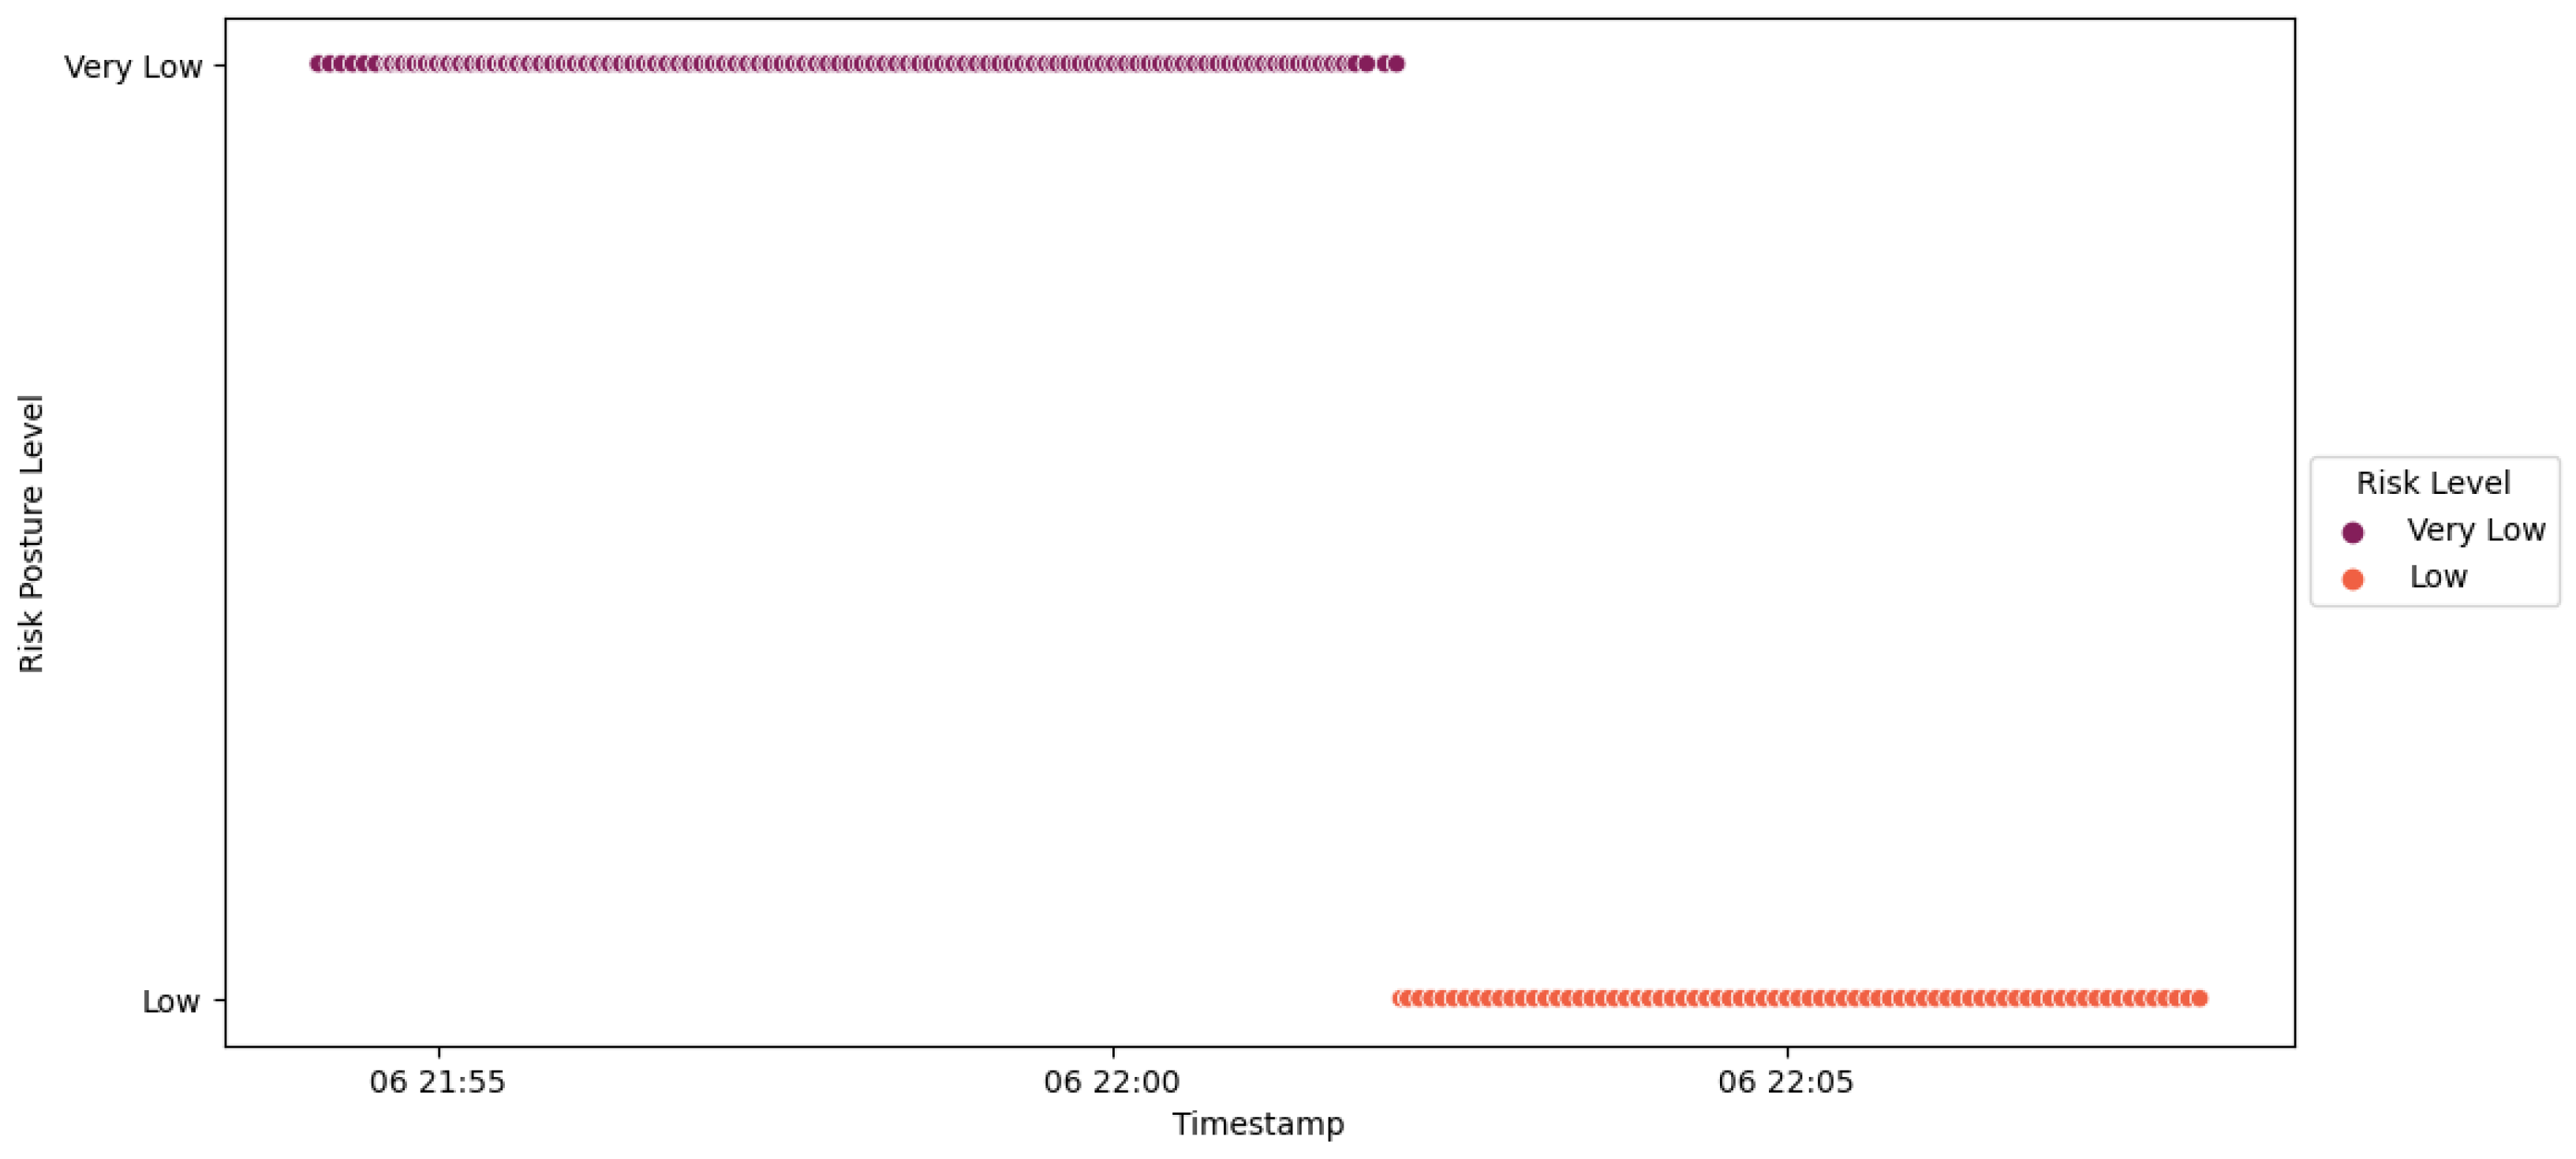
10.2.1. Attack from Rogue Device
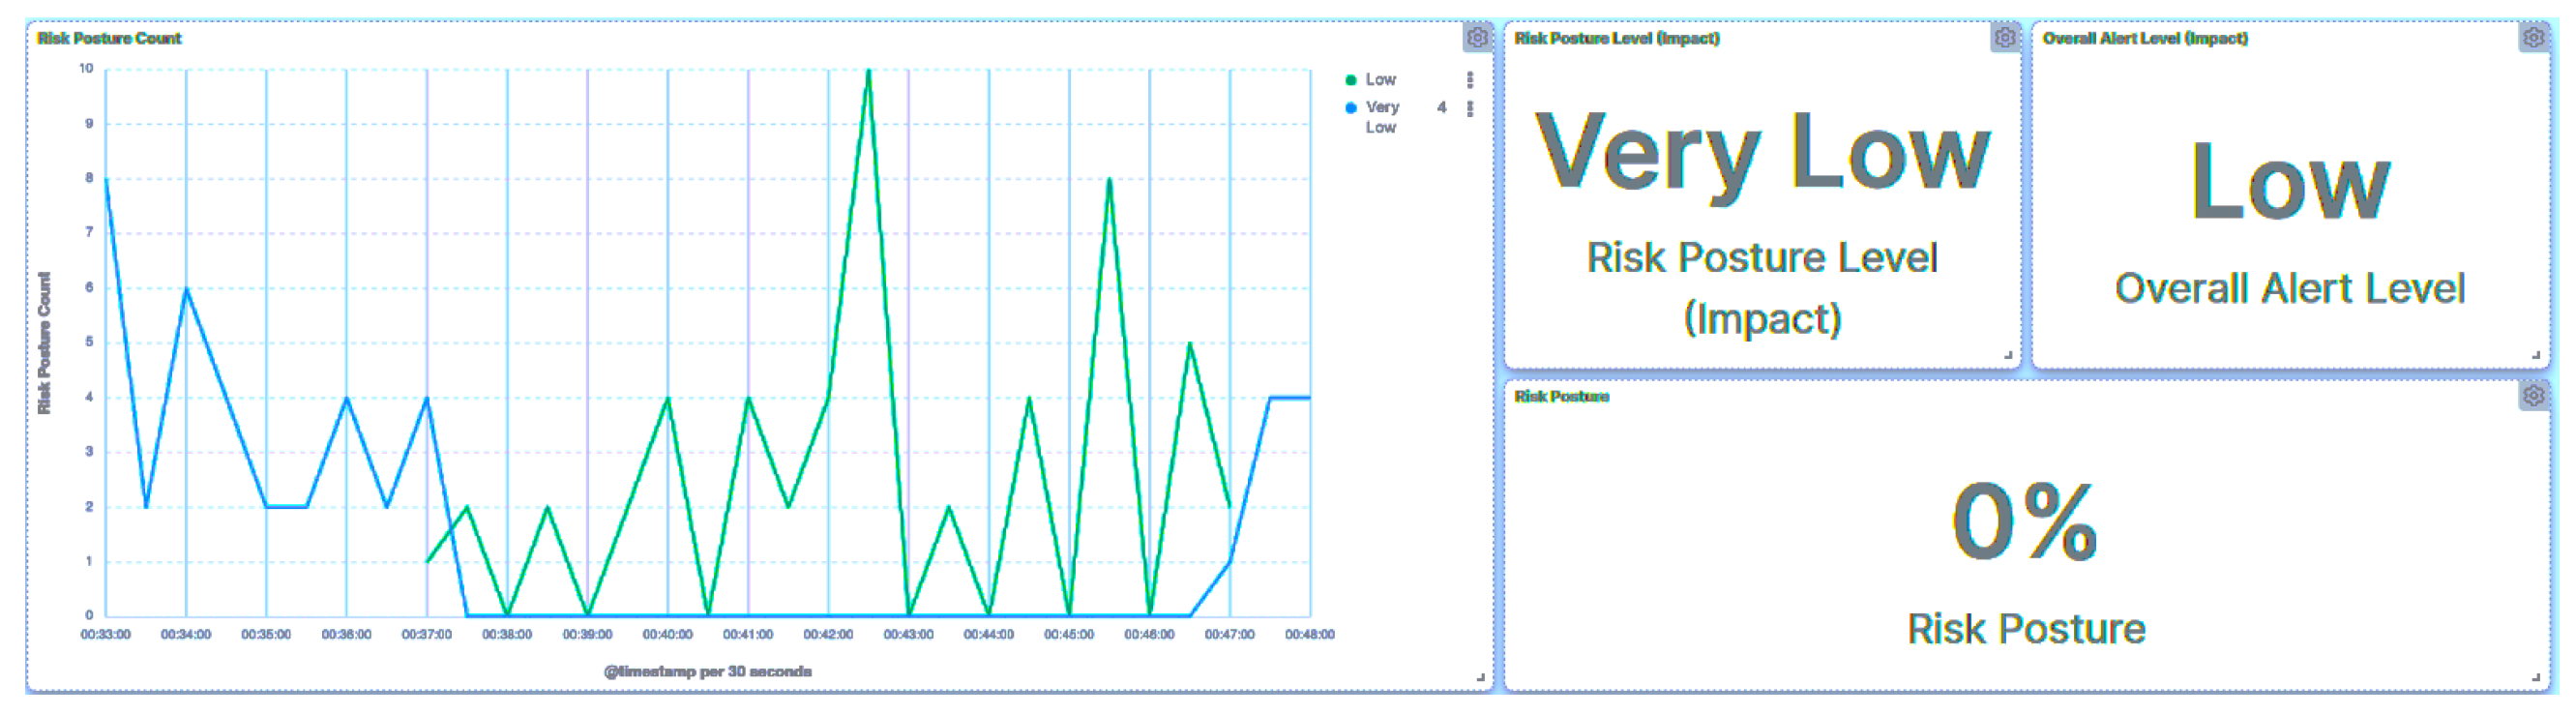
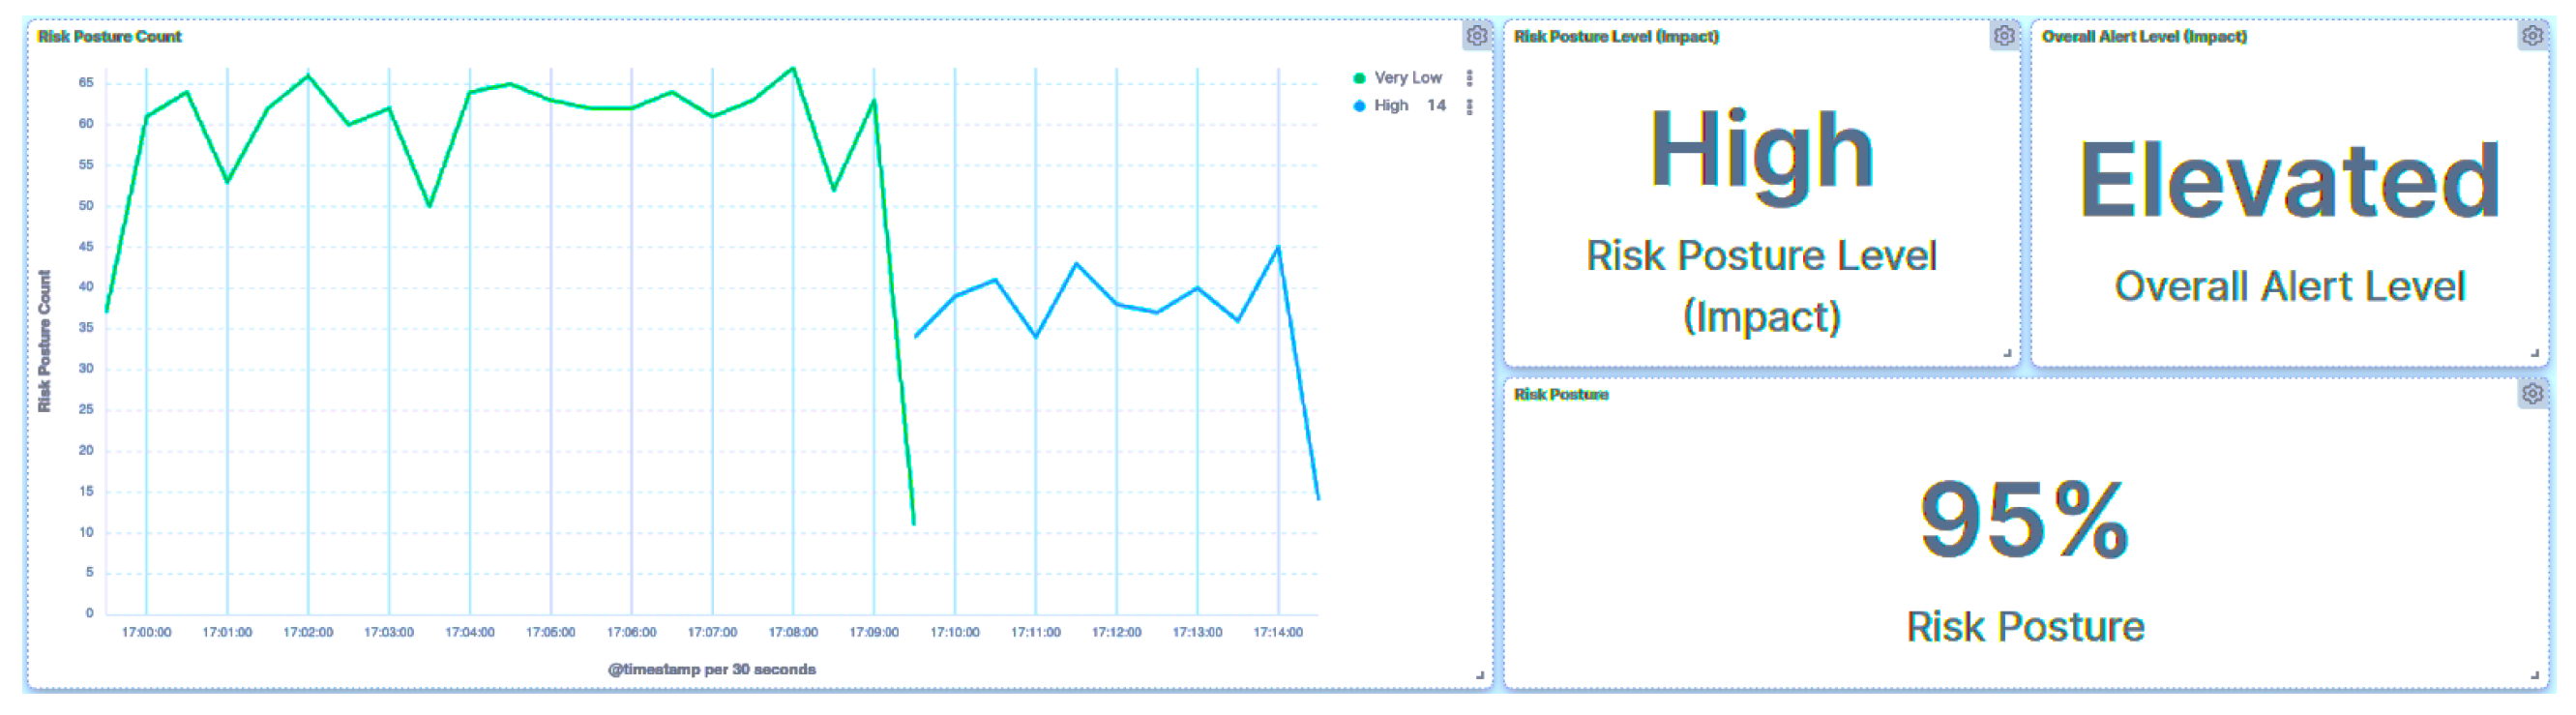
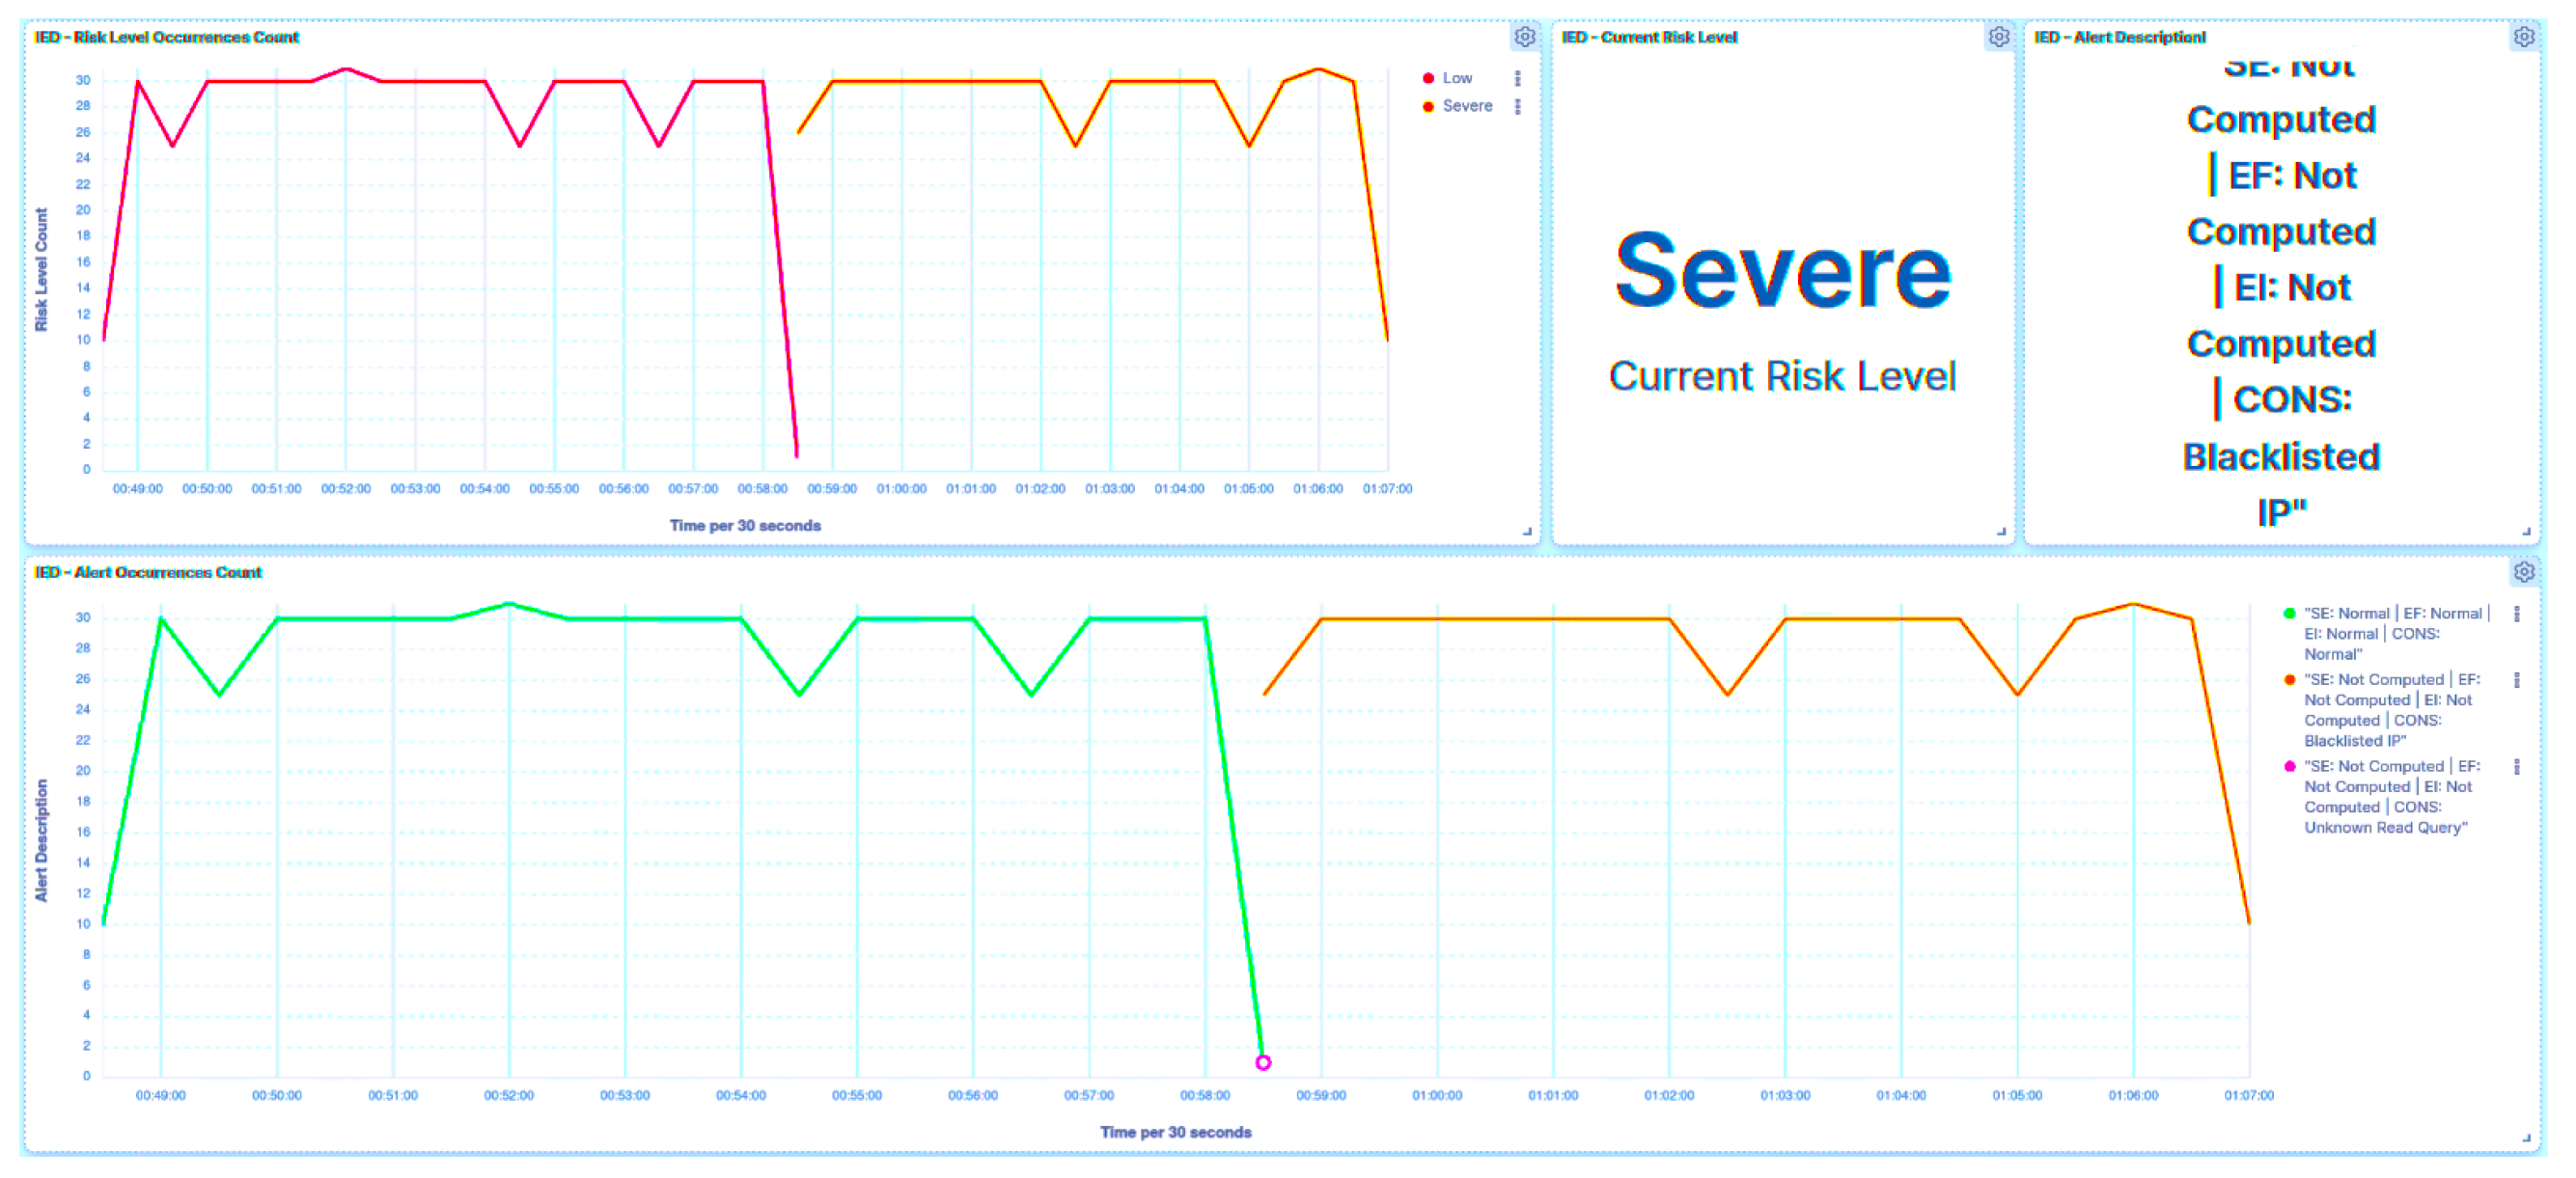
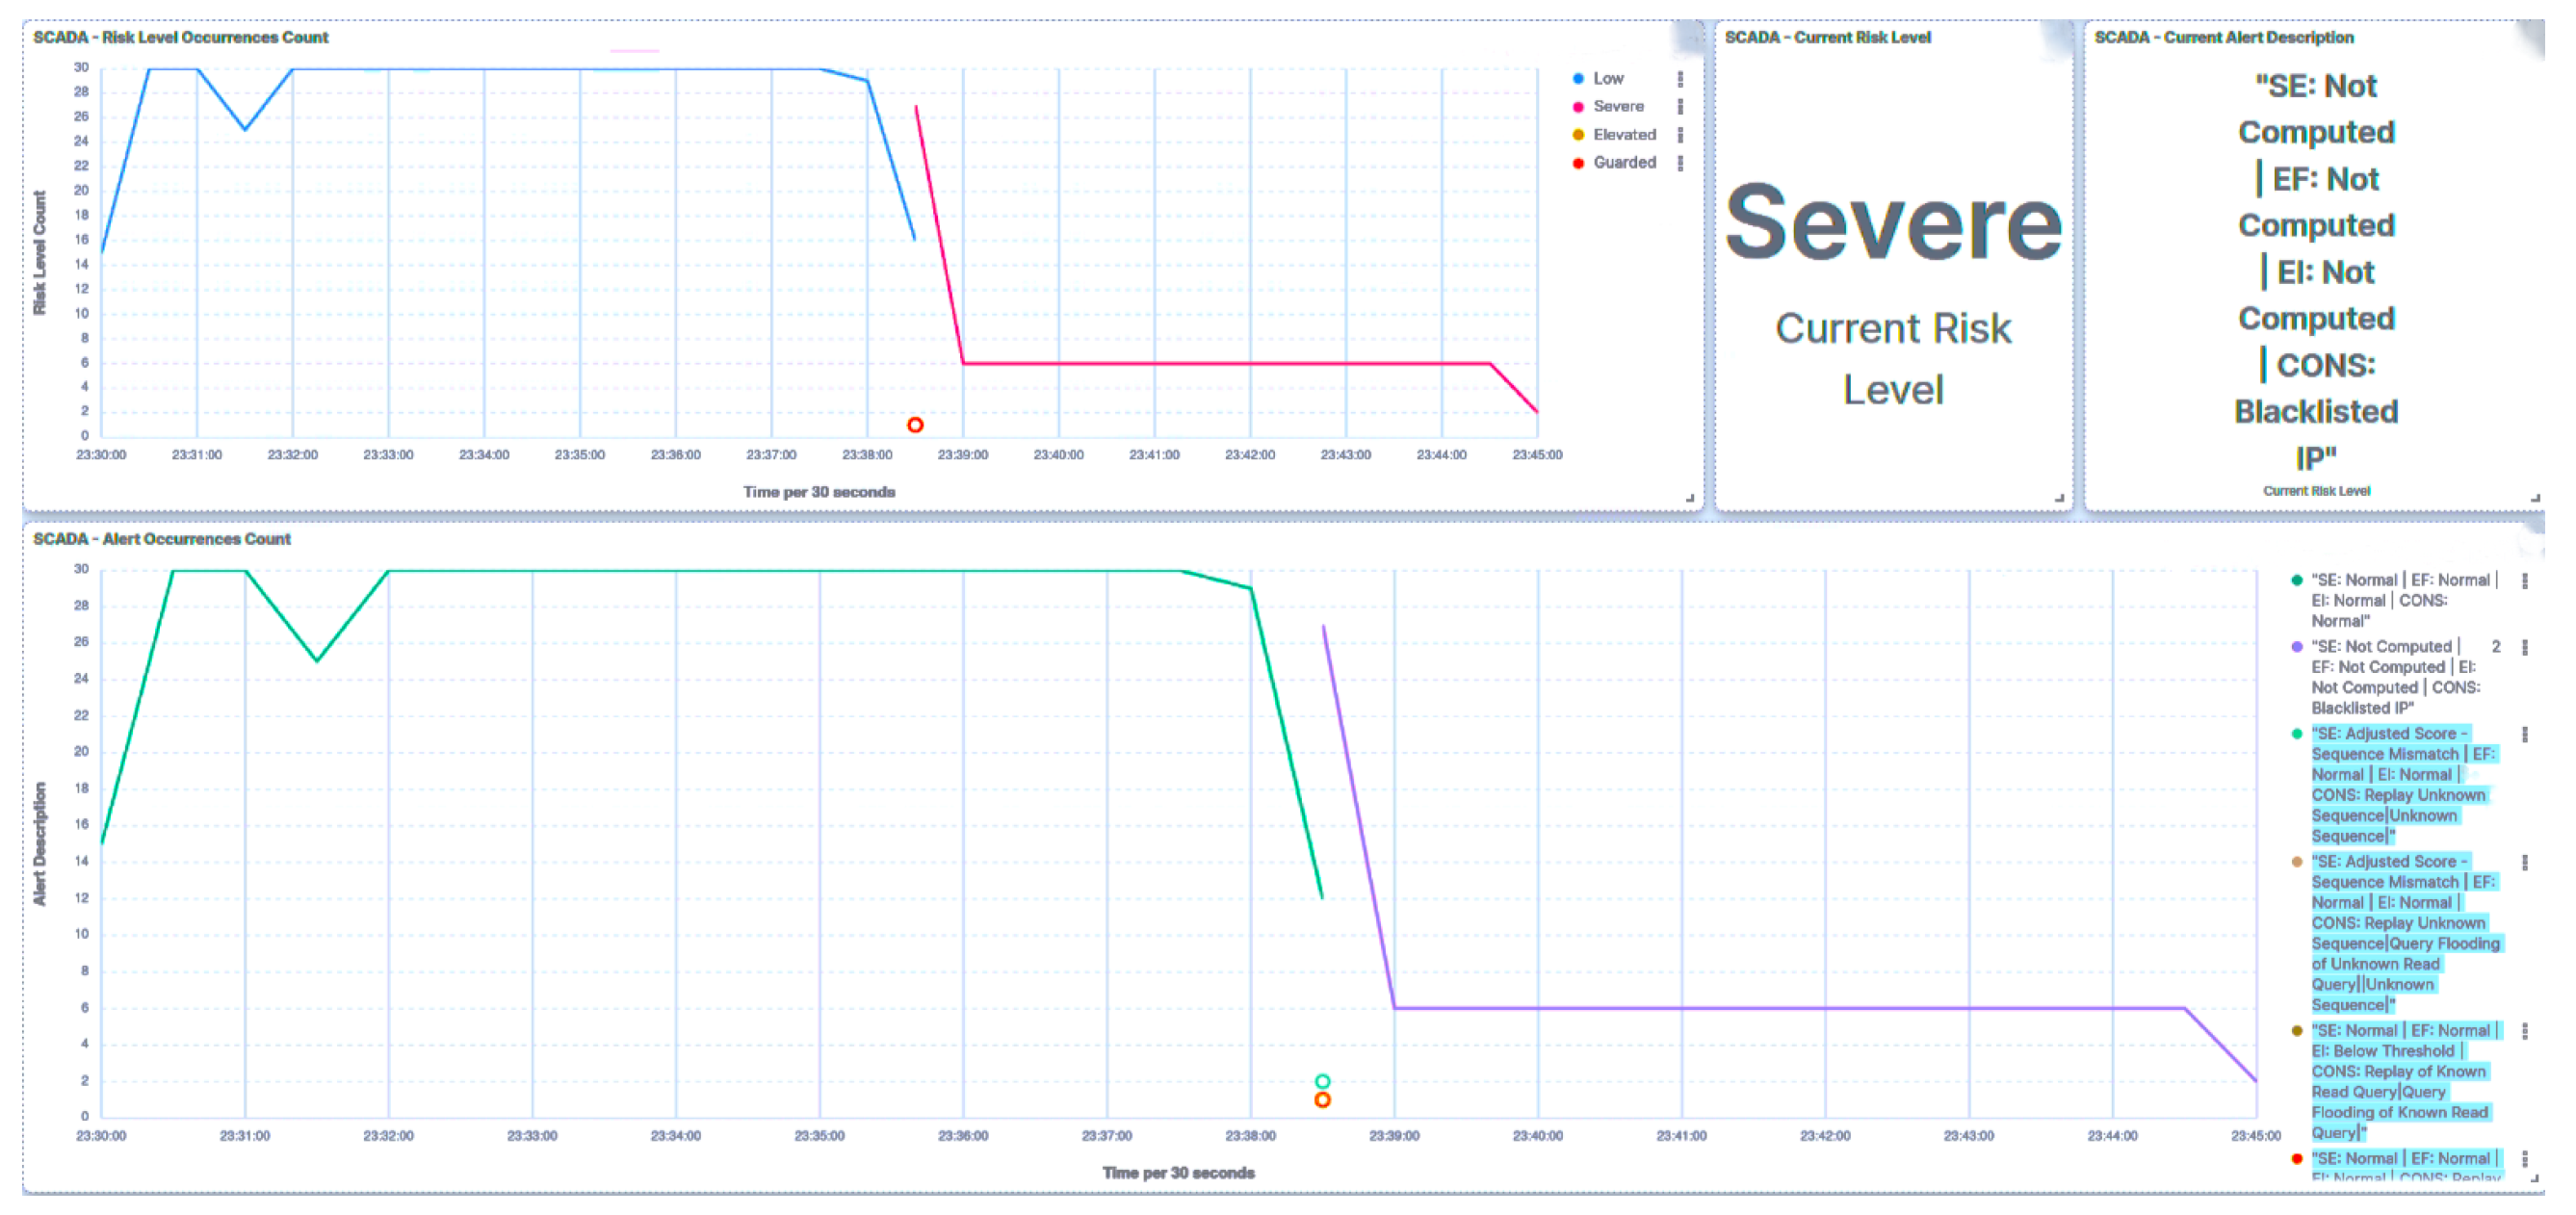
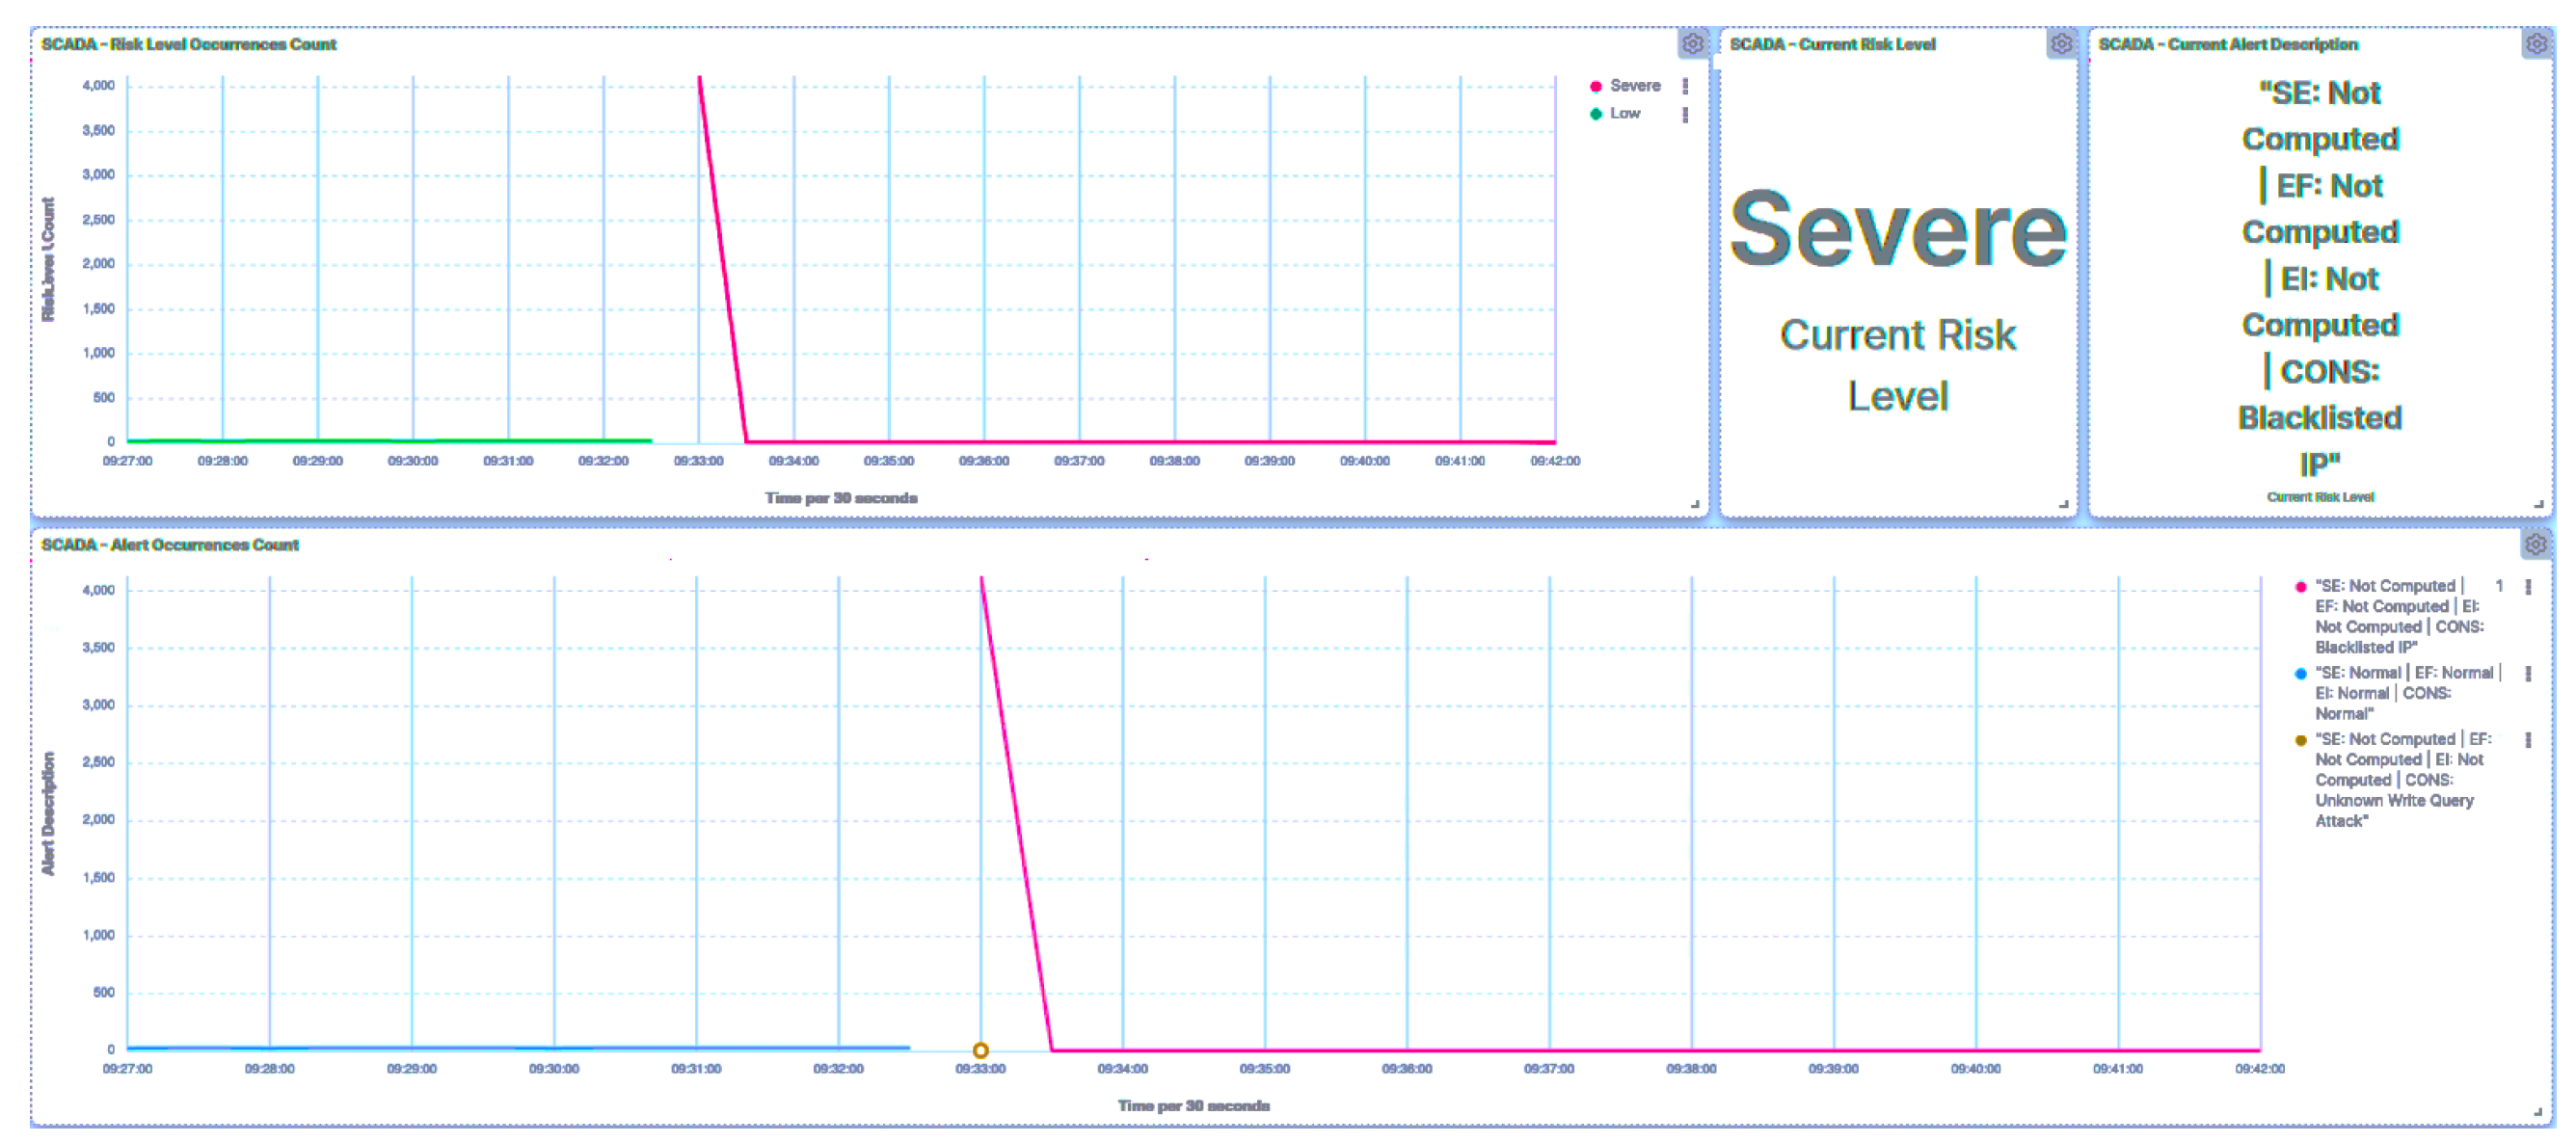
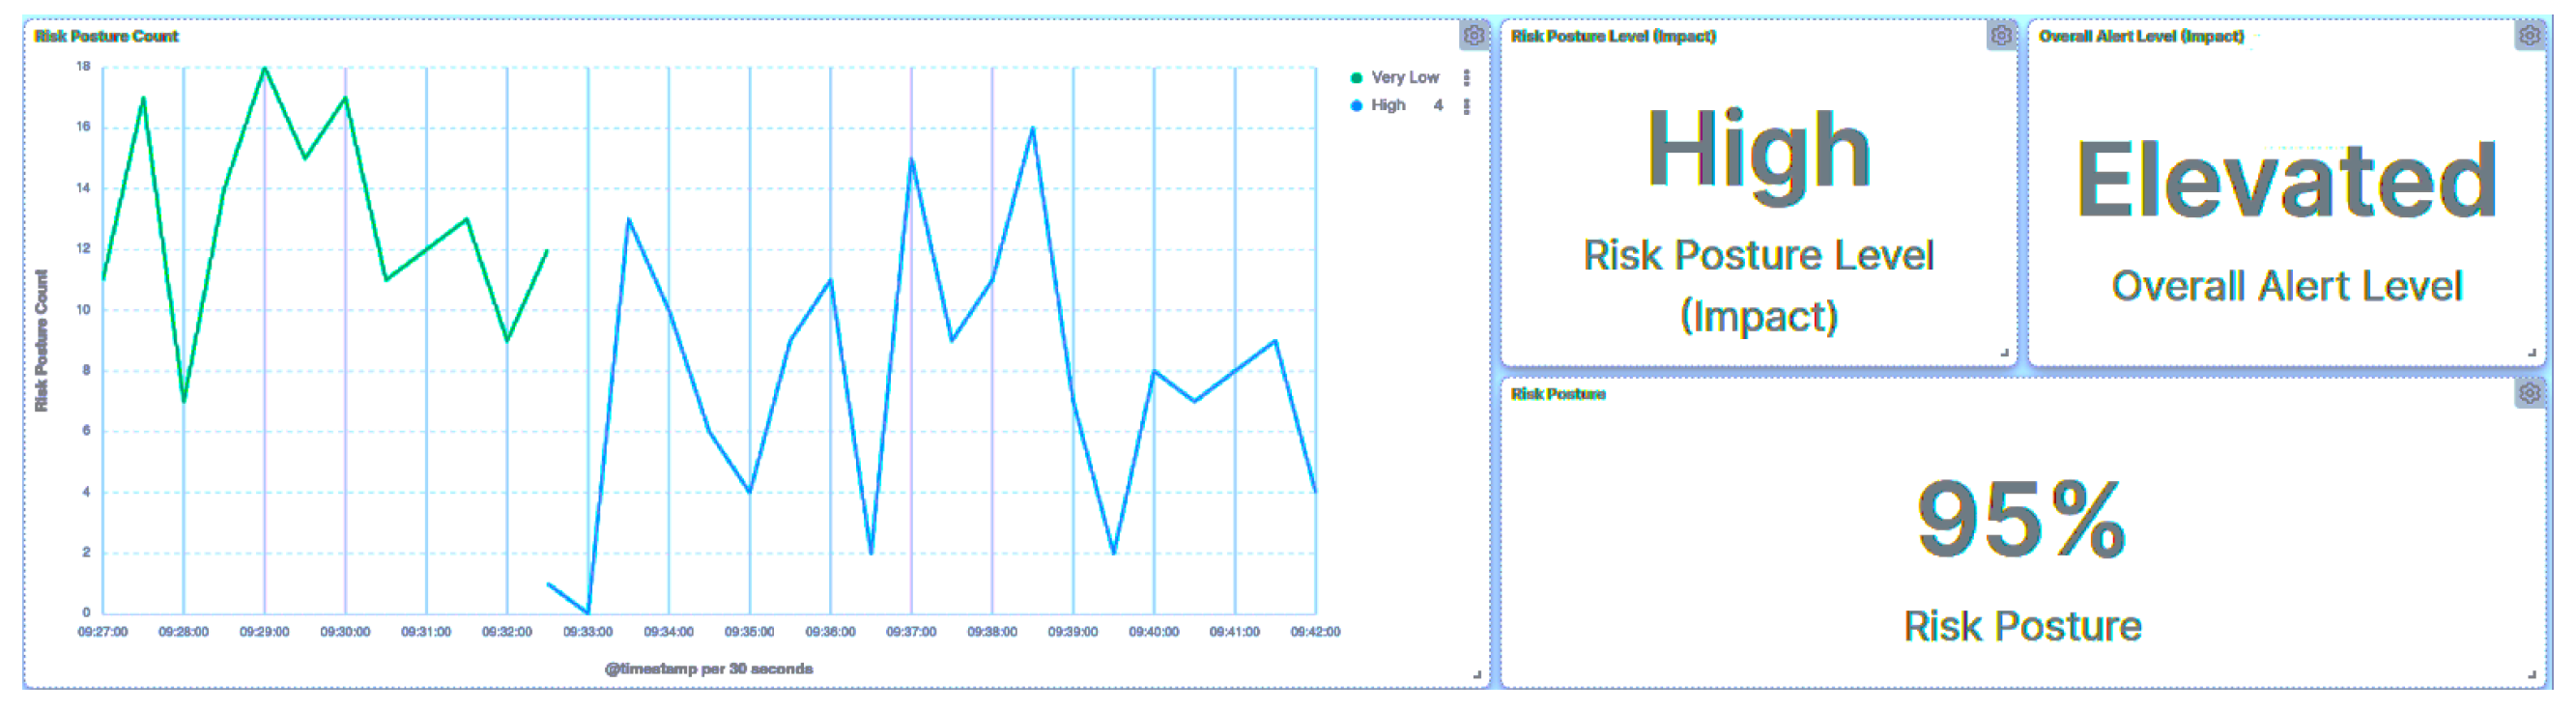
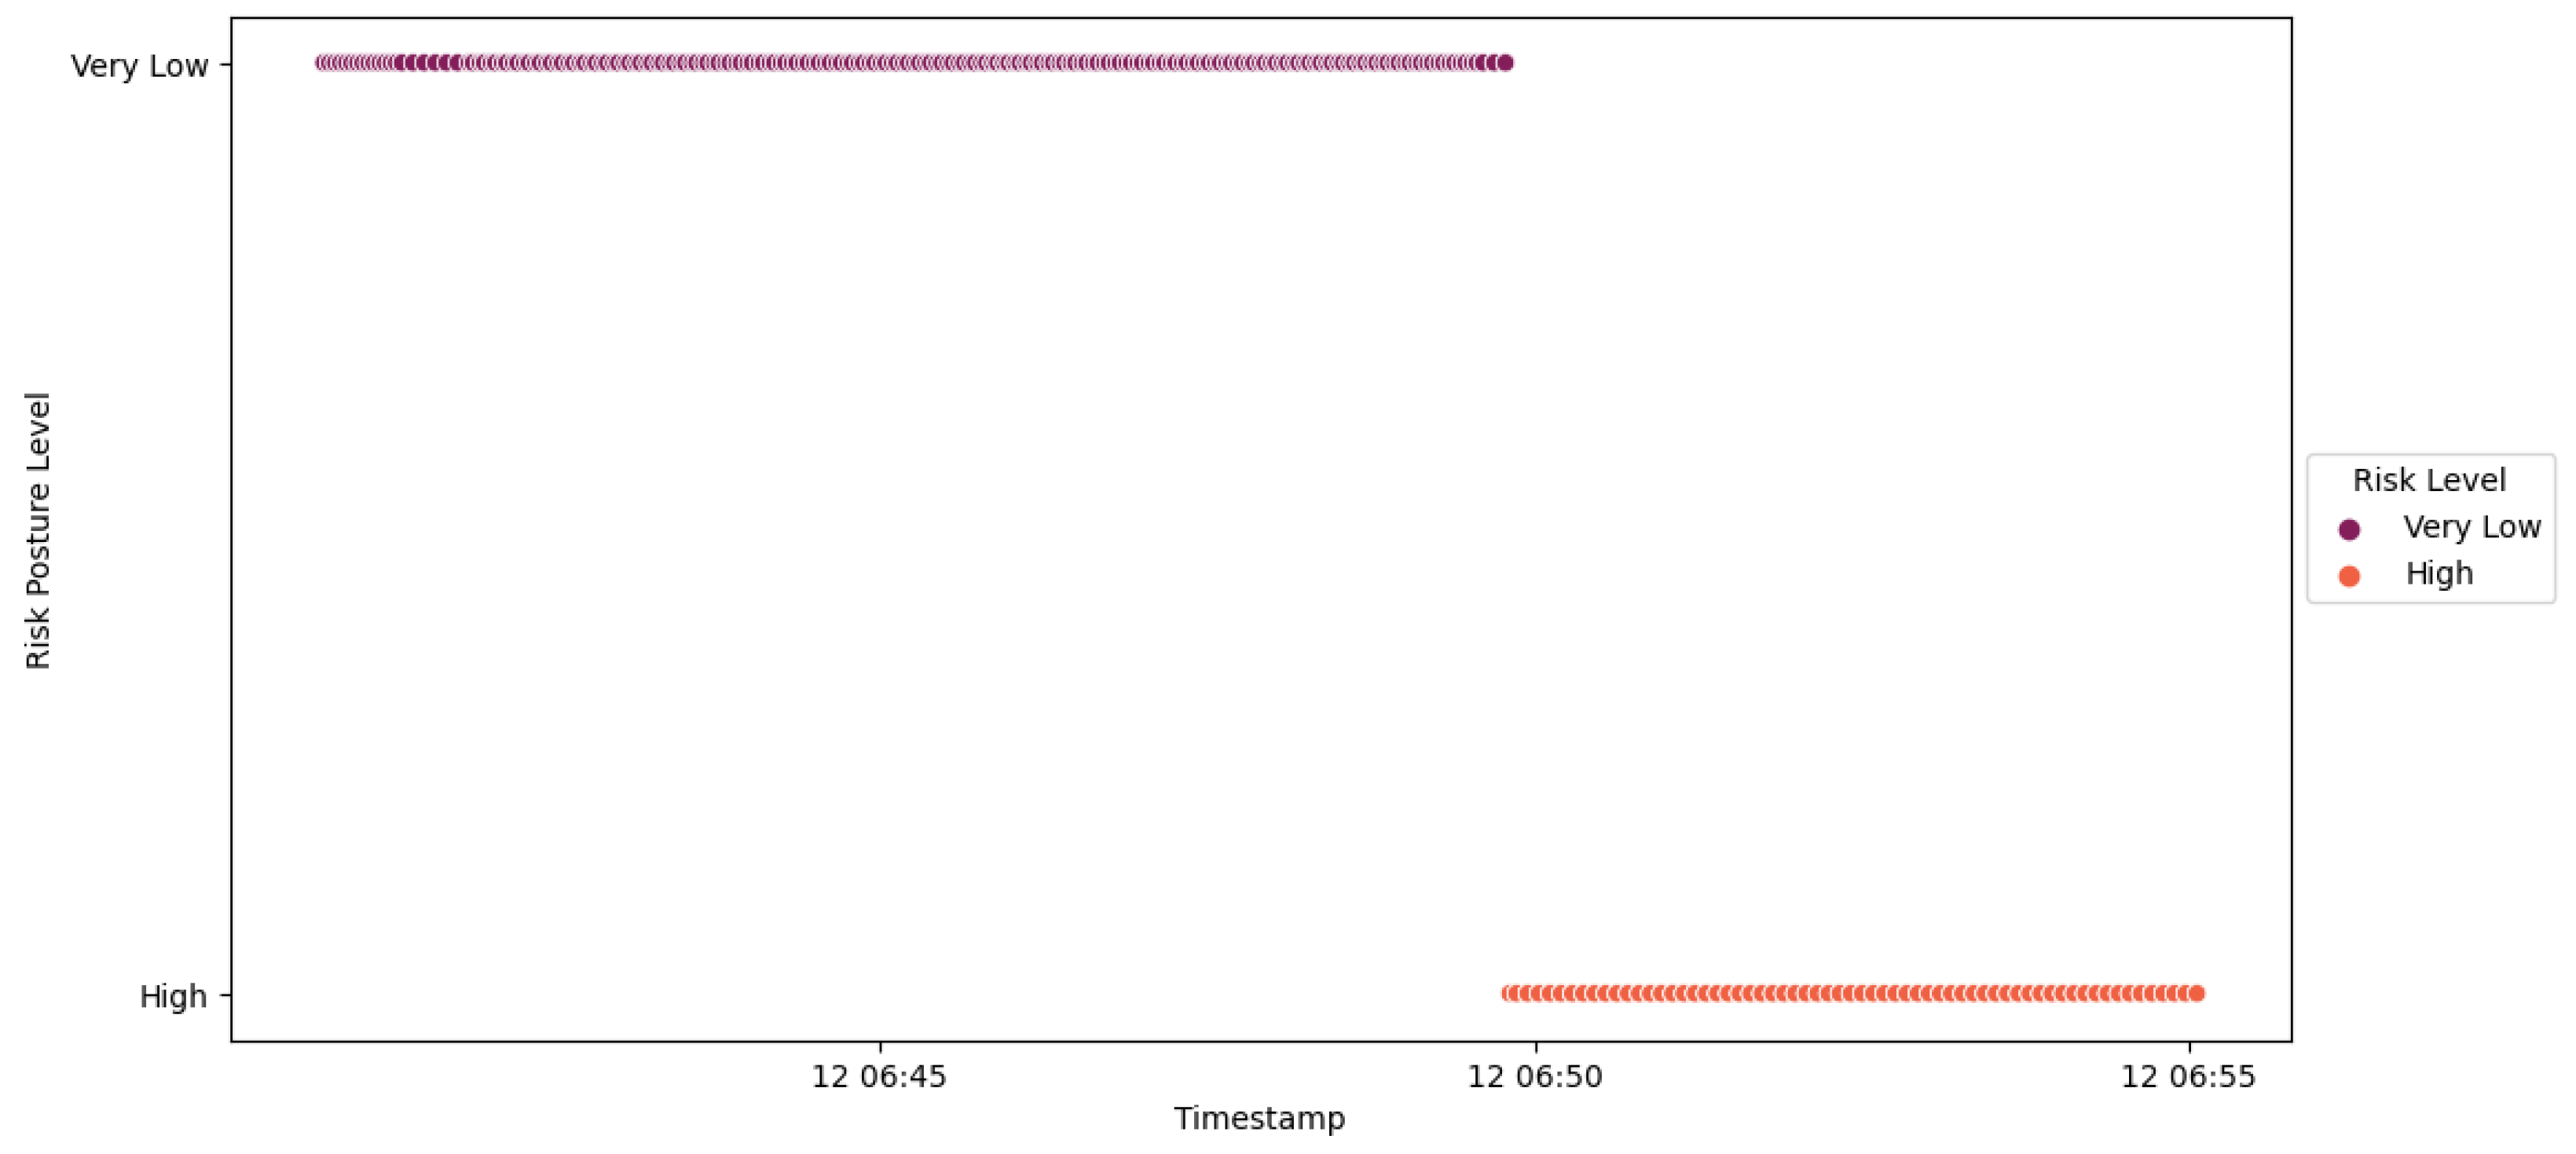
10.2.2. Attack from Compromised SCADA HMI
Automated Collection
Denial of Service
Brute Force I/O
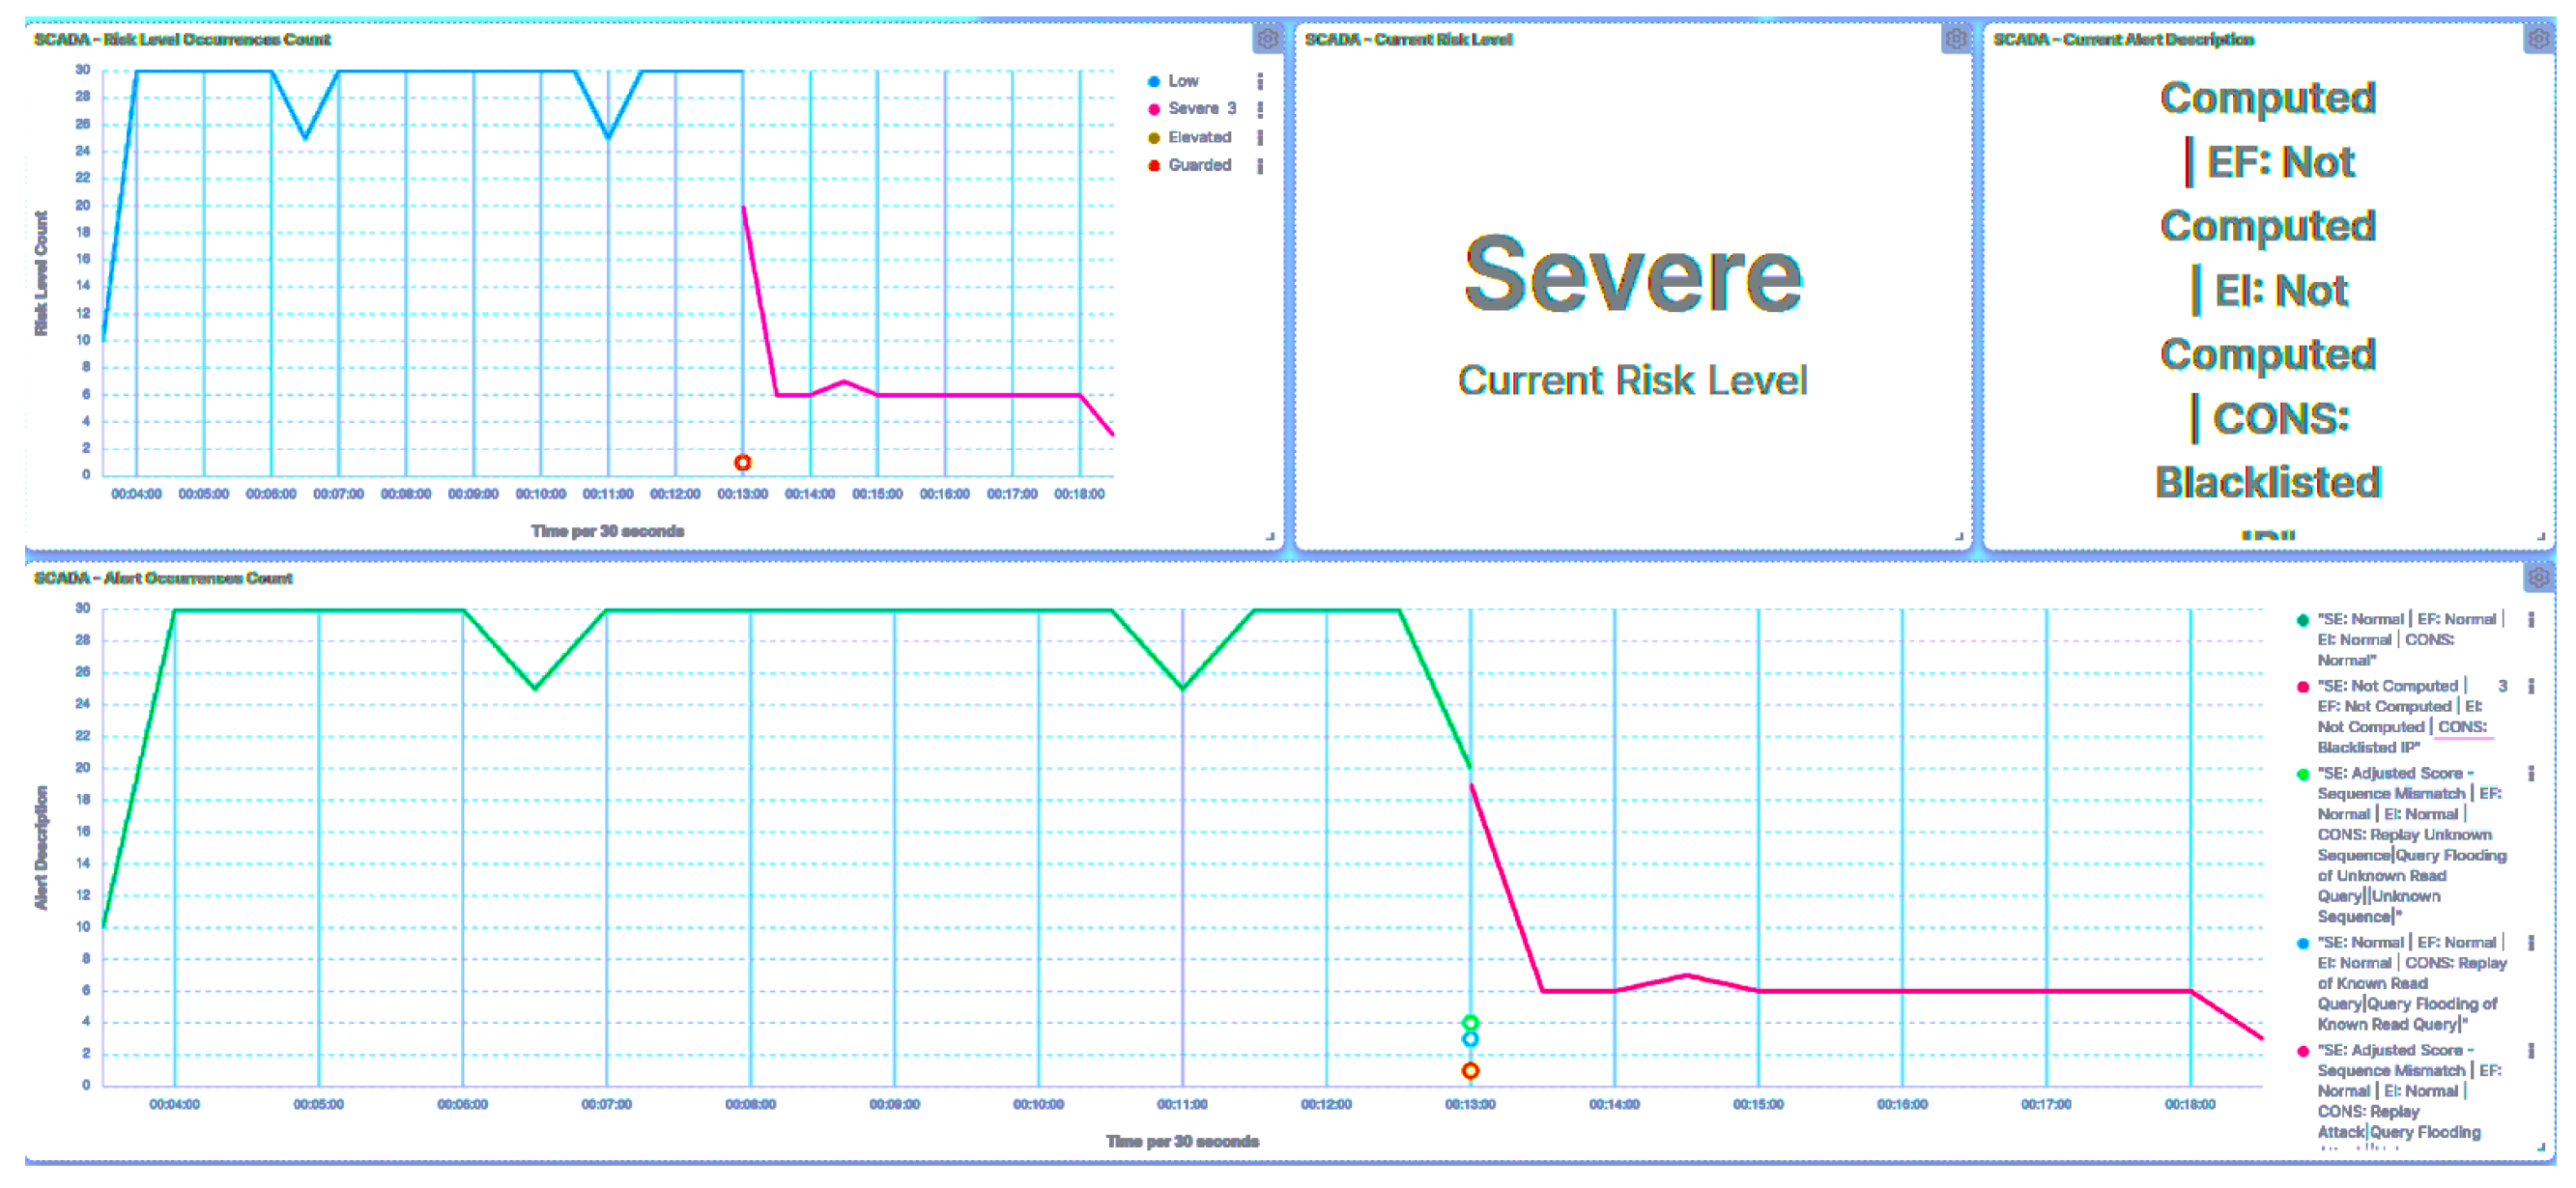
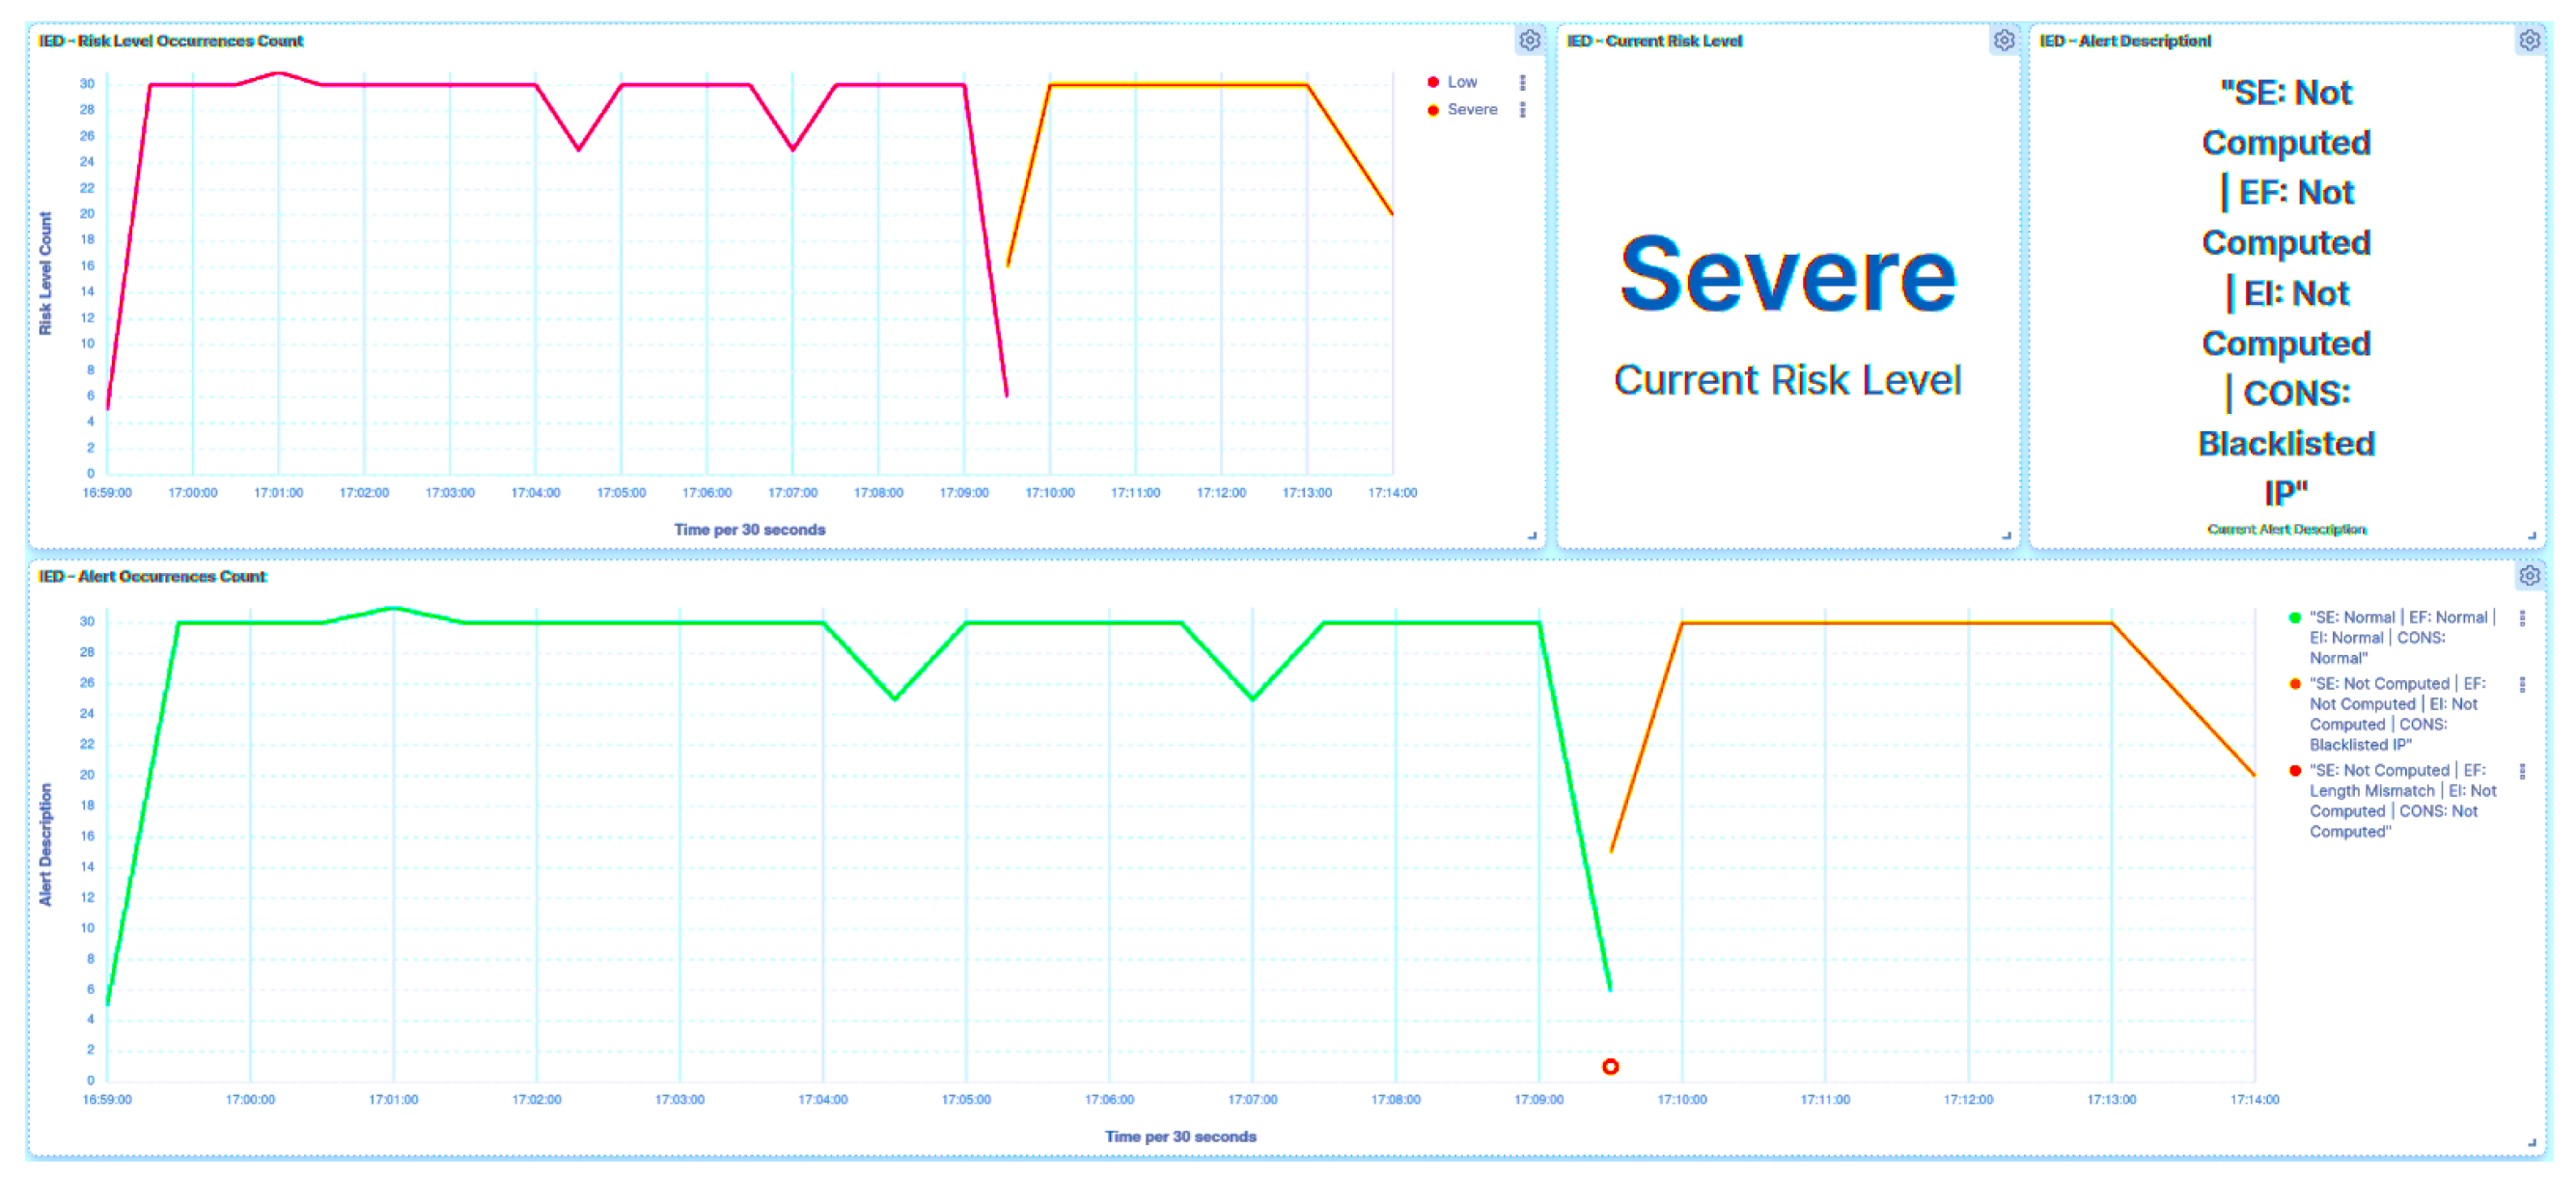
10.2.3. Attack from Compromised IED
Denial of Service
Spoof Reporting Message
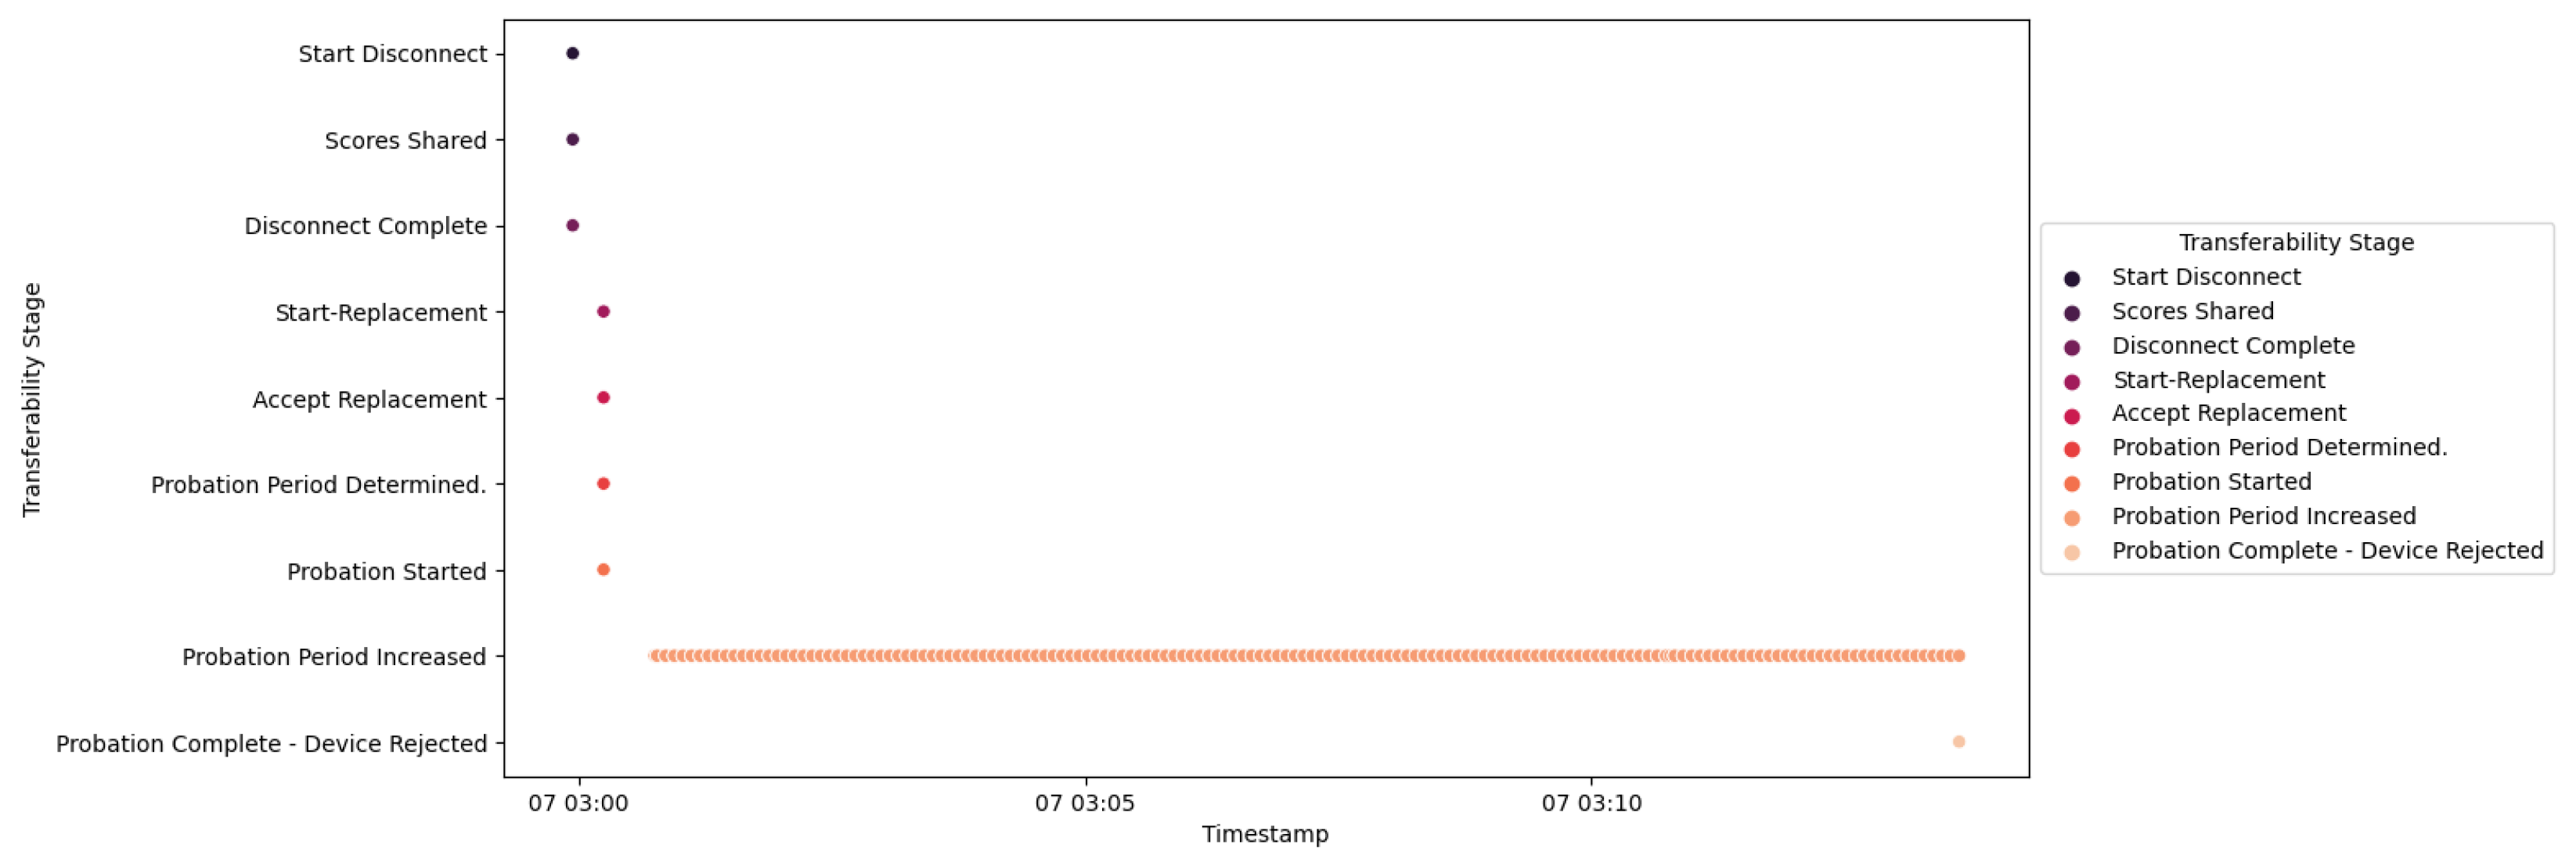
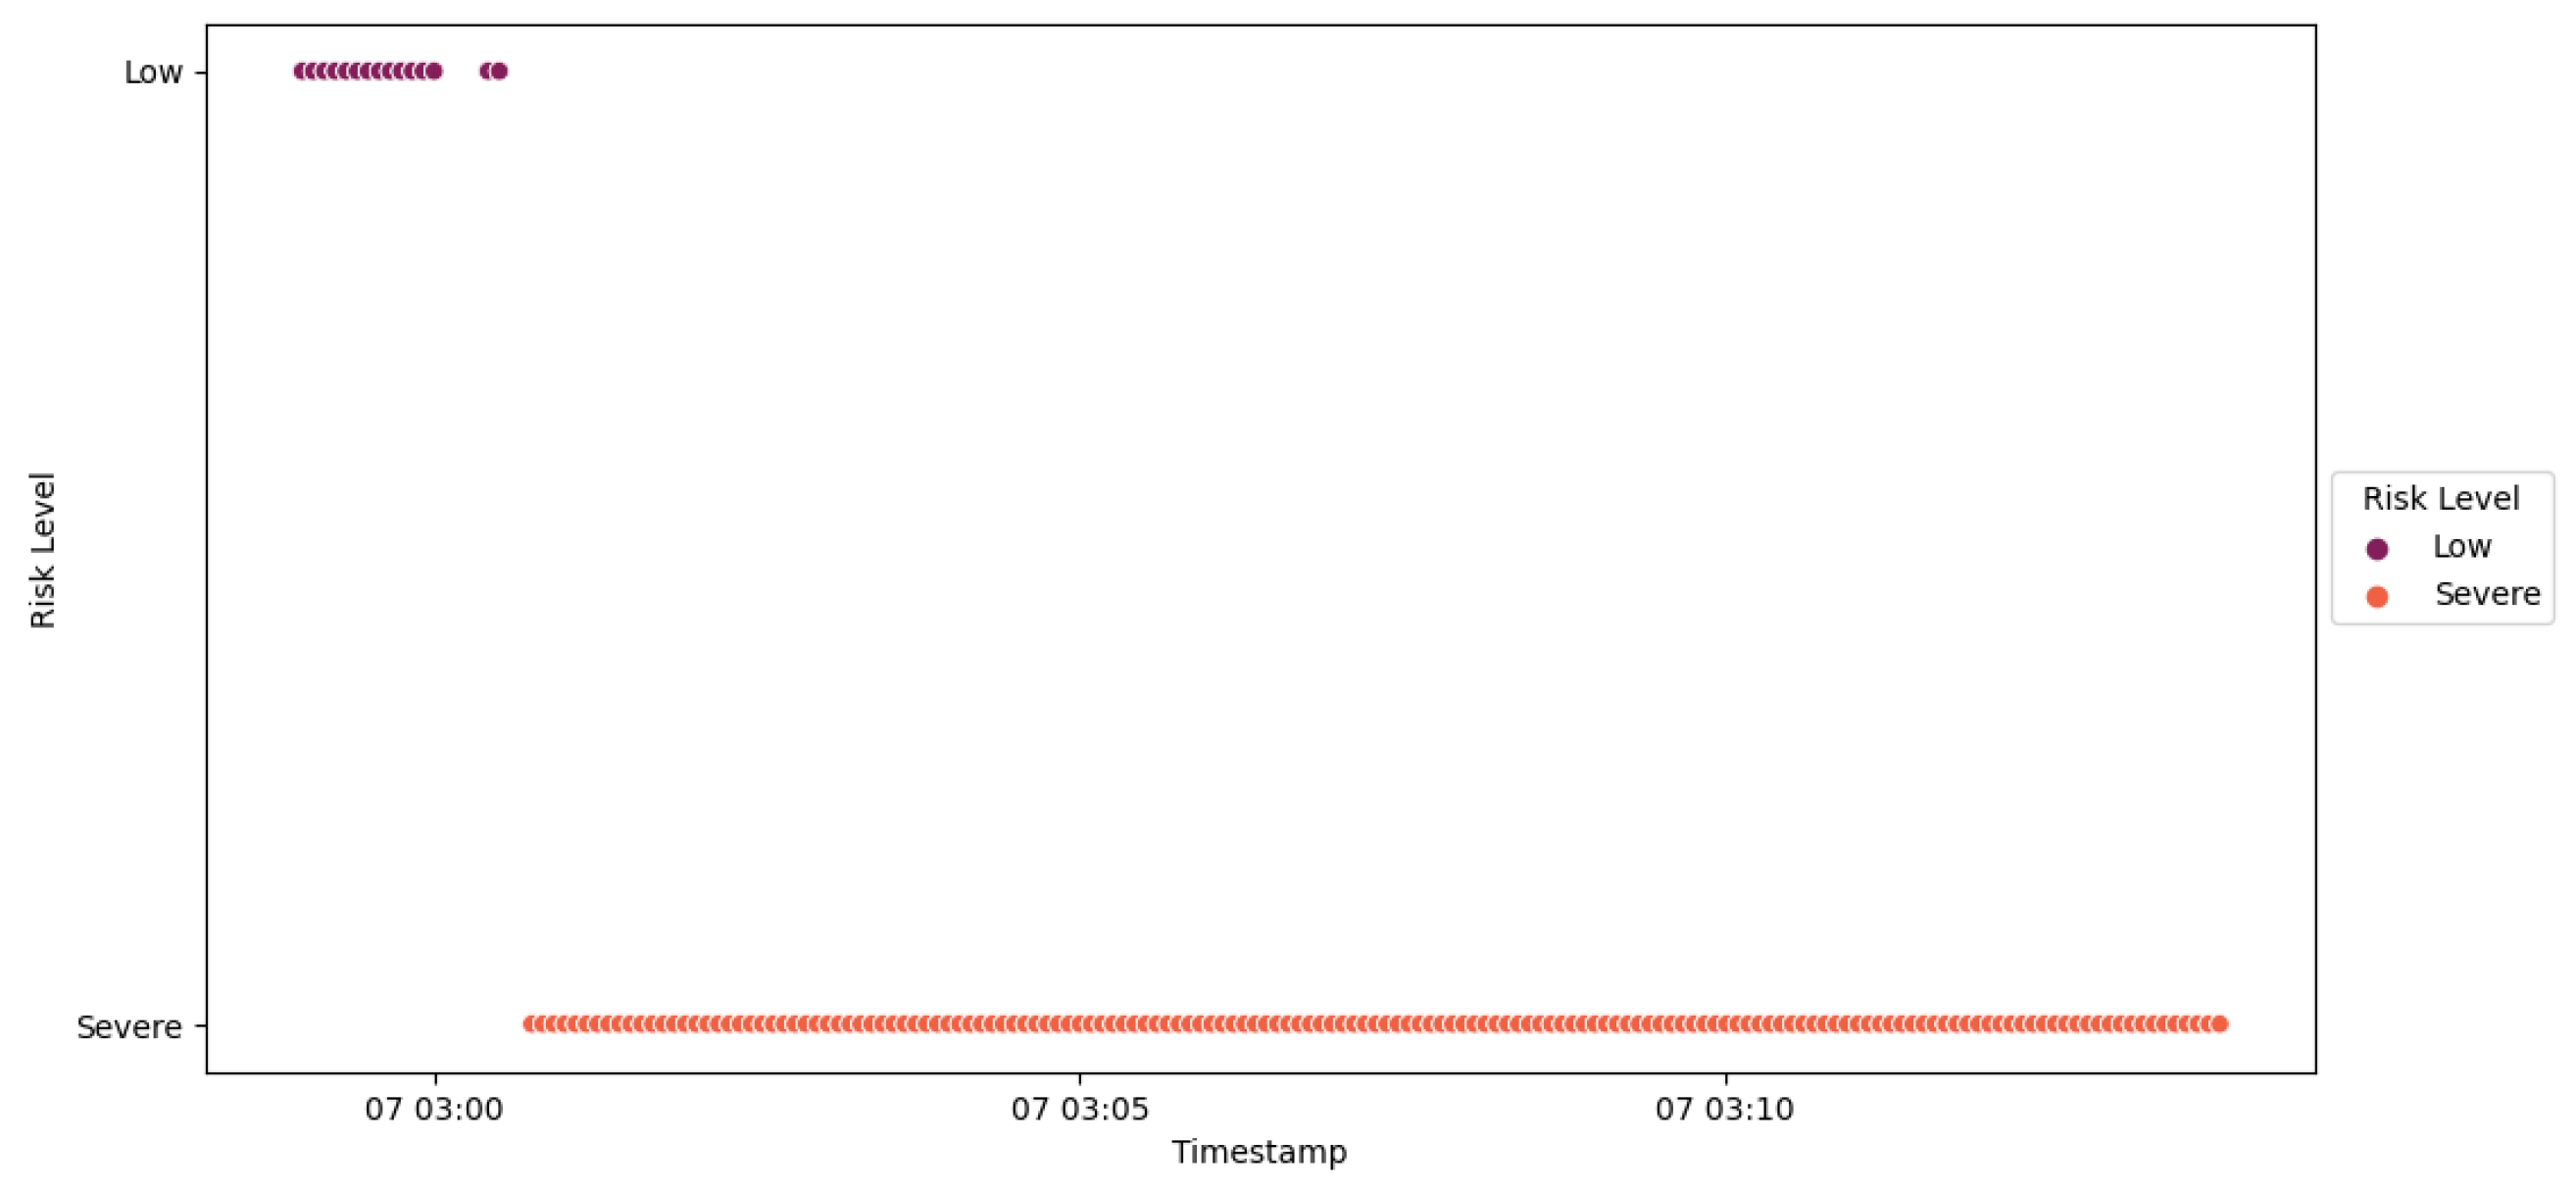
10.3. Transferability
10.3.1. Scenario 1—Good Behavior
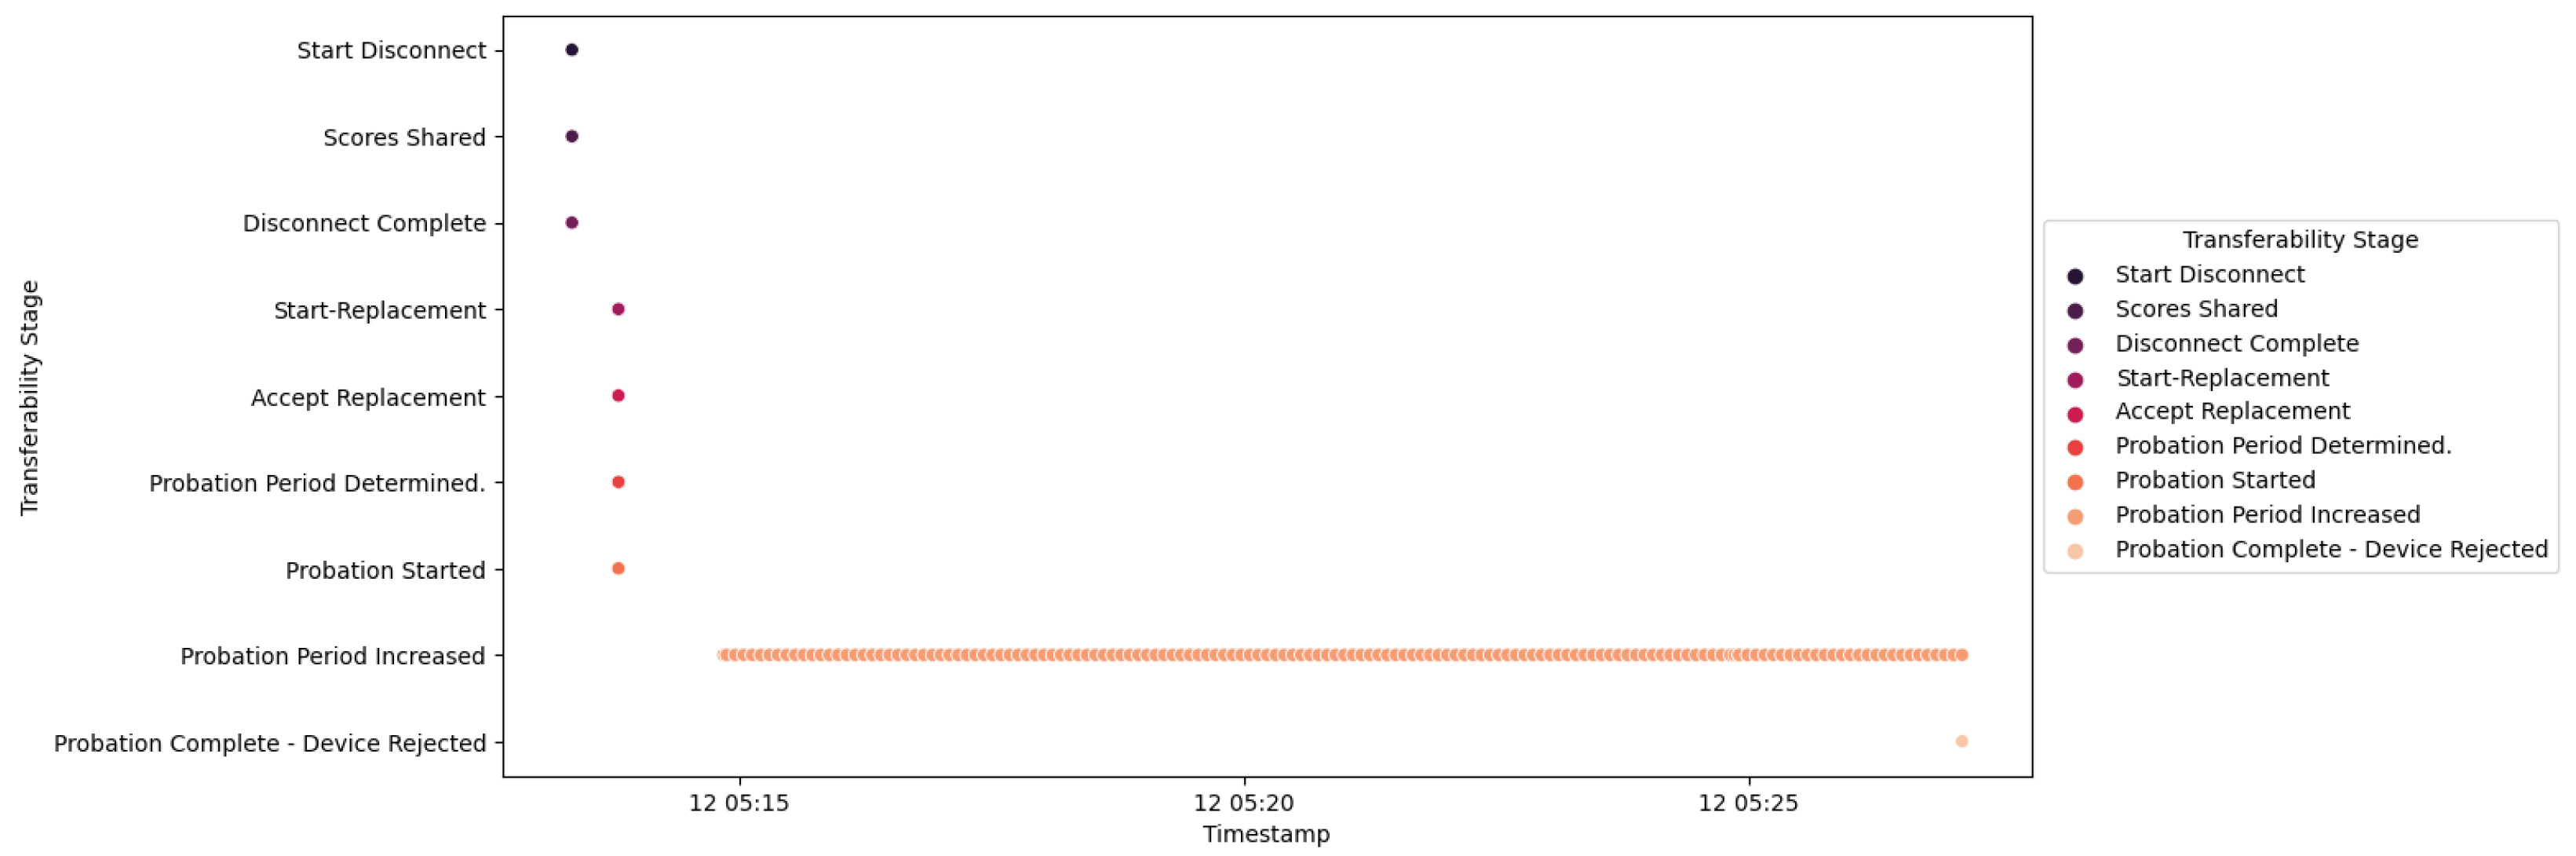
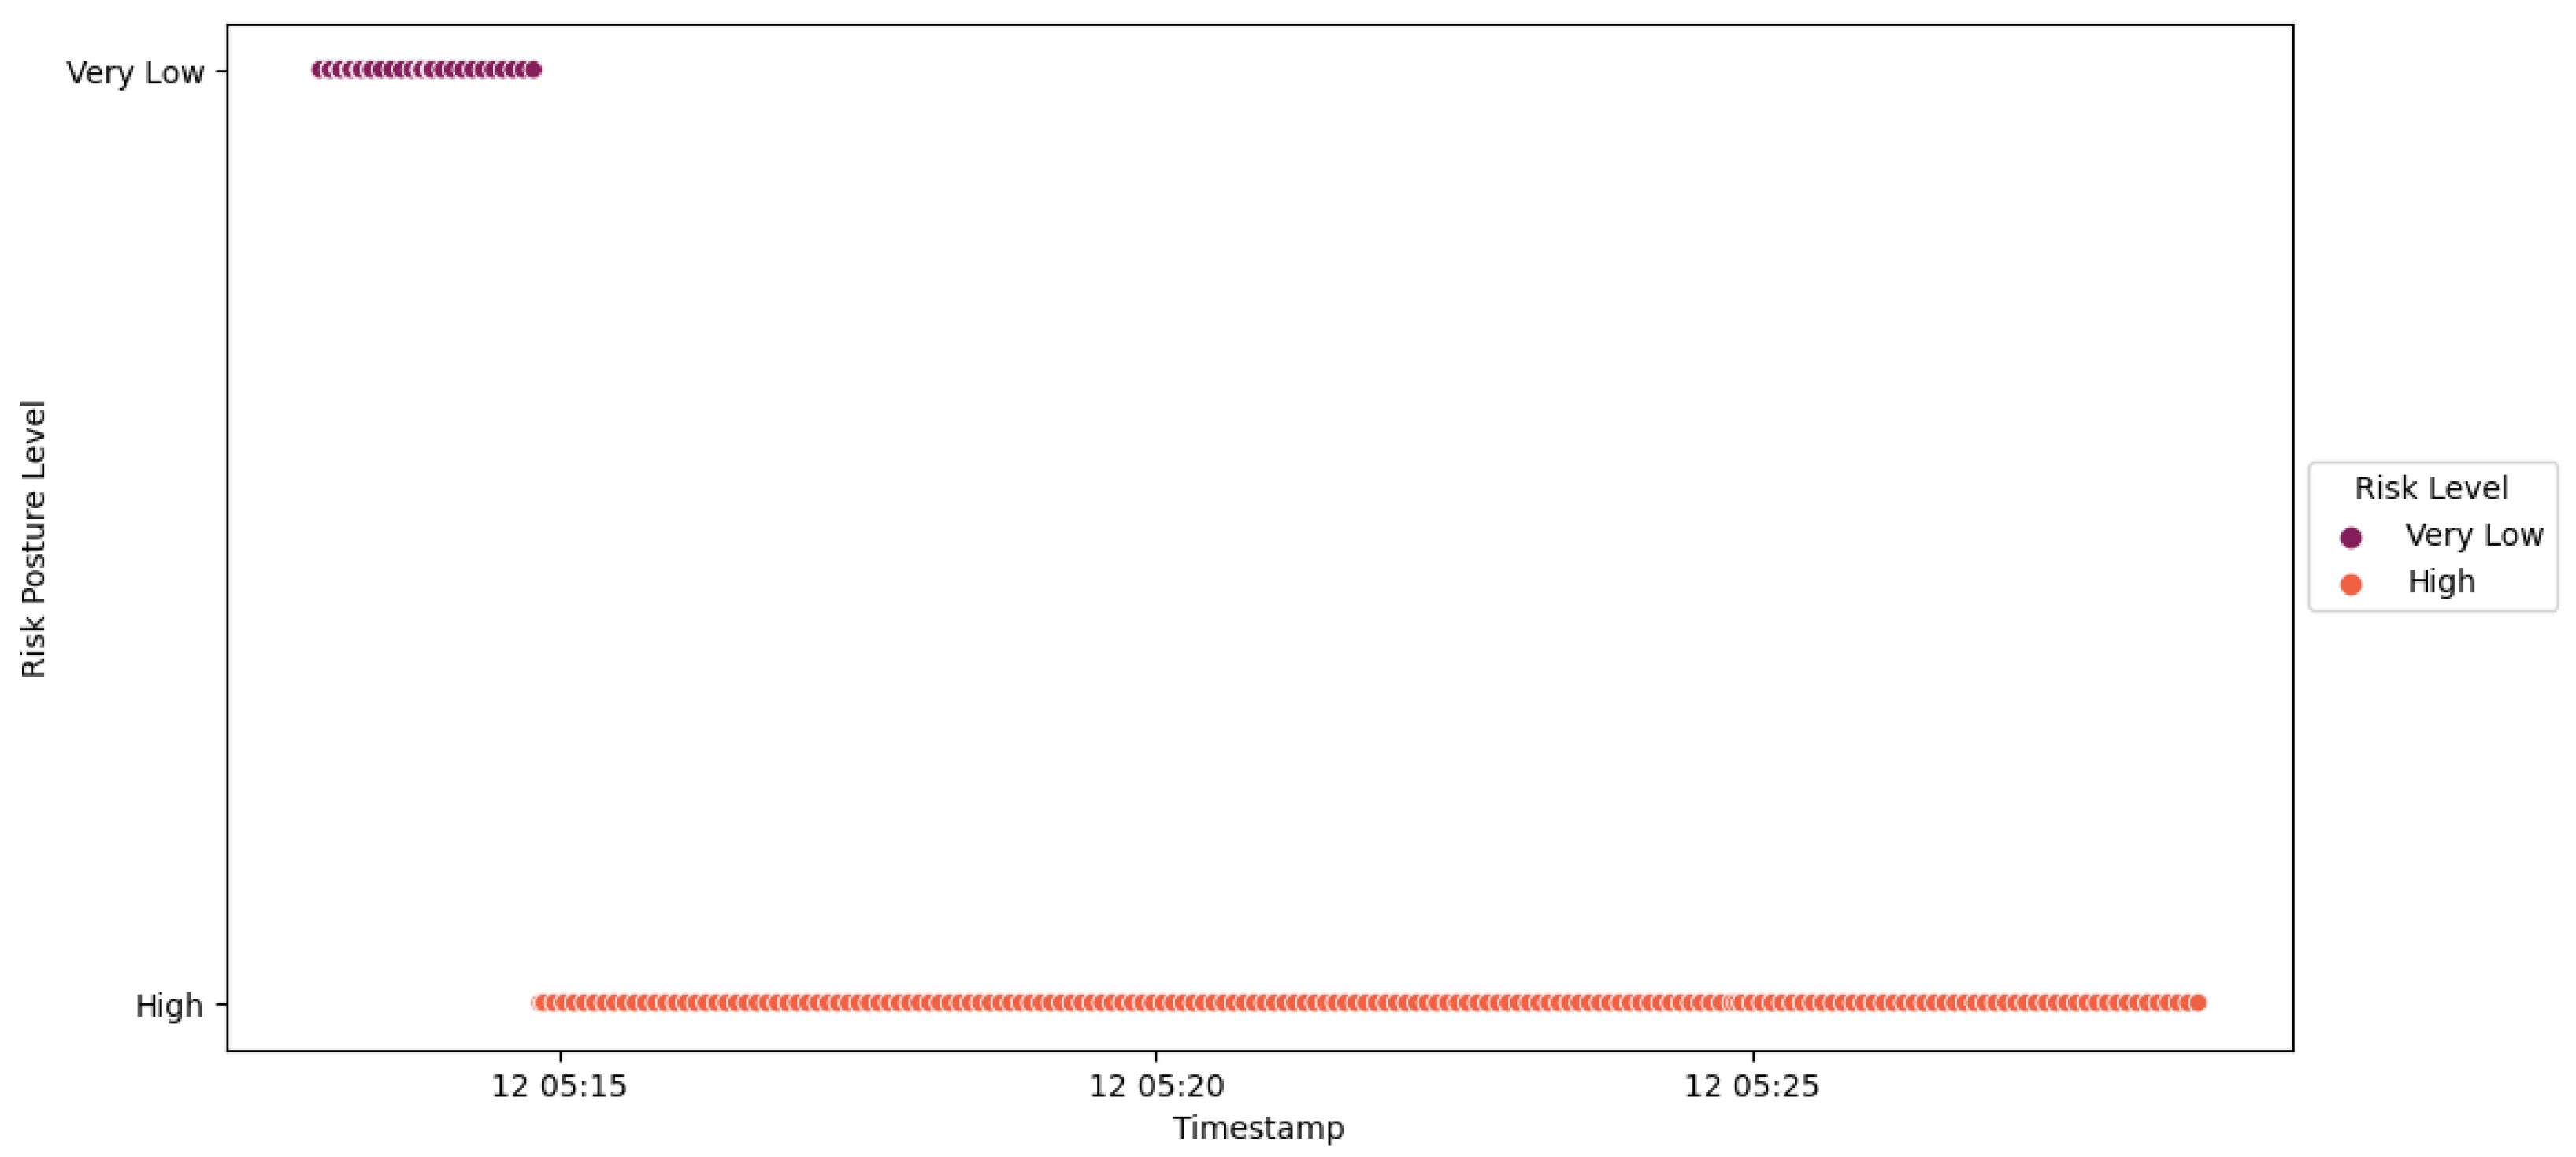
10.3.2. Scenario 2—Misbehavior after Probation Acceptance
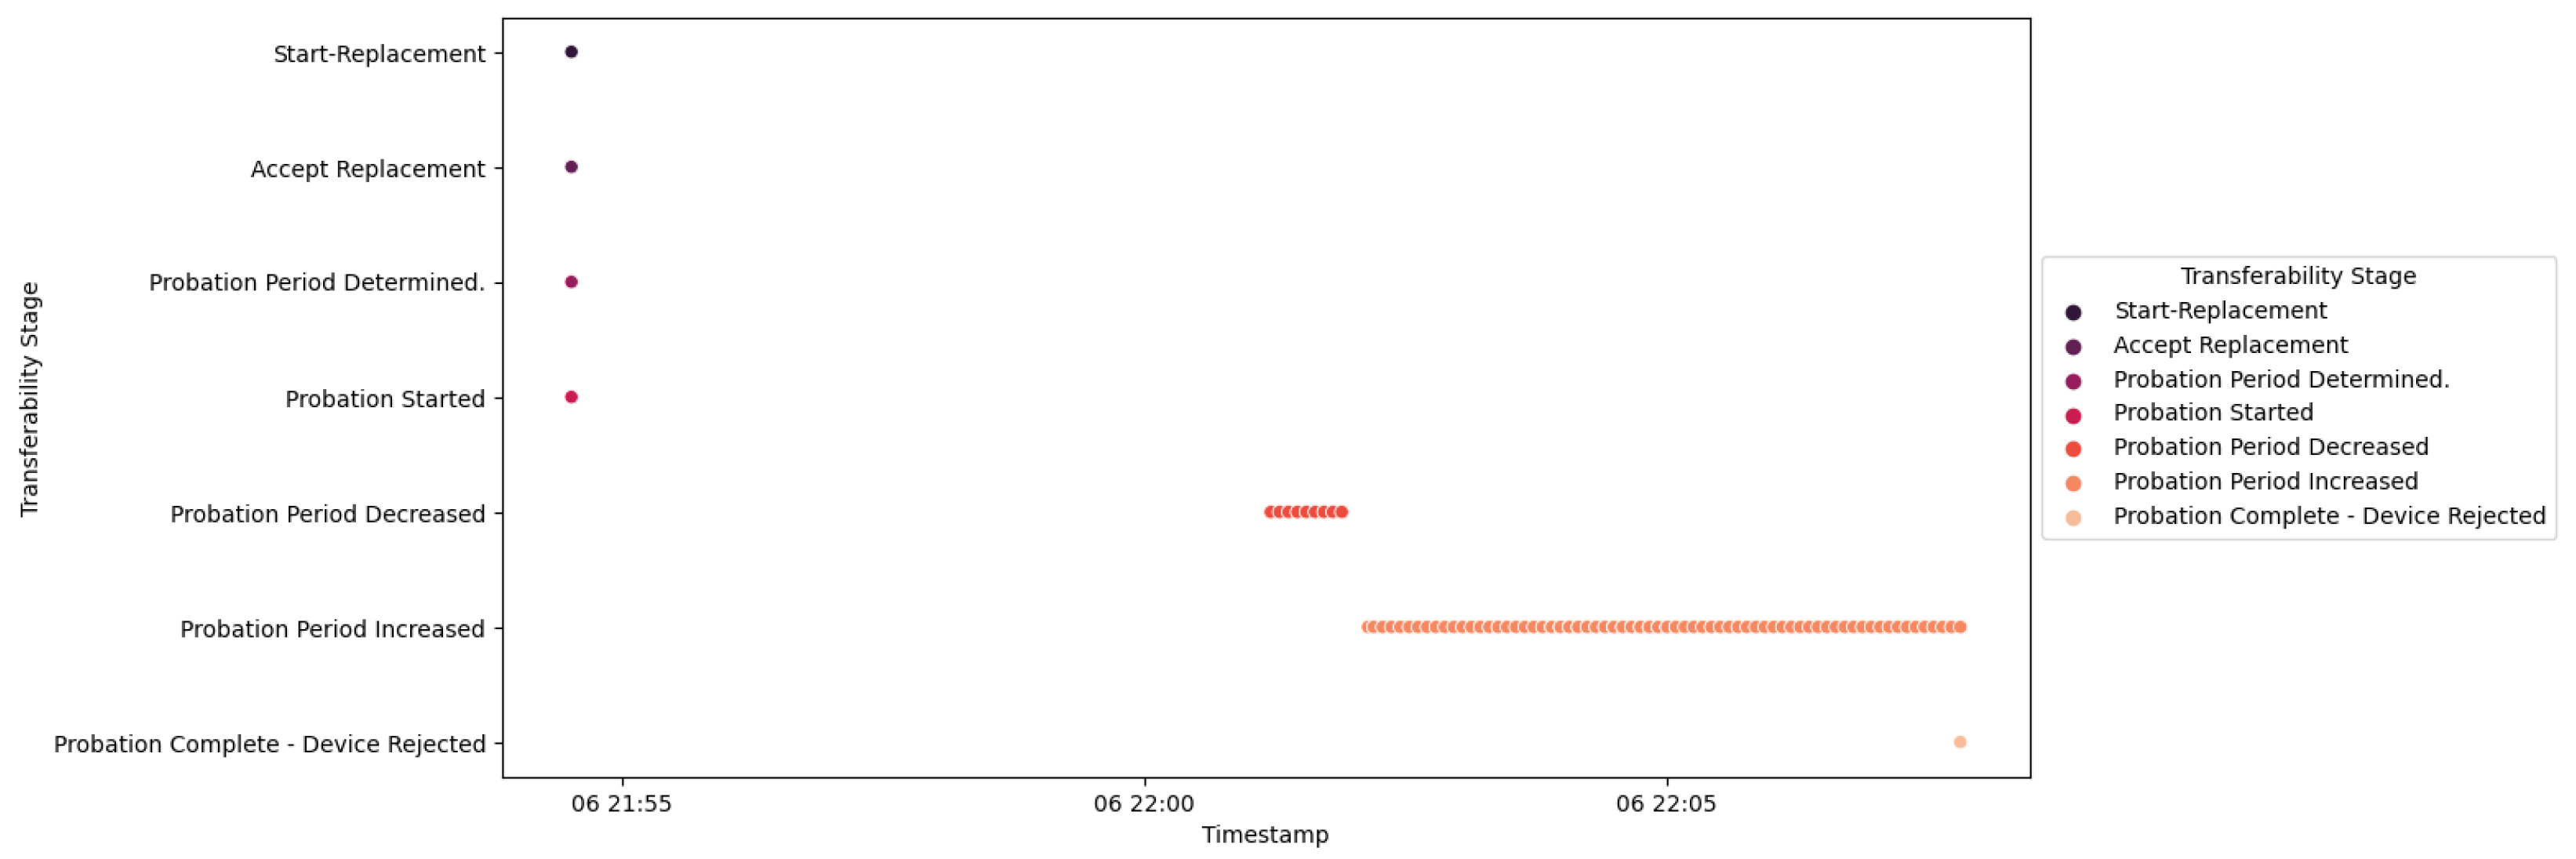
10.3.3. Scenario 3—Misbehavior after Consideration Period
10.3.4. Scenario 4—Unsatisfactory Trust Scores
10.4. Challenges
11. Conclusions and Future Work
Author Contributions
Funding
Institutional Review Board Statement
Informed Consent Statement
Data Availability Statement
Conflicts of Interest
References
- Xu, Z.; Salehi Shahraki, A.; Rudolph, C. Blockchain-Based Malicious Behaviour Management Scheme for Smart Grids. Smart Cities 2023, 6, 3005–3031. [Google Scholar] [CrossRef]
- The Real Story of Stuxnet. Available online: https://spectrum.ieee.org/the-real-story-of-stuxnet (accessed on 11 December 2022).
- Pipedream: Chernovite’s Emerging Malware Targeting Industrial Control Systems. Available online: https://hub.dragos.com/hubfs/116-Whitepapers/Dragos_ChernoviteWP_v2b.pdf?hsLang=en (accessed on 15 February 2023).
- COSMICENERGY: New OT Malware Possibly Related to Russian Emergency Response Exercises. Available online: https://www.mandiant.com/resources/blog/cosmicenergy-ot-malware-russian-response (accessed on 11 December 2022).
- Recommendations Following the Colonial Pipeline Cyber Attack. Available online: https://www.dragos.com/blog/industry-news/recommendations-following-the-colonial-pipeline-cyber-attack/ (accessed on 13 February 2023).
- Lei, H.; Singh, C.; Sprintson, A. Reliability modeling and analysis of IEC 61850 based substation protection systems. IEEE Trans. Smart Grid 2014, 5, 2194–2202. [Google Scholar] [CrossRef]
- Requirements for IDS in Substations. Available online: https://electrical-engineering-portal.com/improving-cybersecurity-substations-intrusion-detection#requirements-ids-substations (accessed on 22 December 2022).
- A Researcher’s Perspective on the North American Protective Relay Marketplace. Available online: https://www.tdworld.com/test-and-measurement/article/20972654/a-researchers-perspective-on-the-north-american-protective-relay-marketplace/ (accessed on 1 February 2023).
- The Worldwide Study of the Protective Relay Marketplace in Electric Utilities: 2019–2022. Available online: https://www.newton-evans.com/product/the-worldwide-study-of-the-protective-relay-marketplace-in-electric-utilities-2019-2022/ (accessed on 13 February 2023).
- Cook, K. Trust in Society; Russell Sage Foundation Series on Trust; Russell Sage Foundation: New York, NY, USA, 2003; Volume 2, p. 432. [Google Scholar]
- Gambetta, D. Can we trust trust. In Trust: Making and Breaking Cooperative Relations; Blackwell: Oxford, UK, 2000; Volume 13, pp. 213–237. [Google Scholar]
- Rousseau, D.M.; Sitkin, S.B.; Burt, R.S.; Camerer, C. Not so different after all: A cross-discipline view of trust. Acad. Manag. Rev. 1998, 23, 393–404. [Google Scholar] [CrossRef]
- Boakye-Boateng, K.; Ghorbani, A.A.; Lashkari, A.H. A novel trust model in detecting final-phase attacks in substations. In Proceedings of the 2021 18th International Conference on Privacy, Security and Trust (PST), Auckland, New Zealand, 13–15 December 2021; pp. 1–11. [Google Scholar]
- Boakye-Boateng, K.; Ghorbani, A.A.; Lashkari, A.H. A Trust-Influenced Smart Grid: A Survey and a Proposal. J. Sens. Actuator Netw. 2022, 11, 34. [Google Scholar] [CrossRef]
- Borowski, J.F.; Hopkinson, K.M.; Humphries, J.W.; Borghetti, B.J. Reputation-based trust for a cooperative agent-based backup protection scheme. IEEE Trans. Smart Grid 2011, 2, 287–301. [Google Scholar] [CrossRef]
- Fadul, J.E.; Hopkinson, K.M.; Andel, T.R.; Sheffield, C.A. A trust-management toolkit for smart-grid protection systems. IEEE Trans. Power Deliv. 2013, 29, 1768–1779. [Google Scholar] [CrossRef]
- Qureshi, K.N.; ul Islam, M.N.; Jeon, G. A trust evaluation model for secure data aggregation in smart grids infrastructures for smart cities. J. Ambient Intell. Smart Environ. 2021, 13, 235–252. [Google Scholar] [CrossRef]
- Wang, J.; Zhang, Z.; Wang, M. A Trust Management Method against Abnormal Behavior of Industrial Control Networks under Active Defense Architecture. IEEE Trans. Netw. Serv. Manag. 2022, 19, 2549–2572. [Google Scholar] [CrossRef]
- Boakye-Boateng, K.; Ghorbani, A.A.; Lashkari, A. Securing Substations with Trust, Risk Posture, and Multi-Agent Systems: A Comprehensive Approach. In Proceedings of the 2023 20th Annual International Conference on Privacy, Security and Trust (PST), Copenhagen, Denmark, 21–23 August 2023; pp. 1–12. [Google Scholar] [CrossRef]
- Bellifemine, F.L.; Caire, G.; Greenwood, D. Developing Multi-Agent Systems with JADE; John Wiley & Sons: Hoboken, NJ, USA, 2007; Volume 7. [Google Scholar]
- Wang, P.; Govindarasu, M. Multi-Agent Based Attack-Resilient System Integrity Protection for Smart Grid. IEEE Trans. Smart Grid 2020, 11, 3447–3456. [Google Scholar] [CrossRef]
- Mohamed, A.A.R.; Omran, W.A.; Sharkawy, R. Centralized/Decentralized Power Management Strategy for the Distribution Networks based on OPF and Multi-Agent Systems. In Proceedings of the 2021 IEEE PES Innovative Smart Grid Technologies Europe (ISGT Europe), Espoo, Finland, 18–21 October 2021; pp. 1–5. [Google Scholar]
- Elena, D.O.; Florin, D.; Valentin, G.; Marius, P.; Octavian, D.; Catalin, D. Multi-agent System for Smart Grids with Produced Energy from Photovoltaic Energy Sources. In Proceedings of the 2022 14th International Conference on Electronics, Computers and Artificial Intelligence (ECAI), Ploiesti, Romania, 30 June–1 July 2022; pp. 1–6. [Google Scholar]
- Priyadarshana, H.; Hemapala, K.U.; Wijayapala, W.S.; Saravanan, V.; Boralessa, M.K.S. Developing multi-agent based micro-grid management system in jade. In Proceedings of the 2019 2nd International Conference on Power and Embedded Drive Control (ICPEDC), Chennai, India, 21–23 August 2019; pp. 552–556. [Google Scholar]
- Modbus Organization. Modbus Application Protocol Specification V1.1b; Modbus Organization: Andover, MA, USA, 2006. [Google Scholar]
- Modbus Organization. MODBUS Messaging on TCP/IP Implementation Guide: V1.0b; Modbus Organization: Andover, MA, USA, 2006. [Google Scholar]
- Techniques—ICS | MITRE ATT&CK®. Available online: https://attack.mitre.org/techniques/ics (accessed on 27 December 2022).
- Boakye-Boateng, K.; Ghorbani, A.A.; Lashkari, A.H. RiskISM: A Risk Assessment Tool for Substations. In Proceedings of the 2021 IEEE 9th International Conference on Smart City and Informatization (iSCI), Shenyang, China, 20–22 October 2021; pp. 23–30. [Google Scholar]
- Papadimitriou, C.; Sideri, M. On the Floyd–Warshall algorithm for logic programs. J. Log. Program. 1999, 41, 129–137. [Google Scholar] [CrossRef]
- The ELK Stack: From the Creators of Elasticsearch|Elastic. Available online: https://www.elastic.co/what-is/elk-stack (accessed on 13 May 2023).
- Cho, J.H.; Chan, K.; Adali, S. A survey on trust modeling. ACM Comput. Surv. CSUR 2015, 48, 1–40. [Google Scholar] [CrossRef]
- Critical Infrastructure Threat Information Sharing Framework. A Reference Guide for the Critical Infrastructure Community; USA Homeland Security: Washington, DC, USA, 2016; p. 5.
- Greer, C.; Wollman, D.A.; Prochaska, D.E.; Boynton, P.A.; Mazer, J.A.; Nguyen, C.T.; FitzPatrick, G.J.; Nelson, T.L.; Koepke, G.H.; Hefner, A.R., Jr.; et al. Nist Framework and Roadmap for Smart Grid Interoperability Standards, Release 3.0; Technical Report; National Institute of Standards and Technology: Gaithersburg, MD, USA, 2014.


| Address Type | Access Type | Address Size | Address Range | Function | Function Code |
|---|---|---|---|---|---|
| Coil | Read and Write | 1 bit | 1–9999 | Read Coil | 01 |
| Write Single Coil | 05 | ||||
| Discrete Input | Read Only | 1 bit | 10,001–19,999 | Read Discrete Input | 02 |
| Holding Register | Read and Write | 16 bit | 40,001–49,999 | Read Holding Register | 03 |
| Write Single Register | 06 | ||||
| Input Register | Read Only | 16 bit | 30,001–39,999 | Read Input Register | 04 |
| Tactic | Technique | Attack |
|---|---|---|
| Collection | Automated Collection | Reconnaissance—Scan addresses |
| Inhibit Response Function | Denial of Service | Query flooding |
| Load malicious payloads | ||
| Delay response | ||
| Modify length parameters | ||
| False injection | ||
| Stack modbus frames | ||
| Impair process control | Brute Force I/O | Write to all coils |
| Evasion | Spoof Reporting Message | Baseline replay |
| Symbol | Description |
|---|---|
| q or | A query |
| r or | A response |
| x is a positive integer. | |
| x is a positive rational number. | |
| x is either 0 or 1. | |
| x is within the range of 0 and 1. | |
| Memory access type (read or write) flag. | |
| Exposure intensity. and . | |
| Exposure frequency. and . | |
| Similar exposure. and . | |
| An exposure’s threshold. The notation x is replaced with i, f or s | |
| An alarm associated with a particular component of trust. The notation x is | |
| replaced with , , , , , , , , or . | |
| A set of Modbus features associated | |
| A set of Modbus features, extracted from or , associated | |
| A reference set of Modbus features associated | |
| Count for read coil function code. | |
| Coil quantity. | |
| Count for write single coil function code. | |
| Coil value. | |
| Set of coil values. where | |
| Count for write multiple coils function code. | |
| Coil data byte count. | |
| Count for read discrete input function code. | |
| Discrete input quantity. | |
| Discrete input data byte count. | |
| Set of discrete input values. where | |
| Count for read input register function code. | |
| Input register quantity. | |
| Input register data byte count. | |
| Set of input register values. where | |
| Input register value. | |
| Count for read holding register function code. | |
| Holding register quantity. | |
| Count for write single register function code. | |
| Holding register value. | |
| Count for Write Multiple Registers function code. | |
| Set of holding register values. where | |
| Holding register data byte count. | |
| Frame size feature. | |
| Reference frame size feature. | |
| Frame size feature for or . | |
| Length of the MBAP header | |
| Function code indicator of or . | |
| Z | A set of Modbus features associated with |
| A set of Modbus features, extracted from or , associated with | |
| A reference set of Modbus features associated with | |
| Pre-time feature. | |
| Pre-time feature threshold. | |
| Inter-query time feature. | |
| Inter-response time feature. | |
| Query-response time feature. | |
| Transaction time feature. | |
| Timeout feature. | |
| y | Replay indicator. |
| A set of Modbus features associated with | |
| A set of Modbus features, extracted from or , associated with | |
| A reference set of Modbus features associated with | |
| State traversed feature. | |
| or | Port mismatch feature. |
| or | IP-MAC mismatch feature. |
| Unknown state feature. | |
| Address match feature. | |
| Address size match feature. | |
| Function code match feature. | |
| Discrete input quantity match feature. | |
| Discrete input reference match feature. | |
| Coil reference match feature. | |
| Coil quantity match feature. | |
| Holding register reference match feature. | |
| Holding register quantity feature. | |
| Input register quantity match. | |
| Input register reference match. | |
| Message sequence flag. | |
| Familiarity. | |
| Environment status attack flag. | |
| Replay attack flag. | |
| Reconnaissance attack flag. | |
| Query flooding attack flag. | |
| Packet manipulation attack flag. | |
| Consequence. | |
| Trust score. | |
| Initial state of device. | |
| Previous trust score. | |
| Trust score threshold. | |
| Forgiveness weight. | |
| Forgiveness state of device. |
| Devices | Functional Influence |
|---|---|
| IED2A, IED2B | 4 |
| IED4A, IED4B, IED4C, IED5A, IED5B, IED5C | 9 |
| IED3A, IED3B | 11 |
| IED6A | 17 |
| IED2C, IED2D | 23 |
| IED1C | 36 |
| IED1A, IED1B | 39 |
| Trust Device | Attack | Alert | Affected Exposure | Device Risk Level | Risk Posture | Outcome |
|---|---|---|---|---|---|---|
| IED1A | Load malicious payload | IP Mismatch | Similarity | Severe | High | Rogue Device Blocked |
| IED4C | Load malicious payload | IP Mismatch | Similarity | Severe | Low | Rogue Device Blocked |
| IED1A | Modify length parameters | IP Mismatch | Similarity | Severe | High | Rogue Device Blocked |
| IED4C | Modify length parameters | IP Mismatch | Similarity | Severe | Low | Rogue Device Blocked |
| IED1A | Query flooding | IP Mismatch | Similarity | Severe | High | Rogue Device Blocked |
| IED4C | Query flooding | IP Mismatch | Similarity | Severe | Low | Rogue Device Blocked |
| IED1A | Reconnaissance | IP Mismatch | Similarity | Severe | High | Rogue Device Blocked |
| IED4C | Reconnaissance | IP Mismatch | Similarity | Severe | Low | Rogue Device Blocked |
| IED1A | Stack modbus frames | IP Mismatch | Similarity | Severe | High | Rogue Device Blocked |
| IED4C | Stack modbus frames | IP Mismatch | Similarity | Severe | Low | Rogue Device Blocked |
| IED1A | Write to all coils | IP Mismatch | Similarity | Severe | High | Rogue Device Blocked |
| IED4C | Write to all coils | IP Mismatch | Similarity | Severe | Low | Rogue Device Blocked |
| Trust Device | Attack | Alert | Affected Component | Device Risk Level | Risk Posture | Outcome |
|---|---|---|---|---|---|---|
| IED1A | Load malicious payload | Length mismatch | Frequency | Severe | High | Communication with SCADA HMI blocked |
| IED1B | Load malicious payload | Length mismatch | Frequency | Severe | Low | Communication with SCADA HMI blocked |
| IED1A | Query flooding | Query flooding of known read query | Intensity | Severe | High | Communication with SCADA HMI blocked |
| IED1B | Query flooding | Query flooding of known read query | Intensity | Severe | Low | Communication with SCADA HMI blocked |
| IED1A | Reconnaissance | Unknown read query | Consequence | Severe | High | Communication with SCADA HMI blocked |
| IED1B | Reconnaissance | Unknown read query | Consequence | Severe | Low | Communication with SCADA HMI blocked |
| IED1A | Replay packets | Replay of unknown read query | Consequence | Severe | High | Communication with SCADA HMI blocked |
| IED1B | Replay packets | Replay of unknown read query | Consequence | Severe | Low | Communication with SCADA HMI blocked |
| IED1A | Stack modbus frames | Length mismatch | Frequency | Severe | High | Communication with SCADA HMI blocked |
| IED1B | Stack modbus frames | Length mismatch | Frequency | Severe | Low | Communication with SCADA HMI blocked |
| IED1A | Write to all coils | Unknown write query attack | Consequence | Severe | High | Communication with SCADA HMI blocked |
| IED1B | Write to all coils | Unknown write query attack | Consequence | Severe | Low | Communication with SCADA HMI blocked |
| Trust Device | Attack | Alert | Affected Component | Device Risk Level | Risk Posture | Outcome |
|---|---|---|---|---|---|---|
| IED1A | Baseline replay | None | None | Low | Very Low | None |
| IED1B | Baseline replay | None | None | Low | Very Low | None |
| IED1A | Delay response | None | None | Low | Very Low | None |
| IED1B | Delay response | None | None | Low | Very Low | None |
| IED1A | False data injection | Unknown read query | Consequence | Severe | High | Communication with IED blocked |
| IED1B | False data injection | Unknown read query | Consequence | Severe | Low | Communication with IED blocked |
| IED1A | Length manipulation | Length mismatch | Intensity | Severe | High | Communication with IED blocked |
| IED1B | Length manipulation | Length mismatch | Intensity | Severe | Low | Communication with IED blocked |
| IED1A | Load malicious payload | Length mismatch | Frequency | Severe | High | Communication with IED blocked |
| IED1B | Load malicious payload | Length mismatch | Frequency | Severe | Low | Communication with SCADA HMI blocked |
| IED1A | Stack modbus frames | Length mismatch | Frequency | Severe | High | Communication with IED blocked |
| IED1B | Stack modbus frames | Length mismatch | Frequency | Severe | Low | Communication with IED blocked |
Disclaimer/Publisher’s Note: The statements, opinions and data contained in all publications are solely those of the individual author(s) and contributor(s) and not of MDPI and/or the editor(s). MDPI and/or the editor(s) disclaim responsibility for any injury to people or property resulting from any ideas, methods, instructions or products referred to in the content. |
© 2023 by the authors. Licensee MDPI, Basel, Switzerland. This article is an open access article distributed under the terms and conditions of the Creative Commons Attribution (CC BY) license (https://creativecommons.org/licenses/by/4.0/).
Share and Cite
Boakye-Boateng, K.; Ghorbani, A.A.; Lashkari, A.H. Implementation of a Trust-Based Framework for Substation Defense in the Smart Grid. Smart Cities 2024, 7, 99-140. https://doi.org/10.3390/smartcities7010005
Boakye-Boateng K, Ghorbani AA, Lashkari AH. Implementation of a Trust-Based Framework for Substation Defense in the Smart Grid. Smart Cities. 2024; 7(1):99-140. https://doi.org/10.3390/smartcities7010005
Chicago/Turabian StyleBoakye-Boateng, Kwasi, Ali A. Ghorbani, and Arash Habibi Lashkari. 2024. "Implementation of a Trust-Based Framework for Substation Defense in the Smart Grid" Smart Cities 7, no. 1: 99-140. https://doi.org/10.3390/smartcities7010005
APA StyleBoakye-Boateng, K., Ghorbani, A. A., & Lashkari, A. H. (2024). Implementation of a Trust-Based Framework for Substation Defense in the Smart Grid. Smart Cities, 7(1), 99-140. https://doi.org/10.3390/smartcities7010005