Article

On the Adoption of Smart Home Technology in Switzerland: Results from a Survey Study Focusing on Prevention and Active Healthy Aging Aspects

by
Raphael Iten
1,
Joël Wagner
2,3,* and
Angela Zeier Röschmann
1
1
Institute for Risk & Insurance, ZHAW School of Management and Law, Gertrudstrasse 8, 8400 Winterthur, Switzerland
2
Department of Actuarial Science, Faculty of Business and Economics (HEC Lausanne), University of Lausanne, Chamberonne—Extranef, 1015 Lausanne, Switzerland
3
Swiss Finance Institute, University of Lausanne, 1015 Lausanne, Switzerland
*
Author to whom correspondence should be addressed.
Smart Cities 2024, 7(1), 370-413; https://doi.org/10.3390/smartcities7010015
Submission received: 23 November 2023 / Revised: 17 January 2024 / Accepted: 22 January 2024 / Published: 30 January 2024

Abstract

:
Smart home (SH) technologies offer advancements in comfort, energy management, health, and safety. There is increasing interest in technology-enabled home services from scholars and professionals, particularly to meet the needs of a growing aging population. Yet, current research focuses on assisted living scenarios developed for elderly individuals with health impairments, and neglects to explore the potential of SHs in prevention. We aim to improve comprehension and guide future research on the value of SH technology for risk prevention with a survey assessing the adoption of SHs by older adults based on novel ad hoc collected data. Our survey is based on the theoretical background derived from the extant body of literature. In addition to established adoption factors and user characteristics, it includes previously unexamined elements such as active and healthy aging parameters, risk and insurance considerations, and social and hedonic dimensions. Descriptive results and regression analyses indicate that a vast majority of individuals acknowledge the preventive benefits of SHs. Additionally, we observe that individuals with higher levels of social activity, technology affinity, and knowledge of SHs tend to report greater interest. Moreover, perceived enjoyment and perceived risk emerge as central elements for SH adoption. Our research indicates that considering lifestyle factors when examining technology adoption and emphasizing the preventive benefits present possibilities for both future studies and practical implementations.

1. Introduction

Technology-enabled households ultimately aim to improve the quality of life at home by providing various services that make everyday life at home easier [1]. The umbrella term “smart home” (SH) combines services in the areas of lifestyle and comfort [2], energy management [3], health [4], and safety [1]. According to the SH literature review by Iten et al. [5], an SH is defined as “a home equipped with a set of smart technologies that provide a resident with remote, digitized, and automated services that improve his or her quality of life at home”. The definition highlights the three key properties of an SH: the technological aspects of hardware and software, the services enabled by the SH, and the ability to meet specific household needs. SHs pave the way for sustainable change, and technological advances create true interconnectivity between different systems, making the SH much more than a set of individual devices that address isolated needs [1]. Recent market studies indicate that more than 250 SH technologies are commercially available in the UK [6]. Demand is further expected to increase following the COVID-19 pandemic [7]. As a result, the pandemic crisis and its aftermath have altered people’s daily routines [8]. The relationship between domestic activities and home technologies has been rethought [9].
Recently, SH research focusing on older individuals has become increasingly important. As people age, they spend more time at home and attach greater importance to it [10]. This is also reflected in the fact that a large proportion sees successful aging as living autonomously at home for as long as possible [11]. Noteworthy shifts in society, such as the demographic transitions in most industrialized nations and the digital affinity of forthcoming retirees (like the baby boomer generation), marked by a substantial interest in technological support services for daily home life, have provided the stimulus for further research in the field of SHs [12]. One area of current research is concerned with the factors that increase the intention to use SHs among older adults [13,14]. Older adults are often considered a target group in advanced age or with functional limitations [15]. Therefore, the focus is mainly on reactive support services (e.g., fall detection) or treating risks that have already manifested. As a consequence, the potential for SHs to enable opportunities for proactive risk prevention has so far been neglected. With risk prevention, we refer to the proactive reduction in the frequency and severity of potential losses experienced at home. In contrast, risk treatment is concerned with managing the consequences of risks.
Against this background, the present research aims to lay the groundwork for investigating the value of SH technology for prevention purposes. The hypothesis guiding this investigation is that older individuals perceive an SH as a valuable instrument to prevent risks at home and, hence, to support active and healthy living at older age. To this end, we review the literature and develop a questionnaire that incorporates features and user characteristics that are potentially relevant from a risk prevention perspective. Although the questionnaire is based on established technology adoption frameworks, we identify several previously unstudied elements of relevance. The concept of active healthy aging (AHA), as advocated by the United Nations, provides a capability-oriented perspective on aging [16]. In addition, our survey considers technology and risk affinity, risk and insurance costs, and social and hedonic dimensions.
The results based on the answers to our survey from 1515 individuals aged 45 and older in Switzerland provide encouraging insights for studying the preventive value of SHs. The majority recognizes the benefits of prevention in safety-related services. Among all the prevention benefits examined, health benefits have the most pronounced effect on the intention to adopt SHs in the future. Additionally, the results suggest that socially active individuals express greater interest in SHs. Other factors associated with increased interest in SHs among older adults include higher technology and risk affinity, more knowledge about SHs, and the male gender. Finally, there is a clear positive relationship between the enjoyment of using SHs and increased interest in SHs, while perceived risks and costs are identified as barriers to the intention to adopt SHs.
The paper is organized as follows. In Section 2, we review the relevant literature to identify potential elements that influence the adoption of SHs and provide examples of preventive services. In Section 3, we introduce the survey and describe the measurement items. In Section 4, we report descriptive statistics on the collected responses. Furthermore, we present the results of regression analyses assessing the significance of the association of various factors with the intention to adopt SHs. In Section 5, we discuss our findings, and in Section 6, we conclude.

2. Theoretical Background

To inform our investigation of the preventive value of SHs for older adults and provide background information, we conducted a literature review. This review included literature on the areas of SH services and prevention, as well as the adoption of SH technology by older adults. The purpose of the literature review is to identify specific preventive elements to complement the development of our survey in Section 3.

2.1. SH Service and Prevention Areas

Based on the literature, we have identified four main service areas of SH technology: comfort, energy, health, and safety [17,18,19]. Each of these areas offers unique benefits to users [20]. The comfort area covers support services to increase the comfort and lifestyle of residents [1]. The focus is on improving the ability to control various domestic appliances or simplify daily household activities [21]. The energy area combines a wide range of services aimed at reducing energy consumption in the house or optimizing energy consumption without human intervention [22]. In addition to considerations related to easier monitoring and control, preventive benefits are also recognized. These benefits are increasingly evident as SHs are discussed in public as an important lever for making private households more sustainable [23].
The health area relates to services that provide individual health information (e.g., fall detection), or environmental information with relevant health impact (e.g., air quality). From a prevention perspective, it particularly focuses on improving self-management and alerting family members and professionals in case of emergencies [22]. Currently, most research takes a functional limitations-centered perspective when studying SH health dynamics for older people and refers to seniors of advanced age or disabled persons [13,21,24]. Areas such as ambient assisted living or telemedicine aim to provide technological assistance at home in cases of impairment [12]. For instance, these technologies support people with disabilities in achieving a more independent life, enable a self-reliant life in old age, or facilitate the digital transmission of medical information, services, and education [25]. Turjamaa et al. [15] argue that researchers should consider SH health services holistically, enabling older adults to perform activities of daily living and lead healthier and more fulfilling lives by enhancing physical safety and social interactions. The AHA concept emphasizes the link between activity and health, encompassing continued participation in social, economic, cultural, spiritual, and civic affairs [26]. In 2020, the framework was integrated into a comprehensive 10-year action plan launched by the United Nations, officially known as the UN Decade of Healthy Aging [16]. Several studies have highlighted the significance of home life in promoting AHA [13,27], and, at the same time, AHA can be a good predictor of technology adoption [28].
The safety area consists of services that allow home occupants to secure their homes and avoid accidents [1]. This area is inherently preventive and commonly associated with preventative benefits [13]. It encompasses common devices such as door locks, water leak detectors, and motion sensors [24]. In fact, safety products or features are among the most popular SH products in all age groups [24,29]. The popularity appears to follow a chronological order, with the most recent innovations being the least preferred [24]. The familiarity of safety-related products can also be attributed to their direct impact on reducing financial losses. Incidents such as water bursts or storms pose well-documented risks, not only in terms of potential losses but also in the attention that they receive from other stakeholders, including insurance companies and homeowner associations [30].

2.2. Factors Influencing SH Adoption

Among the most important factors promoting SH adoption, the literature points to usefulness and usability [31,32,33,34]. These factors have also been confirmed by studies in older adults [13,14]. Pal et al. [35] demonstrate that usability is foremost among older adults, primarily due to the significant effort required to learn any new technology. Another commonly cited factor is the availability of support and resources when using SHs [36]. Its significance for the acceptance of SHs has been highlighted in some studies [10,37], while other articles suggest that it has no impact [35,38] or even question its reliability [39]. Moreover, social influences that relate to the extent to which important others believe one should use an SH receive widespread attention [10]. Yet, we find some studies that question these properties based on age and family composition [22,40]. Another driver for SH interest is the perceived fun derived from using SHs [34]. The literature review by Marikyan et al. [20] reveals that only a few studies investigate this hedonic motivation provided by SHs. However, most of these studies attribute significant influence on adoption intention [22,37,41]. Eventually, less research attention has been given to factors such as the perceived price value of investing in technology [13], habit [39], trust [42], and expert advice [40], as well as technology anxiety [29]. Furthermore, Iten et al. [5] conducted a literature review that provides insights into various barriers and risks that limit SH adoption. It sheds light on the evolving risk landscape associated with SHs, highlighting impediments such as cyber security and privacy and the evolving challenges associated with technology dependency [6,43]. These risks often manifest through financial costs and therefore must be carefully considered. Pal et al. [35] note that, for older adults, the cost of technology may serve as a notable barrier.
Methodologically, studies on SH adoption mostly rely on technology adoption frameworks that trace back to the seminal work of Davis [44]. As summarized in Table 1, most of the factors mentioned above can be related to the traditional technology acceptance model (TAM) and the unified theory of acceptance and use of technology (UTAUT). The TAM incorporates two key constructs related to usefulness and usability [31], while the UTAUT posits that, apart from technology-specific features, personal beliefs can specifically explain an individual’s intentions to use new technologies [22]. The application of the UTAUT framework in the context of an SH was first carried out by Alaiad and Zhou [10], who concluded that it may be the most integrative research theory to follow given its validity in various technology settings. Furthermore, recent studies on SH adoption [22,33,39] underscore the comprehensive nature and substantial empirical support of the framework. For instance, Sequeiros et al. [36] demonstrate that UTAUT-specific beliefs related to hedonic and social factors may exert significant influence on SH adoption.

2.3. User Characteristics

Research characterizing (potential) users is available, although the results are sometimes contradictory. Regarding age, the adoption intention of younger adults is often found to be higher than that of older ones (see, e.g., Wang et al. [18]). However, Shin et al. [32] and Klobas et al. [51] have observed higher adoption rates among older adults, noting their increased willingness to share personal data in SH health settings. The evidence regarding the effect of gender is also divergent. Sovacool et al. [52] suggest that SH dynamics are generally strongly influenced by gender, as benefits related to entertainment value or household work differ significantly by gender. These dynamics are particularly pronounced among older individuals and tend to positively influence adoption rates among men [13]. The evidence on the influence of income and education shows that higher levels come with higher SH interest [51]. However, Chang and Nam [1] suggest that this effect may be related to the costs of technology. One study, including marital status [24], found that being in a relationship is related to higher SH adoption intention. Additionally, various aspects of technological experience and affinity have been studied. For example, prior experience with SHs has been shown to facilitate adoption [17]. Awareness and knowledge of SH technologies [19] and ownership of other technologies [45] also lead to higher adoption rates. Smartphone ownership and expertise have been linked to higher levels of SH adoption [13]. The positive influence of technology affinity has been validated by [31], among others. Also, home ownership [24] and household size [13] have been found to relate to SH adoption. In Table 2, we list the variables characterizing users found in the literature.

3. Methodology and Data

This study investigates the intention to adopt SHs and focuses on the preventive benefits of SH technology for active and healthy aging. The aim is to enhance comprehension and guide future research on the topic by creating new survey data. The subsequent section outlines the structure and design of the survey and the data collection process and explains the variables measured in the survey.

3.1. Survey Design and Data Collection

We begin by showing how the concepts of prevention, as well as the elements of SH adoption and user characteristics outlined in Section 2, are integrated. We provide a detailed description of our study design and data collection process. We outline the key components of the questionnaire, the procedures used to obtain a representative survey sample, and how we derived the SH scenario.

3.1.1. Structure

The survey is structured along the main topics that we illustrate in Figure 1. In the introductory section, we assess the eligibility of participants using filter criteria and quotas related to level of SH knowledge, age, gender, and region of residence. To provide context and guidance, we present an SH scenario that illustrates two use cases. The core of the survey contains 122 questions organized into four categories (personal characteristics, evaluation of prevention benefits, dimensions of SH adoption, risks and costs) and 15 topics labeled from A to O. First, to characterize an interested user, we collect socio-demographic variables, AHA-related parameters, technology and risk affinity, and information about individual insurance coverage. Second, we collect participants’ evaluations of the benefits of prevention in terms of comfort, safety, health, and fitness. Third, we capture key elements influencing SH adoption, including performance and effort expectancies, facilitating conditions, social influences, and hedonic motivation. Finally, we ask about risks and costs. We describe the survey questions in more detail in Section 3.2.

3.1.2. SH Scenario

As our objective is to survey the behavioral intentions of potential users rather than their actual use or choice of a specific product component, we employ adapted scenarios. The scenario technique, as described by Hubert et al. [31] for surveys on SHs, offers two approaches: a detailed or abstract scenario description. The literature review by Marikyan et al. [20] reveals that most scholars focus on a detailed description of a standalone SH device rather than a fully interconnected SH system. This approach emphasizes specific services rather than broader lifestyle concepts [15], resulting in better respondent understanding. Conversely, an abstract description that encompasses multiple interconnected SH products enables the analysis of preferences for different services [1]. However, this approach has limitations in terms of scenario comprehensibility and potential biases. The literature suggests minimizing these issues by using filter questions to assess respondents’ level of SH knowledge [35].
We chose an abstract scenario with multiple examples to capture the preferences for different prevention benefits. To ensure the scenario’s effectiveness and appropriateness, we implemented a quota for SH knowledge levels allowing fewer than 10% of respondents with no SH knowledge, maintained a summary of the scenario pinned to the top of the screen throughout the survey, and incorporated Swiss-specific household characteristics into the scenario description based on a site visit to a major provider of SH solutions [56]. The scenario description can be found as part of the questionnaire in Appendix A, part B.

3.1.3. Operationalization

The survey was conducted online in March 2022 using the Unipark software and administrated by a professional polling agency responsible for participant recruitment. Participants were provided financial incentives for successful completion and only given the title of the survey when first contacted. The survey was conducted in both the German and French language. An English translation of the questionnaire is provided in Appendix A. Prior to its distribution, we conducted a pilot test with individuals who met the eligibility criteria to ensure comprehensibility, usability, and technical functionality (see the test protocol in Appendix B). The overall design process follows the CHERRIES guideline [57] for online surveys, and the reporting checklist can be found in Appendix C.

3.1.4. Sample

A total number of 2553 participants were recruited, with 2490 agreeing to participate. We applied filters based on age (≥45 years) aligning with the research focus on AHA, quotas (67:33 ratio for German- and French-speaking regions in Switzerland; 50:50 for female and male; 30:30:30:10 for age groups 45–54, 55–64, 65–74, and over 75 years; 10:90 for participants without and with SH knowledge, respectively), and conducted quality checks throughout the survey using control questions. Note that the distribution of age groups is not fully representative of Switzerland. In particular, the relatively under-represented 10% of those aged 75 and over is due to practical constraints during the recruitment process. The exact distribution should ideally be 30:30:20:20. These considerations should be taken into account when interpreting the results. The final sample consists of 1515 valid responses and the data presented in this study are being prepared for open access; see Iten et al. [58].

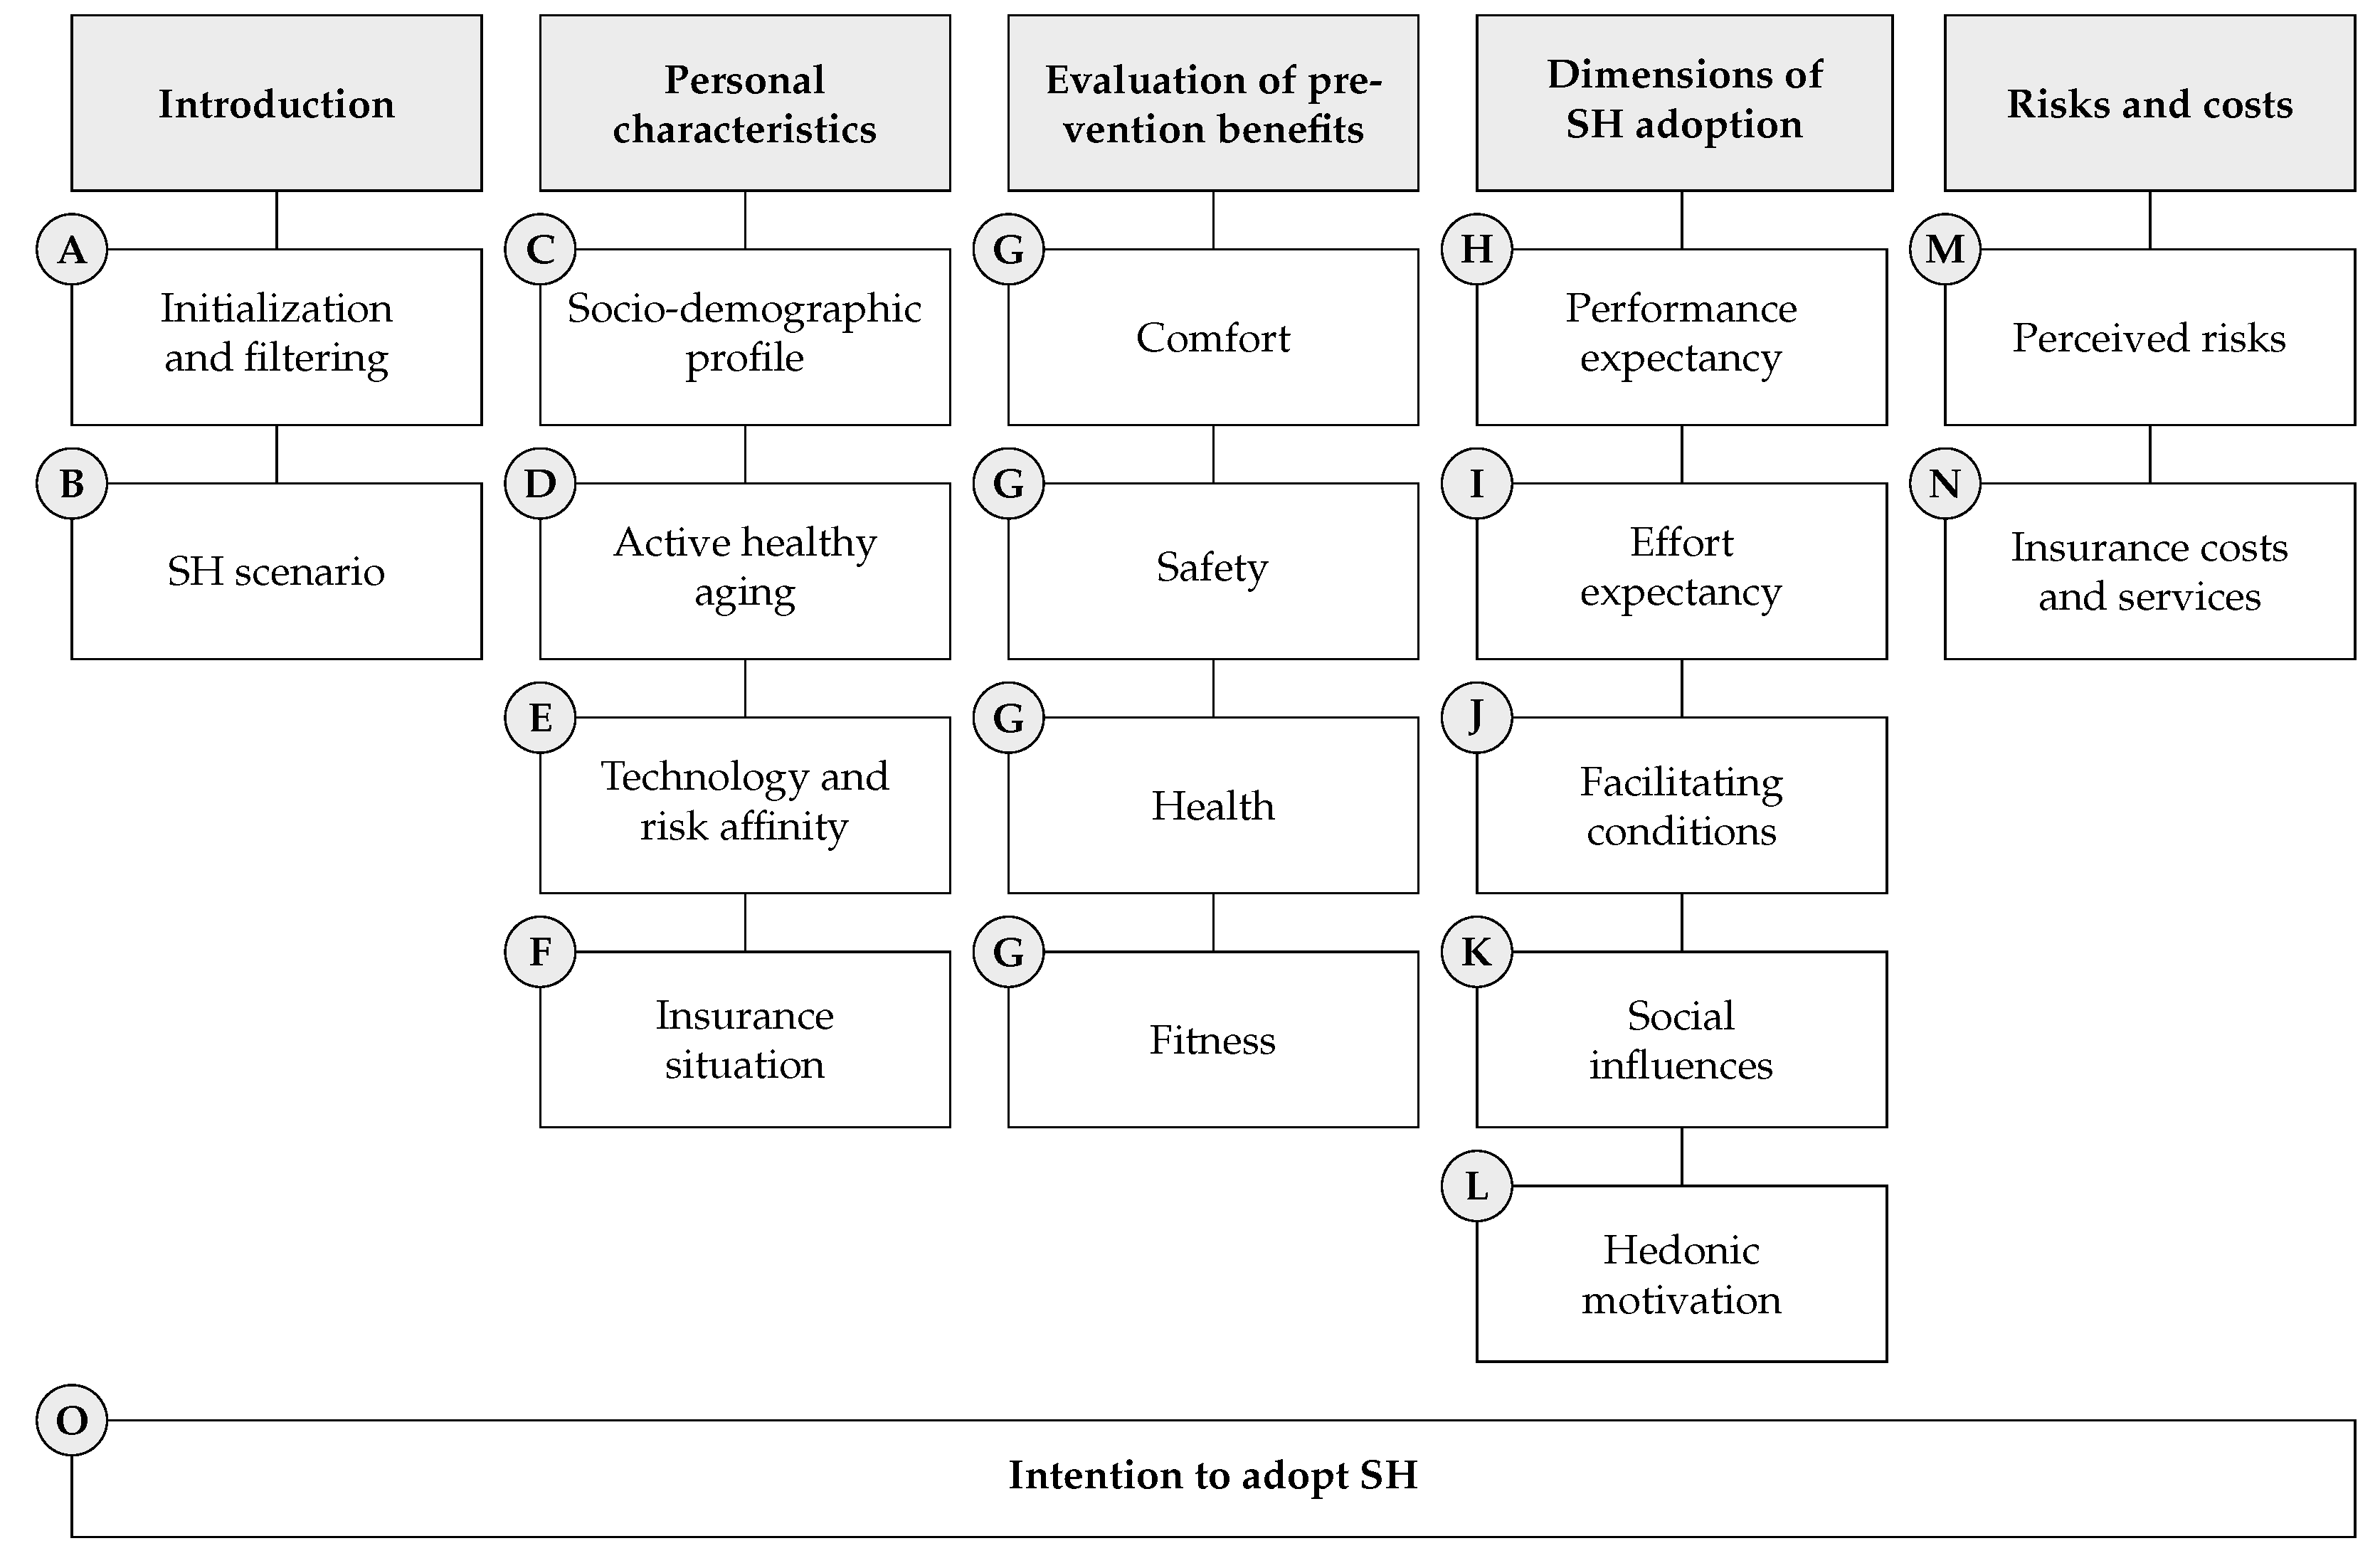
3.2. Questions and Measurement Items

Using the structure of the questionnaire illustrated in Figure 1, we describe the questions and variables measured in our survey. An overview of the variables is provided in Table 3, Table 4, Table 5 and Table 6.

3.2.1. Intention to Adopt SH

To measure the main variable of interest, the intention to adopt SHs, we use three items. Questions O1 to O3 ask respondents to indicate their level of agreement (on a five-level Likert scale [59] from “strongly disagree” to “strongly agree”) with the statements “I intend to use smart home in the future.”, “I predict I would use smart home in the future.”, and “If the opportunity presents itself in the near future, I will use smart home.”. The questions were presented in connection with the SH scenario visualization pinned to the top of the screen and are drawn from previous SH adoption studies (see, e.g., Große-Kreul [22], Baudier et al. [39]).

3.2.2. Introduction

This part includes variables related to filtering, quotas, and the SH scenario examples.
Initialization and filtering. Question A1 collects the self-assessed level of knowledge of SH technologies on a five-level Likert scale ranging from “no knowledge” to “very good knowledge”. In question A2, we ask for the age of the respondent. We code the numeric responses ranging from 45 to 90 years into four categories (45–54, 55–64, 65–74, 75+ years). Question A3 assesses gender with four answer options: female, male, diverse, and prefer not to respond. The respondent’s choice of survey language, German or French, is also recorded. According to the polling company, the selected language is strongly related to the respondent’s origin from the respective linguistic region of Switzerland (i.e., German- or French-speaking region).
SH scenario. Questions B1 and B2 assess preferences for two SH scenario examples using an ordinal scale ranking from “dislike” to “like”. The convenience application (B1) covers generic control and command functions using SHs. The health application (B2) describes functions aimed at controlling and simplifying the delivery of health information.

3.2.3. Personal Characteristics

To obtain the respondents’ characteristics, we use variables relating to socio-demographic, AHA, technology and risk affinity, and insurance situation. While several variables are self-explanatory, others require a more detailed explanation.
Socio-demographic variables. In question C1, we record the education of the respondent along three categories (mandatory school, high school or professional education, and higher education). Wealth is measured through two questions assessing income sufficiency for recurring expenses (C2) and the ability to cover an unexpected expense (C3). Question C4 inquires about the professional situation, while the home ownership is coded from question C5 into rent and ownership. Additionally, marriage status and different household compositions (single, with kids, etc.) are recorded from questions C6.1 to C6.6.
Active healthy aging variables. While there are different frameworks used to measure AHA [60], we build on the dimensions of physical, mental, and social well-being from Bosch-Farré et al. [27] and derive our variables from Börsch-Supan [61]. For the physical dimension, we assess the level of physical activity through questions D1.1 and D1.2, which inquire about the frequency of mildly and very strenuous activities (hardly ever, once to twice per month, once per week, more than once a week). Question D2 focuses on the degree of frailty in certain daily activities. Mental well-being is recorded from questions on satisfaction with life (D3), depressive symptoms (D4), and feelings of loneliness (D5). Social well-being (questions D6.1–D6.7) is evaluated based on the frequency of participation in six different activities (cultural activities, group sports, educational courses, voluntary work, club activities, and going out with friends), and whether one regularly cares for grandchildren as a grandparent.
Technology and risk affinity variables. These variables are derived from established concepts in research on technology adoption and on decisions about insurance take-up. We measure technology affinity via the level of agreement (five levels from “strongly disagree” to “strongly agree”) on statements related to the pleasure in trying new technologies (E1) and readiness to try out new technologies (E2). Respondents rate their own technology expertise in smartphone skills on a five-level scale in question E3. Risk aversion is assessed through the level of agreement about mistake avoidance (E4) and preference for familiarity (E5). Finally, in question E6, we ask respondents to rate their willingness to take risks on a five-level scale from “not at all willing” to “very willing”.
Insurance situation variables. When users put more effort into prevention, the value of existing risk protection and risk financing schemes is reassessed. The insurance sector is increasingly recognizing the importance of data-driven prevention and loss reduction measures [30]. Question F1 captures the respondent’s existing insurance portfolio across eight areas. Additionally, we inquire about the use of an app from the insurer in question F2.

3.2.4. Evaluation of Prevention Benefits

Capturing preferences for prevention considerations in SHs is a crucial aspect of this survey. For the investigated population in the context of AHA, we have identified comfort, safety, health, and fitness as relevant potential benefits. In part G of the questionnaire, we measure the level of agreement (five levels from “strongly disagree” to “strongly agree”) with various statements related to the potential usefulness of SHs. Building on the work of Nikou [14] for comfort benefits, we query on convenience aspects related to burden relief, home information, and value enhancement in G1.1 to G1.3. The items regarding sense of safety (G2.1), security booster (G2.2), and risk protection (G2.3) in the safety benefits are derived from Luor et al. [48]. To evaluate health benefits, we adapt statements from Cimperman et al. [40] to include specific forms of health prevention, such as health maintenance, health monitoring, health encouragement, accident prevention, and family well-check (G3.1–G3.5). For the fitness benefits, we introduce new items focusing on exercise at home. The statements cover automated fitness (G4.1), exercise feedback (G4.2), movement motivation (G4.3), and socializing opportunity (G4.4). An overview of the variables related to the evaluation of all prevention benefits is found in Table 4.

3.2.5. Dimensions of SH Adoption

To reliably gather the elements related to SH adoption, we incorporate a minimum of three questions per subject. An overview is provided in Table 5. We build on the UTAUT framework as it is the most frequently used in SH adoption studies (see Section 2.2). Given the specific context of our analysis, we also introduce new items derived from a literature review and 14 qualitative interviews. Interviews were conducted with randomly selected policyholders from a large Swiss insurer. To ensure validity, we coded the literature and interviews deductively and inductively according to Mayring [62]. The qualitative content analysis was performed using the nVivo software. Each statement in the following sections measures the level of agreement on a five-level Likert scale ranging from “strongly disagree” to “strongly agree”.
Performance expectancy. With performance expectancy, we record the utilitarian value and perceived benefits respondents associate with using SHS [33]. The items encompass everyday household activities simplification (H1), home monitoring (H2), activity motivation (H3), money saving (H4), and social connectivity (H5), as well as shared access with others (H6), and allow us to measure performance expectancy following the original UTAUT ideas of Venkatesh et al. [63] adapted to our SH scenario.
Effort expectancy. Effort expectancy reflects the perceived ease of using SH [36]. Building on the work of Große-Kreul [22] and extending the original UTAUT idea to capture the degree of customizability, we cover respondents’ beliefs on easiness to use (I1.1), intuitive understanding (I1.2), easiness to learn (I1.3), quick usability (I1.4), possibility for customization (I2.1), tailoring to the user (I2.2), trustworthiness (I3.1), and warranties (I3.2), as well as autonomous (I4.1) and seamless usage (I4.2).
Facilitating conditions. Facilitating conditions refer to the degree of support and available resources for using SHs, considering both personal capabilities and compatibility with other technologies [36,38]. Based on the observations of Ayodimeji et al. [33] and similar findings in our interviews, we include items that cover both private and professional support dimensions. The proposed statements include assumptions on the availability of usage instructions (J1), of a professional for questions (J2) and when problems arise (J3), of close people (J4) and colleagues or friends for help (J5), and of own knowledge (J6). Finally, we inquire on the importance of how the SH fits into daily life (J7) and in the way the respondent organizes the household (J8).
Social influences. Social influences encompass the extent to which others believe the SH should be used [33]. It captures how individuals adjust their opinions, revise their beliefs, or change their behavior as a result of social interactions [64]. Our interviews identified an additional component related to the belief that SH usage reflects a modern image [18]. Thus, the statements include the meaning of SHs to important others (K1) and to opinion makers (K2). Furthermore, two statements relate to a more prestigious (K3) and modern image (K4).
Hedonic motivation. SH usage can bring fun, entertainment, or pleasure [22]. According to Marikyan et al. [47], different components of hedonic motivation are relevant across different service areas. Owing to our SH scenario including two different applications, we propose a set of ten statements (L1–L10) relating to variety, curiosity, and convenience. The statement includes the characterizations of entertaining, enjoyable, convenient, curiosity-inducing, versatile, fun, pleasant, relieving, trending, and variegating.

3.2.6. Risks and Costs

In a distinct section, we present SHs in the context of risks and cover aspects related to insurance. The variables utilized to measure those are reported in Table 6.
Perceived risks. Here, we capture the perceived risks associated with SH usage. A review conducted by Iten et al. [5] identified privacy and cost components as the most commonly mentioned risks, along with dependency and loss of control. We consider the increased dependence (becoming dependent on technology, losing control) in statements M1.1 and M1.2. In statement M2.1 and M2.2, we enquire on the costs exceeding benefits, and the SH being expensive to purchase and maintain, respectively. Two statements on misuse (M3.1) and unforeseeable usage of data (M3.2) relate to privacy. Other perceived risks relate to the SH being overwhelming (M4.1) or cumbersome (M4.2), making people leave their house less (M5), and being a non-essential luxury (M6). Finally, we ask the opinion on whether the SH could be a source of problems (M7.1), be insecure (M7.2), replace contact with others (M8.1), and result in a lack of human interaction (M8.2).
Insurance costs and services. Several practitioner studies [65,66,67] discuss the value proposition of the SH from the perspective of insurance companies. In this section of the survey, we propose to the respondents that they could obtain SH services from an insurance company. The insurer would provide these services because they prevent accidents and contribute to home security. However, this would imply the willingness to share data with the company. We have developed the following statements, drawing inspiration from other IoT technologies such as telematics [68] and wearables [69]. The central elements relate to the perceived value of SH insurance offerings in terms of costs, the value of the insurer’s prevention services, and the respondents’ interest in such SH insurance offerings. Specifically, the statements inquire about the expectation of a discount on the insurance premium (N1), automatic premium adjustments (N2), reimbursement of purchase costs (N3), receiving advice (N4), receiving early warnings (N5), and individual offers from the insurer (N6). The last two statements (N7 and N8) relate to the intention to use SH insurance offerings in the future.

4. Results

In the previous sections, we have presented the development process for the novel data set on SH adoption and summarized the operationalization of the survey. In this section, we present results obtained from the data. First, we examine the key variable related to the intention to adopt an SH, which is discussed in Section 4.1. Then, in Section 4.2, we examine how different question items relate to the constructs discussed in the literature. In Section 4.3, we provide comprehensive descriptive statistics based on the responses of the N = 1515 participants in our sample, including their intention to adopt an SH across the main topics covered in our survey. Finally, in Section 4.4, we report regression analyses to assess the significance level of the association of various factors with the intention to adopt an SH.

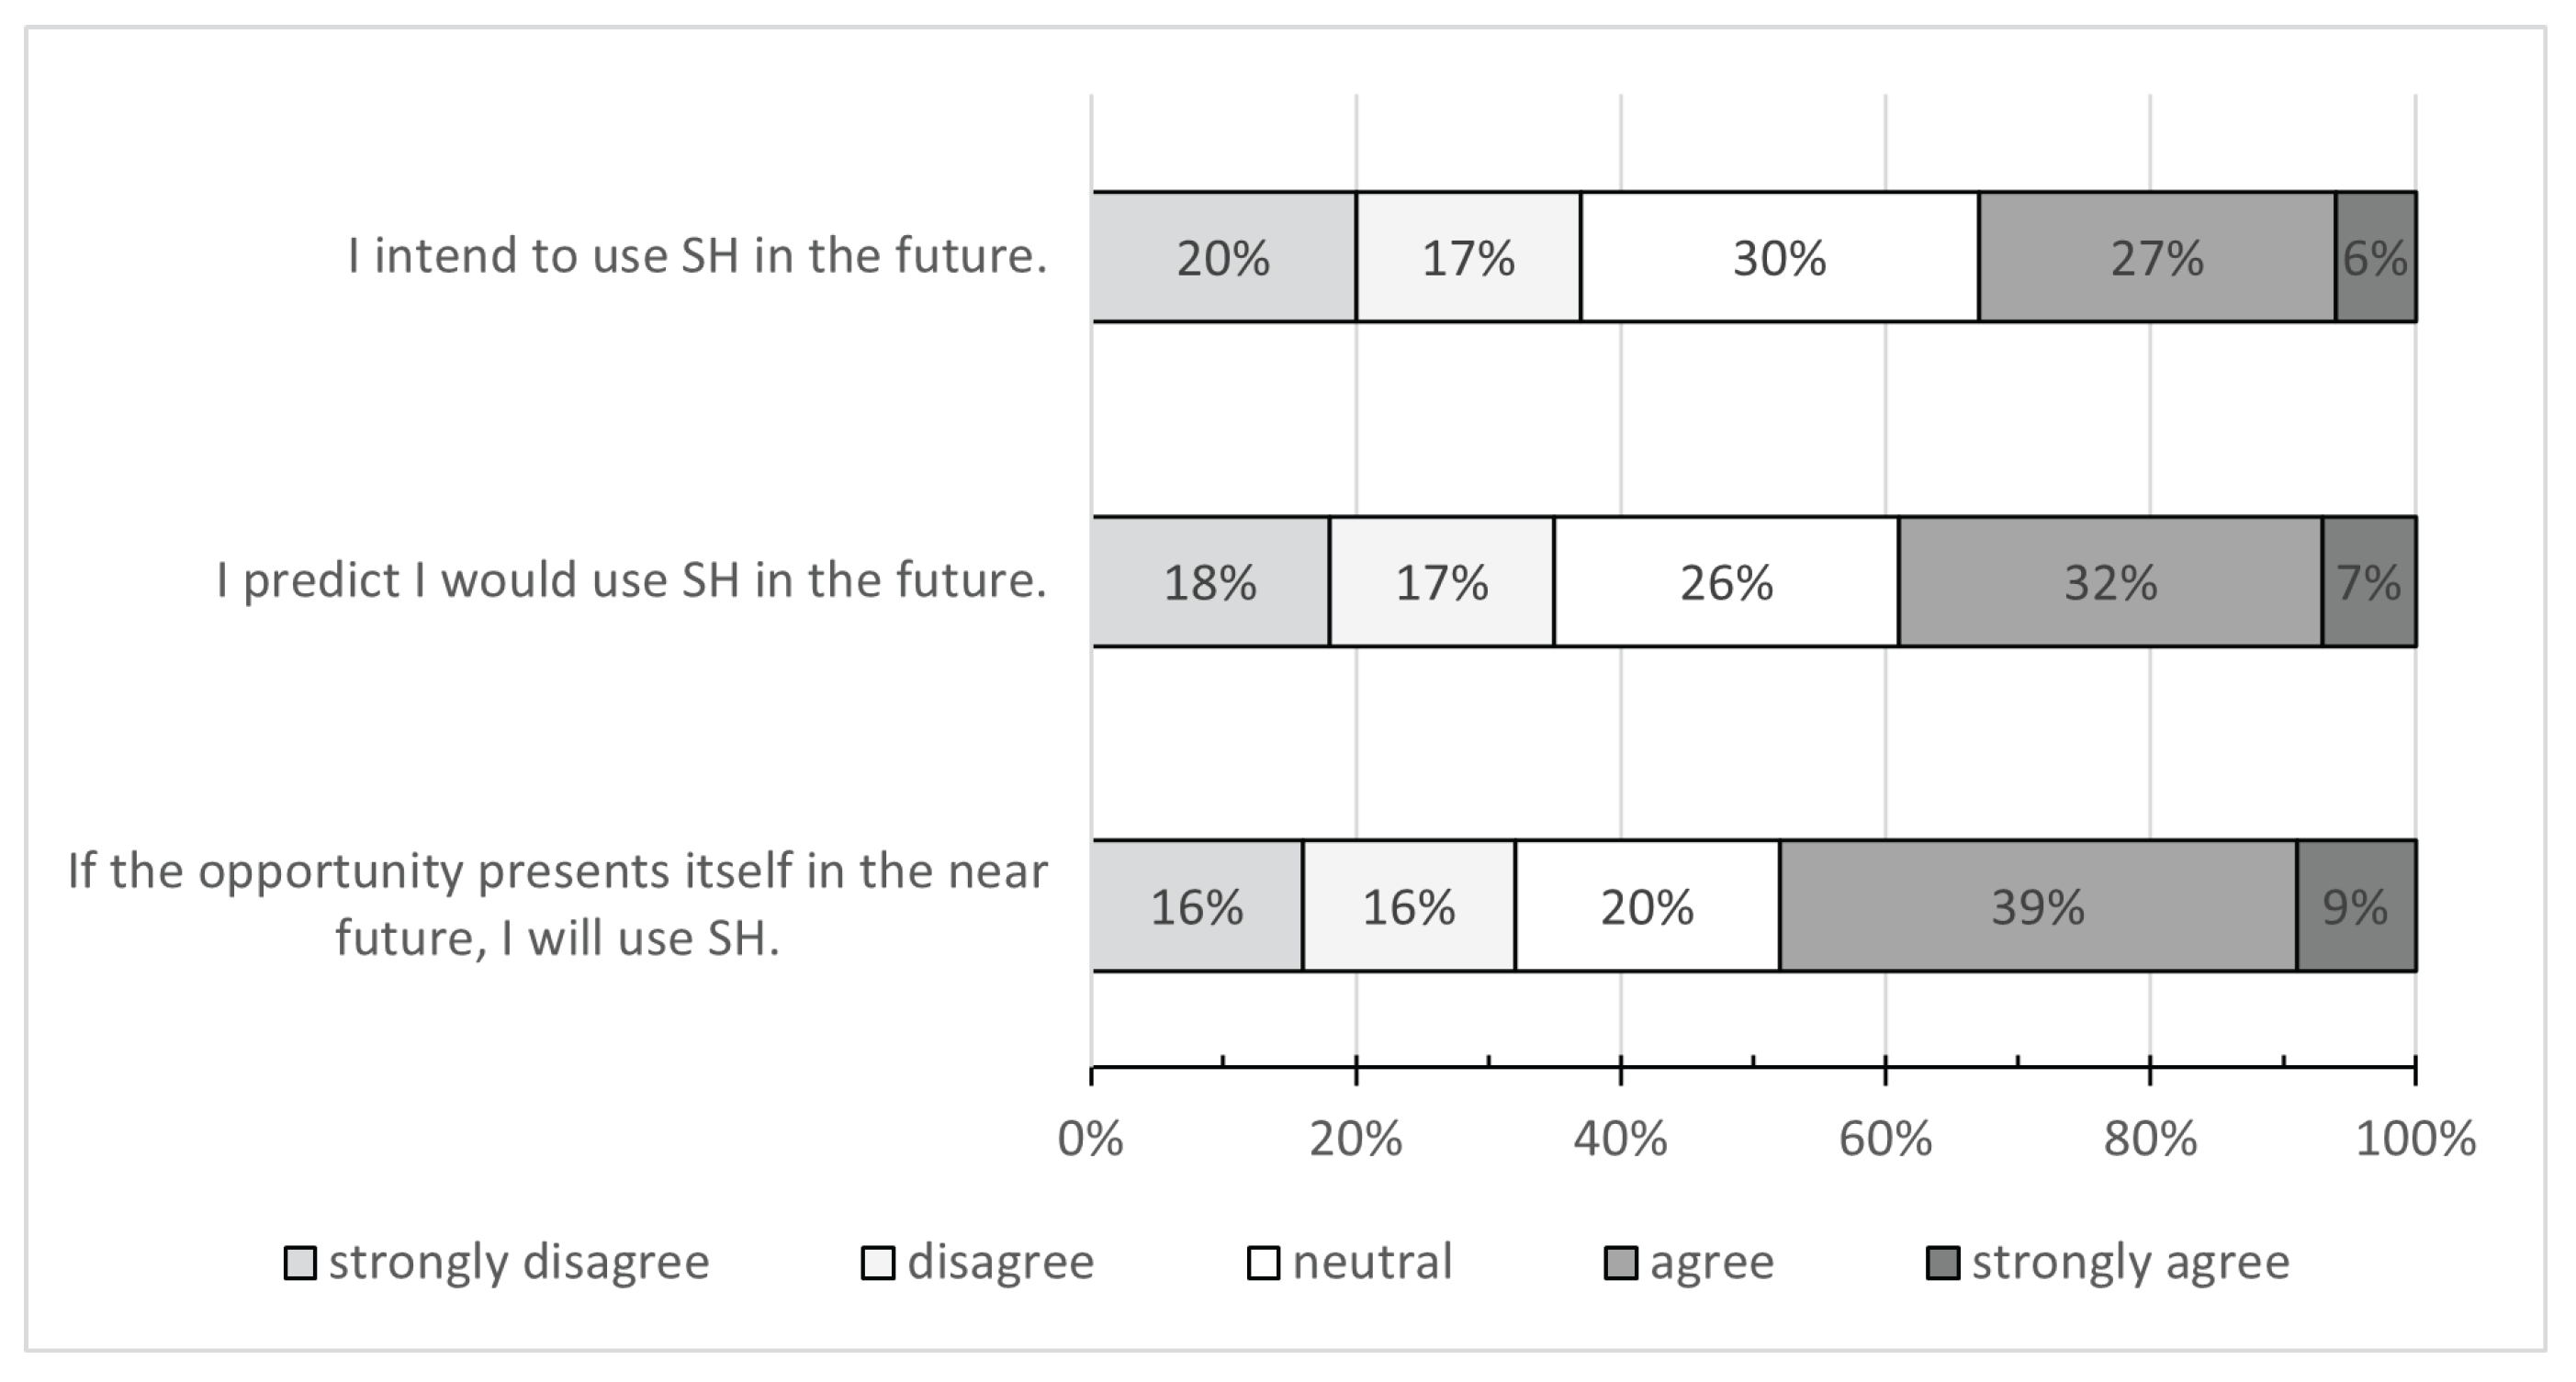
4.1. Intention to Adopt SH

We measure the intention to adopt an SH using the level of agreement on statements provided in questions O1 to O3. The distribution of the recorded answers is illustrated in Figure 2. Considering the answers “agree” and “strongly agree”, we find that 33%, 39%, and 48% express an intention to adopt an SH in the three items. Meanwhile, 37%, 35%, and 32% do not intend using an SH (shares of answers “strongly disagree” and “disagree”).
To locate the concept of intention to adopt an SH in the following analyses, we use the individual responses to the three statements as measures of the latent construct “intention to adopt SH”. This construct has been validated in previous studies, such as the research conducted by Baudier et al. [39], and the reliability coefficients in our sample are consistent (Cronbach’s alpha 0.960; see also Section 4.2 for all reliability coefficients).
Although the original answers were collected on a five-level Likert scale (“strongly disagree” to “strongly agree”), we code the latent construct into a binary scale using the categories “no” and “yes” to represent the intention to adopt. We operationalize the calculation by assigning numerical values from one to five to the original answers and use the average value of the three statements. A value strictly greater than three is interpreted as a “yes”. We find that 49% of the sample expresses an intention to adopt an SH. In the descriptive statistics provided in Section 4.3, we use the construct to represent the proportion of respondents in the “yes” category, providing an indication of the percentage of individuals with an intention to adopt an SH across various respondent characteristics.

4.2. Reliability of the Constructs

A number of latent constructs derived from the literature were incorporated into the questionnaire. We evaluate their reliability by assessing whether the data align with the hypothesized constructs. For each construct, we calculate Cronbach’s alpha, a key metric indicating the extent to which the set of items effectively measures the construct. A threshold value of 0.6 is commonly used to determine construct acceptability [70,71].
Table 7 provides an overview of the latent constructs, along with the corresponding questions and Cronbach’s alpha values. We hypothesized a distinct construct for the prevention benefits of comfort, safety, health, and fitness. While all Cronbach’s alphas surpass the designated threshold, we note that the self-developed construct related to fitness exhibits a Cronbach’s alpha of 0.825. It is important to mention that the other constructs have been validated in previous acceptance studies (see, e.g., Chang and Nam [1]). This also applies to the dimensions of SH adoption, as well as risks and costs in the UTAUT context. While we assess all constructs with our data, we observe high values for Cronbach’s alpha (e.g., for the hedonic motivation, 0.958, and the perveived risks, 0.914). Following evaluation of the constructs’ reliability based on the original five-level Likert scale, we group their values into three categories, “disagree”, “neutral”, and “agree”. Every evaluation on the Likert scale is approximated by a numerical value from one to five. To calculate the construct, we obtain the average score of the values. A mean value below three is coded as “disagree”, a value greater than or equal to three but strictly less than four as “neutral”, and a value greater than or equal to four as “agree”.

4.3. Descriptive Statistics

In the following, we present descriptive results on the survey. Table 8, Table 9, Table 10, Table 11 and Table 12 display the distribution of respondents across the variables and constructs covered in our survey (see column labeled “Sample”). Additionally, the proportion of respondents who expressed the intention to adopt an SH is provided in column “Intent”. Results for the constructs (see Table 7) are reported on a gray background.
Knowledge and preference variables. In all three knowledge and preference variables, we have reduced the original five-level answer scale to three levels: “poor”, “mediocre”, and “good”, or, respectively, “dislike”, “neutral”, and “like”. A value of “poor” (or, respectively, “dislike”) reflects the two lower levels of the original scale, “mediocre” (or, respectively, “neutral”) reflects the middle level, and “good” (or, respectively, “like”) reflects the two upper levels. This simplification reduces the number of categories for analysis and reduces the heterogeneity in the responses while grouping the clearly negative and positive responses.
The results indicate that a higher level of SH knowledge and preference for either of the two applications is linked to a higher intention to adopt an SH. For instance, there is an increase in intention to adopt an SH among those with a mediocre self-assessed knowledge level. Those with a “good” knowledge level have an 86.2% likelihood of being interested in SH technologies. With regard to the two SH applications examined, we find that a preference for either of the two is associated with higher SH interest. Respondents who like the convenience and health SH applications show an increased intention rate of 46.2 and 39.6 percentage points (p.p.), respectively, compared to those who dislike the applications. This finding is in line with the literature [33].
Socio-demographic variables. Variables that reflect a connection to the adoption intention are gender, age, education, and professional situation with male respondents, respondents aged between 45 and 54 years, having higher education, and being employed yielding higher rates. The important difference observed among genders is surprising as such variations have not been documented previously [32,52]. Considerable differences are also observed among age groups, with respondents older than 75 years showing a low level of interest compared to others. The adoption rate in terms of the professional situation has not been studied before: we observe differences between those employed and retired, as well as the group “others” consisting of the unemployed, homemakers, and those unable to work. Additionally, living with children in the same household is positively related to interest in an SH.
Active healthy aging variables. The social well-being dimension of the AHA concept (questions D6.1–D6.7) emerges as a prominent element associated with an increased intention to adopt an SH. We grouped the original levels of activities into three categories: “rarely” reflecting the two lower levels (“hardly ever”, “few times a year”), “regularly” the middle level (“1–2× month”), and “often” the two upper levels (“1× week”, “>1× week”). Those who often engage in cultural activities and go out with friends show a higher interest in SHs. Similarly, regular group sports involvement and educational courses are linked to an increased interest. From the dimension of mental well-being, the feeling of loneliness (two levels “rarely” and “often” aggregated from the four original categories) stands in a positive relationship with SH adoption, providing an addition to the existing literature. Meanwhile, other variables such as often engaging in very strenuous physical activity also have a moderate effect.
Technology and risk affinity variables. Overall, our data indicate that technology and risk affinity may be seen as important characteristics of a potential SH user. We reduced all variables within this topic from the original five-level scale to three levels (see also the discussion above). In the variables that measure the level of agreement with a certain statement (E1, E2, E4, and E5), the value “disagree” reflects the two lower levels, “neutral” reflects the middle level, and “agree” reflects the two upper levels. For the technology expertise (E3) and the risk-taking level (E6), the 2-1-2 aggregation logic is the same. In the remainder of this section, the same aggregation is applied for all agreement-related scales.
The greatest positive and negative association with the intention to adopt an SH can be observed in the opposing extremes. Regarding technology affinity, the willingness to experiment (see questions E1 and E2, difference of around 50 p.p. between disagreeing and agreeing subgroups) is more important than technology expertise (E3). For risk affinity, a concept commonly used in insurance studies, the question on risk-taking levels stands out, with rates of 63.9% for those willing to take risks and 36.4% for those who are not.
Insurance situation variables. In the insurance context, being a user of an insurance app is positively linked to SH adoption (60.3% against 39.1%). From the portfolio of existing insurance contracts, the presence of a life insurance policy is particularly notable (60.0% against 44.9%). Furthermore, we note rate increases related to the ownership of a travel or legal expenses insurance.

4.3.1. Evaluation of Prevention Benefits

Referring to Table 9, we observe that prevention benefits are perceived in particular within the field of safety. This is evident from the agreement of 71.8% of the respondents and the related high share of adoption intention (57.8%). Concrete prevention measures (see G2.2 and G2.3) are perceived more readily, as indicated by their higher sample share, compared to the abstract promise of safety provided by the technology (G2.1, lower sample share). Additionally, the increase in SH interest regarding safety is relatively small compared to other benefits perceived. Particularly high interest levels can be observed in those individuals that see SHs providing value in terms of health (intention in the construct: 72.5%) and fitness (77.3%). In both fields, control and feedback features tend to be perceived most readily (health monitoring, G3.2, and feedback on exercises, G4.2). Finally, it is worth mentioning that a considerable number of respondents see benefits in checking the health of other family members (G3.5).

4.3.2. Dimensions of SH Adoption

Table 10 presents the dimensions of SH adoption, which were derived from the elements described in Section 3.2. Since these dimensions have been studied in the literature, we situate our results therein.
Performance expectancy. Our study aligns with the idea that performance expectancy plays an important role for SH adoption [47]. A high level is linked to higher SH interest (construct intention: 73.8%). Among the individual items, several aspects stand out. In terms of sample size, the simplification of everyday activities (H1) and the possibility of saving money (H4) are potential benefits expected by the majority. These are followed by home monitoring features (H2).
Effort expectancy. In contrast, the role of effort expectancy appears to be less important. This contradicts, to some extent, the prevailing literature that lists effort expectancy as a key element influencing SH adoption alongside performance expectancy [13,35,39]. However, higher levels of effort expectancy are only moderately associated with increased SH interest (construct intention: 54.2%). Among the individual items, the results confirm these tendencies with no clear differences emerging in the individual aspects.
Facilitating conditions. Perceived facilitating conditions translate into higher SH interest (construct intention: 63.7%). However, a lack of them is associated with the lowest interest levels overall. The relevance of facilitating conditions is a debated topic in the literature. Some studies emphasize the importance of supportive roles, such as concierge [37,72], while others question it [22,38]. Among the individual items, the results are heterogeneous. In terms of sample size, considerable differences can be found with regard to the preference of the person or institution providing assistance. A large proportion would prefer to rely on professionals (questions J1–J3), while only around one third would turn to family and friends for help (J4–J5).
Social influences. Our data indicate meaningful social influences. When others encourage SH usage, respondents’ intention to adopt an SH is among the highest (85.1%). While the literature lacks a clear consensus on this matter, few studies suggest relatively little relevance [35,40]. In terms of sample size among the individual items, our results suggest that it is rather the influence of strong opinion makers (K1–K2) and less the image attached to the technology (K3–K4) that prevail.
Hedonic motivation. The data suggest likewise importance of perceived enjoyment and fun of using an SH. When hedonic motivators are present, SH interest tends to be very high, yielding an adoption rate of 81.9%. Moreover, a lack of such motivation is linked to very low interest levels. Therefore, perceived enjoyment associated with SH usage seems to emerge as a central element for generating interest, which is in line with recent evidence [22,36]. These patterns remain consistent among the individual items. In terms of sample size, we find indications that the majority associates SH usage with feelings of relief (arguments L3, L7, and L8) and curiosity (L4).

4.3.3. Risks and Costs

Table 11 and Table 12 present different facets of risks and barriers associated with SHs, as well as how insurance variables are linked to interest in SH technologies.
Perceived risks. The higher the perceived risks, the lower the interest in SHs. Among the risks examined, costs considerations stand out, corresponding to an adoption rate of 38.6% at the construct level. This finding contradicts the prevailing literature, which tends to downplay their importance [6,18]. Furthermore, we observe that privacy risks, while attracting attention, have a less negative association (construct intention: 42.3%) than suggested by the literature [47]. In comparison to cost considerations or risks related to increased dependence, privacy concerns seem less salient. Other risks that have not been extensively studied in earlier research are also perceived. Although these risks are reported less frequently (8.8%), they clearly reflect a negative association with interest in SHs. Overall, we observe that perceived risks stand in a negative relationship to SH adoption intention, but their relevance seems to be lower when compared to the consequences of low facilitating conditions or low hedonic motivation.
Insurance costs and services. Cost aspects of a potential insurance offering appear to have a limited link to SH interest (construct intention: 60.0%). The link between the perceived value of insurance services related to prevention and SH interest is stronger (64.8%). This observation is noteworthy for SHs, as financial rewards have been found to be more important than service aspects in other IoT insurance areas (e.g., telematics and wearables [68,73]). Finally, we note that those interested in an SH insurance offering reflect a clearly higher intention to adopt SHs (82.5%). This value increases by 60 p.p. when compared to those who show no interest in obtaining such insurance.

4.4. Regression Analysis

Building upon the binary variable definition regarding the intention to adopt an SH (Section 4.1), and extending the descriptive statistics presented above (Section 4.3), we propose to perform regression analyses. These analyses assist in identifying the relevant relationships and the significance of the associations between the intention to adopt an SH and the studied variables. The modeling results supplement the previous descriptive statistics. We follow the identical procedure for simplifying the scale as detailed in the previous section and apply the specified categories to all variables examined. We distinguish three sets of variables. First, we consider the set of variables related to SH service and prevention areas (parts G to N of the questionnaire), which we have grouped into 16 constructs (see Table 7 in Section 4.2). Second, we concentrate on the 13 AHA variables among the user characteristics (part D of the questionnaire). Third, we consider all other characteristics explained by 30 variables (parts A to C and E to F of the questionnaire).
For each of the three variable sets, we build a generalized linear regression model for the response variable “intention to adopt SH”, which responds to the estimation of the following equation through all responses i:
g ( intention to adopt SH i ) = β 0 + X V β X X i + ϵ i ,
where g ( · ) denotes the link function, β 0 the base coefficient (intercept), and β X the vector of coefficients estimated for the non-baseline categories of each variable X in V , where V is the set of variables included in the model. ϵ i is the error term. For each survey response, β X and X i are vectors of dimension c X 1 , where c X is the number of categories in X .
Using Akaike’s information criterion (AIC), we find that the logit link function fits the models slightly better than the probit link function. Therefore, we select the logit link function for g. The results of the analyses using the three full sets of variables are reported in Table A2, Table A3 and Table A4 in Appendix D. To identify the primary drivers of the response, a forward and backward stepwise selection algorithm based on the AIC measure is employed. We derive reduced models, retaining only those variables that improve the models. Using the logit link function, the reduced models contain eight, four, and twelve variables, respectively. We report the results, including the relevant variables, coefficients, and significance levels, in Table 13, Table 14 and Table 15.
When examining the set of variables related to SH services and prevention, both hedonic motivation and interest in SH insurance offerings emerge as highly significant factors (see Table 13). The former highlights the important role of enjoyment in promoting SH adoption. In addition, facilitating conditions and social influences also have a notable impact on SH adoption, highlighting the importance of accessible support and peer influences. The health benefits illustrate the important role of health-related factors in our SH study. Conversely, cost-related and other risk factors pose significant challenges as barriers to SH adoption.
Regarding AHA, the physical, mental, and social dimensions are all important in shaping SH adoption (see Table 14). In particular, engagement in social activities, especially those involving higher levels of going out with friends and cultural activities, have significant effects. Although less prominent, both loneliness and physical activity also contribute to higher SH interest, representing the mental and physical dimensions of AHA, respectively.
Among the other factors related to personal characteristics, knowledge and preference-related variables are identified as significant drivers of SH interest (see Table 15). The knowledge variable has a significant effect even at the medium categorical level (“mediocre”). In addition, factors related to technology and risk affinity play an important role in promoting the adoption of an SH. Specifically, variables related to technology experimentation are a key component. Gender is also significant, as males show a greater interest in SHs. Furthermore, an individual’s intention to adopt is influenced by additional socio-demographic factors such as age, home ownership, marital status, and life insurance ownership.

5. Discussion and Implications

In this research, we have examined SH adoption and considered the value of SH technologies in active aging and prevention. Within the prevention context, safety aspects receive the highest level of agreement, suggesting that safety could serve as a door opener for promoting adoption. The positive relationship between prevention-related benefits and interest in SHs holds for all benefits examined. Notably, it is particularly pronounced for fitness and health. From the regression analyses, we learn that health-related benefits in particular have a significant impact on older adults’ intention to adopt an SH and are therefore particularly important in our SH context.
Second, we find that the integration of the AHA concept proves valuable. The AHA concept provides relevant parameters for future characterizations of older individuals with an interest in SHs. In this context, we observe that socially engaged individuals show higher levels of interest in SH technologies. Although at a lower level compared to other socio-demographic variables, the physical and mental dimensions of the AHA concept can also potentially be used for characterization (e.g., high physical activity and reported loneliness). The AHA parameters provide a positive and active view of the aging process. They also suggest that individuals who age actively tend to have higher rates of adoption of SHs. Therefore, it can be argued that SHs may be associated with an active and healthy lifestyle.
Third, we point to additional characteristics of potential SH users aged 45 and older: knowledge level, technology affinity, and risk affinity. The latter has not been previously discussed as a variable for SH adoption. In addition, we find typical socio-demographic variables that are further associated with a higher SH interest. Gender, age, home ownership, marital status, and ownership of life insurance policies are the most relevant. Gender differences are particularly pronounced, which has only been observed in another study [52]. This raises the question as to whether certain SH service areas are gendered among older adults, possibly influenced by (Swiss) cultural aspects [13]. Furthermore, we observe that the influence of age does not seem to be as strong as suggested by existing research.
Fourth, we contribute to the literature by examining the factors influencing SH adoption by reflecting on these relationships and providing initial evidence on understudied elements. Our findings suggest a strong relationship between the fun and enjoyment associated with the technology and higher adoption intentions. Older individuals who expect to enjoy using SHs express higher levels of interest, while those who do not expect to enjoy it report no interest. The literature also recognizes the importance of hedonic motivators for SH use [36], an aspect that has only recently been systematically addressed in academic studies [20]. Additionally, we observe that perceived risks are associated with lower SH interest. In particular, perceived risks related to costs and emerging aspects of SH technology seem to play a role in this context, which is in line with [35]. In contrast, privacy concerns appear to have less influence than previously described by [31]. Finally, under the assumption of an SH-based insurance offer, we find a positive relationship between higher adoption intention and interest in preventative insurance services as well as overall interest in SH insurance.

6. Conclusions, Limitations, and Future Research

SH technologies aim to improve the quality of life at home by providing various services related to the area of energy, health, safety, and comfort. Changing demographics combined with a preference to age at home and increasing digital affinity are some of the aspects that invite one to study the adoption of SH among older individuals. The existing literature primarily takes a disease-centered approach to aging. The value of an SH as an enabler of active and healthy aging based on prevention paradigms has not yet been explored. We contribute to filling this gap by developing a survey that integrates AHA variables and prevention benefits related to daily life at home. Our results strongly suggest that most older adults recognize the preventive benefits of SHs, especially in the areas of safety and health. Adoption intention varies based on user characteristics such as knowledge, technology and risk affinity, and gender. By integrating parameters related to AHA, we connect social engagement and hedonic motivators to increased interest in the technology. Cost and other barriers to SH interest are also examined. Overall, this paper presents a novel approach to studying SH adoption among older adults by integrating previously unstudied AHA parameters and preventive benefits. Our main contribution is promoting a positive perception of SHs as a valuable tool for enabling a proactive lifestyle to prevent risks among aging individuals. Unlike previous studies that often focus on support systems for frailty in old age, we expand the narrative beyond the traditional view of SHs as reactive solutions for aging-related challenges. Hence, while validating established drivers, our approach offers a first look at the relative importance of previously unstudied factors that contribute to the interest in using SHs.
Although our results are preliminary, they form the foundational backbone for future research in this area. An important avenue would be to validate the importance of our findings in actively aging individuals via comprehensive econometric analyses, such as structural equation modeling. These models could help to elucidate the factors behind the uptake of SH technologies, and enable the development of detailed profiles of potential older adopters. Future research may also benefit from the inclusion of qualitative methods, such as focus group discussions, to gain a richer understanding of the underlying nuances and dynamics of specific factors of interest in the context of aging. Altogether, this research facilitates future analyses to assess the significance of prevention in SHs. Our findings indicate a considerable importance of safety- and health-related factors while emphasizing the most readily perceived risks. The ability to identify and compute risks is a fundamental aspect in the development of effective prevention strategies. Our work can establish the groundwork for future research that concentrates on designing risk assessment techniques suitable to a technological context and can serve as a starting point for improving safety in the home through the use of SHs.
While our study aims to fill an important research gap, it is imperative to acknowledge its limitations. The susceptibility of our data to biases such as self-report and social desirability could impact their accuracy and reliability. Additionally, since the survey was administered only once, the absence of a temporal dimension in our research restricts our ability to establish causal relationships rather than just associations. In addition, our analysis solely concentrates on Switzerland. Although some discoveries might be relevant to other European countries with similar socioeconomic characteristics, our results cannot be directly generalized to a global context.

Author Contributions

Conceptualization, R.I., J.W. and A.Z.R.; methodology, R.I. and J.W.; investigation, R.I. and A.Z.R.; formal analysis, R.I., J.W. and A.Z.R.; data curation, R.I.; writing—original draft preparation, R.I.; writing—review and editing, R.I., J.W. and A.Z.R.; supervision, J.W. and A.Z.R. All authors have read and agreed to the published version of the manuscript.

Funding

This research was funded by the Swiss National Science Foundation grant number 100013_207710. SWICA Healthcare Insurance, Ltd., Switzerland, has funded the survey costs of the professional polling agency.

Institutional Review Board Statement

The study is out of scope of the Swiss Human Research Act and received a waiver from the ethics committee of ZHAW School of Management and Law.

Informed Consent Statement

Written informed consent was obtained from all survey participants.

Data Availability Statement

The data presented in this study are being prepared for open access [58].

Conflicts of Interest

The authors declare no conflicts of interest.The funding sponsors had no role in the design of the study; in the collection, analyses, or interpretation of data; in the writing of the manuscript, and in the decision to publish the results.

Abbreviations

The following abbreviations are used in this manuscript:
AHAActive Healthy Aging
CHERRIESChecklist for Reporting Results of Internet E-Surveys
SHSmart Home
TAMTechnology Acceptance Model
UTAUTUnified Theory of Acceptance and Use of Technology

Appendix A. Questionnaire

  • Part A: Introduction
A “smart home” is a connected and intelligent home. Examples of smart homes are home systems with temperature controllers, door sensors, lighting systems, robotic vacuum cleaners, or even fitness exercises on the TV or video consultation with a doctor. Typically, a smart home is digital and can often be controlled remotely via a mobile phone.
With the following survey, we investigate the interest for different smart home systems. Specifically, questions regarding benefits, design and risks are asked.
A1: Knowledge level. Which best describes your knowledge of smart home?
Answer options: five levels from no knowledge to very good knowledge.
A2: Age. Please state your exact age. Numeric answer.
A3: Gender. Please state your gender.
Answer options: female; male; diverse; prefer not to reply.
  • Part B: Smart home scenario
In the following you will find a smart home scenario based on two examples.
Example 1: Sensors in the housing. Sensors can already detect power consumption, temperature and humidity as well as movements. They are permanently on and can be controlled in real time via mobile phone. This makes it easy to adjust the room climate, control power consumption, alert for dangers such as a break-in, or allow access to neighbors when one is absent.Smartcities 07 00015 i001
Note: The above visualization is used from this point on throughout the survey, pinned on the top of the screen.
Example 2: Mobile health devices. They are compact devices, similar in size to a tablet, that enable health monitoring through integrated cameras and measuring devices. These devices are activated only when necessary, providing access to new health services. Fitness assessments and routine examinations can be conducted from the comfort of one’s home, while spontaneous inquiries can be addressed through video calls.
B1: Convenience application. How do you like the “sensors in the housing” example?
Answer options: five levels from dislike to like.
B2: Health application. How do you like the “mobile health devices” example?
Answer options: five levels from dislike to like.
  • Part C: Socio-demographic profile
C1: Education. Please indicate your highest professional or higher education.
Answer options: mandatory school; high school or professional education; higher education.
C2: Income sufficiency. Thinking of your household’s total monthly income, would you say that your household is able to make ends meet…?
Answer options: with great difficulty; with some difficulty; fairly easily; easily.
C3: Expense capacity. Could your household afford to pay an unexpected expense of CHF 2’400 without borrowing any money?
Answer options: yes; no.
C4: Professional situation. Which of the following options best describes your current employment situation?
Answer options: retired; employed/part-time employed or self-employed (including in the family business); unemployed; homemaker; permanently unable to work due to illness or disability.
C5: Home ownership. Do you live in a rental or owned property? Indicate cooperative housing as rent.
Answer options: rent; ownership.
C6: Household situation. Who lives in your household? Please select all applicable options.
  • C6.1: Marriage/partnership. Spouse or partner
  • C6.2: Single household. Live alone
  • C6.3: Other household. Roommate
  • C6.4: Household with kids. Children
  • C6.5: Other household. Grandchildren
  • C6.6: Other household. Parents
Answer options for each household composition: yes; no.
  • Part D: Active healthy aging
D1.1: Mildly strenuous activities. How often do you perform activities that are mildly strenuous (e.g., light gardening, washing the car or going for a walk)?
Answer options: hardly ever; once to twice per month; once per week; more than once a week.
D1.2: Really strenuous activities. How often do you perform activities that are really strenuous (e.g., fitness group classes like Zumba, jogging/running, intense strength or endurance training, heavy gardening)?
Answer options: hardly ever; once to twice per month; once per week; more than once a week.
D2: Frailty. Please indicate whether you have any difficulty doing one of the following everyday activities: getting up from a chair after sitting for long periods, lifting or carrying a heavy bag of groceries, picking up a small coin from a table. (Exclude any difficulties that you expect to last less than three months.)
Answer options: yes; no.
D3: Satisfaction with life. On a scale from “1” to “5” where “1” means completely dissatisfied and “5” means completely satisfied, how satisfied are you with your life?
Answer options: five levels from 1 to 5.
D4: Depressive symptoms. In the last month, have you been sad or depressed? (Clarification: by sad or depressed, we mean miserable, in low spirits, or blue.)
Answer options: yes; no.
D5: Loneliness. How much of the time do you feel you lack companionship?
Answer options: almost never/never; once to twice per month; once a week; more than once a week.
D6: Social well-being. Which of the following activities have you done how often in the past twelve months?
  • D6.1: Cultural activity level.
    Cultural activities with friends or like-minded people (theater visits, city trips, etc.)
  • D6.2: Group sports involvement.
    Group sports activities (fitness group classes, hikes, bike tours, etc.)
  • D6.3: Educational courses.
    Attendance of an educational or training course
  • D6.4: Voluntary work.
    Voluntary or charity work
  • D6.5: Club activity level.
    Participation in club activities (local hometown club, sports club, etc.)
  • D6.6: Outing level.
    Going out with friends (dinners, cooking evenings, etc.)
  • D6.7: Active grandparent.
    Helping others (looking after grandchildren, caring for relatives, etc.)
Answer options for each activity type: hardly ever; few times per year; once to twice per month; once per week; more than once a week.
  • Part E: Technology and risk affinity
Please state your level of agreement with the following statements.
E1: Technology experimenter.
If I heard about a new information technology, I would look for ways to experiment with it.
Answer options: five levels from strongly disagree to strongly agree.
E2: Technology pioneer.
Among my peers, I am usually the first to explore new information technologies.
Answer options: five levels from strongly disagree to strongly agree.
E3: Technology expert.
How would you rate your skills using a smartphone or tablet?
Answer options: poor (I have never used one); fair; good; very good; excellent.
E4: Mistake avoider.
If I could possibly make a mistake with a new product, I don’t use it.
Answer options: five levels from strongly disagree to strongly agree.
E5: Familiarity preferer.
I prefer to visit places where I know what I’m getting rather than trying new things (e.g., going to the hairdresser, restaurants in my area, or hotels on vacation).
Answer options: five levels from strongly disagree to strongly agree.
E6: Risk-taking level.
How do you see yourself personally: Are you generally a risk-taker or do you try to avoid risks? (“1” = not at all willing to take risks; “5” = very willing to take risks.)
Answer options: five levels from 1 to 5.
  • Part F: Insurance situation
F1: Insurance portfolio. Which of the following insurance products do you have?
  • F1.1: Suppl. health insurance
    Supplementary health insurance (in addition to mandatory health insurance)
  • F1.2: Motor vehicle insurance Motor vehicle insurance
  • F1.3: Travel insurance Travel insurance
  • F1.4: Liability insurance Liability insurance
  • F1.5: Life insurance Life insurance
  • F1.6: Household insurance Household insurance
  • F1.7: Legal expenses insurance Legal expenses insurance
  • F1.8: Other insurance Other: [Free text as answer option.]
Answer options for each insurance type: yes; no.
F2: Insurance app in use.
Do you use an app from your insurance company?
Answer options: yes; no.
  • Part G: Evaluation of prevention benefits
I expect smart home to be useful, …
G1.1: Burden relief.
…to reduce my burden of certain household activities (e.g., cleaning or maintaining household).
G1.2: Home information.
…because it provides me with valuable information and control options about the state of my home (e.g., which appliances are on/off).
G1.3: Value enhancement.
…because it contributes to maintaining or increasing the value of my property.
G2.1: Sense of safety.
…because it makes me feel safe.
G2.2: Security booster.
…because it increases my home security (e.g., burglary).
G2.3: Risk protection.
…because it protects me against certain risks at home (e.g., fire or gas).
G3.1: Health maintenance.
…because it allows me to take better care of my health and thus avoid a visit to the doctor.
G3.2: Health monitoring.
…because it allows me to easily monitor my health metrics (e.g., daily activity or blood pressure).
G3.3: Health encouragement.
…because it motivates me to behave healthier (e.g., watch less TV or go to bed earlier).
G3.4: Accident prevention.
…because it can help to prevent accidents (such as falls) or other health risks.
G3.5: Family well-check.
…because I can check if family and friends are doing well (e.g., notification if a person falls at home).
G4.1: Automated fitness.
…because I automatically do something for my fitness.
G4.2: Exercise feedback.
…because I get immediate feedback on fitness exercises that I can do on my own at home.
G4.3: Movement motivation.
…because it motivates me to move about more.
G4.4: Socializing opportunity.
…because it allows me to meet new people (e.g., for training groups or competitions).
Answer options for each statement: five levels from strongly disagree to strongly agree.
  • Part H: Performance expectancy
I expect smart home to be useful, …
H1: Everyday simplification.
…because it simplifies everyday life.
H2: Home monitoring.
…because it allows me to monitor state or progress effectively.
H3: Activity motivation.
…because it can motivate me to do certain activities that I otherwise don’t like to do.
H4: Money saving.
…because I save money with it (e.g., on heating/electricity costs or healthcare expenses).
H5: Social connectivity.
…because it allows me to stay in touch with family and friends.
H6: Shared access.
…because I could give access to others when needed (e.g., to a neighbor when I’m away on vacation or to my primary care physician to send health data).
Answer options for each statement: five levels from strongly disagree to strongly agree.
  • Part I: Effort expectancy
It is very important that smart home …
I1.1: Easy to use.
…is easy to use.
I1.2: Intuitive.
…is intuitively understandable.
I1.3: Easy to learn.
…is easy for me to learn.
I1.4: Quickly usable.
…is designed in such a way that I can get it right quickly.
I2.1: Customizable.
…allows me to customize for myself.
I2.2: Tailored.
…is tailored to me with appropriate content and functions.
I3.1: Trustworthy.
…is trustworthy.
I3.2: Warrantied.
…is backed by warranties from credible manufacturers.
I4.1: Autonomous.
…is usable without consulting others (friends or experts).
I4.2: Seamless.
…can be used independently and without major problems.
Answer options for each statement: five levels from strongly disagree to strongly agree.
  • Part J: Facilitating conditions
With regard to my capabilities, …
J1: Availability of usage instructions.
…I assume that instructions on how to properly use smart home will be available.
J2: Availability of a professional for questions.
…I should be able to contact a professional if I have any questions.
J3: Availability of a professional when problems.
…I assume that a professional will be available to help with system problems.
J4: Availability of close people.
…I can turn to people around me if I have difficulties using smart home.
J5: Availability of colleagues/friends.
…I assume that colleagues or friends will be happy to support me in how to use smart home.
J6: Availability of own knowledge.
…I have the knowledge required to use a smart home.
J7: Fit to daily life.
…it is very important that smart home fits well into my daily life today.
J8: Fit to household.
…it is very important that smart home fits well with the way I organize my household (apartment/house).
Answer options for each statement: five levels from strongly disagree to strongly agree.
  • Part K: Social influences
Please state your level of agreement with the following statements.
K1: Meaning to important others.
People that are important to me think that I should use smart home more.
K2: Meaning to opinion makers.
People whose opinions I value prefer that I use smart home.
K3: Prestigious image.
People who use smart home have a more prestigious image than people who do not.
K4: Modern image.
People who use smart home are modern.
Answer options for each statement: five levels from strongly disagree to strongly agree.
  • Part L: Hedonic motivation
I think using smart home …
L1: Entertaining.
…is entertaining.
L2: Enjoyable.
…would be enjoyed by me.
L3: Convenient.
…is convenient.
L4: Curiosity-inducing.
…arouses my curiosity.
L5: Versatile.
…is versatile.
L6: Fun.
…is fun.
L7: Pleasant.
…would please me.
L8: Relieving.
…brings me relief.
L9: Trending.
…helps me to be at the pulse of time.
L10: Variegating.
…leads to more variety in everyday life.
Answer options for each statement: five levels from strongly disagree to strongly agree.
  • Part M: Perceived risks
I have concerns …
M1.1: Dependence.
…about becoming dependent on technology and how it works.
M1.2: Loss of control.
…that I can’t control a smart home on my own and could lose control.
M2.1: Costs exceeding benefits.
…that the costs might exceed the benefits.
M2.2: Expensive maintenance.
…that smart home could be expensive to purchase and maintain.
M3.1: Data misuse.
…that information collected from smart home, could be misused.
M3.2: Data used unforeseeable.
…that the information I disclose could be used in a way I cannot foresee.
M4.1: Overwhelming.
…that using smart home might overwhelm me.
M4.2: Cumbersome.
…that using smart home could be cumbersome.
M5: Go less out of house.
…that I might get out of the house less when living in a smart home.
M6: Non-essential luxuries.
…that smart home could be a non-essential luxuries.
M7.1: Source of problems.
…that the use of smart home could lead to problems.
M7.2: Insecure.
…that a smart home could be insecure.
M8.1: Replace contact with others.
…that using smart home could replace contact with others (e.g., family or friends).
M8.2: Lack of human interaction.
…that the use of smart home could result in a lack of human interaction.
Answer options for each statement: five levels from strongly disagree to strongly agree.
  • Part N: Insurance costs and services
Suppose you could get smart home services from an insurance company. The insurance company provides such services because they prevent accidents and contribute to home security. However, this implies a willingness to share data with the company.
In the case of a smart home insurance offering, …
N1: Discount on insurance premium.
…I would expect to receive a discount on the insurance premium (e.g., on homeowner’s or health insurance).
N2: Automatic premium adjustment.
…I would expect the price of the insurance to adjust automatically (e.g., if during the vacations the lights simulate home presence).
N3: Reimbursement of purchase costs.
…I would expect the insurance company to cover the cost of purchasing the smart home device.
N4: Advice from insurer.
…I would expect the insurance company to provide me with information and advice on how to make my home safer, better, and healthier to live in.
N5: Early warning from insurer.
…I would expect the insurance company to give me early warning regarding incipient risks (e.g., open garage, water damage, or lack of exercise).
N6: Individual offers from insurer.
…I would expect the insurance company to provide me with offers that match my interests (e.g., discount on humidifiers due to room temperature or energy-saving light bulbs due to electricity consumption).
N7: Future smart home insurance intention.
I intend to use a smart home insurance offering in the future.
N8: Future smart home insurance plan.
Given the chance, I plan to use a smart home insurance offering in the near future.
Answer options for each statement: five levels from strongly disagree to strongly agree.
  • Part O: Intention to adopt smart home
Finally, we are interested to know if you intend to use smart home. Please indicate the level of agreement on the following final statements, with the two smart home examples in mind, and detached from the insurance context.
O1: Intended usage.
I intend to use smart home in the future.
O2: Predicted usage.
I predict I would use smart home in the future.
O3: Opportunistic usage.
If the opportunity presents itself in the near future, I will use smart home.
Answer options for each statement: five levels from strongly disagree to strongly agree.

Appendix B. Pre-Test Protocol

  • Phase 1
The questionnaire was tested in four interviews, with participants filling out the questionnaire while reading it aloud and noting incomprehensible parts, followed by a discussion on these issues after completion of the questionnaire. The smart home knowledge of interviewees was rated on a five-level-Likert scale (no knowledge; little knowledge; fair knowledge; good knowledge; very good knowledge).
The interview details are as follows:
Interview dateInterviewee’s genderInterviewee’s age (years)Interviewee’s smart home knowledgeInterview duration (minutes)
4 February 2022female57no25
5 February 2022male54good15
6 February 2022female62fair25
6 February 2022male61fair20
The modifications in the questionnaire resulting from the interviews were the following:
  • Changed introductory part of the questionnaire by adding a few simple “icebreaker” questions (e.g., age and gender) to build a flow, in replace of an abstract smart home scenario description at the beginning.
  • Questions on social well-being (cf. questions D6.1 to 6.7) extended by the answer option “few times per year” to a five-level-Likert scale.
  • Added a question regarding home ownership (question C5).
  • Minor wording adjustment in the insurance part N.
  • Phase 2
In this phase, we ran a test with 50 respondents online via a third-party provider (Bilendi, 17 March 2022). The following fields for feedback were included in the questionnaire (but not included in the final questionnaire):
  • Question on the comprehensibility of the smart home examples, measured using a five-level-Likert scale ranging from 1 (not comprehensible) to 5 (comprehensible).
  • If comprehensibility of the smart home examples was rated 1 or 2, an open comment box requested information on how comprehensibility can be improved.
  • One open comment box at the end of parts L and N requested information on how comprehensibility can be improved regarding the “dimensions of SH adoption” and “risks and costs”, respectively.
The characteristics of the respondents are as follows:
Age class (years)GenderNumber of responses
45–54female8
45–54male9
55–64female6
55–64male9
65-74female9
65–74male8
75+male1
The modifications in the questionnaire resulting from the collected responses were the following:
  • Added question regarding safety benefits (questions G2.1 and G2.2) because of the high agreement in all safety related questions.
  • Changed title of smart home example 1 (question B1) to “Sensors in the housing” because of feedback that the original title (“Permanently installed sensors”) was associated to elevated installation efforts and would not suit tenants.
  • Removed the question “Are facilities and services such as a doctor, pharmacy, or shopping available at your residence (or within 15 minutes driving distance)?” because of a 96% “yes” quota.

Appendix C. Checklist for Reporting Results of Internet E-Surveys (CHERRIES)

The following Table A1 reports the sample selection and development process of the survey used in this paper according to the CHERRIES guideline [57]. We italicize statements that appear in the body of the text and place them in quotation marks.
Table A1. CHERRIES checklist.
Item CategoryChecklist ItemReference Location and/or Notes
DesignDescribe survey design“We applied filters based on age (≥45 years, aligning with the research focus on AHA), quotas (67:33 ratio for German and French-speaking regions in Switzerland; 50:50 for female and male; 30:30:30:10 for age groups 45–54, 55–64, 65–74, and over 75 years; 10:90 for participants without and with SH knowledge, respectively), and conducted quality checks throughout the survey using control questions.”
Institutional Review Board (IRB) approval and informed consent processIRB approvalEthics approval was submitted to the ad hoc commission of the ZHAW School of Management and Law and resulted in a waiver on 13 January 2022.
Informed consentThe first page, which asked for informed consent in order to participate in the survey, was the following:
    Welcome to the study on the benefits of smart home systems. This study is conducted by the Institute for Risk and Insurance at the ZHAW School of Management and Law. The survey is strictly confidential and only the ZHAW project team has access to the data collected. All your data will be collected anonymously and cannot be assigned to you personally. If you have any questions, please do not hesitate to contact the university team (project team contact details provided). I agree that my personal data will be processed in accordance with the information provided here. (Yes/No opt-in box provided)
Data protectionAccess to the data set was limited to the authors of this paper. The polling agency also did not have access to the data set. Further, the data were fully anonymized and no data collected could give an inference to an individual person. Data were stored according to best practice guidelines of the Swiss National Science Foundation (SNSF). Access was given only to team members, managed on internal university GitHub, summarized exclusively in aggregated form, and participants could request to have raw data deleted.
Development and pre-testing. Recruitment process and description of the sample having access to the questionnaireDevelopment and testing“Prior to its distribution, we conducted a pilot test with individuals who met the eligibility criteria to ensure comprehensibility, usability and technical functionality (see the test protocol in Appendix B)”
Open survey versus closed surveyThe survey was open. Since we worked with a polling agency, most of the respondents were prompted by them to complete our questionnaire.
Contact mode/Advertising the survey“The survey was conducted online in March 2022 using the Unipark software and administrated by a professional polling agency responsible for participant recruitment. Participants were provided financial incentives for successful completion and only given the title of the survey when first contacted.”
Survey administrationWeb/E-mailThe survey was created and managed with Unipark. All valid responses were collected via this website.
ContextThe survey was not posted on any other website. See Checklist item “Contact mode” and “Advertising the survey” for more information on the polling agency.
Mandatory/voluntaryParticipation was voluntary and participants could opt out at any point of the survey. See Checklist item “Incentives” for more information.
IncentivesThe polling agency offered monetary incentives for successful completion. We were given a price per valid participant of EUR 5.70 . However, we do not know the effective amount received by the participants. We were not charged for invalid answers (filter criteria and control questions). Therefore, we placed the filter questions at the beginning of the survey and the control questions throughout the questionnaire.
Time/Date“The survey was conducted online in March 2022 using the Unipark software and administrated by a professional polling agency responsible for participant recruitment.” The exact period was 19–29 March 2022.
Randomization of items or questionnairesAll items were randomized, except for the questions regarding personal characteristics of the respondent (part A–F of the questionnaire) and the final statements on intention to use a smart home (part O).
Adaptive questioningNo adaptive questioning or follow-up questions were used.
Number of Items“The core of the survey contains 122 questions organized into four categories (personal characteristics, evaluation of prevention benefits, dimensions of SH adoption, risks and costs) and 15 topics labeled from A through O.”
Number of screens (pages)A maximum of 15 items were queried on a page in order to keep usability high, resulting in 15 pages/screens.
Completeness checkThere was no completeness check at the end of the survey. However, Unipark made it possible to force an answer on certain questions. We chose to perform this for all items in the main part (parts G to O of the questionnaire).
Review stepThe back button was enabled throughout the questionnaire. No review functionalities were activated.
Response ratesUnique site visitorView rates were defined as those who opened the survey and viewed/loaded the first page of the survey, which was the informed consent page. Visitors were tracked using Unipark’s multiple standard cookies for tracking website visitors.
View rateNot applicable.
Participation rate“A total number of 2553 participants were recruited, with 2490 agreeing to participate. […] The final sample consists of 1515 valid responses.” Details: N = 2553 participants, 63 disagreed on informed consent page, 409 screened out because of filter questions, 566 screened out in control questions. Total valid participants: N = 1515 .
Completion rate 1515 / 2490 = 60.8 %
Preventing multiple entries from the same individualCookies usedVisitors were tracked using Unipark’s multiple standard cookies for tracking website visitors. Duplicate entries were prevented by restricting user access to only one completion.
IP checkUnipark generates a unique session ID for each respondent on the basis of different cookies and IP tracking. We checked for duplicate entries, which would have been eliminated.
Log file analysisNone.
RegistrationThe survey was publicly accessible and no registration was necessary. However, polling agencies typically work on their own platform where users can track participation in different polls. We do not know the exact mechanism that our polling agency applied.
AnalysisHandling of incomplete questionnairesOnly complete questionnaires were analyzed.
Questionnaires submitted with an atypical timestampThe response time averaged 18 min and 57 s, with a median of 16 min and 57 s. Cut-off points for responses that were “too long” or “too short” were not used due to presumed differences in the target groups’ technological competence for online questionnaires. Instead, we made use of control questions to test whether the survey was actively and consciously completed.
Statistical correctionIn terms of representativeness, we did not prioritize achieving a defined margin of error. This decision was based on several factors. First, representativeness was not the primary goal; rather, our focus was to conduct exploratory research on SH adoption with a focus on prevention. Second, recruiting the target population, especially those 75 years and older, through an online survey inherently introduces non-representativeness and selection bias. Finally, in our exploratory research, we emphasized the comprehensibility of the questionnaire, appropriate framing in the scenario section, and ensuring respondent engagement usage of control questions. Therefore, we did not adjust for the non-representativeness of the sample, and this fact must be kept in mind when analyzing the results.

Appendix D. Regression Analyses

As a supplement to the results of the regression analyses presented in Section 4.4, we report here the regression coefficients and significance levels of the logit regression model when applied to the full set of variables related to the SH service and prevention areas (16 constructs, Table A2), the AHA characteristics (13 variables, see Table A3), and the remaining user characteristics (30 variables, see Table A4).
Table A2. Results of the logit regression on all constructs (parts G to N of the questionnaire).
β -Estimatep-ValueSig.
Intercept−2.463<0.001***
Comfort benefits (G1.1–G1.3, baseline: disagree)
    Neutral0.1350.611
    Agree0.2070.491
Safety benefits (G2.1–G2.3, baseline: disagree)
    Neutral0.1920.584
    Agree0.2830.428
Health benefits (G3.1–G3.5, baseline: disagree)
    Neutral0.5010.020*
    Agree0.2730.340
Fitness benefits (G4.1–G4.4, baseline: disagree)
    Neutral−0.3350.083.
    Agree−0.1080.721
Performance expectancy (H1–H6, baseline: disagree)
    Neutral0.0190.947
    Agree0.1480.655
Effort expectancy (I1.1–I4.2, baseline: disagree)
    Neutral−1.0090.169
    Agree−0.9550.184
Facilitating conditions (J1–J8, baseline: disagree)
    Neutral1.5280.013*
    Agree1.6010.011*
Social influences (K1–K4, baseline: disagree)
    Neutral0.3230.058.
    Agree0.4950.153
Hedonic motivation (L1–L10, baseline: disagree)
    Neutral1.359<0.001***
    Agree2.376<0.001***
Increased dependence (M1.1–M1.2, baseline: disagree)
    Neutral−0.2450.168
    Agree0.0670.781
Costs (M2.1–M2.2, baseline: disagree)
    Neutral−0.7060.011*
    Agree−0.987<0.001***
Privacy (M3.1–M3.2, baseline: disagree)
    Neutral0.4820.056.
    Agree0.3600.107
Other risks (M4.1–M8.2, baseline: disagree)
    Neutral−0.696<0.001***
    Agree−1.0590.003**
Insurance costs (N1–N3, baseline: disagree)
    Neutral−0.0920.690
    Agree−0.3110.221
Insurance prevention services (N4–N6, baseline: disagree)
    Neutral−0.2040.354
    Agree0.1800.453
Interest for insurance offering (N7–N8, baseline: disagree)
    Neutral0.679<0.001***
    Agree1.812<0.001***
Note: the significance levels are: . p < 0.1 , * p < 0.05 , ** p < 0.01 , *** p < 0.001 .
Table A3. Results of the logit regression on all active healthy aging variables (part D of the questionnaire).
β -Estimatep-ValueSig.
Intercept−0.8570.007**
Mildly strenuous activities (D1.1, baseline: rarely)
    Often−0.0030.983
Really strenuous activities (D1.2, baseline: rarely)
    Often0.2130.099.
Frailty (D2, baseline: no)
    Yes0.0350.808
Satisfaction with life (D3, baseline: dissatisfied)
    Neutral0.2790.341
    Satisfied0.3710.199
Depressive symptoms (D4, baseline: no)
    Yes0.1180.393
Loneliness (D5, baseline: rarely)
    Often0.3480.063.
Cultural activity level (D6.1, baseline: rarely)
    Regularly0.3530.020*
    Often0.4430.098.
Group sports involvement (D6.2, baseline: rarely)
    Regularly0.1520.429
    Often−0.2290.146
Educational courses (D6.3, baseline: rarely)
    Regularly0.2510.307
    Often−0.1970.412
Voluntary work (D6.4, baseline: rarely)
    Regularly−0.0140.949
    Often0.0300.883
Club activity level (D6.5, baseline: rarely)
    Regularly−0.0050.980
    Often0.2370.229
Outing level (D6.6, baseline: rarely)
    Regularly0.3370.010*
    Often0.4530.013*
Active grandparent (D6.7, baseline: rarely)
    Regularly0.0540.730
    Often−0.0110.936
Note: the significance levels are: . p < 0.1 , * p < 0.05 , ** p < 0.01 , *** p < 0.001 .
Table A4. Results of the logit regression on all other personal characteristics variables (parts A to C and E to F of the questionnaire).
β -Estimatep-ValueSig.
Intercept−2.4300.002**
Knowledge level (A1, baseline: poor)
    Mediocre0.595<0.001***
    Good1.2780.001***
Convenience application (B1, baseline: dislike)
    Neutral−0.1080.726
    Like1.335<0.001***
Health application (B2, baseline: dislike)
    Neutral0.5930.004**
    Like1.246<0.001***
Survey language (baseline: DE)
    FR−0.1720.314
Age (A2, baseline: 45–54 years)
    55–64 years−0.4310.030*
    65–74 years−0.4810.110
    75+ years−0.7030.065.
Gender (A3, baseline: female)
    Male0.4380.004**
Education (C1, baseline: high school)
    Mandatory−0.0330.936
    Higher education−0.1230.463
Income sufficiency (C2, baseline: difficult)
    Easy0.0950.625
Expense capacity (C3, baseline: no)
    Yes−0.1390.502
Professional situation (C4, baseline: employed)
    Others0.1200.651
    Retired0.1700.487
Home ownership (C5, baseline: rent)
    Ownership0.4130.014*
Marriage/partnership (C6.1, baseline: no)
    Yes−0.6110.094.
Single household (C6.2, baseline: no)
    Yes−0.4760.222
Household with kid(s) (C6.4, baseline: no)
    Yes−0.1980.358
Other households (C6.3/5/6, baseline: no)
    Yes−0.4180.373
Technology experimenter (E1, baseline: disagree)
    Neutral0.2760.209
    Agree1.216<0.001***
Technology pioneer (E2, baseline: disagree)
    Neutral0.2190.266
    Agree0.7800.001***
Technology expert (E3, baseline: poor)
    Good−0.1250.802
    Excellent−0.0290.954
Mistake avoider (E4, baseline: disagree)
    Neutral−0.0660.721
    Agree0.5250.009**
Familiarity preferer (E5, baseline: disagree)
    Neutral−0.3420.078.
    Agree−0.3800.041*
Risk-taking level (E6, baseline: not willing)
    Moderately willing0.0240.908
    Willing0.2210.342
Suppl. health insurance (F1.1, baseline: Yes)
    No−0.0410.819
Motor vehicle insurance (F1.2, baseline: Yes)
    No−0.0660.741
Travel insurance (F1.3, baseline: Yes)
    No−0.0080.959
Liability insurance (F1.4, baseline: Yes)
    No0.2080.468
Life insurance (F1.5, baseline: Yes)
    No0.4430.016*
Household insurance (F1.6, baseline: Yes)
    No−0.1320.691
Legal expenses insurance (F1.7, baseline: Yes)
    No0.1470.355
Other insurance (F1.8, baseline: Yes)
    No−0.1630.613
Insurance app in use (F2, baseline: Yes)
    No0.0900.565
Note: the significance levels are: . p < 0.1 , * p < 0.05 , ** p < 0.01 , *** p < 0.001 .

References

  1. Chang, S.; Nam, K. Smart Home Adoption: The Impact of User Characteristics and Differences in Perception of Benefits. Buildings 2021, 11, 393. [Google Scholar] [CrossRef]
  2. Chan, M.; Estève, D.; Fourniols, J.Y.; Escriba, C.; Campo, E. Smart wearable systems: Current status and future challenges. Artif. Intell. Med. 2012, 56, 137–156. [Google Scholar] [CrossRef] [PubMed]
  3. Scott, F. Teaching Homes to Be Green: Smart Homes and the Environment; Technical Report; Green Alliance: London, UK, 2007. [Google Scholar]
  4. Alam, M.R.; Reaz, M.B.I.; Ali, M.A.M. A Review of Smart Homes—Past, Present, and Future. IEEE Trans. Syst. Man, Cybern. Part C Appl. Rev. 2012, 42, 1190–1203. [Google Scholar] [CrossRef]
  5. Iten, R.; Wagner, J.; Zeier Röschmann, A. On the Identification, Evaluation and Treatment of Risks in Smart Homes: A Systematic Literature Review. Risks 2021, 9, 113. [Google Scholar] [CrossRef]
  6. Sovacool, B.K.; Furszyfer Del Rio, D.D. Smart home technologies in Europe: A critical review of concepts, benefits, risks and policies. Renew. Sustain. Energy Rev. 2020, 120, 109663. [Google Scholar] [CrossRef]
  7. Maalsen, S.; Dowling, R. COVID-19 and the accelerating smart home. Big Data Soc. 2020, 7, 205395172093807. [Google Scholar] [CrossRef]
  8. Ghafurian, M.; Ellard, C.; Dautenhahn, K. An investigation into the use of smart home devices, user preferences, and impact during COVID-19. Comput. Hum. Behav. Rep. 2023, 11, 100300. [Google Scholar] [CrossRef]
  9. Von Humboldt, S.; Mendoza-Ruvalcaba, N.M.; Arias-Merino, E.D.; Costa, A.; Cabras, E.; Low, G.; Leal, I. Smart technology and the meaning in life of older adults during the COVID-19 public health emergency period: A cross-cultural qualitative study. Int. Rev. Psychiatry 2020, 32, 713–722. [Google Scholar] [CrossRef]
  10. Alaiad, A.; Zhou, L. The determinants of home healthcare robots adoption: An empirical investigation. Int. J. Med. Inform. 2014, 83, 825–840. [Google Scholar] [CrossRef] [PubMed]
  11. Binette, J.; Vasold, K. 2018 Home and Community Preferences: A National Survey of Adults Age 18-Plus; Technical Report; AARP Research: Washington, DC, USA, 2018. [Google Scholar] [CrossRef]
  12. Carnemolla, P. Ageing in place and the internet of things—How smart home technologies, the built environment and caregiving intersect. Vis. Eng. 2018, 6, 1–16. [Google Scholar] [CrossRef]
  13. Tural, E.; Lu, D.; Cole, D.A. Safely and Actively Aging in Place: Older Adults’ Attitudes and Intentions Toward Smart Home Technologies. Gerontol. Geriatr. Med. 2021, 7, 233372142110173. [Google Scholar] [CrossRef]
  14. Nikou, S. Factors driving the adoption of smart home technology: An empirical assessment. Telemat. Inform. 2019, 45, 101283. [Google Scholar] [CrossRef]
  15. Turjamaa, R.; Pehkonen, A.; Kangasniemi, M. How smart homes are used to support older people: An integrative review. Int. J. Older People Nurs. 2019, 14, e12260. [Google Scholar] [CrossRef] [PubMed]
  16. World Health Organization. Decade of Healthy Ageing: Baseline Report; Technical Report; World Health Organization: Geneva, Switzerland, 2020. [Google Scholar]
  17. Shank, D.B.; Wright, D.; Lulham, R.; Thurgood, C. Knowledge, Perceived Benefits, Adoption, and Use of Smart Home Products. Int. J. Hum.-Comput. Interact. 2021, 37, 922–937. [Google Scholar] [CrossRef]
  18. Wang, X.; McGill, T.J.; Klobas, J.E. I Want It Anyway: Consumer Perceptions of Smart Home Devices. J. Comput. Inf. Syst. 2020, 60, 437–447. [Google Scholar] [CrossRef]
  19. Wilson, C.; Hargreaves, T.; Hauxwell-Baldwin, R. Benefits and risks of smart home technologies. Energy Policy 2017, 103, 72–83. [Google Scholar] [CrossRef]
  20. Marikyan, D.; Papagiannidis, S.; Alamanos, E. A systematic review of the smart home literature: A user perspective. Technol. Forecast. Soc. Chang. 2019, 138, 139–154. [Google Scholar] [CrossRef]
  21. Li, W.; Yigitcanlar, T.; Erol, I.; Liu, A. Motivations, barriers and risks of smart home adoption: From systematic literature review to conceptual framework. Energy Res. Soc. Sci. 2021, 80, 102211. [Google Scholar] [CrossRef]
  22. Große-Kreul, F. What will drive household adoption of smart energy? Insights from a consumer acceptance study in Germany. Util. Policy 2022, 75, 101333. [Google Scholar] [CrossRef]
  23. Schill, M.; Godefroit-Winkel, D.; Diallo, M.F.; Barbarossa, C. Consumers’ intentions to purchase smart home objects: Do environmental issues matter? Ecol. Econ. 2019, 161, 176–185. [Google Scholar] [CrossRef]
  24. Arthanat, S.; Wilcox, J.; Macuch, M. Profiles and Predictors of Smart Home Technology Adoption by Older Adults. OTJR Occup. Particip. Health 2019, 39, 247–256. [Google Scholar] [CrossRef]
  25. Berkowsky, R.; Sharit, J.; Czaja, S. Factors Predicting Decisions About Technology Adoption Among Older Adults. Innov. Aging 2017, 2, 1–12. [Google Scholar] [CrossRef] [PubMed]
  26. World Health Organization. Active Ageing: A Policy Framework; Technical Report; World Health Organization: Geneva, Switzerland, 2002. [Google Scholar]
  27. Bosch-Farré, C.; Garre-Olmo, J.; Bonmatí-Tomàs, A.; Malagón-Aguilera, M.C.; Gelabert-Vilella, S.; Fuentes-Pumarola, C.; Juvinyà-Canal, D. Prevalence and related factors of Active and Healthy Ageing in Europe according to two models: Results from the Survey of Health, Ageing and Retirement in Europe (SHARE). PLoS ONE 2018, 13, e0206353. [Google Scholar] [CrossRef] [PubMed]
  28. Tacken, M.; Marcellini, F.; Széman, Z. Use and acceptance of new technology by older people. Findings of the international MOBILATE survey: ‘Enhancing mobility in later life’. Gerontechnology 2005, 3, 126–137. [Google Scholar] [CrossRef]
  29. Arar, M.; Jung, C.; Awad, J.; Chohan, A.H. Analysis of Smart Home Technology Acceptance and Preference for Elderly in Dubai, UAE. Designs 2021, 5, 70. [Google Scholar] [CrossRef]
  30. Flückiger, I.; Carbone, M. From Risk Transfer to Risk Prevention—How the Internet of Things Is Reshaping Business Models in Insurance; Technical Report; The Geneva Association: Geneva, Switzerland, 2021. [Google Scholar]
  31. Hubert, M.; Blut, M.; Brock, C.; Zhang, R.W.; Koch, V.; Riedl, R. The influence of acceptance and adoption drivers on smart home usage. Eur. J. Mark. 2019, 53, 1073–1098. [Google Scholar] [CrossRef]
  32. Shin, J.; Park, Y.; Lee, D. Who will be smart home users? An analysis of adoption and diffusion of smart homes. Technol. Forecast. Soc. Change 2018, 134, 246–253. [Google Scholar] [CrossRef]
  33. Ayodimeji, Z.O.; Janardhanan, M.; Marinelli, M.; Patel, I. Adoption of Smart Homes in the UK: Customers’ Perspective. In Advances in Interdisciplinary Engineering; Lecture Notes in Mechanical Engineering; Springer: Singapore, 2021; pp. 19–30. [Google Scholar] [CrossRef]
  34. Park, E.; Kim, S.; Kim, Y.; Kwon, S.J. Smart home services as the next mainstream of the ICT industry: Determinants of the adoption of smart home services. Univers. Access Inf. Soc. 2018, 17, 175–190. [Google Scholar] [CrossRef]
  35. Pal, D.; Funilkul, S.; Charoenkitkarn, N.; Kanthamanon, P. Internet-of-Things and Smart Homes for Elderly Healthcare: An End User Perspective. IEEE Access 2018, 6, 10483–10496. [Google Scholar] [CrossRef]
  36. Sequeiros, H.; Oliveira, T.; Thomas, M.A. The Impact of IoT Smart Home Services on Psychological Well-Being. Inf. Syst. Front. 2021, 24, 1009–1026. [Google Scholar] [CrossRef]
  37. Kim, Y.; Park, Y.; Choi, J. A study on the adoption of IoT smart home service: Using Value-based Adoption Model. Total Qual. Manag. Bus. Excell. 2017, 28, 1149–1165. [Google Scholar] [CrossRef]
  38. Hoque, R.; Sorwar, G. Understanding factors influencing the adoption of mHealth by the elderly: An extension of the UTAUT model. Int. J. Med. Inform. 2017, 101, 75–84. [Google Scholar] [CrossRef] [PubMed]
  39. Baudier, P.; Ammi, C.; Deboeuf-Rouchon, M. Smart home: Highly-educated students’ acceptance. Technol. Forecast. Soc. Change 2020, 153, 119355. [Google Scholar] [CrossRef]
  40. Cimperman, M.; Brenčič, M.M.; Trkman, P. Analyzing older users’ home telehealth services acceptance behavior—Applying an Extended UTAUT model. Int. J. Med. Inform. 2016, 90, 22–31. [Google Scholar] [CrossRef] [PubMed]
  41. Park, E.; Cho, Y.; Han, J.; Kwon, S.J. Comprehensive Approaches to User Acceptance of Internet of Things in a Smart Home Environment. IEEE Internet Things J. 2017, 4, 2342–2350. [Google Scholar] [CrossRef]
  42. Shuhaiber, A.; Mashal, I. Understanding users’ acceptance of smart homes. Technol. Soc. 2019, 58, 101110. [Google Scholar] [CrossRef]
  43. Loi, F.; Sivanathan, A.; Gharakheili, H.H.; Radford, A.; Sivaraman, V. Systematically Evaluating Security and Privacy for Consumer IoT Devices. In Proceedings of the 2017 Workshop on Internet of Things Security and Privacy, Dallas, TX, USA, 3 November 2017; pp. 1–6. [Google Scholar] [CrossRef]
  44. Davis, F.D. Perceived Usefulness, Perceived Ease of Use, and User Acceptance of Information Technology. MIS Q. 1989, 13, 319. [Google Scholar] [CrossRef]
  45. De Boer, P.S.; Van Deursen, A.J.; Van Rompay, T.J. Accepting the Internet-of-Things in our homes: The role of user skills. Telemat. Inform. 2019, 36, 147–156. [Google Scholar] [CrossRef]
  46. Kuebel, H.; Zarnekow, R. Exploring Platform Adoption in the Smart Home Case. In Proceedings of the ICIS 2015 Proceedings, Fort Worth, TX, USA, 13–16 December 2015. [Google Scholar]
  47. Marikyan, D.; Papagiannidis, S.; Alamanos, E. Smart Home Technology Acceptance: An Empirical Investigation. In Proceedings of the Digital Transformation for a Sustainable Society in the 21st Century, Trondheim, Norway, 18–20 September 2019; pp. 305–315. [Google Scholar] [CrossRef]
  48. Luor, T.; Lu, H.P.; Yu, H.; Lu, Y. Exploring the critical quality attributes and models of smart homes. Maturitas 2015, 82, 377–386. [Google Scholar] [CrossRef]
  49. Furszyfer Del Rio, D.; Sovacool, B.K.; Martiskainen, M. Controllable, frightening, or fun? Exploring the gendered dynamics of smart home technology preferences in the United Kingdom. Energy Res. Soc. Sci. 2021, 77, 102105. [Google Scholar] [CrossRef]
  50. Hong, A.; Nam, C.; Kim, S. What will be the possible barriers to consumers’ adoption of smart home services? Telecommun. Policy 2020, 44, 101867. [Google Scholar] [CrossRef]
  51. Klobas, J.E.; McGill, T.; Wang, X. How perceived security risk affects intention to use smart home devices: A reasoned action explanation. Comput. Secur. 2019, 87, 101571. [Google Scholar] [CrossRef]
  52. Sovacool, B.K.; Martiskainen, M.; Furszyfer Del Rio, D.D. Knowledge, energy sustainability, and vulnerability in the demographics of smart home technology diffusion. Energy Policy 2021, 153, 112196. [Google Scholar] [CrossRef]
  53. Yang, H.; Lee, H.; Zo, H. User acceptance of smart home services: An extension of the theory of planned behavior. Ind. Manag. Data Syst. 2017, 117, 68–89. [Google Scholar] [CrossRef]
  54. Balta-Ozkan, N.; Davidson, R.; Bicket, M.; Whitmarsh, L. Social barriers to the adoption of smart homes. Energy Policy 2013, 63, 363–374. [Google Scholar] [CrossRef]
  55. Peek, S.T.; Aarts, S.; Wouters, E.J. Can Smart Home Technology Deliver on the Promise of Independent Living? In Handbook of Smart Homes, Health Care and Well-Being; Springer: Cham, Switzerland, 2015; pp. 1–10. [Google Scholar] [CrossRef]
  56. Bonacasa. Smart Living Loft by Bonacasa: Site Visit in Oensingen, Switzerland. 2021. Available online: https://www.bonacasa.ch/de/geschaeftskunden/concept-development/smart-living-loft-by-bonacasa (accessed on 26 May 2023).
  57. Eysenbach, G. Improving the Quality of Web Surveys: The Checklist for Reporting Results of Internet E-Surveys (CHERRIES). J. Med. Internet Res. 2004, 6, e34. [Google Scholar] [CrossRef] [PubMed]
  58. Iten, R.; Wagner, J.; Zeier Röschmann, A. Survey Data on the Adoption of Smart Home Technologies by Older Adults in Switzerland. in preparation.
  59. Likert, R. A technique for the measurement of attitudes. Arch. Psychol. 1932, 140, 5–53. [Google Scholar]
  60. Calasanti, T.; Repetti, M. Swiss Retirees as “Active Agers”: A Critical Look at this New Social Role. Popul. Ageing 2017, 11, 23–41. [Google Scholar] [CrossRef]
  61. Börsch-Supan, A. Survey of Health, Ageing and Retirement in Europe (SHARE)Wave 8. Release Version: 8.0.0. SHARE-ERIC. Data Set. 2022. Available online: https://share-eric.eu/data/data-documentation/waves-overview/wave-8 (accessed on 22 November 2023). [CrossRef]
  62. Mayring, P. Qualitative Content Analysis: Theoretical Foundation, Basic Procedures and Software Solution; Social Science Open Access Repository (SSOAR): Klagenfurt, Austria, 2014. [Google Scholar]
  63. Venkatesh, V.; Morris, M.G.; Davis, G.B.; Davis, F.D. User acceptance of information technology: Toward a unified view. MIS Q. 2003, 27, 425–478. [Google Scholar] [CrossRef]
  64. Venkatesh, V.; Thong, J.Y.; Xu, X. Consumer acceptance and use of information technology: Extending the unified theory of acceptance and use of technology. MIS Q. 2012, 36, 157–178. [Google Scholar] [CrossRef]
  65. Davis, D. Insights and Strategies for Smart Home Insurance Programs; Technical Report; LexisNexis Risk Solutions: El Paso, TX, USA, 2020. [Google Scholar]
  66. Davis, D. Preventing Water Claims: Understanding the Value of Smart Home Technology; Technical Report; LexisNexis Risk Solutions: El Paso, TX, USA, 2020. [Google Scholar]
  67. Sevillano, C. Smart Homes. In Proceedings of the EMEA Claims Conference, Rüschlikon, Switzerland, 7 March 2018. [Google Scholar]
  68. Śliwiński, A.; Kuryłowicz, Ł. Usage-based insurance and its acceptance: An empirical approach. Risk Manag. Insur. Rev. 2021, 24, 71–91. [Google Scholar] [CrossRef]
  69. Zeier Röschmann, A.; Erny, M.; Wagner, J. On the (future) role of on-demand insurance: Market landscape, business model and customer perception. Geneva Pap. Risk Insur.-Issues Pract. 2022, 47, 603–642. [Google Scholar] [CrossRef]
  70. Hair, J.; Black, W.; Babin, B.; Anderson, R. Mutivariate Data Analysis, 7th ed.; Pearson: London, UK, 2009. [Google Scholar]
  71. Kreutzer, M.; Wagner, J. New solvency regulation: What CEOs of insurance companies think. Geneva Pap. Risk Insur.-Issues Pract. 2013, 38, 213–249. [Google Scholar] [CrossRef]
  72. Pelau, C.; Dabija, D.C.; Ene, I. What makes an AI device human-like? The role of interaction quality, empathy and perceived psychological anthropomorphic characteristics in the acceptance of artificial intelligence in the service industry. Comput. Hum. Behav. 2021, 122, 106855. [Google Scholar] [CrossRef]
  73. Wiegard, R.B.; Breitner, M.H. Smart services in healthcare: A risk-benefit-analysis of pay-as-you-live services from customer perspective in Germany. Electron. Mark. 2019, 29, 107–123. [Google Scholar] [CrossRef]
Figure 1. Synopsis of the main topics and parts of the questionnaire.
Smartcities 07 00015 g001
Figure 2. Illustration of the responses to the intention-to-adopt SH statements.
Smartcities 07 00015 g002
Table 1. Factors influencing SH adoption and their relation to technology adoption frameworks.
FactorFrameworkReferences
UsefulnessUTAUT Alaiad and Zhou [10], Große-Kreul [22], Ayodimeji et al. [33], Pal et al. [35], Sequeiros et al. [36], Hoque and Sorwar [38], Baudier et al. [39], Cimperman et al. [40]
TAM Tural et al. [13], Nikou [14], Hubert et al. [31], Shin et al. [32], Park et al. [41], Shuhaiber and Mashal [42], De Boer et al. [45], Kuebel and Zarnekow [46], Marikyan et al. [47]
Other Wang et al. [18], Schill et al. [23], Kim et al. [37], Luor et al. [48]
UsabilityUTAUT Alaiad and Zhou [10], Große-Kreul [22], Ayodimeji et al. [33], Pal et al. [35], Sequeiros et al. [36], Hoque and Sorwar [38], Baudier et al. [39], Cimperman et al. [40]
TAM Tural et al. [13], Nikou [14], Hubert et al. [31], Shin et al. [32], Park et al. [41], Shuhaiber and Mashal [42], De Boer et al. [45], Kuebel and Zarnekow [46], Marikyan et al. [47]
Other Wang et al. [18]
Support and resourcesUTAUT Alaiad and Zhou [10], Ayodimeji et al. [33], Pal et al. [35], Sequeiros et al. [36], Hoque and Sorwar [38], Baudier et al. [39], Cimperman et al. [40]
Other Kim et al. [37]
Social influencesUTAUT Alaiad and Zhou [10], Große-Kreul [22], Ayodimeji et al. [33], Pal et al. [35], Sequeiros et al. [36], Hoque and Sorwar [38], Baudier et al. [39], Cimperman et al. [40]
Hedonic motivationUTAUT Große-Kreul [22], Sequeiros et al. [36], Baudier et al. [39]
TAM Park et al. [41], Shuhaiber and Mashal [42], Marikyan et al. [47]
Other Kim et al. [37]
Risks and barriersUTAUT Alaiad and Zhou [10], Arar et al. [29], Pal et al. [35], Cimperman et al. [40]
TAM Nikou [14], Hubert et al. [31], Shin et al. [32], Shuhaiber and Mashal [42], Marikyan et al. [47]
Other Wang et al. [18], Kim et al. [37], Luor et al. [48], Furszyfer Del Rio et al. [49], Hong et al. [50], Klobas et al. [51]
Price valueUTAUT Sequeiros et al. [36], Baudier et al. [39]
TAM Tural et al. [13]
HabitUTAUT Sequeiros et al. [36], Baudier et al. [39]
TrustOther Luor et al. [48], Furszyfer Del Rio et al. [49]
Expert adviceUTAUT Pal et al. [35], Cimperman et al. [40]
Technology anxietyUTAUT Arar et al. [29], Pal et al. [35], Hoque and Sorwar [38], Cimperman et al. [40]
Note: UTAUT stands for the unified theory of acceptance and use of technology, TAM refers to the technology acceptance model.
Table 2. Variables characterizing (potential) SH users.
CharacteristicsPopulationReferences
AgeGeneral Tural et al. [13], Shank et al. [17], Wang et al. [18], Li et al. [21], Shin et al. [32], Sequeiros et al. [36], Hoque and Sorwar [38], Klobas et al. [51]
GenderOlder Adults Chang and Nam [1], Tural et al. [13], Arthanat et al. [24], Ayodimeji et al. [33], Cimperman et al. [40]
General Nikou [14], Shin et al. [32], Sovacool et al. [52], Yang et al. [53]
EducationOlder Adults Chang and Nam [1], Tural et al. [13]
General Shin et al. [32], Klobas et al. [51]
IncomeOlder Adults Chang and Nam [1], Tural et al. [13], Shank et al. [17]
General Shin et al. [32]
Martial statusOlder Adults Arthanat et al. [24]
SH experienceOlder Adults Chang and Nam [1]
General Nikou [14], Shank et al. [17], Yang et al. [53]
SH knowledgeOlder Adults Wilson et al. [19], Ayodimeji et al. [33], Marikyan et al. [47], Balta-Ozkan et al. [54]
Technology ownershipOlder Adults Tural et al. [13], Arthanat et al. [24]
General De Boer et al. [45]
Technology affinityOlder Adults Arar et al. [29]
General Wilson et al. [19], Hubert et al. [31]
Home ownershipOlder Adults Tural et al. [13], Arthanat et al. [24]
Household sizeOlder Adults Tural et al. [13], Peek et al. [55]
AHAOlder Adults Carnemolla [12], Tacken et al. [28]
Table 3. Summary of the variables used in the survey (part 1 of 4).
LabelDescriptionCategoriesQuestion
Knowledge and preference variables
 Knowledge levelLevel of experience in SHsFive levels from no knowledge to very good knowledgeA1
 Convenience applicationPreference for sensors in the housingFive levels from dislike to likeB1
 Health applicationPreference for mobile health device ”B2
Socio-demographic variables
 Survey languageChosen language of the questionnaireGerman, Frenchn.a.
 AgeAge class in years45–54, 55–64, 65–74, 75+ (from numeric answers)A2
 GenderGender of the respondentFemale, male, diverse, prefer not to replyA3
 EducationHighest level of educationMandatory school, high school, higher educationC1
 Income sufficiencyIncome sufficiency for recurring expensesWith great difficulty; with some difficulty; fairly easily; easilyC2
 Expense capacityAbility to cover an unexpected expenseNo, yesC3
 Professional situationCurrent employment situationRetired, employed, unemployed, homemaker, unable to workC4
 Home ownershipMain residence ownershipRent, ownershipC5
 Marriage/partnershipLiving with spouse/partner in a householdNo, yesC6.1
 Single householdLiving alone (without anyone else) ”C6.2
 Household with kid(s)Living with kids in one household ”C6.4
 Other householdsLiving in other household constellation ”C6.3,5,6
Active healthy aging variables
 Mildly strenuous activitiesPhysically mildly strenuous activitiesHardly ever, 1–2× month, 1× week, >1× weekD1.1
 Really strenuous activitiesPhysically very strenuous activities ”D1.2
 FrailtyFrailty in certain everyday activitiesNo, yesD2
 Satisfaction with lifeSatisfaction with current life situationFive levels from completely dissatisfied to completely satisfiedD3
 Depressive symptomsFeeling sad or depressedNo, yesD4
 LonelinessFeeling lack of companionshipAlmost never or never, 1–2× month, 1× week, >1× weekD5
 Cultural activity levelParticipation in cultural activitiesHardly ever, few times a year, 1–2× month, 1× week, >1× weekD6.1
 Group sports involvementParticipation in group sports ”D6.2
 Educational coursesParticipation in educational courses ”D6.3
 Voluntary workParticipation in voluntary work ”D6.4
 Club activity levelParticipation in club activities ”D6.5
 Outing levelGoing out with friends ”D6.6
 Active grandparentLooking after grandchildren ”D6.7
Technology and risk affinity variables
 Technology experimenterPleasure in trying new technologiesFive levels from strongly disagree to strongly agreeE1
 Technology pioneerFirst to try new technologies ”E2
 Technology expertSkills using smartphone or tabletFive levels from poor to excellentE3
 Mistake avoiderPotential errors discourage from usageFive levels from strongly disagree to strongly agreeE4
 Familiarity prefererFamiliar things are preferred over new ones ”E5
 Risk-taking levelSelf-assessed preferences for risky behaviorFive levels from not at all to very willing to take risksE6
Insurance situation variables
 Suppl. health insuranceSupplementary health insuranceNo, yesF1.1
 Motor vehicle insuranceMotor vehicle insurance ”F1.2
 Travel insuranceTravel insurance ”F1.3
 Liability insuranceLiability insurance ”F1.4
 Life insuranceLife insurance ”F1.5
 Household insuranceHousehold insurance ”F1.6
 Legal expenses insuranceLegal expenses insurance ”F1.7
 Other insuranceOther less frequent insurance contracts ”F1.8
 Insurance app in useApp from any insurance company in use ”F2
Table 4. Summary of the variables used in the survey (part 2 of 4).
LabelDescriptionQuestion
Evaluation of prevention benefits
 Burden reliefReduce burden of household activitiesG1.1
 Home informationProvide information and control optionsG1.2
 Value enhancementMaintain or increase property valueG1.3
 Sense of safetyMake feel more safeG2.1
 Security boosterIncrease home securityG2.2
 Risk protectionProtect against risks at homeG2.3
 Health maintenanceTake care of oneself and avoid doctor visitG3.1
 Health monitoringMonitor easily health metricsG3.2
 Health encouragementMotivate to behave healthierG3.3
 Accident preventionHelp to prevent accidents and health risksG3.4
 Family well-checkCheck if family and friends are wellG3.5
 Automated fitnessPerform something automatically for fitnessG4.1
 Exercise feedbackObtain immediate feedback on fitness exercisesG4.2
 Movement motivationMotivate to move moreG4.3
 Socializing opportunityMeet new people for training groupsG4.4
Note: All variables are categorical with five levels from strongly disagree to strongly agree.
Table 5. Summary of the variables used in the survey (part 3 of 4).
LabelDescriptionQuestion
Performance expectancy
 Everyday simplificationSimplify everyday household activitiesH1
 Home monitoringMonitor state or progress of home effectivelyH2
 Activity motivationMotivate to conduct activities that do not like to doH3
 Money savingSave money with technology usageH4
 Social connectivityStay in touch with family and friendsH5
 Shared accessGive access to others when neededH6
Effort expectancy
 Easy to useDesigned to be easy to useI1.1
 IntuitiveDesigned to be intuitively understandableI1.2
 Easy to learnDesigned to be easy to learnI1.3
 Quickly usableDesigned to be quickly usableI1.4
 CustomizableDesigned to be individually customizableI2.1
 TailoredDesigned to be tailored to one properlyI2.2
 TrustworthyDesigned to be trustworthyI3.1
 WarrantiedDesigned to be backed by credible warrantiesI3.2
 AutonomousDesigned to be used without consulting othersI4.1
 SeamlessDesigned to be used independently without problemsI4.2
Facilitating conditions
 Availability of usage instructionsInstructions available on proper usageJ1
 Availability of a professional for questionsProfessionals available if any questionsJ2
 Availability of a professional when problemsProfessionals available if any system problemsJ3
 Availability of close peopleClose people available if any difficultiesJ4
 Availability of colleagues/friendsColleagues or friends are happy to supportJ5
 Availability of own knowledgeSufficient knowledge required for usageJ6
 Fit to daily lifeFit well into daily routineJ7
 Fit to householdFit well to household organizationJ8
Social influences
 Meaning to important othersImportant people encourage technology usageK1
 Meaning to opinion makersValued opinions encourage technology usageK2
 Prestigious imageUsers have a more prestigious imageK3
 Modern imageUsers are perceived as modernK4
Hedonic motivation
 EntertainingUsing SH is entertainingL1
 EnjoyableUsing SH is enjoyableL2
 ConvenientUsing SH is convenientL3
 Curiosity-inducingUsing SH arouses curiosityL4
 VersatileUsing SH is versatileL5
 FunUsing SH is funL6
 PleasantUsing SH is pleasantL7
 RelievingUsing SH brings reliefL8
 TrendingUsing SH helps to be at the pulse of timeL9
 VariegatingUsing SH leads to more variety in everyday lifeL10
Note: all variables are categorical with five levels from strongly disagree to strongly agree.
Table 6. Summary of the variables used in the survey (part 4 of 4).
LabelDescriptionQuestion
Perceived risks
 DependenceConcern of increasing dependence on technologyM1.1
 Loss of controlConcern of losing control of technologyM1.2
 Costs exceeding benefitsConcern of costs exceeding benefitsM2.1
 Expensive maintenanceConcern of expensive maintenanceM2.2
 Data misuseConcern of collected data being misusedM3.1
 Data used unforeseeableConcern of collected data being used unforeseeableM3.2
 OverwhelmingConcern of overwhelming technology usageM4.1
 CumbersomeConcern of cumbersome technology usageM4.2
 Go less out of houseConcern of going out of the house lessM5
 Non-essential luxuriesConcern of turning into a non-essential luxuryM6
 Source of problemsConcern of leading to problemsM7.1
 InsecureConcern of being insecureM7.2
 Replace contact with othersConcern of replacing contact with othersM8.1
 Lack of human interactionConcern of resulting in lack of human interactionM8.2
Insurance costs and services
 Discount on insurance premiumExpect to receive discount on insurance premiumN1
 Automatic premium adjustmentExpect price of insurance to adjust automaticallyN2
 Reimbursement of purchase costsExpect insurer to cover cost of purchaseN3
 Advice from insurerExpect insurer to provide advice on home maintenanceN4
 Early warning from insurerExpect insurer to give early warning on incipient risksN5
 Individual offers from insurerExpect insurer to provide offers that match personal interestsN6
 Future SH insurance intentionIntention to use SH insuranceN7
 Future SH insurance planIntention to use SH insurance when opportunity arisesN8
Note: all variables are categorical with five levels from strongly disagree to strongly agree.
Table 7. Summary of the constructs, including underlying questions and loadings.
ConstructDescriptionQuestionsCronbach’s α
Evaluation of prevention benefits
 Comfort benefitsPrevention benefits perceived for comfortG1.1–G1.30.699
 Safety benefitsPrevention benefits perceived for safetyG2.1–G2.30.850
 Health benefitsPrevention benefits perceived for healthG3.1–G3.50.892
 Fitness benefitsPrevention benefits perceived for fitnessG4.1–G4.40.825
Dimensions of SH adoption
 Performance expectancyGeneral SH usage benefitsH1–H60.865
 Effort expectancyEasiness of SH usageI1.1–I4.20.953
 Facilitating conditionsSupport and resources available for SH usageJ1–J80.759
 Social influencesRelevant extent others believe one should use SHK1–K40.825
 Hedonic motivationFun or pleasure derived from SH usageL1–L100.958
Risks and costs
 Increased dependenceRisks related to increased dependenceM1.1–M1.20.713
 CostsRisks related to costs of purchase and useM2.1–M2.20.871
 PrivacyRisks related to privacyM3.1–M3.20.936
 Other risksRisks related to other aspects of daily lifeM4.1–M8.20.869
 Insurance costsCost considerations on SH insurance offeringsN1–N30.801
 Insurance prevention servicesService considerations on SH insurance offeringsN4–N60.862
 Interest for insurance offeringIntention to use SH insurance offeringsN7–N80.847
Note: all constructs are categorical with the three levels disagree, neutral, and agree.
Table 8. Descriptive statistics on the variables from parts A to F of the questionnaire.
SampleIntent. SampleIntent. SampleIntent.
Knowledge and preference variables
 Knowledge level (A1) Convenience application (B1) Health application (B2)
    Poor60.236.3    Dislike17.516.2    Dislike31.526.2
    Mediocre32.263.9    Neutral13.521.7    Neutral22.746.1
    Good7.686.2    Like69.062.4    Like45.865.8
Socio-demographic variables
 Survey language Income sufficiency (C2) Marriage/partnership (C6.1)
    DE66.647.5    Easy66.550.7    Yes62.350.8
    FR33.451.9    Difficult33.545.5    No37.745.9
 Age (A2) Expense capacity (C3) Single household (C6.2)
    45–54 years31.056.3    Yes66.650.8    Yes30.645.6
    55–64 years29.250.4    No33.445.2    No69.450.4
    65–74 years30.844.5 Professional situation (C4) Household with kid(s) (C6.4)
    75+ years9.034.2    Employed49.755.5    Yes22.953.5
 Gender (A3) a    Others11.046.0    No77.147.6
    Female51.040.6    Retired39.341.5 Other households (C6.3/5/6)
    Male49.057.7 Home ownership (C5)    Yes3.840.4
 Education (C1)    Rent51.746.5    No96.249.3
    Mandatory3.143.6    Ownership48.351.6
    High school64.445.5
    Higher education32.556.3
Active healthy aging variables
 Mildly strenuous activities (D1.1) Loneliness (D5) Voluntary work (D6.4)
    Rarely19.546.7    Rarely86.548.0    Rarely81.048.6
    Often80.549.5    Often13.555.1    Regularly8.451.0
 Really strenuous activities (D1.2) Cultural activity level (D6.1)    Often10.650.4
    Rarely57.346.2    Rarely72.945.1 Club activity level (D6.5)
    Often42.752.6    Regularly21.558.3    Rarely78.747.8
 Frailty (D2)    Often5.662.9    Regularly9.450.9
    Yes21.647.4 Group sports involvement (D6.2)    Often11.954.7
    No78.449.4    Rarely65.747.5 Outing level (D6.6)
 Satisfaction with life (D3)    Regularly11.157.2    Rarely44.942.0
    Dissatisfied5.142.2    Often23.249.1    Regularly38.453.2
    Neutral18.947.4 Educational courses (D6.3)    Often16.758.0
    Satisfied76.049.8    Rarely87.448.5 Active grandparent (D6.7)
 Depressive symptoms (D4)    Regularly6.056.8    Rarely52.047.4
    Yes34.350.8    Often6.647.6    Regularly19.651.4
    No65.748.0     Often28.450.0
Technology and risk affinity variables
 Technology experimenter (E1) Technology expert (E3) Familiarity preferer (E5)
    Disagree26.821.0    Poor3.220.0    Disagree40.158.1
    Neutral23.935.1    Good28.734.8    Neutral25.046.1
    Agree49.370.9    Excellent68.156.3    Agree34.940.4
 Technology pioneer (E2) Mistake avoider (E4) Risk-taking level (E6)
    Disagree53.532.7    Disagree44.254.9    Not willing20.836.4
    Neutral21.853.5    Neutral30.040.9    Moderately willing47.344.4
    Agree24.780.1    Agree25.848.1    Willing31.963.9
Insurance situation variables
 Suppl. health insurance (F1.1)Liability insurance (F1.4) Legal expenses insurance (F1.7)
    Yes76.349.5    Yes92.449.5    Yes55.352.8
    No23.747.3    No7.642.6    No44.744.2
 Motor vehicle insurance (F1.2) Life insurance (F1.5) Other insurance (F1.8)
    Yes80.250.5    Yes26.660.0    Yes5.649.3
    No19.842.7    No73.444.9    No94.448.9
 Travel insurance (F1.3) Household insurance (F1.6) Insurance app in use (F2)
    Yes42.353.0    Yes94.049.4    Yes46.460.3
    No57.746.0    No6.041.3    No53.639.1
Notes: the column “Sample” reports the sample share per characteristic or answer (sample size N = 1515 ); the column “Intent.” reports the share of respondent in each category intending to adopt SH (also see Section 4.1). All values are expressed in %. a No respondent selected the answer options “diverse” or “prefer not to reply”.
Table 9. Descriptive statistics on the evaluation of prevention benefits (part G of the questionnaire).
SampleIntent. SampleIntent. SampleIntent.
Comfort benefits
 Burden relief (G1.1) Value enhancement (G1.3) Comfort benefits
    Disagree30.537.3    Disagree19.227.7    Disagree17.818.1
    Neutral21.537.5    Neutral33.940.6    Neutral46.545.1
    Agree48.061.5    Agree46.963.7    Agree35.769.3
 Home information (G1.2)
    Disagree10.712.8
    Neutral14.825.1
    Agree74.558.9
Safety benefits
 Sense of safety (G2.1) Risk protection (G2.3) Safety benefits
    Disagree14.817.5    Disagree7.916.3    Disagree10.815.7
    Neutral23.237.8    Neutral12.725.5    Neutral17.433.3
    Agree62.060.6    Agree79.455.9    Agree71.857.8
 Security booster (G2.2)
    Disagree10.216.7
    Neutral13.929.5
    Agree75.956.9
Health benefits
 Health maintenance (G3.1) Health encouragement (G3.3) Family well-check (G3.5)
    Disagree27.227.8    Disagree32.728.6    Disagree20.428.1
    Neutral28.043.8    Neutral30.148.5    Neutral26.941.0
    Agree44.865.0    Agree37.267.2    Agree52.761.1
 Health monitoring (G3.2) Accident prevention (G3.4) Health benefits
    Disagree19.723.4    Disagree30.731.2    Disagree31.024.2
    Neutral21.137.4    Neutral31.048.7    Neutral45.253.6
    Agree59.261.6    Agree38.363.4    Agree23.872.5
Fitness benefits
 Automated fitness (G4.1) Movement motivation (G4.3) Fitness benefits
    Disagree35.133.3    Disagree32.730.3    Disagree41.433.1
    Neutral33.947.6    Neutral25.844.4    Neutral43.754.2
    Agree31.068.1    Agree41.566.5    Agree14.977.3
 Exercise feedback (G4.2) Socializing opportunity (G4.4)
    Disagree26.329.1    Disagree44.540.2
    Neutral30.443.5    Neutral35.749.4
    Agree43.364.8    Agree29.867.8
Notes: the column “Sample” reports the sample share per characteristic or answer (sample size N = 1515 ); the column “Intent.” reports the share of respondent in each category intending to adopt SH (also see Section 4.1). All values are expressed in %.
Table 10. Descriptive statistics on performance expectancy, effort expectancy, facilitating conditions, social influences, and hedonic motivation (parts H, I, J, K, and L of the questionnaire).
SampleIntent. SampleIntent. SampleIntent.
Performance expectancy
 Everyday simplification (H1) Money saving (H4) Performance expectancy
    Disagree10.38.6    Disagree10.416.3    Disagree19.314.6
    Neutral11.817.8    Neutral16.538.5    Neutral48.145.8
    Agree77.959.0    Agree73.156.0    Agree32.673.8
 Home monitoring (H2) Social connectivity (H5)
    Disagree11.713.1    Disagree33.134.6
    Neutral18.925.5    Neutral33.347.5
    Agree69.461.1    Agree33.664.5
Activity motivation (H3) Shared access (H6)
    Disagree24.226.7    Disagree23.227.9
    Neutral31.442.8    Neutral23.236.8
    Agree44.465-5    Agree53.663.3
Effort expectancy
 Easy to use (I1.1) Customizable (I2.1) Autonomous (I4.1)
    Disagree2.218.5    Disagree3.018.9    Disagree3.728.3
    Neutral5.428.4    Neutral7.528.0    Neutral9.636.1
    Agree92.450.9    Agree89.551.7    Agree86.751.3
 Intuitive (I1.2) Tailored (I2.2) Seamless (I4.2)
    Disagree2.211.1    Disagree2.714.7    Disagree2.621.9
    Neutral6.528.4    Neutral7.733.3    Neutral5.127.0
    Agree91.351.3    Agree89.651.4    Agree92.350.9
 Easy to learn (I1.3) Trustworthy (I3.1) Effort expectancy
    Disagree3.123.1    Disagree2.519.4    Disagree7.319.8
    Neutral6.835.7    Neutral5.215.4    Neutral47.848.5
    Agree90.150.9    Agree92.351.7    Agree44.954.2
 Quickly usable (I1.4) Warrantied (I3.2)
    Disagree2.413-3    Disagree3.428.6
    Neutral5.930.1    Neutral8.136.6
    Agree91.751.1    Agree88.550.9
Facilitating conditions
 Availability of usage instructions (J1) Availability of close people (J4) Fit to daily life (J7)
    Disagree3.28.2    Disagree34.139.0    Disagree2.711.8
    Neutral8.222.8    Neutral27.549.6    Neutral10.025.0
    Agree88.652.5    Agree38.457.4    Agree87.352.9
 Availability of a professional for questions (J2) Availability of colleagues/friends (J5) Fit to household (J8)
    Disagree5.142.9    Disagree26.935.9    Disagree4.410.9
    Neutral10.944.4    Neutral35.746.3    Neutral11.227.3
    Agree84.049.9    Agree37.460.9    Agree84.453.8
 Availability of a professional when problems (J3) Availability of own knowledge (J6) Facilitating conditions
    Disagree4.127.5    Disagree24.823.5    Disagree5.86.9
    Neutral6.836.9    Neutral18.938.0    Neutral47.339.5
    Agree89.150.9    Agree56.363.8    Agree46.963.7
Social influences
 Meaning to important others (K1) Prestigious image (K3) Social influences
    Disagree25.327.7    Disagree41.136.1    Disagree42.529.4
    Neutral55.148.0    Neutral40.950.3    Neutral47.759.0
    Agree19.679.0    Agree18.075.3    Agree9.885.1
 Meaning to opinion makers (K2) Modern image (K4)
    Disagree36.729.7    Disagree16.723.7
    Neutral47.353.9    Neutral32.841.0
    Agree16.078.4    Agree50.562.5
Hedonic motivation
 Entertaining (L1) Versatile (L5) Trending (L9)
    Disagree23.018.6    Disagree14.815.2    Disagree17.818.1
    Neutral33.140.2    Neutral36.539.2    Neutral28.039.2
    Agree43.971.4    Agree48.766.6    Agree54.264.1
 Enjoyable (L2) Fun (L6) Variegating (L10)
    Disagree22.612.1    Disagree18.917.1    Disagree27.625.7
    Neutral32.338.2    Neutral32.635.6    Neutral35.946.4
    Agree45.175.1    Agree48.570.4    Agree36.569.0
 Convenient (L3) Pleasant (L7) Hedonic motivation
    Disagree9.88.3    Disagree18.75.2    Disagree22.98.5
    Neutral21.924.3    Neutral22.923.9    Neutral47.748.1
    Agree68.362.7    Agree58.472.8    Agree29.481.9
 Curiosity-inducing (L4) Relieving (L8)
    Disagree16.96.2    Disagree10.96.7
    Neutral18.922.6    Neutral21.520.2
    Agree64.268.0    Agree67.664.9
Notes: see Table 9.
Table 11. Descriptive statistics on perceived risks (part M of the questionnaire).
SampleIntent. SampleIntent. SampleIntent.
Increased dependence
 Dependence (M1.1) Loss of control (M1.2) Increased dependence
    Disagree42.754.1    Disagree45.658.7    Disagree46.256.4
    Neutral23.049.1    Neutral23.041.8    Neutral32.444.8
    Agree34.342.5    Agree31.440.1    Agree21.439.2
Costs
 Costs exceeding benefits. (M2.1) Expensive maintenance (M2.2) Costs
    Disagree16.476.4    Disagree12.273.5    Disagree14.875.5
    Neutral23.857.3    Neutral19.349.4    Neutral28.255.9
    Agree59.838.1    Agree68.544.5    Agree57.038.6
Privacy
 Data misuse (M3.1) Data used unforeseeable (M3.2) Privacy
    Disagree17.563.9    Disagree16.161.3    Disagree17.962.6
    Neutral18.356.8    Neutral16.556.1    Neutral20.557.1
    Agree64.242.7    Agree67.444.3    Agree61.642.3
Other risks
 Overwhelming (M4.1) Non-essential luxuries (M6) Replace contact with others (M8.1)
    Disagree51.859.7    Disagree29.676.3    Disagree59.055.5
    Neutral21.536.3    Neutral24.352.8    Neutral22.442.6
    Agree26.738.4    Agree46.129.4    Agree18.635.9
 Cumbersome (M4.2) Source of problems (M7.1) Lack of human interaction (M8.2)
    Disagree36.962.7    Disagree25.769.9    Disagree54.857.7
    Neutral26.647.3    Neutral29.451.6    Neutral22.143.4
    Agree36.536.3    Agree44.935.4    Agree23.133.4
 Go less out of house (M5) Insecure (M7.2) Other risks
    Disagree67.154.7    Disagree27.167.0    Disagree56.561.1
    Neutral22.536.9    Neutral26.552.0    Neutral34.734.8
    Agree10.438.0    Agree46.436.7    Agree8.825.7
Notes: see Table 9.
Table 12. Descriptive statistics on insurance costs and services (part N of the questionnaire).
SampleIntent. SampleIntent. SampleIntent.
Insurance costs
 Discount on insurance premium (N1) Reimbursement of purchase costs (N3) Insurance costs
    Disagree11.523.8    Disagree22.440.6    Disagree20.731.6
    Neutral24.238.7    Neutral27.243.0    Neutral39.446.8
    Agree64.357.3    Agree50.455.8    Agree39.960.0
 Automatic premium adjustment (N2)
    Disagree18.232.0
    Neutral29.539.9
    Agree52.359.9
Insurance prevention services
 Advice from insurer (N4) Individual offers from insurer (N6) Insurance prevention services
    Disagree18.026.5    Disagree22.637.5    Disagree23.131.7
    Neutral26.835.8    Neutral25.936.6    Neutral38.843.7
    Agree55.262.6    Agree51.560.2    Agree38.164.8
 Early warning from insurer (N5)
    Disagree20.734.6
    Neutral29.840.8
    Agree49.559.9
Interest for insurance offering
 Future SH insurance intention (N7) Future SH insurance plan (N8) Interest for insurance offering
    Disagree28.223.4    Disagree31.316.0    Disagree35.322.5
    Neutral37.547.5    Neutral34.344.5    Neutral37.849.5
    Agree34.371.5    Agree34.483.4    Agree26.982.5
Notes: see Table 9.
Table 13. Results of the reduced logit regression using selected constructs (parts G to N of the questionnaire).
β -Estimatep-ValueSig.
Intercept−2.743<0.001***
Health benefits (G3.1–G3.5, baseline: disagree)
    Neutral0.4100.026*
    Agree0.2650.257
Facilitating conditions (J1–J8, baseline: disagree)
    Neutral1.3160.016*
    Agree1.4060.011*
Social influences (K1–K4, baseline: disagree)
    Neutral0.3300.045*
    Agree0.5810.084.
Hedonic motivation (L1–L10, baseline: disagree)
    Neutral1.331<0.001***
    Agree2.375<0.001***
Costs (M2.1–M2.2, baseline: disagree)
    Neutral−0.6920.009**
    Agree−0.945<0.001***
Other risks (M4.1–M8.2, baseline: disagree)
    Neutral−0.689<0.001***
    Agree−0.9460.002**
Insurance prevention services (N4–N6, baseline: disagree)
    Neutral−0.2730.186
    Agree0.0550.802
Interest for insurance offering (N7–N8, baseline: disagree)
    Neutral0.647<0.001***
    Agree1.726<0.001***
Note: the significance levels are: . p < 0.1 , * p < 0.05 , ** p < 0.01 , *** p < 0.001 .
Table 14. Results of the reduced logit regression using selected active healthy aging variables (part D of the questionnaire).
β -Estimatep-ValueSig.
Intercept−0.457<0.001***
Really strenuous activities (D1.2, baseline: rarely)
    Often0.1700.146
Loneliness (D5, baseline: rarely)
    Often0.3080.067.
Cultural activity level (D6.1, baseline: rarely)
    Regularly0.3860.009**
    Often0.4310.100
Outing level (D6.6, baseline: rarely)
    Regularly0.3420.008**
    Often0.4430.012*
Note: the significance levels are: . p < 0.1 , * p < 0.05 , ** p < 0.01 , *** p < 0.001 .
Table 15. Results of the reduced logit regression using selected variables with all other personal characteristics (parts A to C and E to F of the questionnaire).
β -Estimatep-ValueSig.
Intercept−2.834<0.001***
Knowledge level (A1, baseline: poor)
    Mediocre0.609<0.001***
    Good1.2740.001***
Convenience application (B1, baseline: dislike)
    Neutral−0.0550.855
    Like1.360<0.001***
Health application (B2, baseline: dislike)
    Neutral0.6060.003**
    Like1.228<0.001***
Age (A2, baseline: 45–54 years)
    55–64 years−0.4120.029*
    65–74 years−0.3890.048*
    75+ years−0.6200.028*
Gender (A3, baseline: female)
    Male0.4090.006**
Home ownership (C5, baseline: rent)
    Ownership0.3940.012*
Marriage/partnership (C6.1, baseline: no)
    Yes−0.2340.144
Technology experimenter (E1, baseline: disagree)
    Neutral0.2950.165
    Agree1.255<0.001***
Technology pioneer (E2, baseline: disagree)
    Neutral0.2250.244
    Agree0.790<0.001***
Mistake avoider (E4, baseline: disagree)
    Neutral−0.1020.568
    Agree0.4650.015*
Familiarity preferer (E5, baseline: disagree)
    Neutral−0.3610.057.
    Agree−0.4070.023*
Life insurance (F1.5, baseline: Yes)
    No0.4010.022*
Note: the significance levels are: . p < 0.1 , * p < 0.05 , ** p < 0.01 , *** p < 0.001 .
Disclaimer/Publisher’s Note: The statements, opinions and data contained in all publications are solely those of the individual author(s) and contributor(s) and not of MDPI and/or the editor(s). MDPI and/or the editor(s) disclaim responsibility for any injury to people or property resulting from any ideas, methods, instructions or products referred to in the content.

