1. Introduction
In recent years, we have witnessed a significant technological revolution covering not only societies and all areas of the economy, but also areas of public access, such as cities. The digitization of numerous services or products forces contemporary cities to use more and more new IT solutions for their proper functioning [
1]. A solution related to this trend is the concept of smart cities, which has been known for more than two decades. This idea assumes the use of various types of information and communication technologies by cities to increase the interactivity and efficiency of the urban infrastructure and its components, as well as to raise the awareness of residents [
2].
The emergence of new Smart Cities is a challenge in which designers must take into account areas such as the environment, management, energy consumption, education and human safety [
2]. Smart cities are also smart societies that require solutions that will help ensure high quality and adapt to the fast pace of their lives and, at the same time, the ability to carry out personal matters, which can often be located in different urban areas requiring the use of an appropriate and efficient means of transport [
3]. Then, one of the domains of smart cities is to provide the society with efficient movement, i.e., the fulfillment of one of their basic needs, which is mobility. In the case of smart cities, this mobility is based on a smart transport network, and the areas of its mobility include aspects such as traffic management, sustainable mobility and also intelligent searching for routes or parking spaces [
4]. Among sustainable mobility services, the leading solutions in smart cities and, at the same time, those most accessible to the public, are shared mobility systems [
5,
6]. These types of services allow sharing journeys or vehicles while providing the opportunity to travel in an alternative way to individual motorists. Shared mobility, in addition to a number of advantages, such as the elimination of transport barriers, is also associated with challenges faced by cities themselves, transport managers, and service providers of individual transport solutions [
7]. Among the research works identified in the literature, scientists devote their considerations to the possibilities of solving numerous problems with shared mobility, such as [
8,
9,
10,
11]:
adapting shared mobility services to the needs of society;
selection of vehicles for systems;
elimination of communication chaos related to vehicles scattered in urban areas;
modeling the functioning of shared mobility services;
optimization of shared mobility services;
security of shared mobility services and others.
Focusing on one of the thematic areas of research on shared mobility, safety, it should be stated that despite the multitude of works related to this issue, the emphasis is on research topics that would concern solving the problem of inappropriate behavior of users using shared mobility system [
12]. Numerous scientific studies on the analysis of the functioning of shared mobility systems in cities have noted that users of systems such as scooter-sharing, bike-sharing or car-sharing often use them in a random, often aggressive way, not paying attention to the style of their driving and not caring about rented vehicles [
13,
14]. As a result, users are often involved in various types of accidents or accidents. Relating this type of behavior to the issue of road safety, research emphasizes that aggressive driving is currently one of the leading problems [
15]. Studies show that the aggressive driving style of drivers increases the risk of an accident 15-fold, regardless of whether the driver is a professional or a private driver [
16]. Moreover, inappropriate behavior of users of shared mobility directly affects operators providing shared mobility services. They are associated with additional costs incurred for vehicle repairs, but they are also important in perceptions of the services by society at large, which, due to the inappropriate behavior of service users, begins to see shared mobility systems as dangerous [
17]. As a result, we are increasingly dealing with some urban centers that limit the functioning of shared mobility systems in their area or create various types of referenda aimed at developing solutions for the proper management of services; such a referendum took place, for example, in Paris [
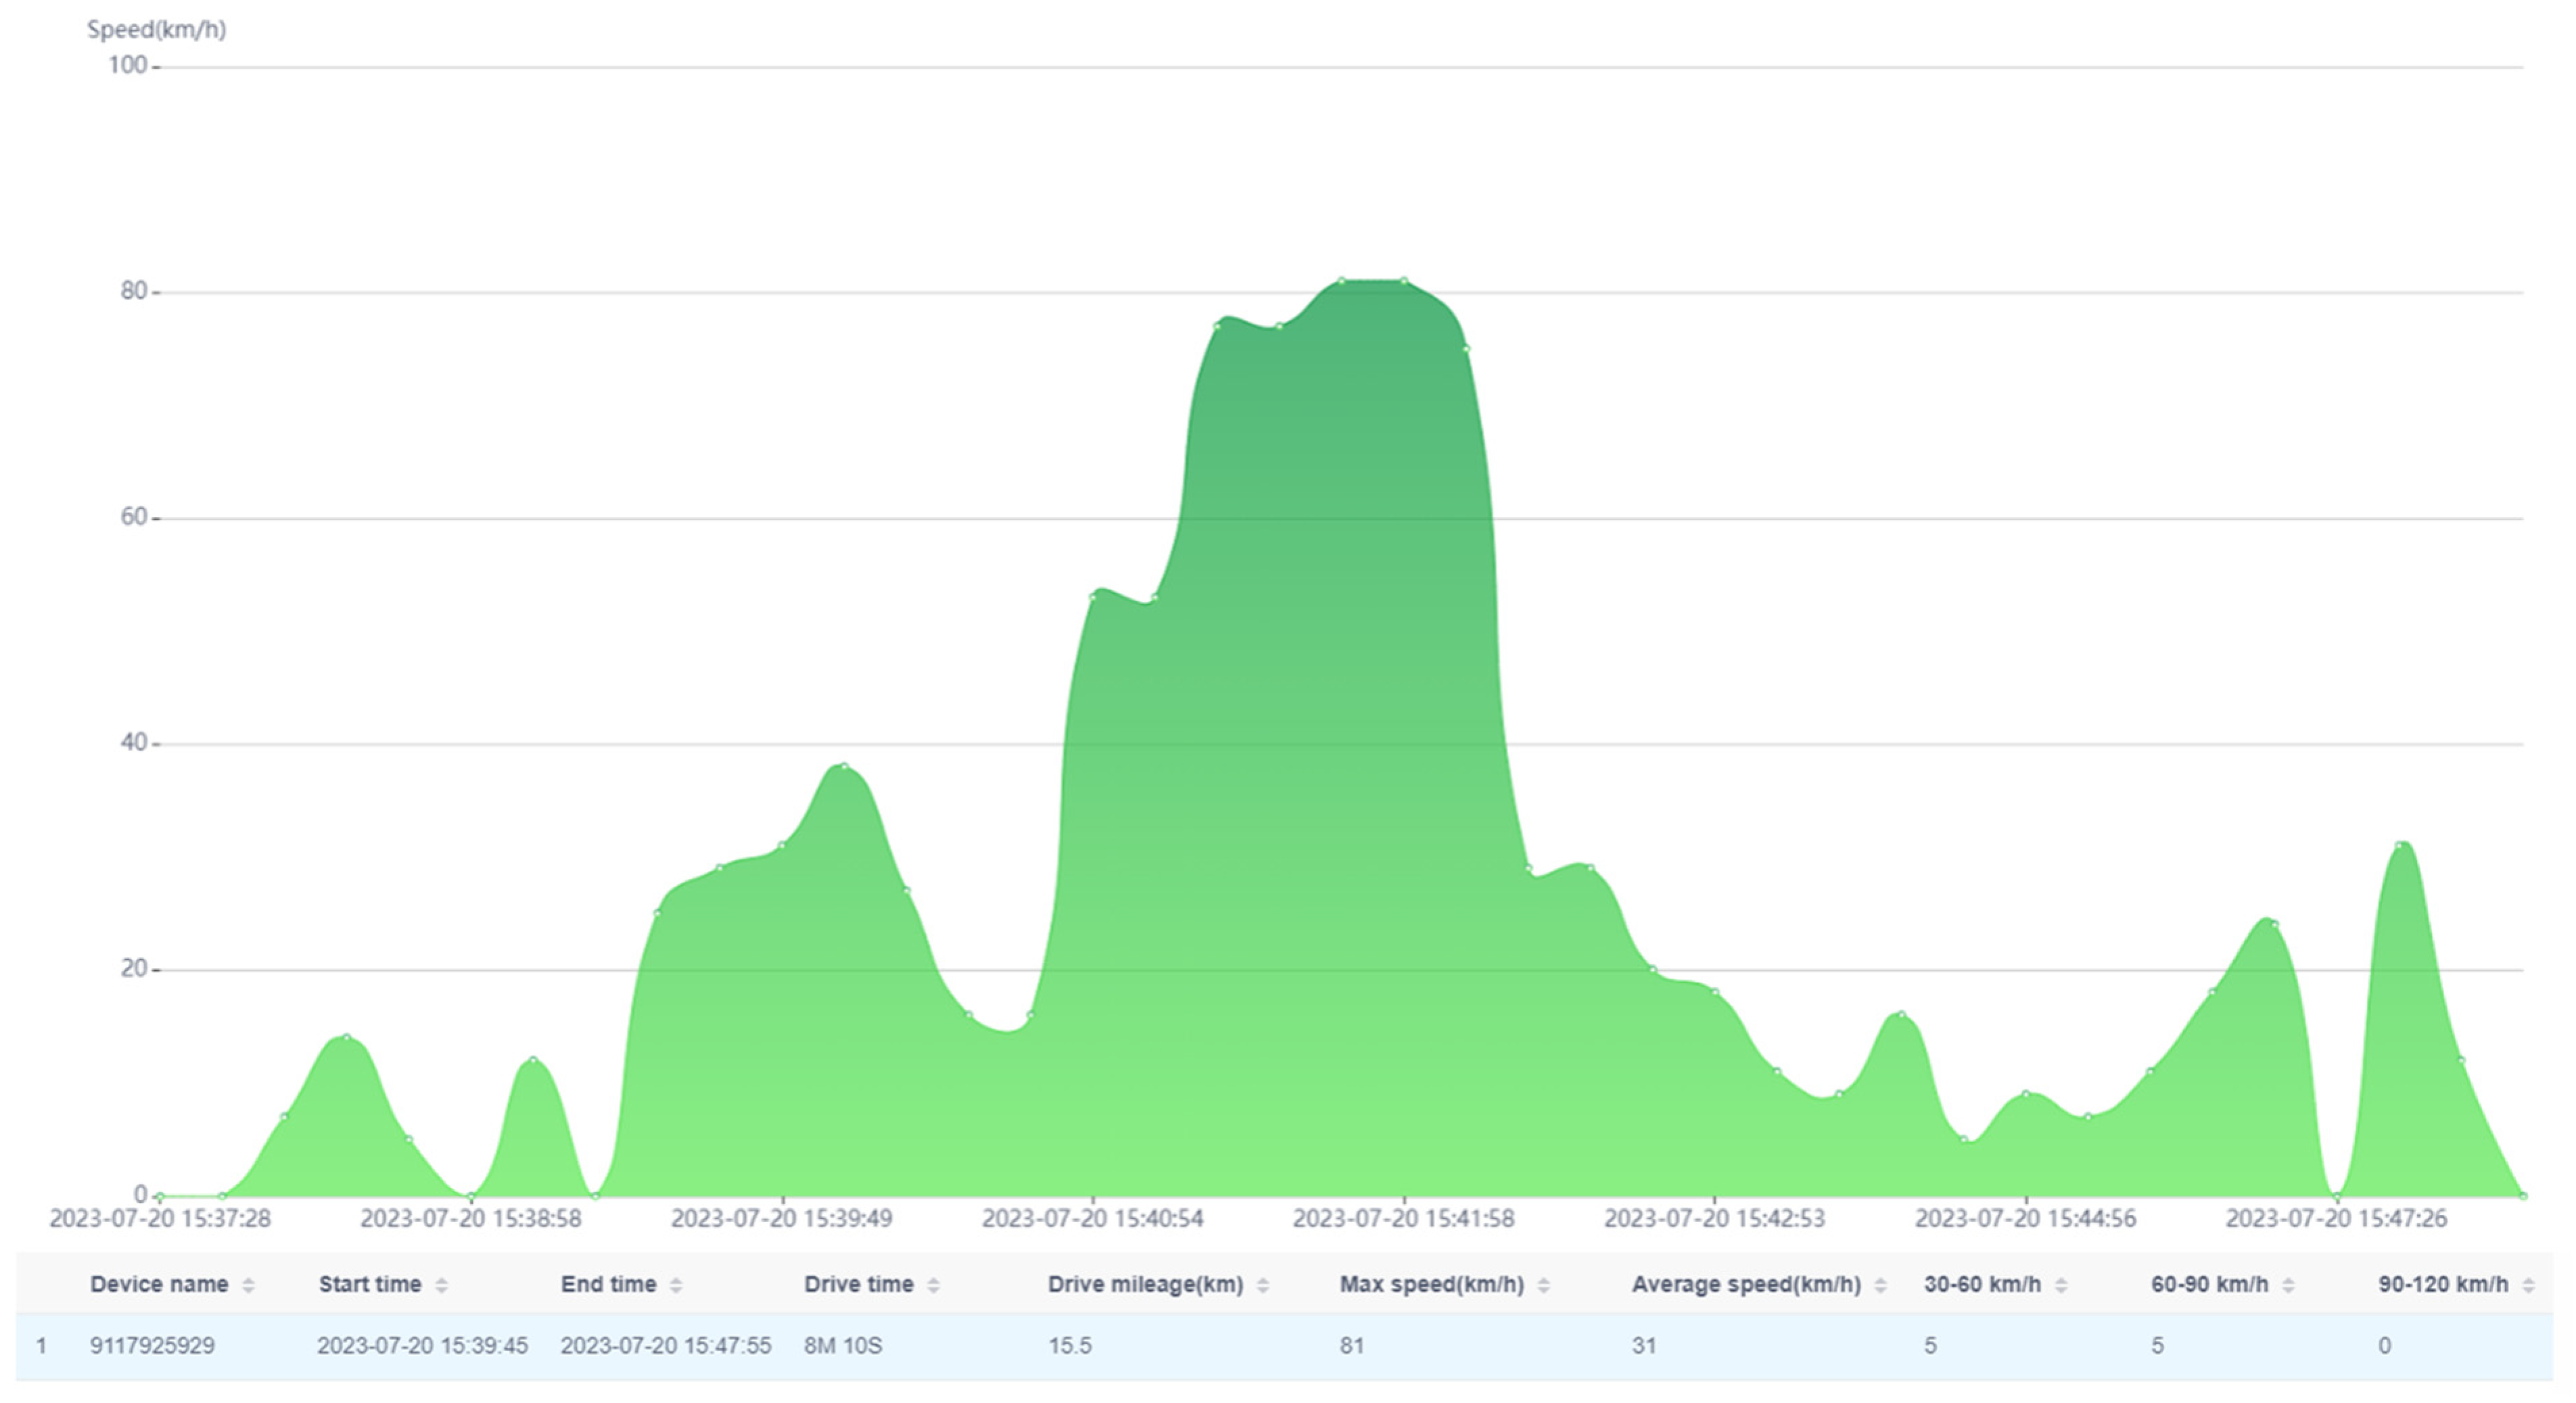
18]. An exemplary speed course of a vehicle used in the carsharing system is shown in
Figure 1.
As can be seen in
Figure 1, the average speed of a vehicle moving in the city was 31 km/h, which is generally acceptable. Unfortunately, speeding can be also observed in a certain range, where the maximum speed was 81 km/h, which is unacceptable in urban conditions.
To solve the problem of improper use of shared mobility systems, a machine learning model that will support shared mobility operators and smart city managers is proposed by the author to predict the correctness of journeys made by shared mobility vehicles. It is an innovative solution that uses the latest technology, which is artificial intelligence. In addition, the use of artificial intelligence in solutions supporting the functioning of shared mobility systems is a kind of novelty, as there are no such practical applications and theoretical framework in the literature so far. This article is a presentation of the model developed based on research on shared mobility systems carried out by the author. The aim of the work is to indicate the possibility of correct identification of vehicle journeys from shared mobility systems. The need to search for various types of solutions to eliminate the inappropriate behavior of users of shared mobility systems is evidenced by the continuous development of systems that predict that by 2027 the number of users using shared mobility systems will reach five billion [
19]. Moreover, according to the report [
20], it was estimated that in 2023 over 29 billion devices will be connected to the Internet of Things (IoT). This only underlines the importance of how much data today’s cities will have to deal with, especially in terms of the security of using them.
This article has been divided into five parts. The first part is a general outline of the existing problem and a presentation of preliminary information in the field of mobility in smart cities. The second part is a presentation of the methodology that was used to develop the model. The third part presents the results of the obtained research, which are discussed in the fourth part of the work. The fifth part is a summary of the article along with conclusions, limitations and further research plans of the author in the research topic undertaken.
2. Data and Methods
Machine learning is one element of artificial intelligence (AI), which is being used in more and more areas of daily life [
21]. The services offered as part of smart cities are also built with the use of artificial intelligence. Previous records of models describing the occurring phenomena required a lot of time to conduct research, and their results were limited by an untested element [
22]. One of the solutions currently in use is the ability to use existing data as part of the input data, or data validating the model. In this article, the data used to train the functions published in other original articles [
23,
24,
25,
26,
27] were also used to verify the data obtained during the test runs.
The proposed model to evaluate the correctness of the driver’s journeys was built according to the scheme of its functioning presented in
Figure 2.
The developed model was built of four main parts. The first part is the identification of the particular vehicle that has moved in the vehicle-sharing scheme. The data model describing the
was written with the Formula (1):
where:
—individual number of the vehicle [-];
—number of variables [-];
—variables describing the technical data of the vehicle [-].
The following exemplary technical data of one of the vehicles (2) were adopted in the developed model:
where:
—vehicle brand [-];
—vehicle model [-];
—engine power [kW];
—declared energy consumption [kWh/100 km];
—battery charge status [%];
—number of vehicle seats occupied [-].
Another part of the model is a set of data from each trip (
) of the vehicle, represented by a data matrix (3):
where:
—number of horizontal and vertical matrix levels [-];
—data describing the route traveled [-];
—individual identification number of a given user [-].
The sample trip data are presented in the form of
Table 1.
An exemplary view of the route taken by the user is shown in
Figure 3.
Subsequently, the
and
data are exported to the database, which keeps a copy of the archived data and at the same time analyzes on this basis, identifying the correctness of the trip. The analyzed data are a set of
training data, which consists of the following elements (4):
where:
is an assessment of the drivers’ journeys, which was classified by the model (5):
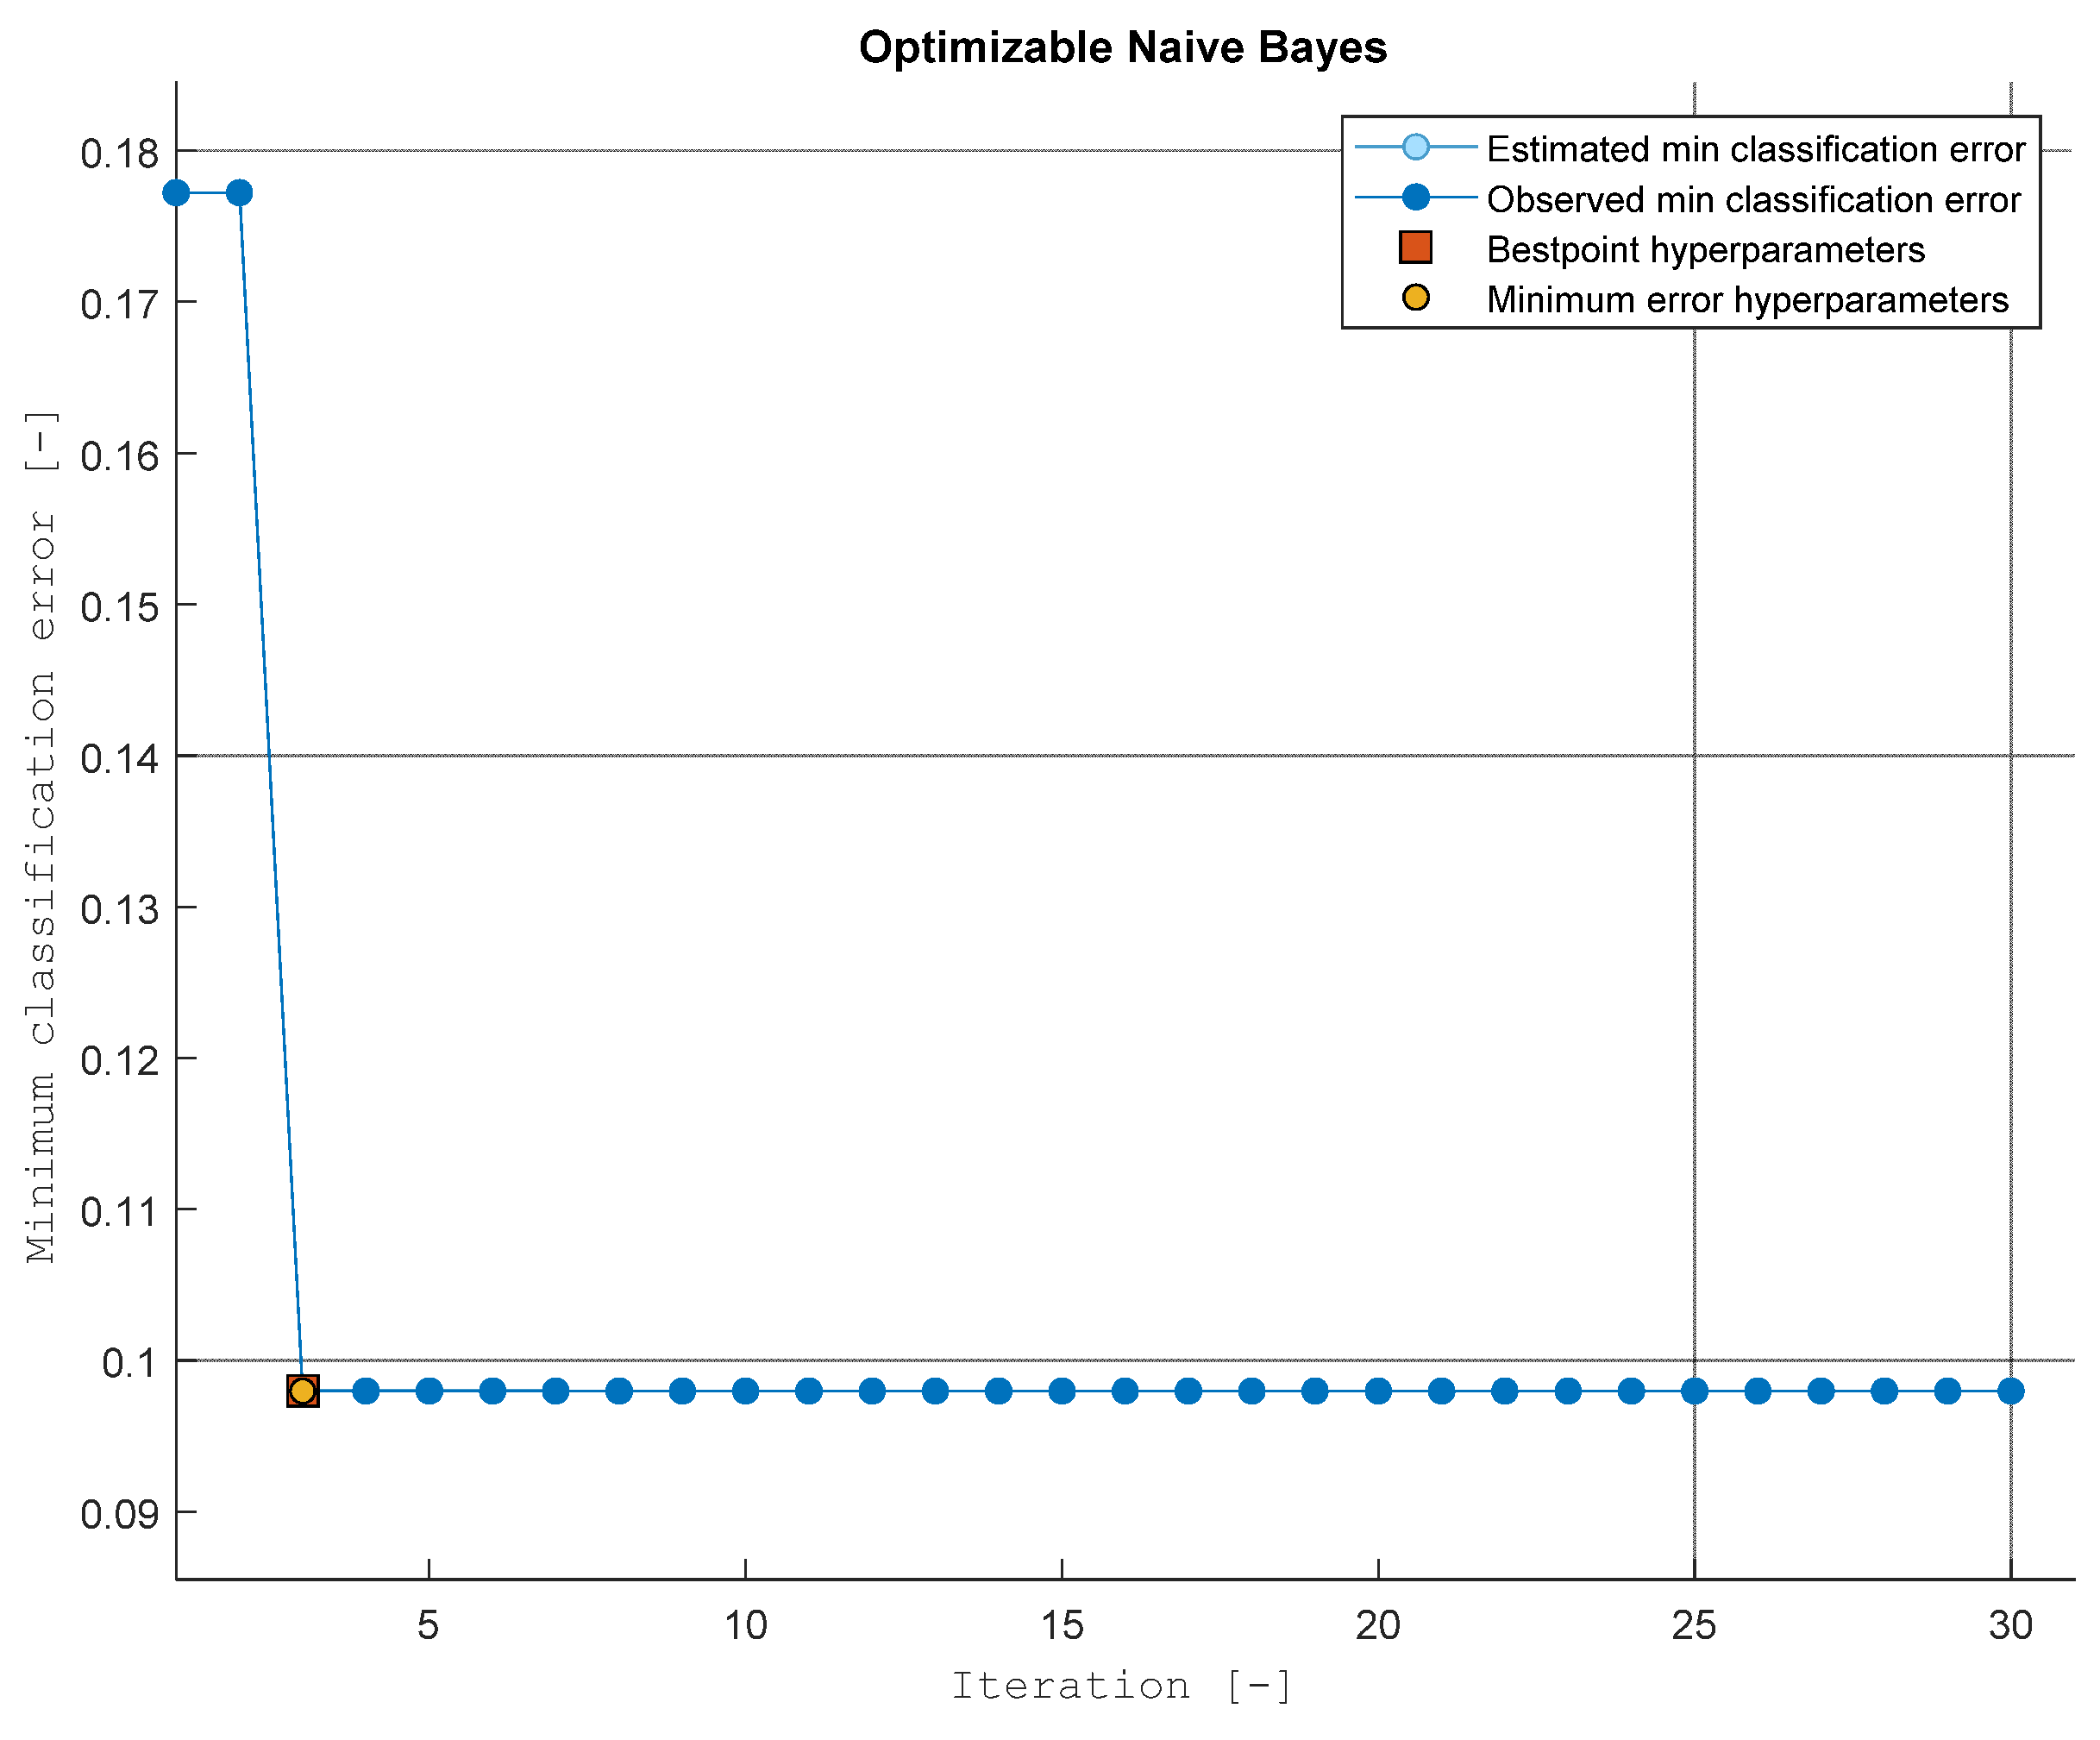
Due to the high availability of model machine learning tools, an analysis of the selection of the optimal model training was carried out for the prediction model [
28,
29]. Models created on the basis of the methods were adopted for the analysis: Tree models, Naïve Bayes models, Support Vector Machines (SVM) models, K-nearest neighbors (KNN) models, Ensemble (Tree) models and Neutral Network models. In addition, to optimize each of the applied machine learning methods, the minimum value of the classification error was verified for various parameters of model building.
Figure 4,
Figure 5,
Figure 6,
Figure 7,
Figure 8 and
Figure 9 show the results of individual methods and the values of the minimum classification error in individual iterations (changes in model-building data).
In order to assess the usefulness of the methods and to create an appropriate model, the assessment measures of individual factors were used, such as: True Positive Rate (TPR), True Negative Rate (TNR), False Positive Rate (FPR), False Negative Rate (FNR), Minimum Accuracy (MA) and minimum value of the classification error (MCE) according to Formulas (6)–(11):
where:
—True Positive—the number of observations correctly classified into the positive class.
—True Negative—the number of observations correctly classified into the negative class.
—False Negative—the number of observations classified into the negative class, when in fact the observation belongs to the positive class.
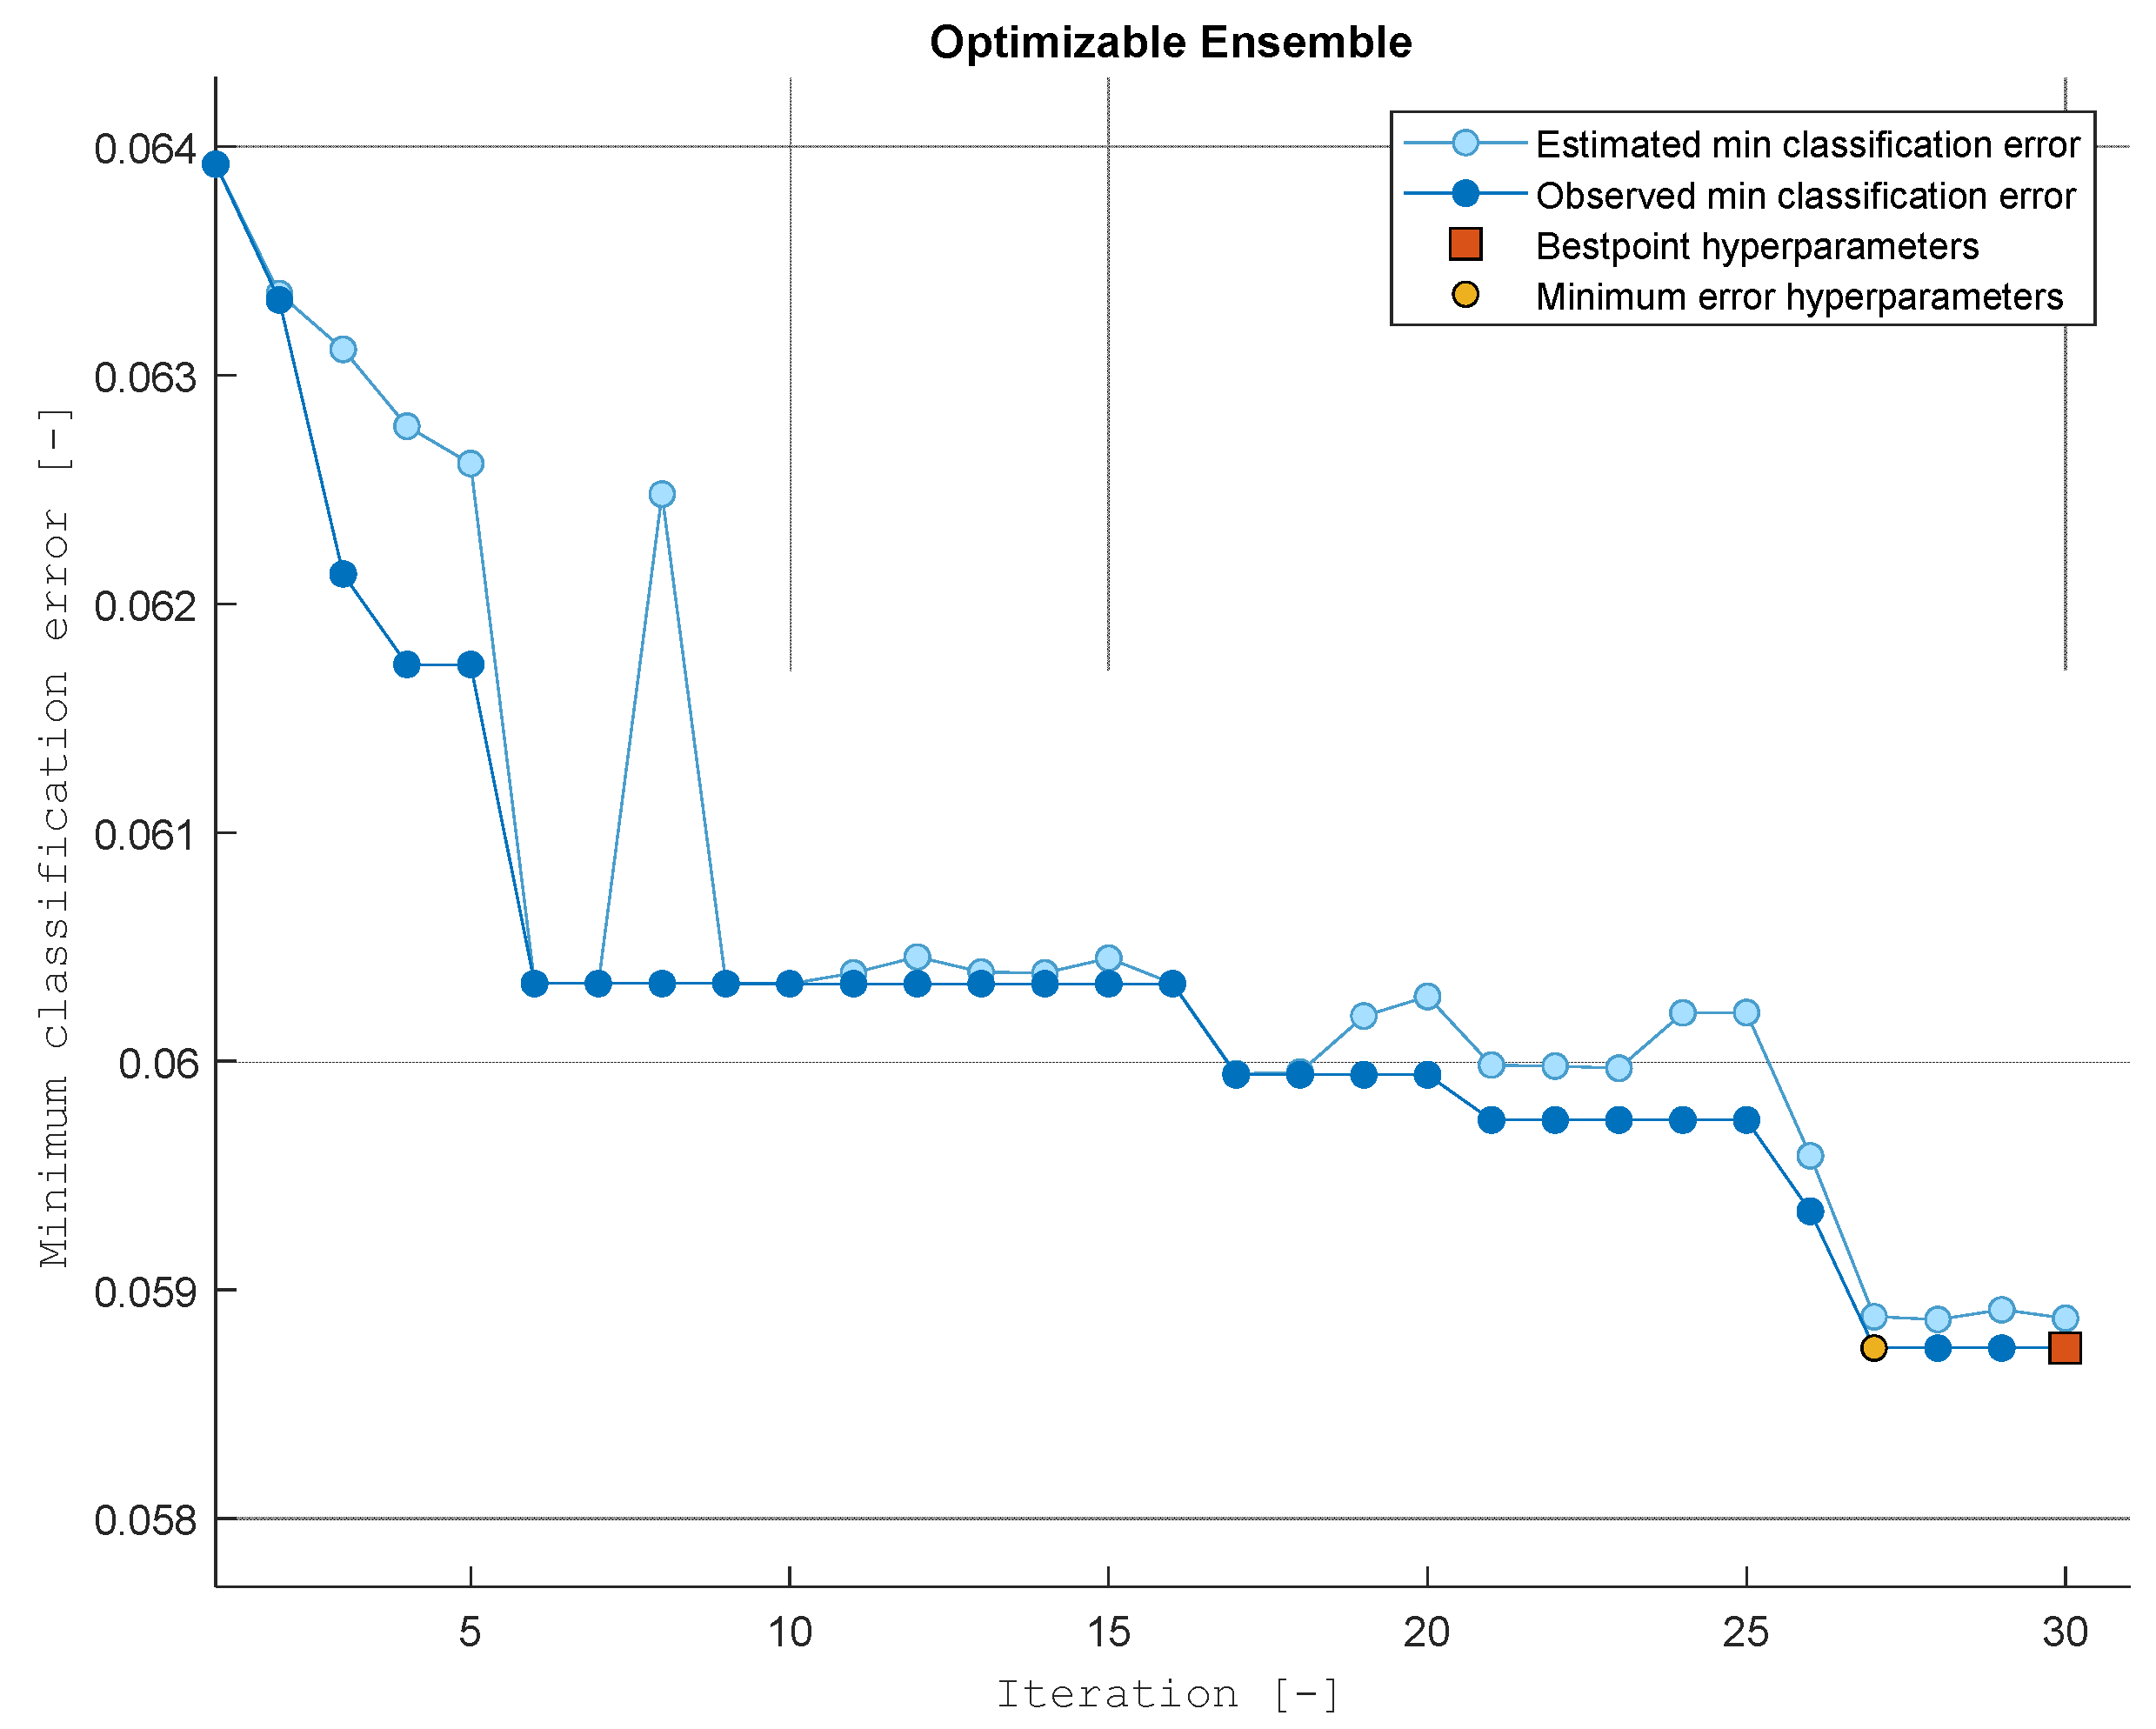
After performing the calculations, the lowest value of the change in the minimum value of the classification error for the training data was obtained for the Ensemble (Tree) method, which achieved a result of 5.87%. The second in the ranking was the Tree Models method, which also achieved a result of less than 6% of the classification error. Detailed results for the training data are presented in
Table 2. It should be emphasized that the remaining methods after several iterations showed a constant value of the classification error, which ultimately confirmed that the Ensemble (Tree) method is the most advantageous method for further use. The detailed results of the classification error value and the correctness of the classification of the training data model are presented in
Table 2.
The models created were trained with training data to verify the correctness of the models’ predictions. For the models, after checking with test data, the values of the minimum classification error of the models and their classification accuracy were recalculated. Detailed results of the classification error value and the correctness of the model classification for the test data are presented in
Table 3.
It can be concluded that after testing the model with test data, the accuracy of the model prediction decreased by about 0.5%. Due to the obtained high rates of prediction accuracy and low value of the classification error, the Ensemble (Tree) method was chosen as the main research method.
The selected method also has several advantages and disadvantages. The main advantage is that the proposed method is characterized by better accuracy and efficiency in the case of complex solutions. In addition, the method can work with different types of data, and it is not required to enter data of one type. An undoubted disadvantage of the method is the need for high computing power so that the study is not time-consuming. The work is carried out on a large amount of data that is necessary for the model to work. With a large number of variables, it may be difficult to interpret the results and determine the correct relationships. However, despite the disadvantages, in the analyzed example this method obtained the highest value of matching the training data to the test data [
30,
31].
The next step is to perform a graphical interpretation of the efficiency of the predictive model by determining the qualitative characteristics of the classifiers. This graphical interpretation is called the ROC curve. The ROC curve is created by determining the cut-off points (
according to the Formula (12):
Then, partial dependence graphs will be determined, showing the impact of the individual factors (features) tested on the predicted result of the prediction model. The partial dependence function can be represented by the Formula (13):
where:
The end result of the prediction model will be the determination of the correctness of the journey made and the identification of whether the vehicle is moving in urban or extra-urban conditions. The developed machine learning model will use a group of supervised machine learning factors based on the ensemble tree method.
3. Results
In order to build the final version of the model, data from the existing vehicle sharing system operating in Poland were used. For this purpose, 5558 individual journeys of users were analyzed and individual journeys were assessed. The input data were divided into two groups of data: model training data (90%—of the input data set) and model training data—Input data (10%—of the input data set).
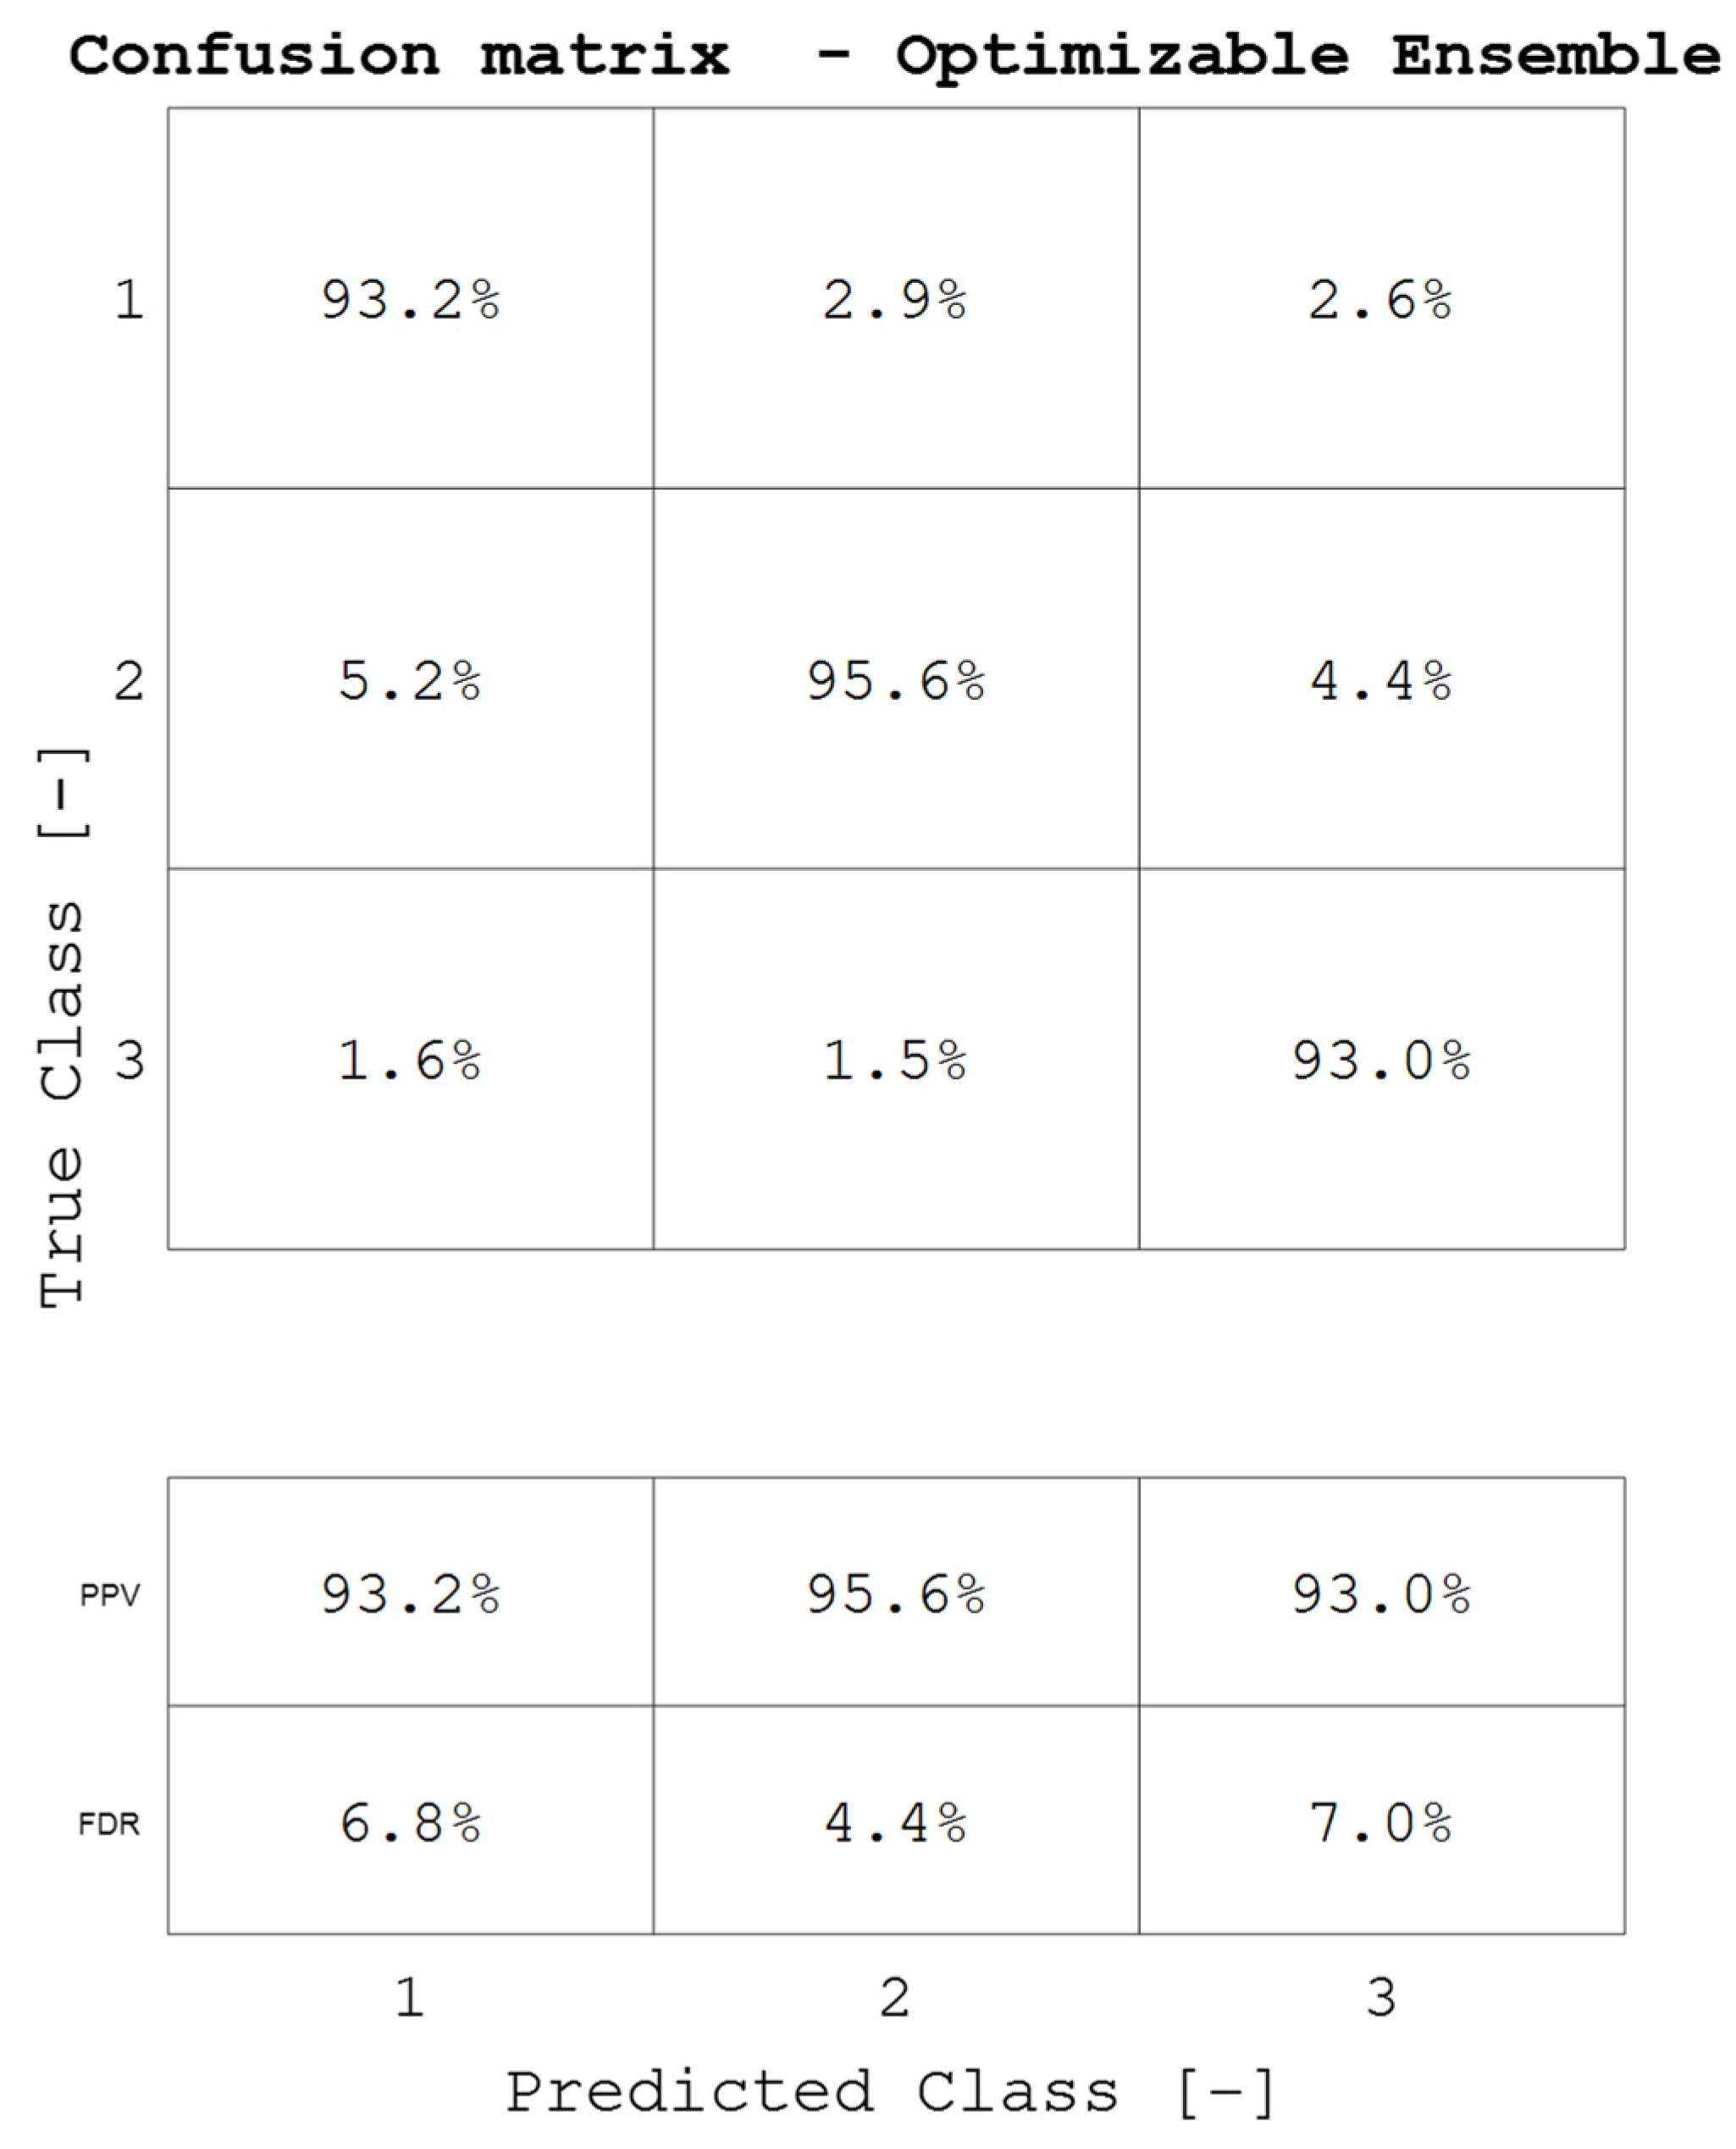
Based on the
data, a confusion matrix was determined to determine the TPR, FRN, PPV and FDR values. The confusion matrix is shown in
Figure 10 and
Figure 11.
As can be seen, the coefficient values obtained in
Figure 10 and
Figure 11 are characterized by high values above 90%. This means that the training data and test data have been correctly classified. Subsequently, a graphical interpretation of the efficiency was determined by creating the ROC curve. The ROC curve for the created model is shown in
Figure 12.
As can be seen in
Figure 12, the variability of TPR depending on FPR is linear. In addition, the Gini coefficient (AUC) for all three predictors is >95%, which only underlines the correctness of the prediction model.
- -
red line—prediction of vehicle movement in urban conditions;
- -
yellow line—prediction of vehicle movement in non-urban conditions;
- -
blue line—incorrect prediction of vehicle movement.
The indication of the vehicle travel time (
Figure 13) allows one to determine that, as the travel time increases, the probability of discrepancies detection decreases. On the other hand, the probability of moving outside the built-up area increases. The probability of moving around the city assumes a practically constant value of 26%.
The relationship between the length of the trip (
Figure 14) and the prediction is very important. In the range up to 3 km, the model determines that vehicles mainly move in the urban cycle, correctly and incorrectly. However, after exceeding the value of 3 km, the prediction of movement in the non-urban area begins to dominate.
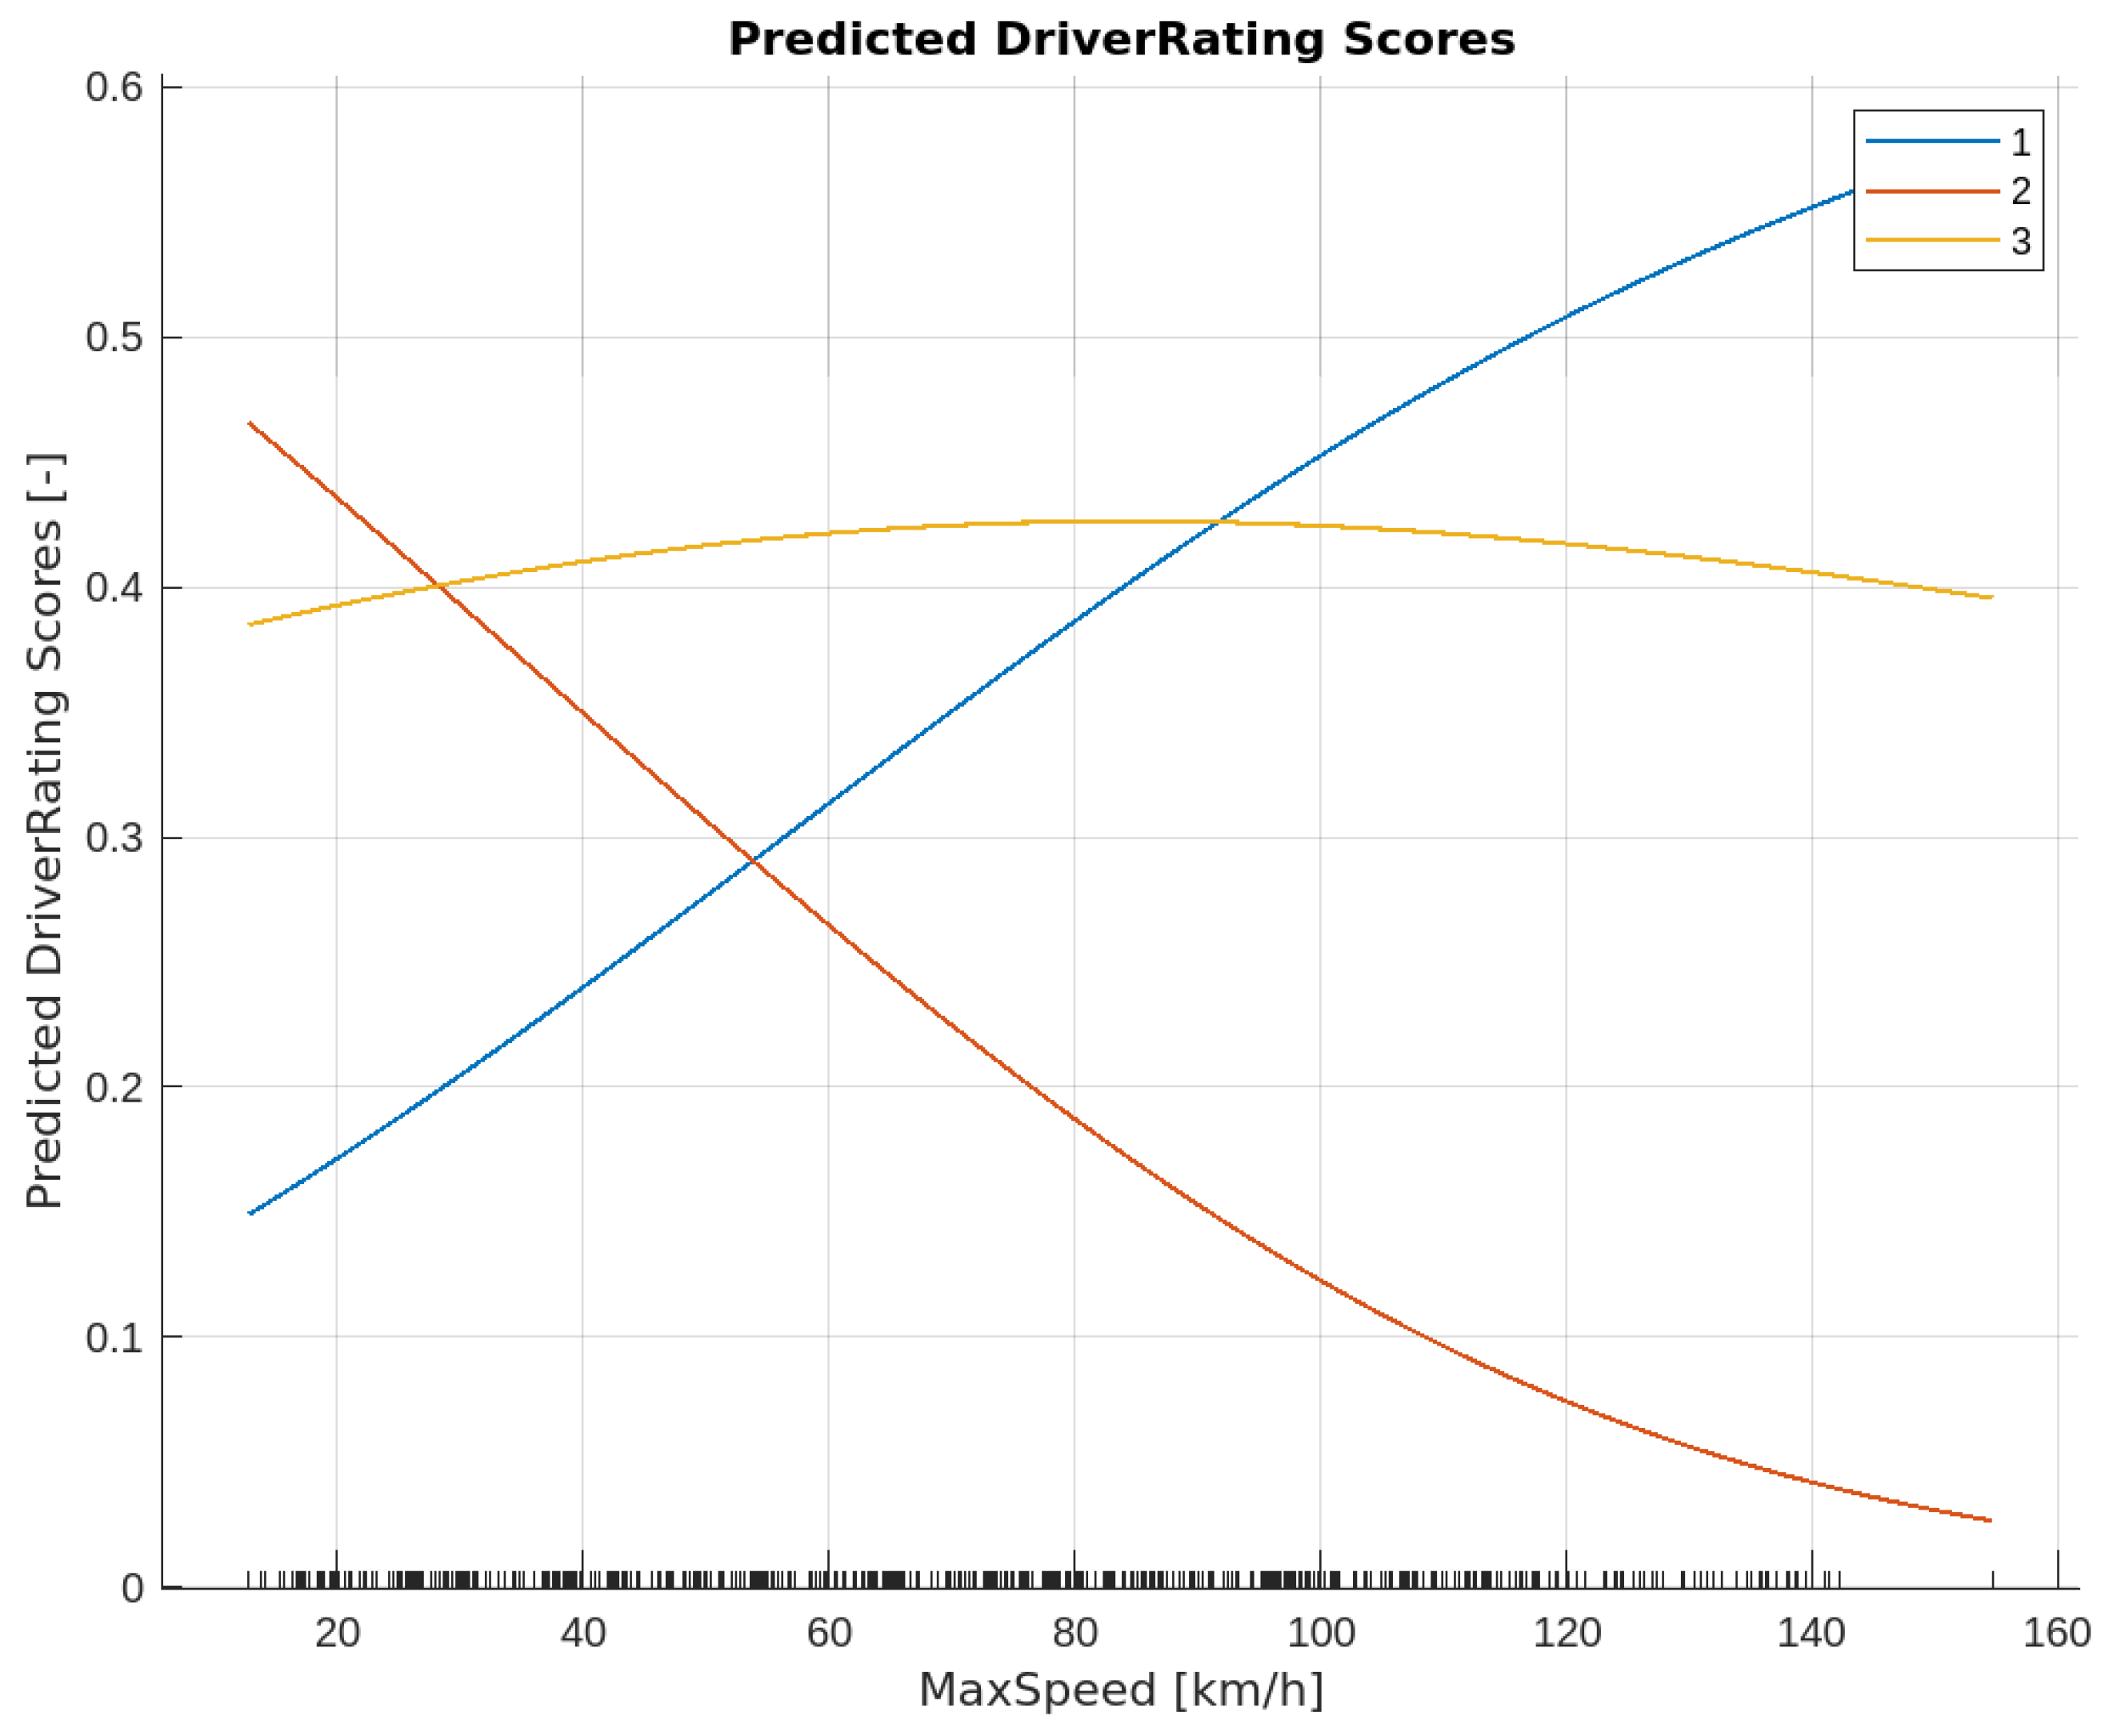
The maximum speed detection dependence (
Figure 15) has a very large impact on the prediction result. As can be seen in
Figure 15, if the speed exceeds 54 km/h, the model will strongly strive to predict incorrect vehicle movement in urban conditions. The stability of the prediction is maintained by detecting movement outside the built-up area.
Determining the average speed (
Figure 16) with which the vehicle moved during the entire route determines that when the speed exceeds 45 km/h, the model prediction changes from correct vehicle movement to incorrect.
The graph of the partial influence of the factor ‘average value of energy consumption’ (
Figure 17) on the prediction value shows that with the increase in the average value of consumption, the value of the average energy consumption decreases in the case of moving in non-urban conditions. On the contrary, the average energy consumption increases in the case of incorrect trips.
The last factor analyzed was energy consumption in relation to the route traveled—shown in
Figure 18. The factor constructed in this way determines the nature of the factor, and it is visible that with the increase in this factor, the nature of driving the vehicle in extra-urban mode is predicted. On the other hand, low values of the factor characterize incorrect driving of the vehicle.
Based on the built model, an application with an intuitive graphical interface was launched, which has an implemented prediction model for evaluating individual driver trips. An example screenshot of the application is shown in
Figure 19. The application has two basic functioning dependencies:
- -
input data can be imported directly from the vehicle—in real mode;
- -
archival data can be kept—manually.
In the application window, it is possible to enter data or their parts in accordance with
Table 1. The model does not require the completeness of all data to predict the result. However, it should be remembered that entering more data increases the chances of obtaining the correct result.
The final effect of the application is to determine whether, based on the received data, the driver used the vehicle correctly or whether he or she misused the vehicle. The application was made using the Matlab2023a software.
4. Discussion
The results obtained under the developed model clearly indicate that it is possible to build a fully functional tool to predict the behavior of vehicle drivers in shared mobility systems. The input data and functions of the behaviors defined in previous studies enabled the creation of a model that generates correct results of classification of incorrect behaviors of drivers at the level of 95%. The conducted research is an innovative solution that allows determining the behavior of drivers of vehicles from short-term rentals. In addition, the model also received a graphical overlay that allows people who are not necessarily well-versed in the subject of machine learning to use the software.
When comparing the research conducted with the analyses performed by other scientists, it should be stated that no identical studies referring directly to shared mobility have been reported. Referring to other research carried out in the field of broadly understood transport, it is worth mentioning the research carried out by Mohammadnazar et al. [
32], which concerned the development of a proposal for an unsupervised machine learning model as one of the elements of identifying groups of drivers and the variability of driving behavior. However, it was a division that distinguished only drivers, highway drivers, street drivers and local road drivers. The model developed by the authors [
30] did not take into account driving identification of whether the vehicle was moving in accordance with the regulations. In addition, it used another method of unsupervised machine learning, k-means.
For comparison, Liu et al. [
33] in their research attempted to use machine learning to predict the driving conditions of an electric and a hybrid vehicle. As a result, they proved that the simulations carried out using the proposed model can provide an improvement in speed prediction, which in turn will translate into improved vehicle operating economy. This is extremely important in the case of vehicles used in shared mobility systems, whose operational activities are very often neglected.
Subsequently, Wang et al. [
34] used machine learning to predict passenger injuries. They proved that it is possible to identify a collision scenario with a delay of 1.2 ms. This type of application will improve the traffic safety of autonomous vehicles. They used the SVM algorithm to build it.
The safety of driving a vehicle in urban conditions is a function of a large number of factors and variables. Each vehicle driver has his own individual driving style, which can be applied or can be an act of temporary preference of the driver [
32]. Deng et al. [
34] proposed the Markov model as a method of recognizing the driving style, which uses data on the braking characteristics of the vehicle. The research consisted of the subjective assessment of the drivers who underwent the experiment; while making the journey, they interpreted what driving style they used. Unfortunately, the identification of one’s own passage is burdened with a significant error. Aggressive driving is one of the road safety problems. Studies [
35] indicate that the aggressive driving style of drivers increases the risk of an accident 15-fold, regardless of whether the driver is a professional or private driver [
15,
16].
The integration of many prediction models of phenomena that occur in shared mobility services may contribute to the creation of a global model that will treat existing models as subordinate. Tuncel et al. [
36] attempted to integrate ride-matching and vehicle-balancing models for shared mobility services. The integrated model solves the problem of matching passages and balancing vehicles. Such a connection leads to an improvement in the functioning of the entire system and also allows the detection of vehicles that are not often used in the shared system.
Due to the fact that machine learning models process large amounts of data, it is possible to use data training of a given model for other applications. The authors [
37] determined that estimating safety using pre-programmed dependencies can increase the traffic safety of unprotected road users, which is extremely important in the structures of smart cities.
5. Conclusions
In conclusion, the variety of emerging artificial solutions will support the management and functioning of modern cities. The resulting machine learning model, which can assess the journey of a particular user in real time and on the basis of archive data, is a support for shared mobility operators. Unfortunately, at the moment, crossings are not controlled and more and more often users use vehicles contrary to the regulations and local regulations.
The created model generates the evaluation values of the correctness of the run and classifies which run was made with an accuracy of over 95%, which makes it a very accurate and stable model. In addition, operators can pay attention to which factors generate the highest probability of a given classification.
Based on the research conducted and the created prediction model for the assessment of the correctness of the ride in shared mobility systems, the following conclusions were formulated:
On the basis of the obtained partial graphs of dependencies of the prediction model, it is possible to determine the probability of the influence of the factor on the evaluation of the trip;
The practical use of the model together with the graphic overlay facilitates the use of the built prediction model;
The obtained accuracy of the model prediction is at a very high level—over 95% of the correctness of the classification of passages;
Machine learning models can be expanded; however, it is important not to overtrain the model with incorrect data;
The use of machine learning in security-related applications should be performed using supervised machine learning.
The built model can be updated with data from other previous studies or studies by other authors. Therefore, it is possible, based on data on journeys and their classification, to update individual journey prices or to block the possibility of using the system by per-sons who excessively do not comply with the regulations or who break local regulations.
The conducted research on shared mobility services points to current and future directions that the author wants to take.
There is a huge research gap in the use of machine learning in solutions that can automate the work of shared mobility systems. In addition, machine learning will reduce the need to analyze huge amounts of data to detect inconsistencies. From the point of view of the practitioner—the operator and the policy—of local authorities, it will simplify the management and functioning of the system. Furthermore, the model can become a subsystem of existing solutions used in smart cities.
In the next stage, the model will be tested in practice on a test number of vehicles from the fleet of the functioning sharing system. The application graphic page will also be updated, where the user service model will be implemented, along with their travel history.
The limitation of the model’s application, at the moment, is the possibility of using it only in the mode without the possibility of data training. Model training data update the model only in manual mode overseen by the model author. Another limitation is also the need to have computing equipment that will analyze the data received on an ongoing basis. In addition, the model should support, and not exclude, the human factor in decision making at the current stage.


