Article

Visual Communication in Shared Mobility Systems as an Opportunity for Recognition and Competitiveness in Smart Cities

1
Department of Road Transport, Faculty of Transport and Aviation Engineering, The Silesian University of Technology, Krasińskiego 8 Street, 40-019 Katowice, Poland
2
Department of Fine Art Education, Faculty of Education, Comenius University in Bratislava, Račianska 59 Street, 813 34 Bratislava, Slovakia
3
Department of Transport Technology and Economics, Faculty of Transportation Engineering and Vehicle Engineering (KJK), Budapest University of Technology and Economics, Műegyetem rkp. 3, 1111 Budapest, Hungary
*
Author to whom correspondence should be addressed.
Smart Cities 2022, 5(3), 802-818; https://doi.org/10.3390/smartcities5030041
Submission received: 15 June 2022 / Revised: 9 July 2022 / Accepted: 12 July 2022 / Published: 15 July 2022
(This article belongs to the Special Issue Mobility as a Service Systems in Smart Cities)

Abstract

:
Due to the intensive development of urbanization and digitization, the number of smart cities in the world is growing. Along with their exposure, more and more challenges are facing the service providers of the various types of systems offered in their area. These types of services include shared mobility systems that, as an alternative to transport by own vehicle, are becoming one of the leading promoted forms of mobility. Because of the prioritization of shared mobility solutions, more and more operators appear on the smart city markets, which is associated with many challenges related to the increased competition among service providers. One of the challenges is the appropriate visibility of the brand and vehicles in urban transport systems. This aspect, despite its high applicability, constitutes a research gap among world studies. Aiming to fill this gap, this article was dedicated to the issues of perception of visual communication by operators of shared mobility services. As part of the research, an expert study was conducted among representatives of shared mobility services operating in Poland. The expert survey was conducted with the Computer-Assisted Web Interview (CAWI) technique. The results of the research show that visual communication is not used quite correctly by operators. Although operators use single visual communication practices, overall consistency is lacking, which would add value to the brand. This article supports operators looking to expand their shared mobility services. What is more, it is also a response to the research gap regarding visual communication and its perception from the point of view of smart cities.

1. Introduction

Urbanization has been a global trend in recent years, and, despite its many advantages, it also brings with it many challenges for the development of modern cities. Statistics show that 55% of the world’s population is located in urban areas and that this figure is expected to increase to 68% by 2050 [1]. Given this growing number of city dwellers, many problems with the appropriate demand for various types of services are inevitable. One of the forms of services that constitutes the bloodstream of the economy and allows to meet the basic mobility needs of society is transport.
Therefore, modern transport is required not only to fulfill the basic function of movement, but also to be sustainable, most accessible, and correlated with urban information and communication technologies. These requirements are aimed at ensuring that transport can meet the challenges of today’s smart cities.
The ability to clearly formulate these challenges and define priorities in terms of their optimal solution and appropriate management is the starting point for the implementation of the idea of the so-called smart city. This is especially important because the quality of life in a smart city grows in line with the availability of transport [2]. As more and more new transport services appear in smart cities with the development of digitization, in order to become aware of their impact on urbanization, it is important to review their actually functioning solutions and implement new concepts [3]. With these assumptions in mind, scientists around the world have for years been looking for various types of solution to improve transport in smart cities, ranging from infrastructure issues to aspects of promotion or striving to change the transport behavior of residents. All activities are carried out in accordance with the idea of sustainable because sustainable transport is considered one of the main aspects that characterize smart cities [4]. Among the ideas promoting sustainable transport in cities, it can be distinguished, for example, that the ‘15-min city’ concept, which aims to provide sustainable walking access to central services and/or places, helps to reduce the phenomenon of commuting and thus reducing negative externalities such as pollution of air [5,6]. Among other solutions closely related to the ‘15-min city’, Balletto et al. emphasize that it is particularly important for smart cities to ensure an appropriate level of accessibility and walkability for residents [5]. In turn, Lydon and Garcia emphasize the need to create tactical urbanism with social associations and to create open urban spaces [7]. In contrast, Aibar and Bijker indicate the need to pay attention to social needs over technological in cities [8]. In turn, Eggimann states that it is necessary to focus on spaces for people to create Superblocks that will facilitate walking and cycling and reduce the movement of motor vehicles [9]. On the other hand, Oh indicates that in the case of smart cities, it is particularly important for residents to pay attention to improving the quality of life and increasing comfort, among others by improving the urban infrastructure [10]. What is more, Oh’s research has shown that, for residents of smart cities, it is much more important to focus on everyday services, including access to transport services, over other forms of smart solutions, e.g., crime prevention or Internet access [10]. The importance of proper management of transport systems in smart cities is also emphasized by Nikki Han and Kim [11]. In turn, Simonofski et al. indicate that achieving a sustainable smart city is possible only with the full involvement of residents [12].
Moreover, as research shows, the outbreak of the COVID-19 pandemic turned out to be another accelerator of changes in the field of urban mobility and sustainable transport. For example, Fabris et al. emphasize that, since the outbreak of the pandemic, a transdisciplinary approach is needed in dealing with city reconstruction and the safe use of its space [13]. During the pandemic, cities began to develop various policies and recommendations for the revitalization of transport services in both pandemic and post-pandemic realities [14]. One of the forms of mobility that was widely available to the public in the smart cities, and at the same time limiting the possibility of infection with the COVID-19 virus in public transport turned out to be shared mobility [14]. These types of service include new forms of mobility such as sharing bicycles, mopeds, cars, and electric scooters.
Currently, the sharing economy is defined as the fastest growing business trend in the history of the economy [15]. The value of the global market for shared mobility services in 2021 was USD 85.8 billion [15]. It is expected to reach $185.1 billion by 2026 [15]. Along with the development of systems, there are various challenges and problems that need to be eliminated to achieve the services that will be considered as a real alternative to transport by individual car, especially in pandemic and post-pandemic conditions. Moreover, the proper functioning of the systems on the market is particularly important from the point of view of the development of smart cities and Mobility as a Service (MaaS) systems, where, due to numerous competitions, it is important to promote services not only ensuring adequate supply, but also be properly recognizable on the market.
In recent years, local and international researchers have considered many different scientific issues related to vehicle sharing. For example, the authors of Qin et al. pointed out that one of the main problems associated with car-sharing is the correct relocation of the vehicle fleet [16]. In turn, Osorio et al. indicated that in addition to proper fleet relocation, it should be focus on ensuring adequate vehicle availability of vehicles in response to customer demand [17]. In contrast, the authors of D’Andreagiovanni et al. pointed to the need to pay attention to system price lists and economic aspects [18]. A wide group of research was also devoted to management issues, with a focus on, for example, business model analyzes, the use of IT innovations—e.g., Internet of Things—or recommendations for optimal management in the case of various forms of services—e.g., free-floating car-sharing or bike-sharing systems—or functioning during pandemic period [19,20,21,22,23]. In turn Turoń at al. and Kubik et al. focused on the technical, operational, safety, environmental, and education aspects of using the systems [24,25]. What is interesting is that they also emphasized the occurrence of complaints from users about the technical or visual condition of the vehicles used in the shared mobility systems and about the need to pay attention to this issue among service providers [24,25]. Based on this assumption, the question arose of how to properly consider the concept of visual communication.
Visual communication is communication through images, the transmission of information in a visual form between the sender and the recipient by means of communication [26]. Its purpose is to convey ideas and information. Generally speaking, visual communication is about conveying a meaningful visual message by any creator in such a way that it is readable by the recipient. In the case of entrepreneurs, it is a wide range of activities, including graphic design of websites, logos, logos on their products, their placement and tagging, leaflets, and the general consistency of the messages offered [27].
Basically, visual communication is based on such expressive elements as signs, typography, drawing, graphic design, illustrations, industrial design, advertising, animation, and electronic resources. Due to the use of visual communication, it is possible to influence the recipient of the message more effectively. There are seven elements of visual communication: color, shape, tones, texture, figure-ground, balance and hierarchy [28].
An example of visual communication is presented in Figure 1.
There are many visual communication strategies that can be used to increase interest in a given product or service. They include, among others using [29,30,31,32]:
  • data visualization to show the impact of given work,
  • shapes and lines to outline relationships, processes, and flows,
  • symbols and icons to make information more memorable,
  • visuals and data to tell stories,
  • color to indicate importance and draw attention
From a practical point of view, for companies, visual communication can translate into effective results from the point of view of management and marketing. From the point of view of advertising, it uses communication tools that are based on the promotion of the mix implemented in a systemic manner, while maintaining the integration of the elements of this system [30]. In communication understood in this way, it is necessary to prepare the message in accordance with the principles of synergy and then its elements should constitute a coherent whole affecting the client, so that he undertakes certain behaviors consisting in purchasing, repeating it, postponing, or not realizing it, which is also a possible reaction [30]. Therefore, from the point of view of building a competitive advantage, it is appropriate for enterprises to properly manage their own visual communication.
Among the literature review related to visual communication, no literature was found that would directly refer to the problem of its appropriate application in the case of the shared mobility industry. Recognizing this research gap, the authors devoted this work to the perception of visual communication by operators of shared mobility services in smart cities. The authors assumed that conducting expert research among shared mobility operators would allow them to assess the level of operators’ involvement in the use of visual communication aspects in shared mobility systems in Poland.

2. Methods

To identify the approach to visual communication in companies that offered shared mobility services, the authors proposed their own expert research. The study was conducted for the Polish market of shared mobility services. That market was chosen due to the wide variety of systems occurrence and the constantly growing market value. In relation to 2020, the value of the market was estimated at USD 701 million, and the number of users was approximately 9.1 million [33]. Currently, in 2022, there are 8 electric scooter systems, 10 car-sharing systems, 7 bike-sharing systems, and 5 moped-sharing sharing systems on the Polish market [34].
The study was carried out from September 2021 to April 2022 in a sample of N = 14 representatives from various shared mobility services operators. The research sample consisted of representatives: bike-sharing providers (3 companies), scooter-sharing providers (4 companies), moped-sharing providers (3 companies), and car-sharing providers (4 companies). The respondents were located in the 4 largest smart cities in Poland, i.e., Warsaw, Katowice, Gdańsk, and Wroclaw. The research sample used in the study was purposive. Purposive sampling is one of the non-random methods [35]. It is a technique widely used in scientific research to identify and select information-rich cases in order to make the most efficient use of limited resources [36]. Research involves the identification and selection of people or groups of people who have special knowledge or experience with the phenomenon of interest to the researcher [37]. In addition to knowledge and experience, attention should be paid to the availability and willingness of respondents to participate in the survey [37,38]. Purposive sampling gives the opportunity to conduct research in the case of business groups that are usually not open to sharing data [38,39].
Among the various types of purposive sampling methods, the Homogeneous Sampling (HS) method was used for the study. This method is used in research where it is necessary to reach candidates who share similar traits or specific characteristics, for example the same job position [40]. The HS method assumes to some extent that the respondents are ‘representative’ in this role because they have in-depth knowledge of the phenomenon under study based on their professional experience, which makes their cases informative [40]. This type of strategy is often used for implementation research [35,41]. In the case of this study, it was purposeful to reach out to experts who had specific industry knowledge regarding the functioning of shared mobility systems in Poland. Due to the requirement for specialist knowledge, the survey was attended by managers representing individual shared mobility companies. Moreover, the requirement was specified that each of the respondents should have at least 3 years of work experience in their position. The size of the target sample was determined in accordance with Mishin’s guidelines for designing expert research (expert studies) [42].
The study was spread over the Internet with the Computer-Assisted Web Interview technique (CAWI), a method of collecting information in quantitative market and public opinion research, in which the respondent is asked to complete an electronic questionnaire. to which experts were invited. The experts’ task was to answer 18 questions about visual communication in their company. The questions focused on obtaining information on inter alia knowledge of the concept of visual communication, approach to vehicle fleet colors, vehicle branding and the basis for its implementation, having additional accessories to complement vehicle branding, user involvement in the vehicle branding process, premium vehicle marking, and approach to visual communication from the point of view of market competitiveness. Detailed questions are presented in Appendix A.

3. Results

As a result of the research, detailed responses were obtained regarding the approach to the issue of visual communication by operators of the shared mobility industry in Poland.
The survey was completed by 14 experts who represented 14 shared mobility operators that functioning in the Polish market.
From the point of view of the knowledge about visual communication 86% of respondents knew what visual communication was, only 14% had not encountered this concept so far. Detailed data is presented in Figure 2.
Another issue was the color aspects of the fleet. From the point of view of paying attention to the color of the vehicle, only 15% of the respondents took it into account when choosing a fleet. Importantly, 31% are not able to determine whether it was important to them. On the other hand, 54% did not analyze the color of the vehicles before purchasing them. Detailed data is presented in Figure 3.
Despite the low interest in the color of the vehicles, when buying them, the respondents were able to indicate which color of the vehicle, in their opinion, is the most important from the point of view of the sharing they offer. The leading color was silver (29% of respondents), followed by black (21%), ex aequo white and gray (14%), and the remaining 21%. Detailed data is presented in Figure 4.
The next aspect analyzed was to determine whether all vehicles provided under shared mobility systems have the same color. Respondents’ responses show that only 21% of the vehicle fleet has the same color. Detailed data is presented in Figure 5.
The next aspect analyzed was to determine whether all vehicles provided under shared mobility systems have the same branding. Respondents’ responses show that only 29% of the vehicle fleet has the same branding. Detailed data is presented in Figure 6.
When it comes to branding, it was really important to answer the question of what or who influenced the selection of a specific type of branding. The results show that 43% of the respondents do not know what or who influenced the type of branding, 21% of the respondents cooperated with an advertising agency when choosing branding, ex equo 14% of respondents stated that it was an individual decision of employees or the management board, and only 7% conducted their own research in the field of vehicle branding. Detailed data is presented in Figure 7.
From the point of view of the fleet recognition, it was important to determine whether the operators have different types of accessories that are to attract the attention of customers; 93% of the respondents do not have such accessories. Only 7% declare having this type of accessory, which includes, among others, additional illumination of the vehicle, e.g., green of the available vehicle and red of the occupied vehicle, or displaying the operator’s name with under-body lighting. Detailed data is presented in Figure 8.
The level of system users’ involvement in vehicle branding was also examined. The results show that in 93% of the analyzed companies, users have no influence on vehicle branding. Detailed data is presented in Figure 9.
From the point of view of the perception of vehicles, it is also important that the car fleet is clean. Respondents emphasize that 93% of them pay attention to the fact that it is clean. Detailed data is presented in Figure 10.
Clarification of the question about the level of cleanliness of vehicles is to obtain an answer to whether users are able to submit their comments on the level of cleanliness of the vehicle. The research shows that, for each of the analyzed operators (100%), users have the opportunity to submit their comments. Detailed data is presented in Figure 11.
The level of user satisfaction with vehicle branding was asked successively. As many as 64% of users report their reservations as to the branding of vehicles. Detailed data is presented in Figure 12.
It was also particularly important to obtain answers to what issues users are complaining about; 8 user complaints were answered. Detailed data is presented in Figure 13.
Another important issue was obtaining information on whether companies promote good practices related to vehicle cleanliness, e.g., washing or vacuuming by users. The results show that 57% of the companies surveyed do not have such solutions implemented, 21% of operators have implemented such solutions, and 14% are not sure if they have them. Detailed data is presented in Figure 14.
The respondents were also asked about the branding of their premium class vehicles if they have such in the fleet; 71% of the respondents did not have a separate branding for premium class vehicles. Detailed data is presented in Figure 15.
Subsequently, they were asked to refer to the question of whether operators believe that visual communication can improve their company’s competitiveness; 86% of the respondents admitted that they were not aware of it, and only 14% believed that it had an impact on the competitiveness of their service offer. Detailed data is presented in Figure 16.
The last question was whether companies would change their branding under the influence of their competitors. Research shows that 43% of operators would not change their visual communication, and 57% are not sure what they would do in such a situation. Detailed data is presented in Figure 17.

4. Discussion

The results obtained during the research carried out show that visual communication is a controversial concept in the case of the shared mobility services industry in Poland. Research shows that the phenomenon of visual communication is known by most respondents. Yet detailed results indicate that operators do not fully use its potential. This is shown, for example, by the fact that the color of the vehicles was not considered when selecting a fleet for shared mobility systems. Marketing research shows that car colors are very important from the point of view of vehicle attractiveness [43]. Therefore, especially in the case of a fleet of shared mobility systems, vehicle colors should stand out from the others widely available in modern cities. Interestingly, when asked to indicate the colors of vehicles in their fleet, the respondents provided the colors of the most frequently purchased vehicles by individuals in 2021 [44], which also disqualifies systems from being distinguished. Another point of contention is that, according to respondents, most of the vehicles in the fleet are not the same color. This can also be problematic as the large discrepancy means that these cars are not specifically associated with a given shared mobility system. This results in the difficulty of finding the vehicle in the city or determining its affiliation to a given service operator.
Another interesting aspect from the point of view of visual communication is the issue of logos and vehicle branding. It is surprising that only 29% of the fleet of vehicles of a given operator have the same branding. This also causes disinformation among users and, as a result, reduces the interest in the services of a given operator. Interestingly, most companies are unable to determine why they have a specific type of branding. Even though 21% of companies used cooperation with marketing agencies for their branding, it is worth noting that, in the other case, the decisions of visual communication are made by either boards’ or employees’ inventions. However, employees and board memebers, despite their expert industry knowledge, may not have the competence to create visual elements. Research shows that brand logos lead to stronger memory by taking advantage of the image importance effect [45]; therefore, focusing on proper branding should be the key for shared mobility companies.
The imprecise approach to visual communication is also emphasized by the fact that various types of accessories that can help improve vehicle visibility in urban transport systems are not used. It is also important that a large proportion of respondents have unbranded vehicles in their fleet. This type of procedure is correct for premium class vehicles. Unfortunately for the classic, economical fleet, the use of “incognito” vehicles may cause many problems. These problems include, for example, the lack of brand recognition on the market as well as the need to look for a vehicle in a maze of other cars located in parking lots, which very quickly discourages users from using the systems [46].
An important aspect from the point of view of the functioning of the brand and the implementation of innovative solutions is direct cooperation with its customers. This approach is the basis for the concept of open innovation [47,48,49]. Research shows that 93% of companies do not allow users to make decisions when changing the visual communication of their systems. It is worth noting that its involvement could significantly affect the company’s visualization because, according to research, users actively report information on the visual condition of vehicles, and each company gives them such opportunity. Moreover, in 64% of surveyed companies, users also report the level of their satisfaction with the company’s visual communication. An interesting fact is the multitude of problems related to visual communication, which is indicated by users. Research shows that system users, depending on the type of system and the fleet offered in it, present contradictory positions on complaints regarding vehicles from the issue of a logo that is too small, badly selected, too visible, or too little visible. These issues result from the fact that enterprises do not review their own visual communication and do not adapt it to the needs of users.
When analyzing the visual communication of enterprises from the marketing point of view, the respondents indicate that 86% are not sure whether it has a chance to translate into an increase in the attractiveness of the company and an increase in market competitiveness. Moreover, 43% of respondents also emphasize that they would not change their communication even if required by the market situation and competition. World research confirms that marketing is one of the most important areas in which visual communication dominates today [50]. Therefore, it is especially essential that the company is able to adapt to the today’s visual world so that its communication with the target audience is more meaningful and effective [51,52]. Due to these types of activities, appropriate visual communication can successfully translate into increased market competitiveness [50,51,52].

5. Conclusions

In conclusion, the conducted research has shown that visual communication is not used quite correctly by the operators of the shared mobility sector. Even though operators use single practices of its implementation, the overall consistency is lacking, which would add value to the brand. Insufficient commitment to the importance of visual aspects translates into many different problems and challenges regarding the proper functioning of the fleet in urban transport systems or inadequate demand from customers.
From the point of view of smart city development, it is particularly important to increase the visibility of the selected smart services [52,53]. Smart city researchers regularly emphasize that the visibility of services is not obvious, and it causes many difficulties with the proper development of not only the websites themselves but also the cities. Therefore, it is particularly important to inform all service providers about the need to develop appropriate visibility strategies for their own companies and implement them [52,53].
Based on the results obtained, it is recommended to operators of the shared mobility industry who want to operate in smart cities:
  • regularly broaden their knowledge of visual communication and its new possibilities of use in shared mobility systems,
  • properly rethink the concept of the brand’s visual communication by creating and adapting it based on the developed strategy or business model,
  • pay attention to the color of the vehicles when selecting your vehicle fleet,
  • in the case of a fleet of economy vehicles, choose vehicles in colors that are “eye-catching”,
  • in the case of a fleet of premium vehicles, choose vehicles in subdued colors and use subtle or no branding to give the impression of luxury,
  • standardize visual communication (through the color and branding consistency) for all vehicles used in the fleet,
  • maintain the consistency of visual communication, starting from the fleet of vehicles and ending with information channels, social media, and websites,
  • regularly validate the visual communication used,
  • conduct own research on the level of user satisfaction with the visual communication used in the company,
  • improve visual communication by implementing various types of additional accessories to improve visibility, e.g., by means of additional lighting elements to indicate vehicle availability or reservation
  • use visual communication for marketing by allocating the external surface of vehicles for the use of own or stakeholder advertising,
  • designate a department in the company or specific people whose tasks will include taking care of the visual condition of vehicles,
  • collaborate with professionals with experience in visual communication instead of creating concepts by own company,
  • advanced cooperation with the company’s stakeholders to create new visual communication mobilization within the framework of open innovation.
Moreover, the recognition of shared mobility systems and their fleets is particularly important now, in the post-pandemic period. Research indicates that, during the pandemic, there were changes in public transport behavior, but individual transport was not abandoned [54]. Moreover, forecasts indicate that societies will continue to be skeptical about drastic transport changes, including resignation from individual car journeys [55]. Moreover, it is even emphasized that many people, due to the possibility of contracting the virus in public transport in these planes, will want to travel by cars instead [54]. Even more as it is emphasized that providers of shared mobility in the post-pandemic period should work together to design mobility services citizens need and evaluate the most effective practices and try to improve communication with users [56]. Therefore, the post-pandemic period is a good time for the industry to take all the steps towards appropriate visual communication.
As with all scientific studies, this article also has limitations. The main limitation is its territoriality, because the research relates only to the Polish market of shared mobility systems. Moreover, due to the reluctance of some operators to share data, it was not possible to investigate the entire Polish market of shared mobility services. Due to the lack of similar research on visual communication in coded mobility systems, the authors were unable to refer directly to other research results obtained by national or global researchers. Because of the limitations of the GDPR and the confidentiality of the research, the authors were not able to indicate the specific names of the companies that took part in the research.
In future studies, the authors plan to extend the proposed analyzes to other European countries to obtain an interesting comparison of the approach to visual communication in relation to the European continent.

Author Contributions

Conceptualization, K.T.; methodology, K.T. and A.K.; validation, M.Š., A.L. and J.T.; resources, A.K.; data curation, K.T. and A.K.; writing—original draft preparation, K.T. and A.K.; writing—review and editing, K.T. and A.K.; supervision, M.Š., A.L. and J.T.; project administration, K.T.; funding acquisition, K.T. All authors have read and agreed to the published version of the manuscript.

Funding

This research was carried out as part of the financial support of the research by the Visegrad Fund as part of the Intra-Visegrad Scholarship Program-# 52111495 “The role of visual identity in education and development of shared mobility services” in the years 2021–2022.

Institutional Review Board Statement

According to our University Ethical Statement, the following shall be regarded as research requiring a favorable opinion from the Ethic Commission in the case of human research (based on document in polish: https://prawo.polsl.pl/Lists/Monitor/Attachments/7291/M.2021.501.Z.107.pdf (accessed on 21 March 2022): research in which persons with limited capacity to give informed or research on persons whose capacity to give informed or free consent to participate in research and who have a limited ability to refuse research before or during their implementation, in particular: children and adolescents under 12 years of age, persons with intellectual disabilities persons whose consent to participate in the research may not be fully voluntary prisoners, soldiers, police officers, employees of companies (when the survey is conducted at their workplace), persons who agree to participate in the research on the basis of false information about the purpose and course of the research (masking instruction, i.e., deception) or do not know at all that they are subjects (in so-called natural experiments); research in which persons particularly susceptible to psychological trauma and mental health disorders are to participate mental health, in particular: mentally ill persons, victims of disasters, war trauma, etc., patients receiving treatment for psychotic disorders, family members of terminally or chronically ill patients; research involving active interference with human behavior aimed at changing it research involving active intervention in human behavior aimed at changing that behavior without direct intervention in the functioning of the brain, e.g., cognitive training, psychotherapy psychocorrection, etc. (this also applies if the intended intervention is intended to benefit (this also applies when the intended intervention is to benefit the subject (e.g., to improve his/her memory); research concerning controversial issues (e.g., abortion, in vitro fertilization, death penalty) or requiring particular delicacy and caution (e.g., concerning religious beliefs or attitudes towards minority groups) minority groups); research that is prolonged, tiring, physically or mentally exhausting. Our research is not done on people meeting the mentioned condition. Any of the researched people: any of them had limited capacity to be informed, any of them had been susceptible to psychological trauma and mental health disorders, the research did not concern the mentioned-above controversial issues, the research was not prolonged, tiring, physically or mentally exhausting.

Informed Consent Statement

Informed consent was obtained from all subjects involved in the study.

Data Availability Statement

The data presented in this study are available on request from the authors.

Conflicts of Interest

The authors declare no conflict of interest.

Appendix A

A list of questions that were asked to the operators participating in the expert study:
Q1 
Do you know what visual communication is?
Q2 
When choosing a fleet of vehicles, did you pay attention to its color?
Q3 
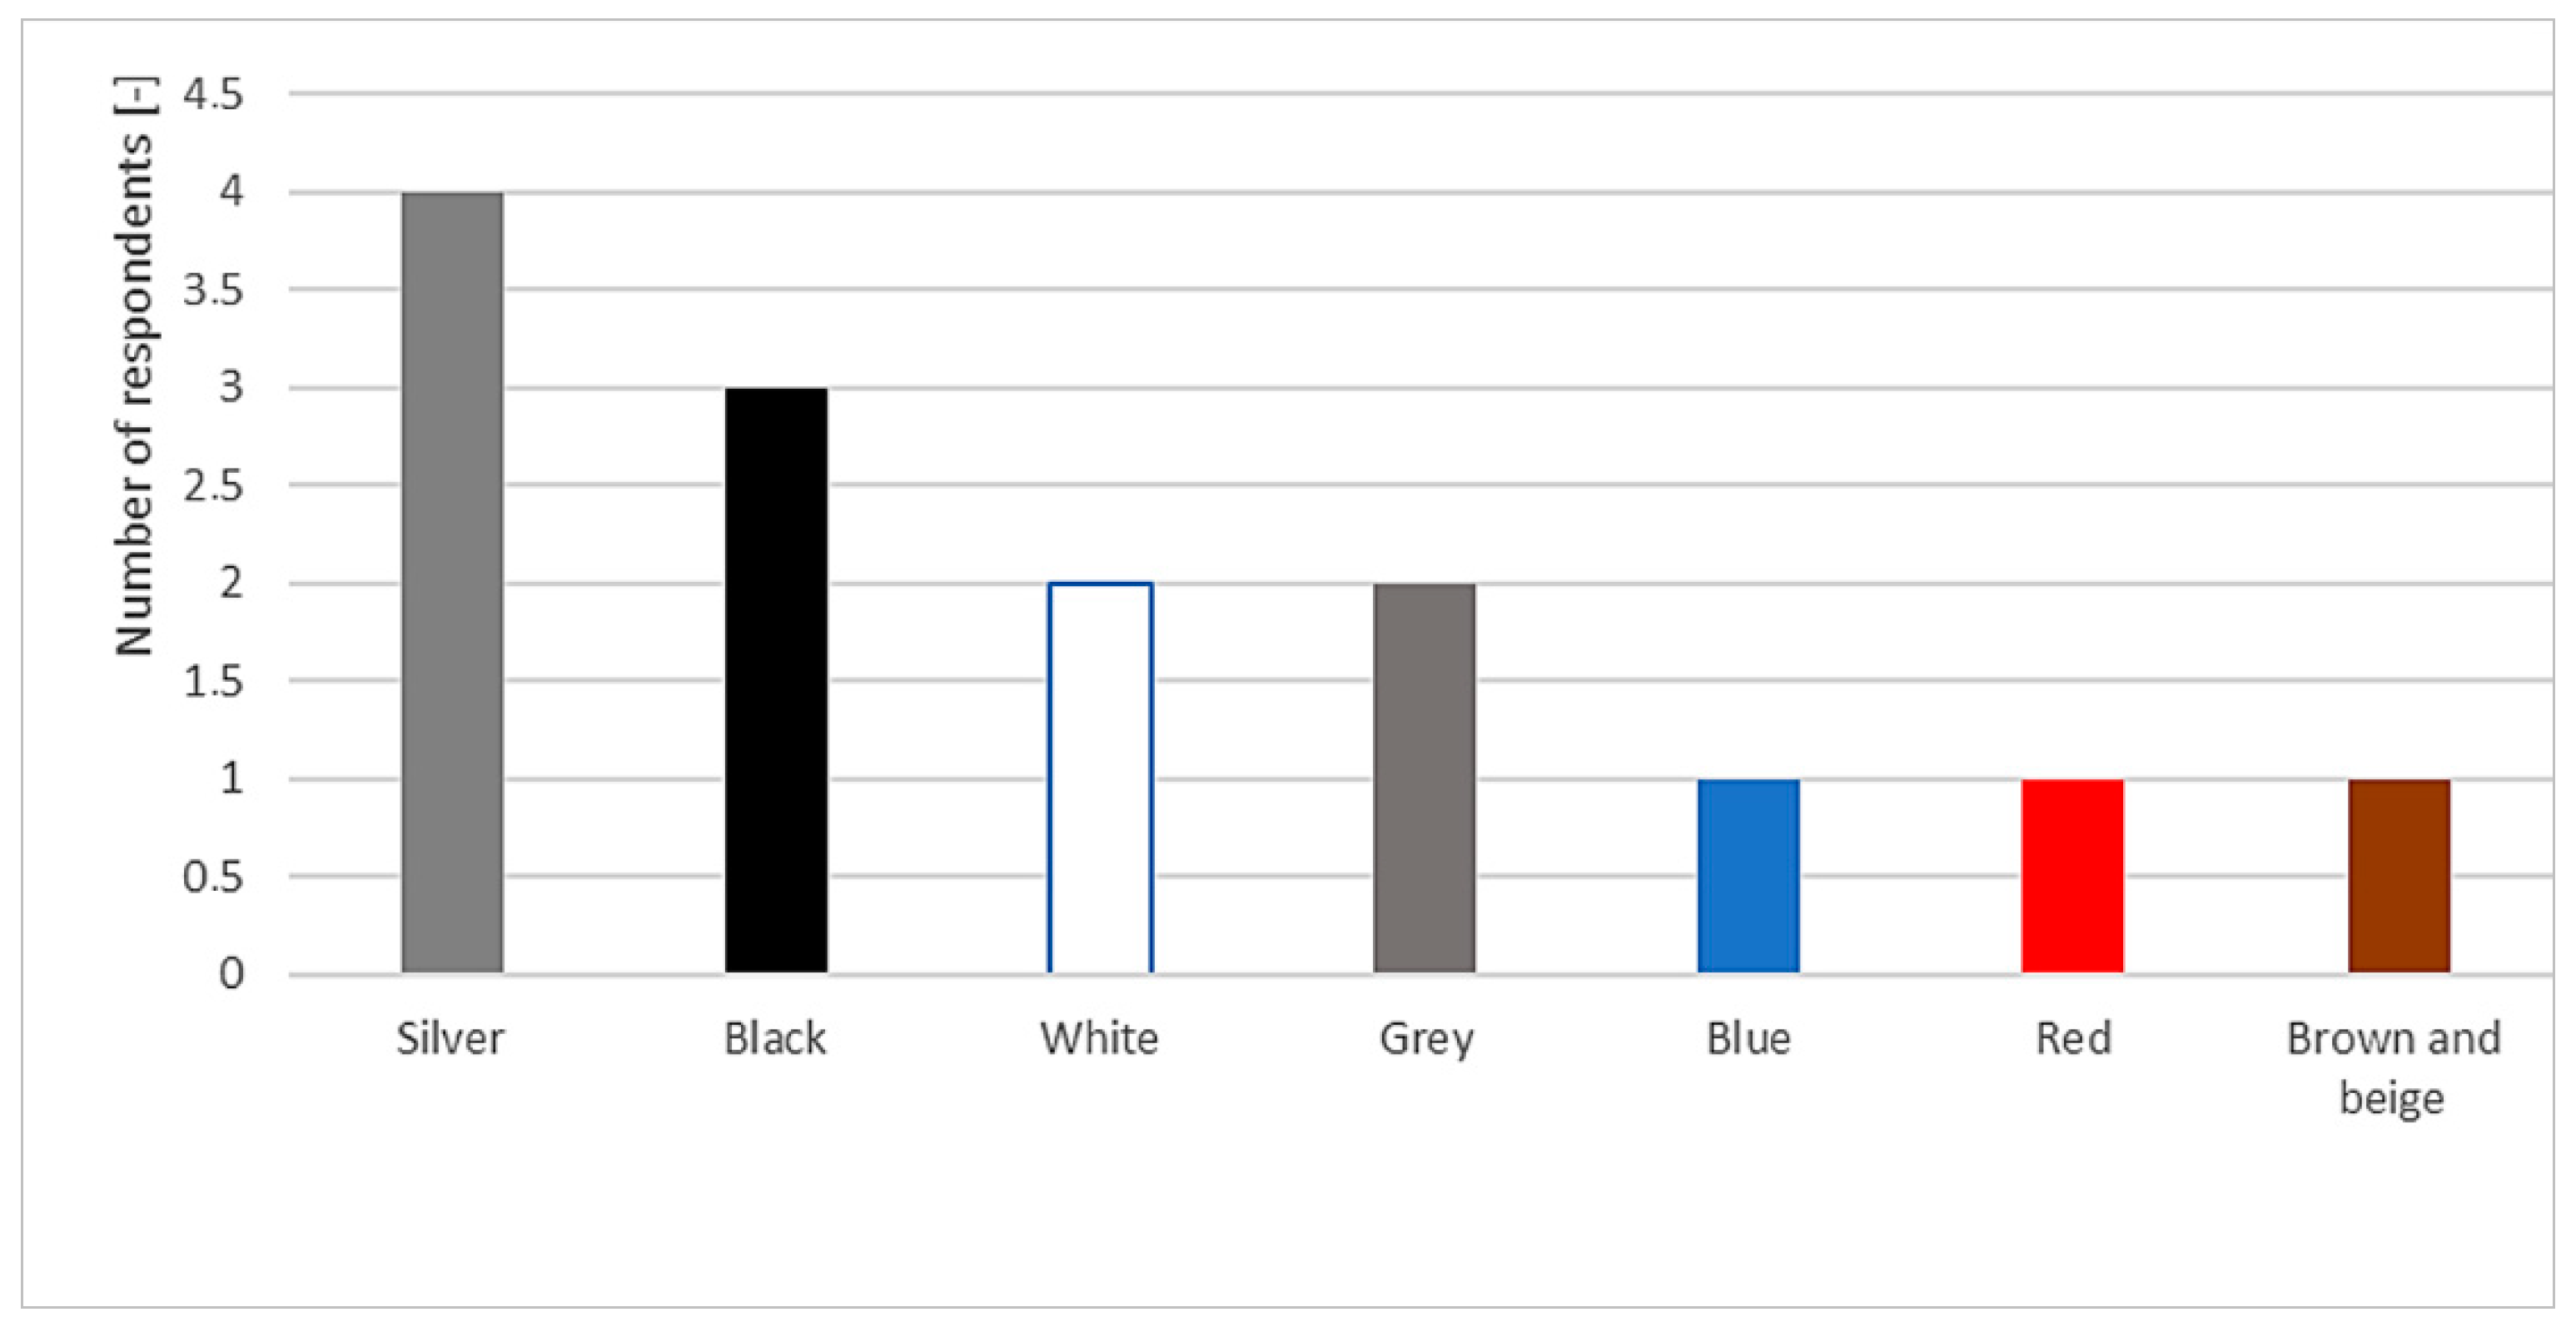
What colors of vehicles in your fleet are the most important to you?
Q4 
Do all vehicles in your fleet have the same color?
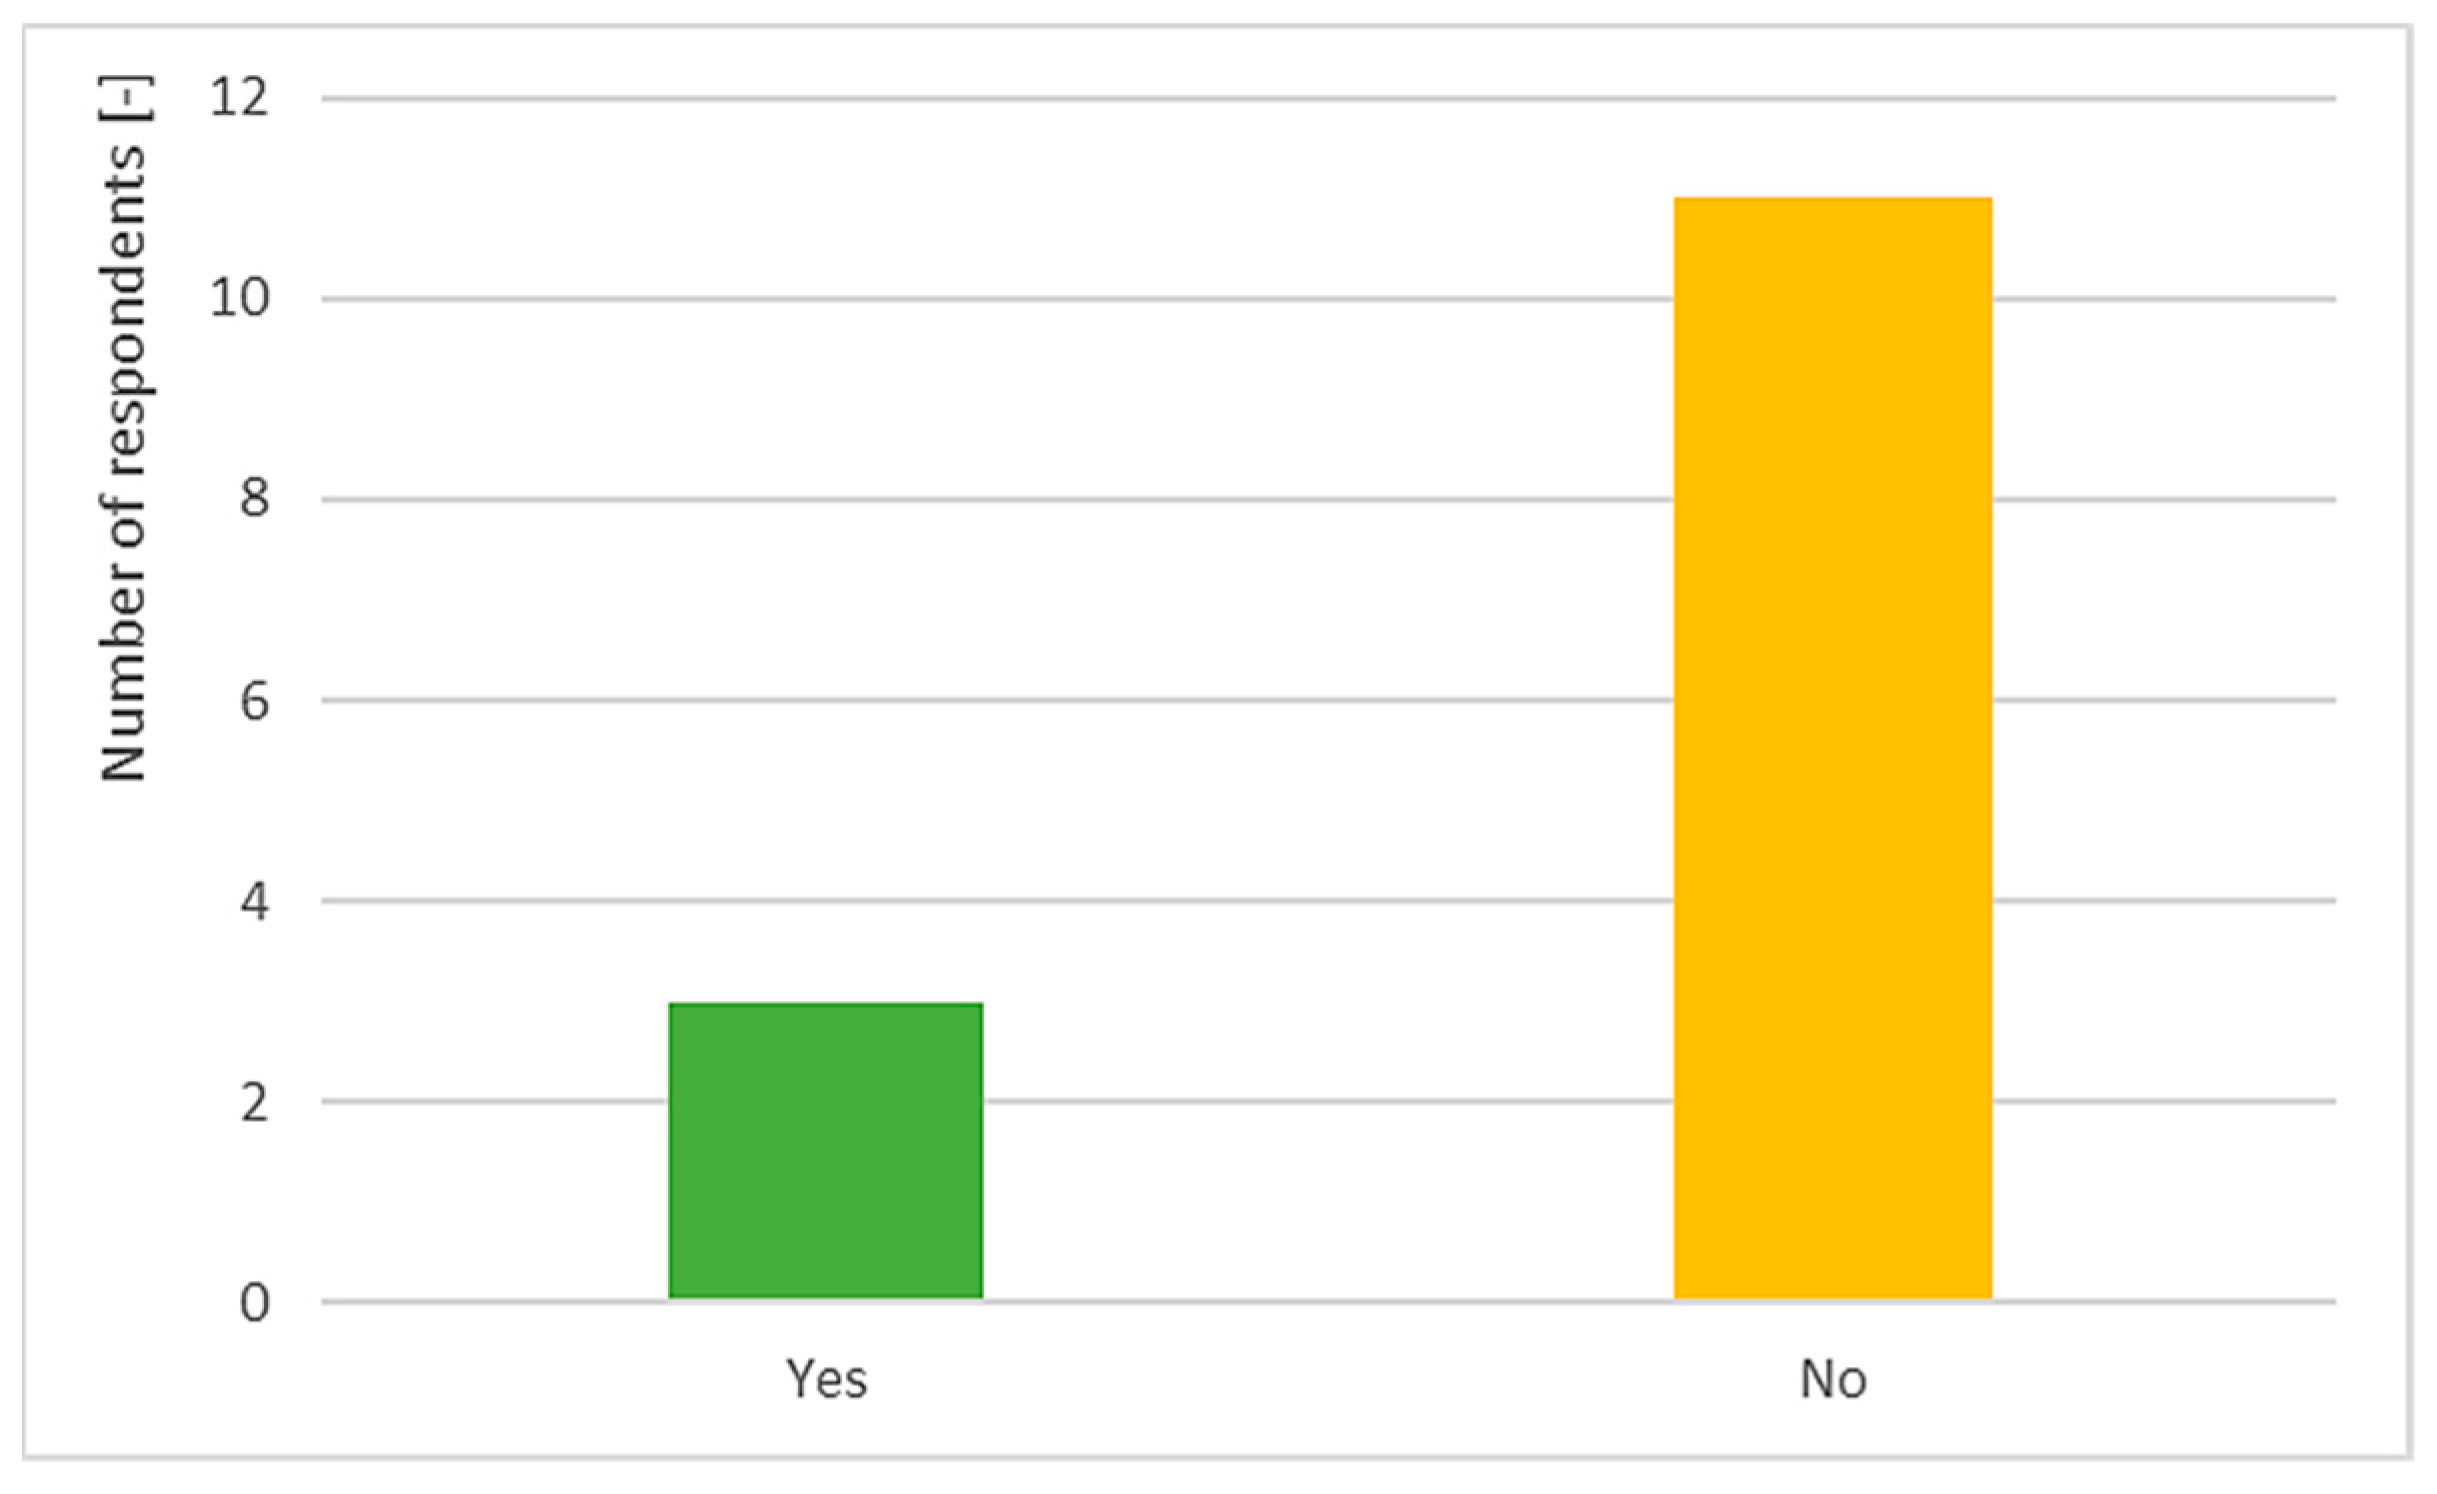
Q5 
Do all vehicles have the same branding (visual uniformity)?
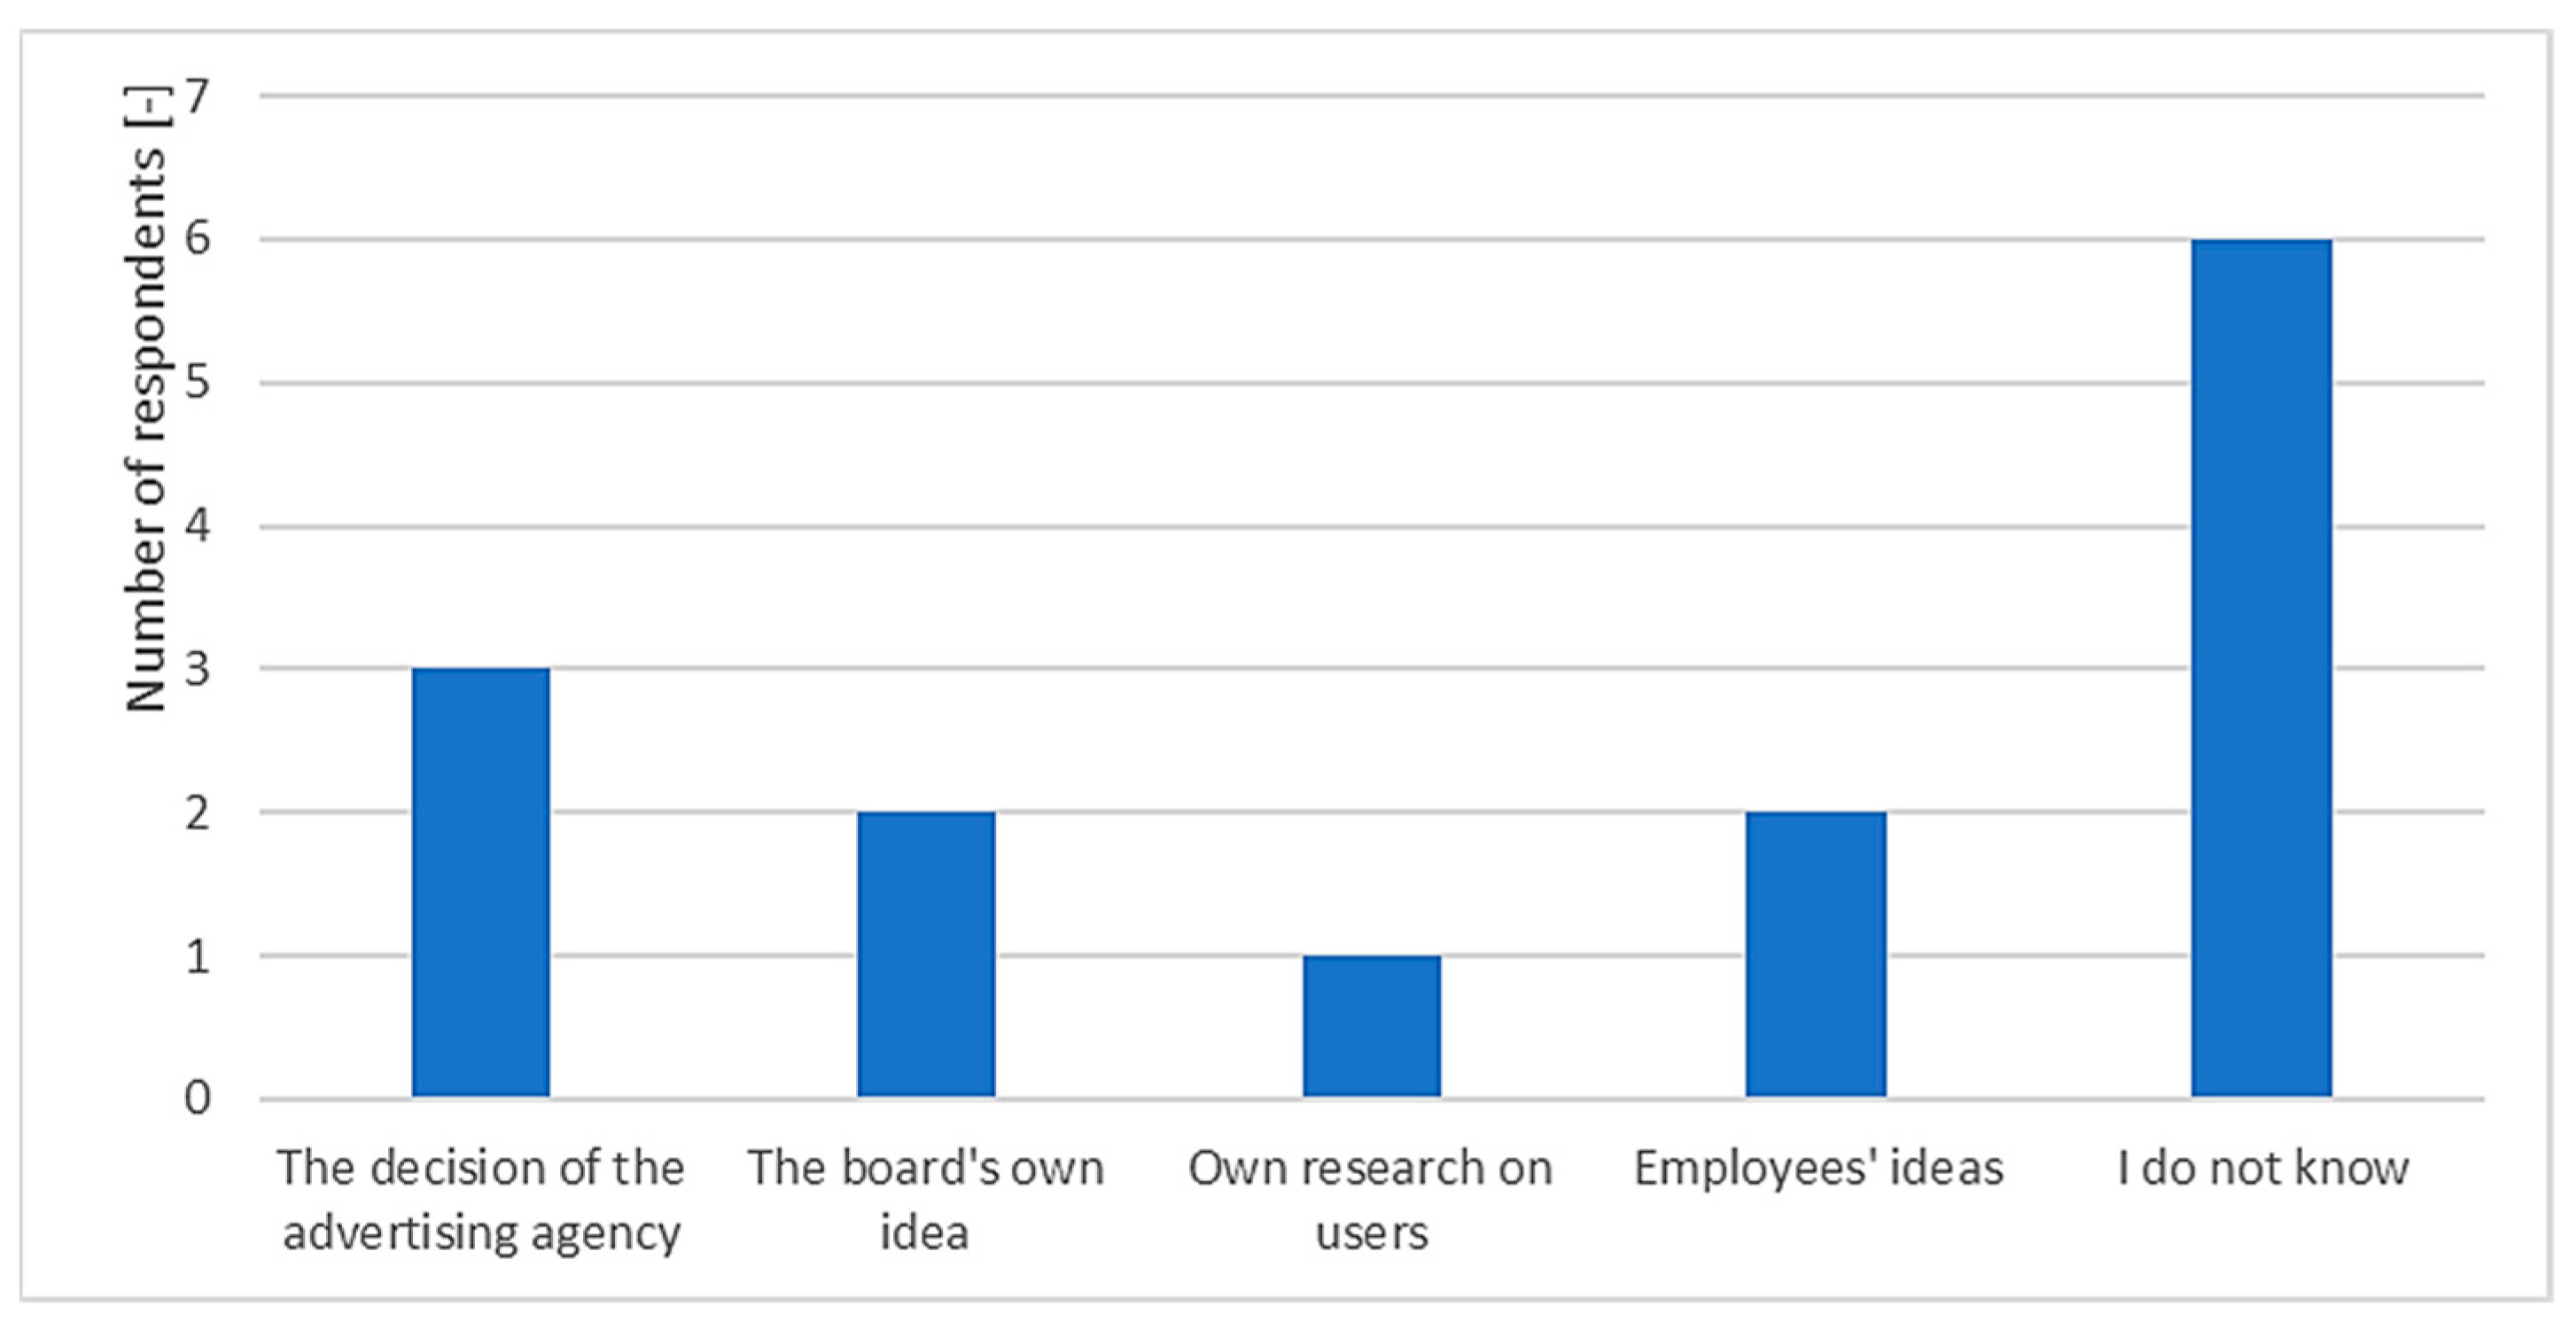
Q6 
What was the basis of branding?
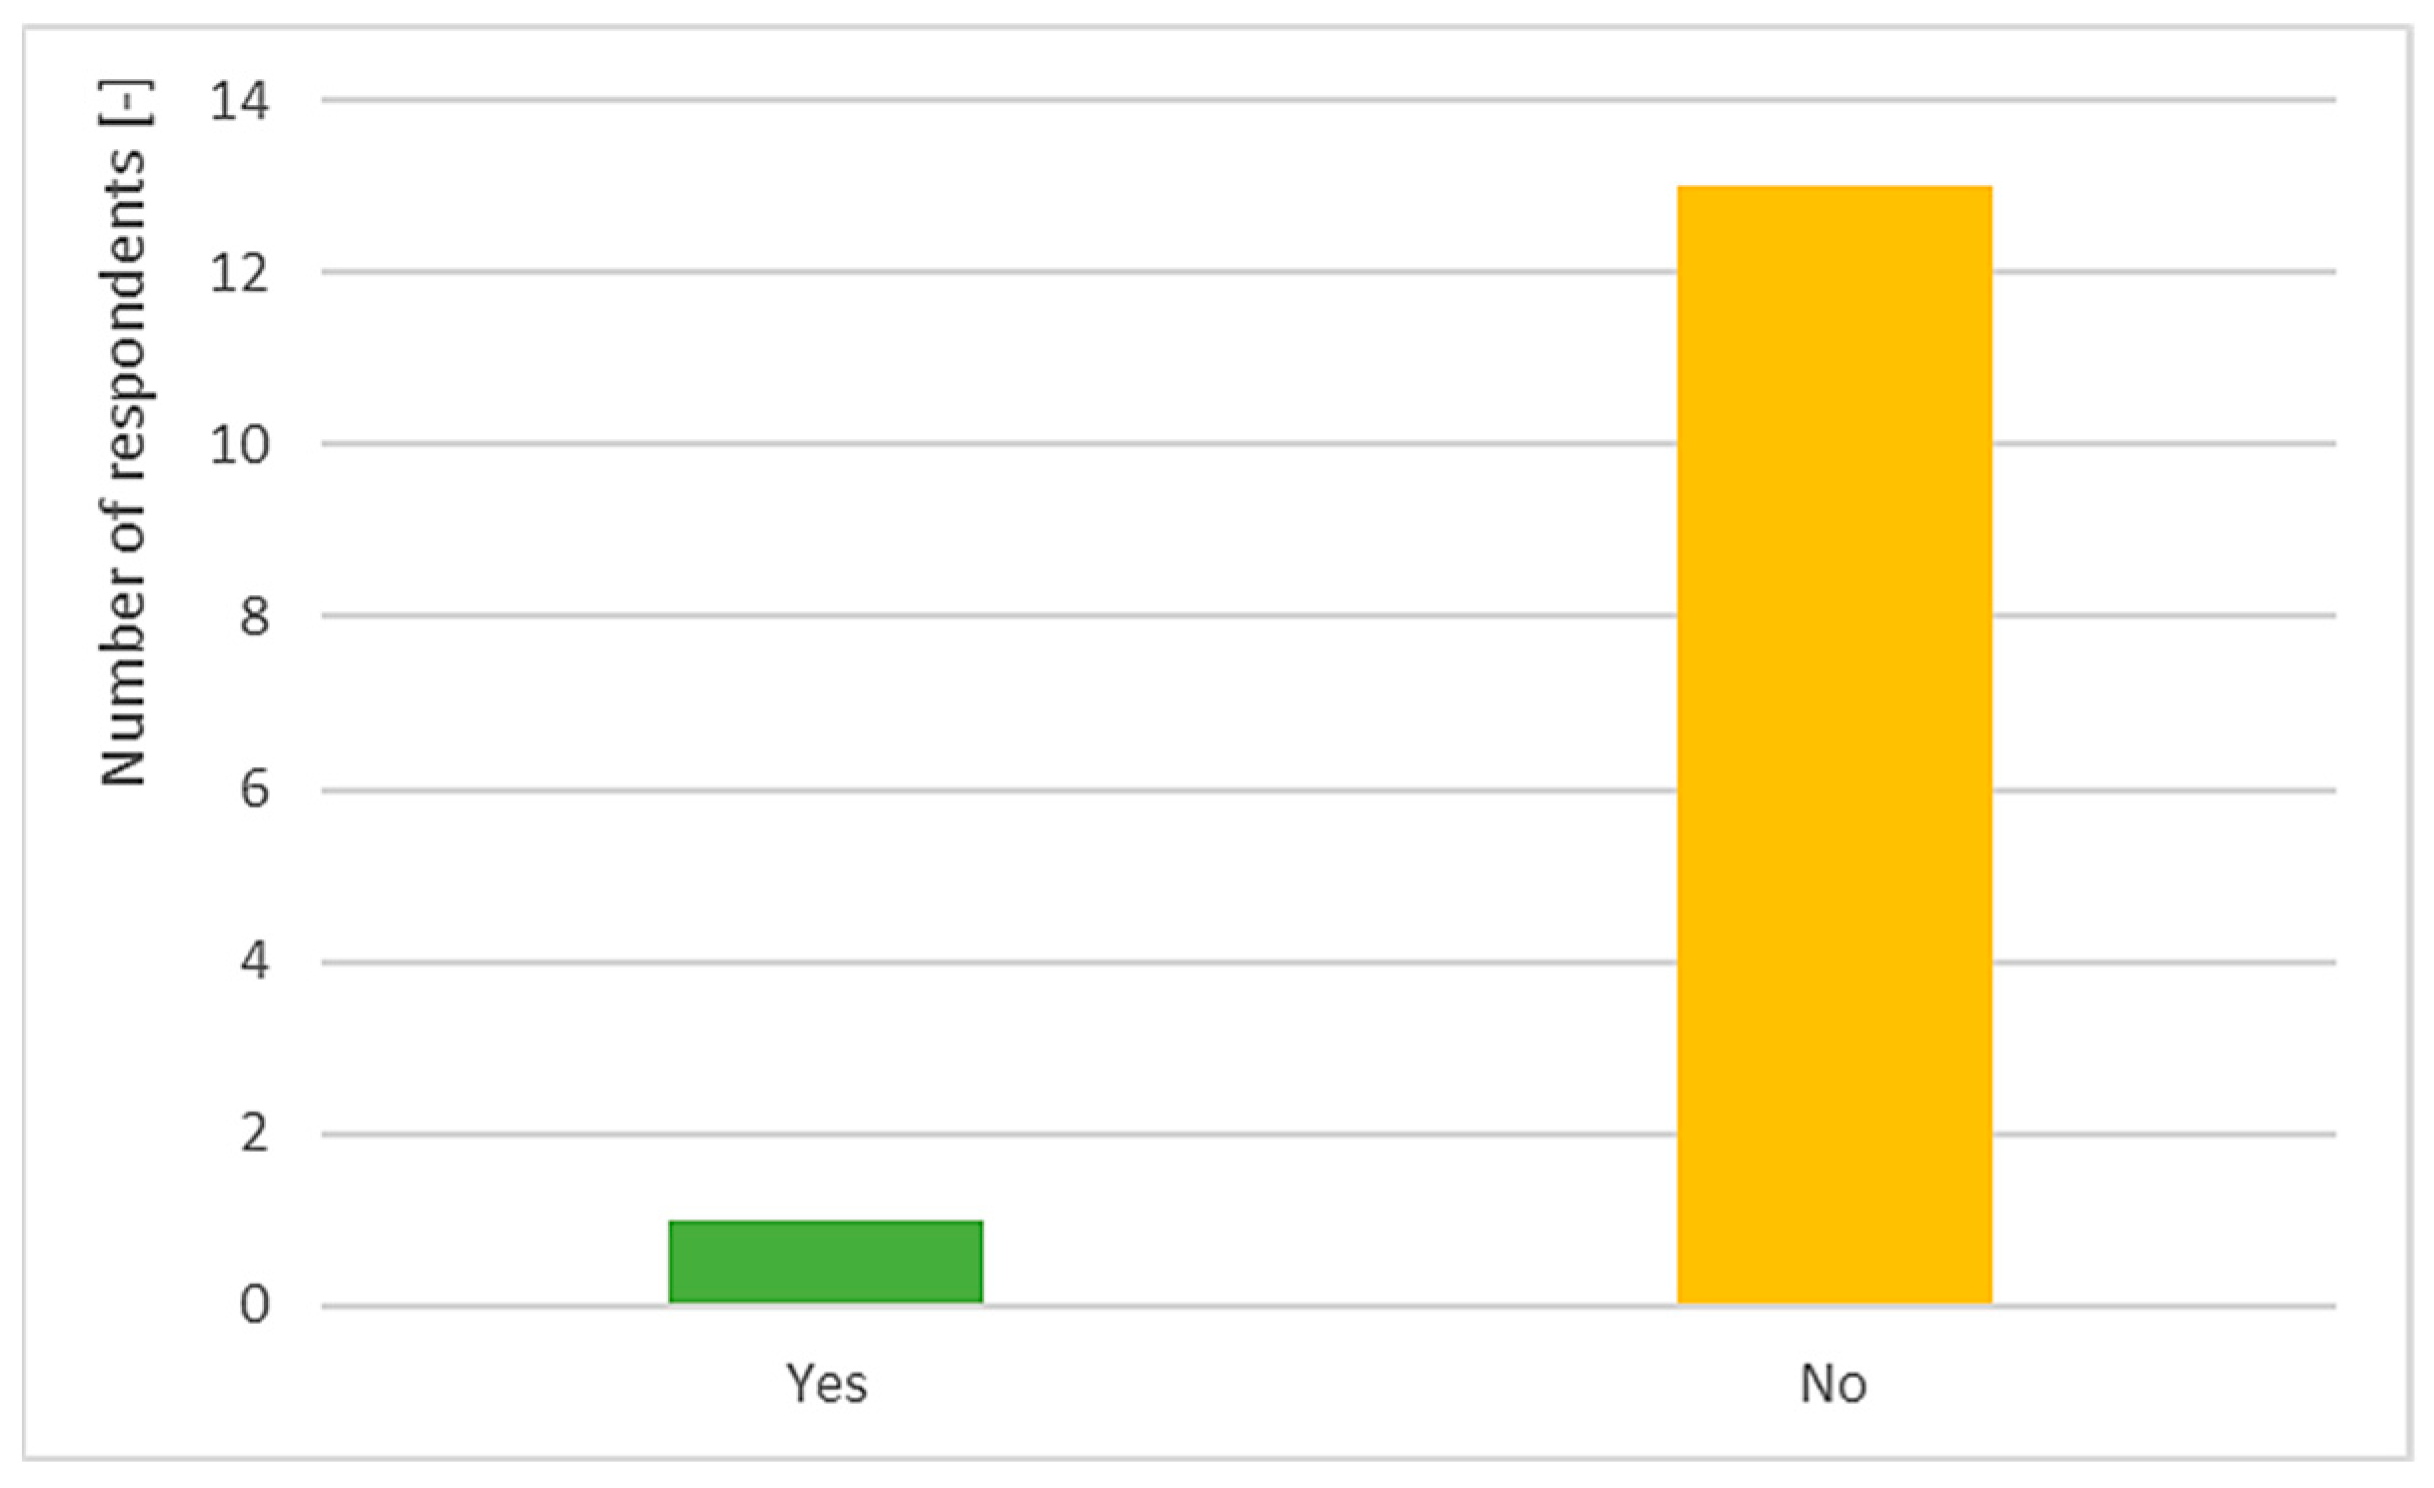
Q7 
Do you have additional accessories to make your fleet more attractive?
Q8 
Do users have an impact on how visually labeled your fleet is?
Q9 
Do users pay attention to the fact that the fleet is clean?
Q10 
Do users could submit their comments on the cleanliness of the vehicle?
Q11 
Do users report to you their objections to the visual side of vehicles, e.g., dissatisfaction with the branding of the vehicle?
Q12 
If users report to you their objections, what the notification were about?
Q13 
Do you promote “good practices” connected to the visual side of the fleet of vehicles, e.g., washing the vehicle by offering travel credits, etc.?
Q14 
Do you have a different branding for premium vehicles?
Q15 
Do you own vehicles without branding?
Q16 
Do you think your visual communication is innovative? How do you perceive its attractiveness?
Q17 
Do you think that visual communication can improve the attractiveness of your business?
Q18 
Are you going to change your visual communication influenced by competition?

References

  1. United Nations, Department of Economic and Social Affairs & Population Division 2019. World Urbanization Prospects: Highlights (St/Esa/Ser.A/421). Available online: https://population.un.org/wup/publications/Files/WUP2018-Highlights.pdf (accessed on 5 June 2022).
  2. Kauf, S. Smart logistics as a basis for the development of the smart city. Transp. Res. Procedia 2019, 39, 143–149. [Google Scholar] [CrossRef]
  3. Gajdzik, B.; Wolniak, R. Influence of Industry 4.0 Projects on Business Operations: Literature and Empirical Pilot Studies Based on Case Studies in Poland. J. Open Innov. Technol. Mark. Complex. 2022, 8, 44. [Google Scholar] [CrossRef]
  4. Bamwesigye, D.; Hlavackova, P. Analysis of Sustainable Transport for Smart Cities. Sustainability 2019, 11, 2140. [Google Scholar] [CrossRef] [Green Version]
  5. Balletto, G.; Ladu, M.; Milesi, A.; Camerin, F.; Borruso, G. Walkable City and Military Enclaves: Analysis and Decision-Making Approach to Support the Proximity Connection in Urban Regeneration. Sustainability 2022, 14, 457. [Google Scholar] [CrossRef]
  6. Allam, Z.; Bibri, S.E.; Chabaud, D.; Moreno, C. The ’15-Minute City’ Concept Can Shape a Net-Zero Urban Future. Humanit. Soc. Sci. Commun. 2022, 9, 126. [Google Scholar] [CrossRef]
  7. Lydon, M.; Garcia, A. Tactical Urbanism; Island Press/Center for Resource Economics: Washington, DC, USA, 2015. [Google Scholar] [CrossRef] [Green Version]
  8. Aibar, E.; Bijker, W.E. Constructing a City: The Cerdà Plan for the Extension of Barcelona. Sci. Technol. Hum. Values 1997, 22, 3–30. [Google Scholar] [CrossRef]
  9. Eggimann, S. The Potential of Implementing Superblocks for Multifunctional Street Use in Cities. Nat. Sustain. 2022, 5, 406–414. [Google Scholar] [CrossRef]
  10. Oh, J. Smart City as a Tool of Citizen-Oriented Urban Regeneration: Framework of Preliminary Evaluation and Its Application. Sustainability 2020, 12, 6874. [Google Scholar] [CrossRef]
  11. Nikki Han, M.J.; Kim, M.J. A Critical Review of the Smart City in Relation to Citizen Adoption towards Sustainable Smart Living. Habitat Int. 2021, 108, 102312. [Google Scholar] [CrossRef]
  12. Simonofski, A.; Asensio, E.S.; De Smedt, J.; Snoeck, M. Citizen Participation in Smart Cities: Evaluation Framework Proposal. In Proceedings of the 2017 IEEE 19th Conference on Business Informatics (CBI), Thessaloniki, Greece, 24–27 July 2017; pp. 227–236. [Google Scholar] [CrossRef]
  13. Fabris, L.M.F.; Camerin, F.; Semprebon, G.; Balzarotti, R.M. New Healthy Settlements Responding to Pandemic Outbreaks: Approaches from (and for) the Global City. Plan J. 2020, 5, 385–406. [Google Scholar] [CrossRef]
  14. Turoń, K.; Kubik, A. Business Innovations in the New Mobility Market during the COVID-19 with the Possibility of Open Business Model Innovation. J. Open Innov. Technol. Mark. Complex. 2021, 7, 195. [Google Scholar] [CrossRef]
  15. Ride Sharing Market by Type (E-Hailing, Station-Based, Car Sharing & Rental), Car Sharing (P2P, Corporate), Service (Naviga-tion, Payment, Information), Micro-Mobility (Bicycle, Scooter), Vehicle Type, and Region—Global Forecast to 2026. Available online: https://www.researchandmarkets.com/reports/5351549/ride-sharing-market-by-type-e-hailing-sta-397tion?utm_source=GNOM&utm_medium=PressRelease&utm_code=lsqc47&utm_campaign=1554819+-+Global+Ride+Shar-398ing+Market+Report+2021%3a+Market+is+Projected+to+Grow+from+%2485.8+Billion+in+2021+and+Reach+%24185.1+Bil-399lion+in+2026&utm_exec=chdo54prd (accessed on 7 May 2022).
  16. Qin, H.; Su, E.; Wang, Y.; Li, J. Branch-and-price-and-cut for the electric vehicle relocation problem in one-way carsharing systems. Omega 2022, 109, 102609. [Google Scholar] [CrossRef]
  17. Osorio, J.; Lei, C.; Ouyang, Y. Optimal rebalancing and on-board charging of shared electric scooters. Transp. Res. B Methodol. 2021, 147, 197–219. [Google Scholar] [CrossRef]
  18. D’Andreagiovanni, F.; Nardin, A.; Carrese, S. An Analysis of the Service Coverage and Regulation of E-Scooter Sharing in Rome (Italy). Transp. Res. Procedia 2022, 60, 440–447. [Google Scholar] [CrossRef]
  19. Fu, C.; Ma, S.; Zhu, N.; He, Q.-C.; Yang, H. Bike-sharing inventory management for market expansion. Transp. Res. Part B Methodol. 2022, 162, 28–54. [Google Scholar] [CrossRef]
  20. Tekouabou, S.C.K. Intelligent management of bike sharing in smart cities using machine learning and Internet of Things. Sustain. Cities Soc. 2021, 67, 102702. [Google Scholar] [CrossRef]
  21. Qiumeng, L.; Weipan, X. The impact of COVID-19 on bike-sharing travel pattern and flow structure: Evidence from Wuhan. Camb. J. Reg. Econ. Soc. 2022, rsac005. [Google Scholar] [CrossRef]
  22. Garaus, M.; Garaus, C. The Impact of the COVID-19 Pandemic on Consumers’ Intention to Use Shared-Mobility Services in German Cities. Front. Psychol. 2021, 12, 646593. Available online: https://www.frontiersin.org/article/10.3389/fpsyg.2021.646593 (accessed on 7 June 2022). [CrossRef]
  23. Moreno, C.; Allam, Z.; Chabaud, D.; Gall, C.; Pratlong, F. Introducing the “15-Minute City”: Sustainability, Resilience and Place Identity in Future Post-Pandemic Cities. Smart Cities 2021, 4, 93–111. [Google Scholar] [CrossRef]
  24. Turoń, K.; Czech, P. The Concept of Rules and Recommendations for Riding Shared and Private E-Scooters in the Road Network in the Light of Global Problems. In Modern Traffic Engineering in the System Approach to the Development of Traffic Networks; Macioszek, E., Sierpiński, G., Eds.; TSTP 2019; Advances in Intelligent Systems and Computing; Springer: Cham, Switzerland, 2020; Volume 1083. [Google Scholar] [CrossRef]
  25. Kubik, A.; Turoń, K.; Stanik, Z. Car-sharing systems vehicles versus taxis in urban transport system—Legal requirements, technical service, operation. In Proceedings of the International Conference on Traffic and Transport Engineering (ICTTE), Belgrade, Serbia, 27–28 September 2018; pp. 923–930. [Google Scholar]
  26. 7 Paramount Components of Visual Communication. Infographic Design Team—Infographics Design—Data Visualization. Available online: https://www.infographicdesignteam.com/blog/components-of-visual-communication/ (accessed on 27 January 2021).
  27. Nida, I. Art of Visual Communication, Evolution and its Impact. Indian J. Public Health Res. Dev. 2018, 9, 1725–1728. [Google Scholar]
  28. Isaac, M.; Lipkus, J.G. Hollands, The Visual Communication of Risk. JNCI Monogr. 1999, 25, 149–163. [Google Scholar] [CrossRef]
  29. Göransson, K.; Fagerholm, A.S. Towards visual strategic communications: An innovative interdisciplinary perspective on visual dimensions within the strategic communications field. J. Commun. Manag. 2018, 22, 46–66. [Google Scholar] [CrossRef]
  30. Venngage Portal. Visual Communication. Available online: https://venngage.com/blog/visual-communication/ (accessed on 13 June 2022).
  31. Staszewska, J.; Skorus, P. Marketing Aspects of Visual Communication Management in the SMEs Sector [Marketingowe Aspekty Zarządzania Komunikacją Wizualną w Sektorze MŚP]; Wyższa Szkoła Humanitas: Sosnowiec, Poland, 2018. [Google Scholar]
  32. Valachová, D.; Kováčová, B.; Bergerová, X.; Ševčovič, M. Significance of evaluation in art education in the process of participant’s self-expression. AD ALTA J. Interdiscip. Res. 2021, 11, 289–294. [Google Scholar]
  33. Statista. Shared Mobility in Poland. Available online: https://www.statista.com/topics/6579/shared-mobility-in-poland/#topicHeader__wrapper (accessed on 27 May 2022).
  34. Research and Market Portal. Shared Mobility Market Size, Share & Trends Analysis Report by Service Model (Ride Hailing, Bike Sharing, Ride Sharing), by Vehicle Type (Cars, Two-wheelers), by Region (North America, Europe, APAC, Latin America), and Segment Forecasts, 2022–2030. Available online: https://www.researchandmarkets.com/reports/5595792/shared-mobility-market-size-share-and-trends?utm_source=BW&utm_medium=PressRelease&utm_code=qr3qtb&utm_campaign=1704132+-+World+Shared+Mobility+Market+Analysis+Report+2022-2030+Featuring+Car2Go%2c+Deutsche+Bahn+Connect%2c+Didi+Chuxing%2c+Drive+Now%2c+Evcard%2c+Flinkster%2c+Grab%2c+Greengo%2c+Lyft%2c+Uber%2c+%26+Zipcar&utm_exec=chdo54prd (accessed on 25 May 2022).
  35. Palinkas, L.A.; Horwitz, S.M.; Green, C.A.; Wisdom, J.P.; Duan, N.; Hoagwood, K. Purposeful Sampling for Qualitative Data Collection and Analysis in Mixed Method Implementation Research. Adm. Policy Ment. Health 2015, 42, 533–544. [Google Scholar] [CrossRef] [Green Version]
  36. Patton, M.Q. Qualitative Research and Evaluation Methods, 3rd ed.; Sage Publications: Thousand Oaks, CA, USA, 2002. [Google Scholar]
  37. Cresswell, J.W.; Plano Clark, V.L. Designing and Conducting Mixed Method Research, 2nd ed.; Sage Publications: Thousand Oaks, CA, USA, 2011. [Google Scholar]
  38. Bernard, H.R. Research Methods in Anthropology: Qualitative and Quantitative Approaches, 3rd ed.; Alta Mira Press: Walnut Creek, CA, USA, 2002. [Google Scholar]
  39. Spradley, J.P. The Ethnographic Interview; Holt, Rinehart & Winston: New York, NY, USA, 1979. [Google Scholar]
  40. Etikan, I.; Abubakar Musa, S.; Sunusi Alkassim, R. Comparison of Convenience Sampling and Purposive Sampling. Am. J. Theor. Appl. Stat. 2016, 5, 1–4. [Google Scholar] [CrossRef] [Green Version]
  41. Campbell, S.; Greenwood, M.; Prior, S.; Shearer, T.; Walkem, K.; Young, S.; Bywaters, D.; Walker, K. Purposive sampling: Complex or simple? Research case examples. J. Res. Nurs. 2020, 25, 652–661. [Google Scholar] [CrossRef]
  42. Mishin, V.M. Research of Control Systems; Textbook for Universities; Unity-Dana: Moscow, Russia, 2003. [Google Scholar]
  43. Gavranović, H. Local search and suffix tree for car-sequencing problem with colors. Eur. J. Oper. Res. 2008, 191, 972–980. [Google Scholar] [CrossRef]
  44. Axalta Coating Systems Germany GmbH & Co., KG. The Most Popular Car Colors in the World. Int. Surf. Technol. 2021, 14, 16–17. [Google Scholar] [CrossRef]
  45. Ghosh, T.; Sreejesh, S.; Dwivedi, Y.K. Brand logos versus brand names: A comparison of the memory effects of textual and pictorial brand elements placed in computer games. J. Bus. Res. 2022, 147, 222–235. [Google Scholar] [CrossRef]
  46. Shokouhyar, S.; Shokoohyar, S.; Sobhani, A.; Jafari Gorizi, J.A. Shared mobility in post-COVID era: New challenges and opportunities. Sustain. Cities Soc. 2021, 67, 102714. [Google Scholar] [CrossRef]
  47. Turoń, K. Open Innovation Business Model as an Opportunity to Enhance the Development of Sustainable Shared Mobility Industry. J. Open Innov. Technol. Mark. Complex. 2022, 8, 37. [Google Scholar] [CrossRef]
  48. Jonek-Kowalska, I.; Wolniak, R. The Influence of Local Economic Conditions on Start-Ups and Local Open Innovation System. J. Open Innov. Technol. Mark. Complex. 2021, 7, 110. [Google Scholar] [CrossRef]
  49. Turoń, K. From the Classic Business Model to Open Innovation and Data Sharing—The Concept of an Open Car-Sharing Business Model. J. Open Innov. Technol. Mark. Complex. 2022, 8, 36. [Google Scholar] [CrossRef]
  50. Okat, Ö.; Solak, B.B. Visuality in Corporate Communication. In New Media and Visual Communication in Social Networks; Kır, S., Ed.; IGI Global: Hershey, PA, USA, 2020; pp. 37–59. [Google Scholar] [CrossRef]
  51. Sutoyo, S.; Farhia, Y. The synergy of visual communication and sustainability as brand value. In IOP Conference Series: Earth and Environmental Science, Proceedings of the International Conference on Biospheric Harmony Advanced Research (ICOBAR 2020), Jakarta, Indonesia, 23–24 June 2020; IOP Publishing: Bristol, UK, 2021; Volume 729, p. 012079. [Google Scholar] [CrossRef]
  52. Caprotti, F. Spaces of visibility in the smart city: Flagship urban spaces and the smart urban imaginary. Urban Stud. 2019, 56, 2465–2479. [Google Scholar] [CrossRef]
  53. Torisson, F. Strategies of visibility in the smart city. City Territ. Archit. 2022, 9, 15. [Google Scholar] [CrossRef]
  54. Deloitte. Mobility after COVID-19: The Lure of Travelling versus “Flight-Shaming”. Available online: https://www2.deloitte.com/ch/en/pages/public-sector/articles/mobility-after-covid-19.html (accessed on 7 July 2022).
  55. Eliasson, J. Will We Travel Less after the Pandemic? Transp. Res. Interdiscip. Perspect. 2022, 13, 100509. [Google Scholar] [CrossRef]
  56. Alonso-Almeida, M.d.M. To Use or Not Use Car Sharing Mobility in the Ongoing COVID-19 Pandemic? Identifying Sharing Mobility Behaviour in Times of Crisis. Int. J. Environ. Res. Public Health 2022, 19, 3127. [Google Scholar] [CrossRef]
Figure 1. Visual communication using—an example of vehicle from scooter-sharing with external stakeholder advertising applied. Source: Author’s own collaboration.
Smartcities 05 00041 g001
Figure 2. Knowledge of the representatives of the shared mobility market on visual communication.
Smartcities 05 00041 g002
Figure 3. Interest in the color of the vehicle when selecting a vehicle fleet for shared mobility systems.
Smartcities 05 00041 g003
Figure 4. Vehicle color preferences in shared mobility systems.
Smartcities 05 00041 g004
Figure 5. Color uniformity in shared mobility systems.
Smartcities 05 00041 g005
Figure 6. Fleet branding uniformity in shared mobility systems.
Smartcities 05 00041 g006
Figure 7. Decision making in the selection of vehicle branding in shared mobility systems.
Smartcities 05 00041 g007
Figure 8. The presence of additional accessories that promote shared mobility vehicles.
Smartcities 05 00041 g008
Figure 9. User impact on vehicle branding in shared mobility systems.
Smartcities 05 00041 g009
Figure 10. Approach to the cleanliness of the vehicle fleet in shared mobility systems.
Smartcities 05 00041 g010
Figure 11. The possibility for users to submit comments on the level of cleanliness in vehicles in shared mobility systems.
Smartcities 05 00041 g011
Figure 12. User reporting of comments on vehicle branding in shared mobility systems.
Smartcities 05 00041 g012
Figure 13. Detailed complaints in the field of visual communication of vehicles in shared mobility systems.
Smartcities 05 00041 g013
Figure 14. Good practices in the field of clean vehicle fleet in shared mobility systems.
Smartcities 05 00041 g014
Figure 15. Separate branding of premium vehicles in shared mobility systems.
Smartcities 05 00041 g015
Figure 16. The relationship between visual communication and competitiveness in the shared mobility industry.
Smartcities 05 00041 g016
Figure 17. Openness to changes in visual communication influenced by competition in the shared mobility services market.
Smartcities 05 00041 g017
Publisher’s Note: MDPI stays neutral with regard to jurisdictional claims in published maps and institutional affiliations.

