
Operation of the Egyptian Power Grid with Maximum Penetration Level of Renewable Energies Using Corona Virus Optimization Algorithm


Abstract
:1. Introduction
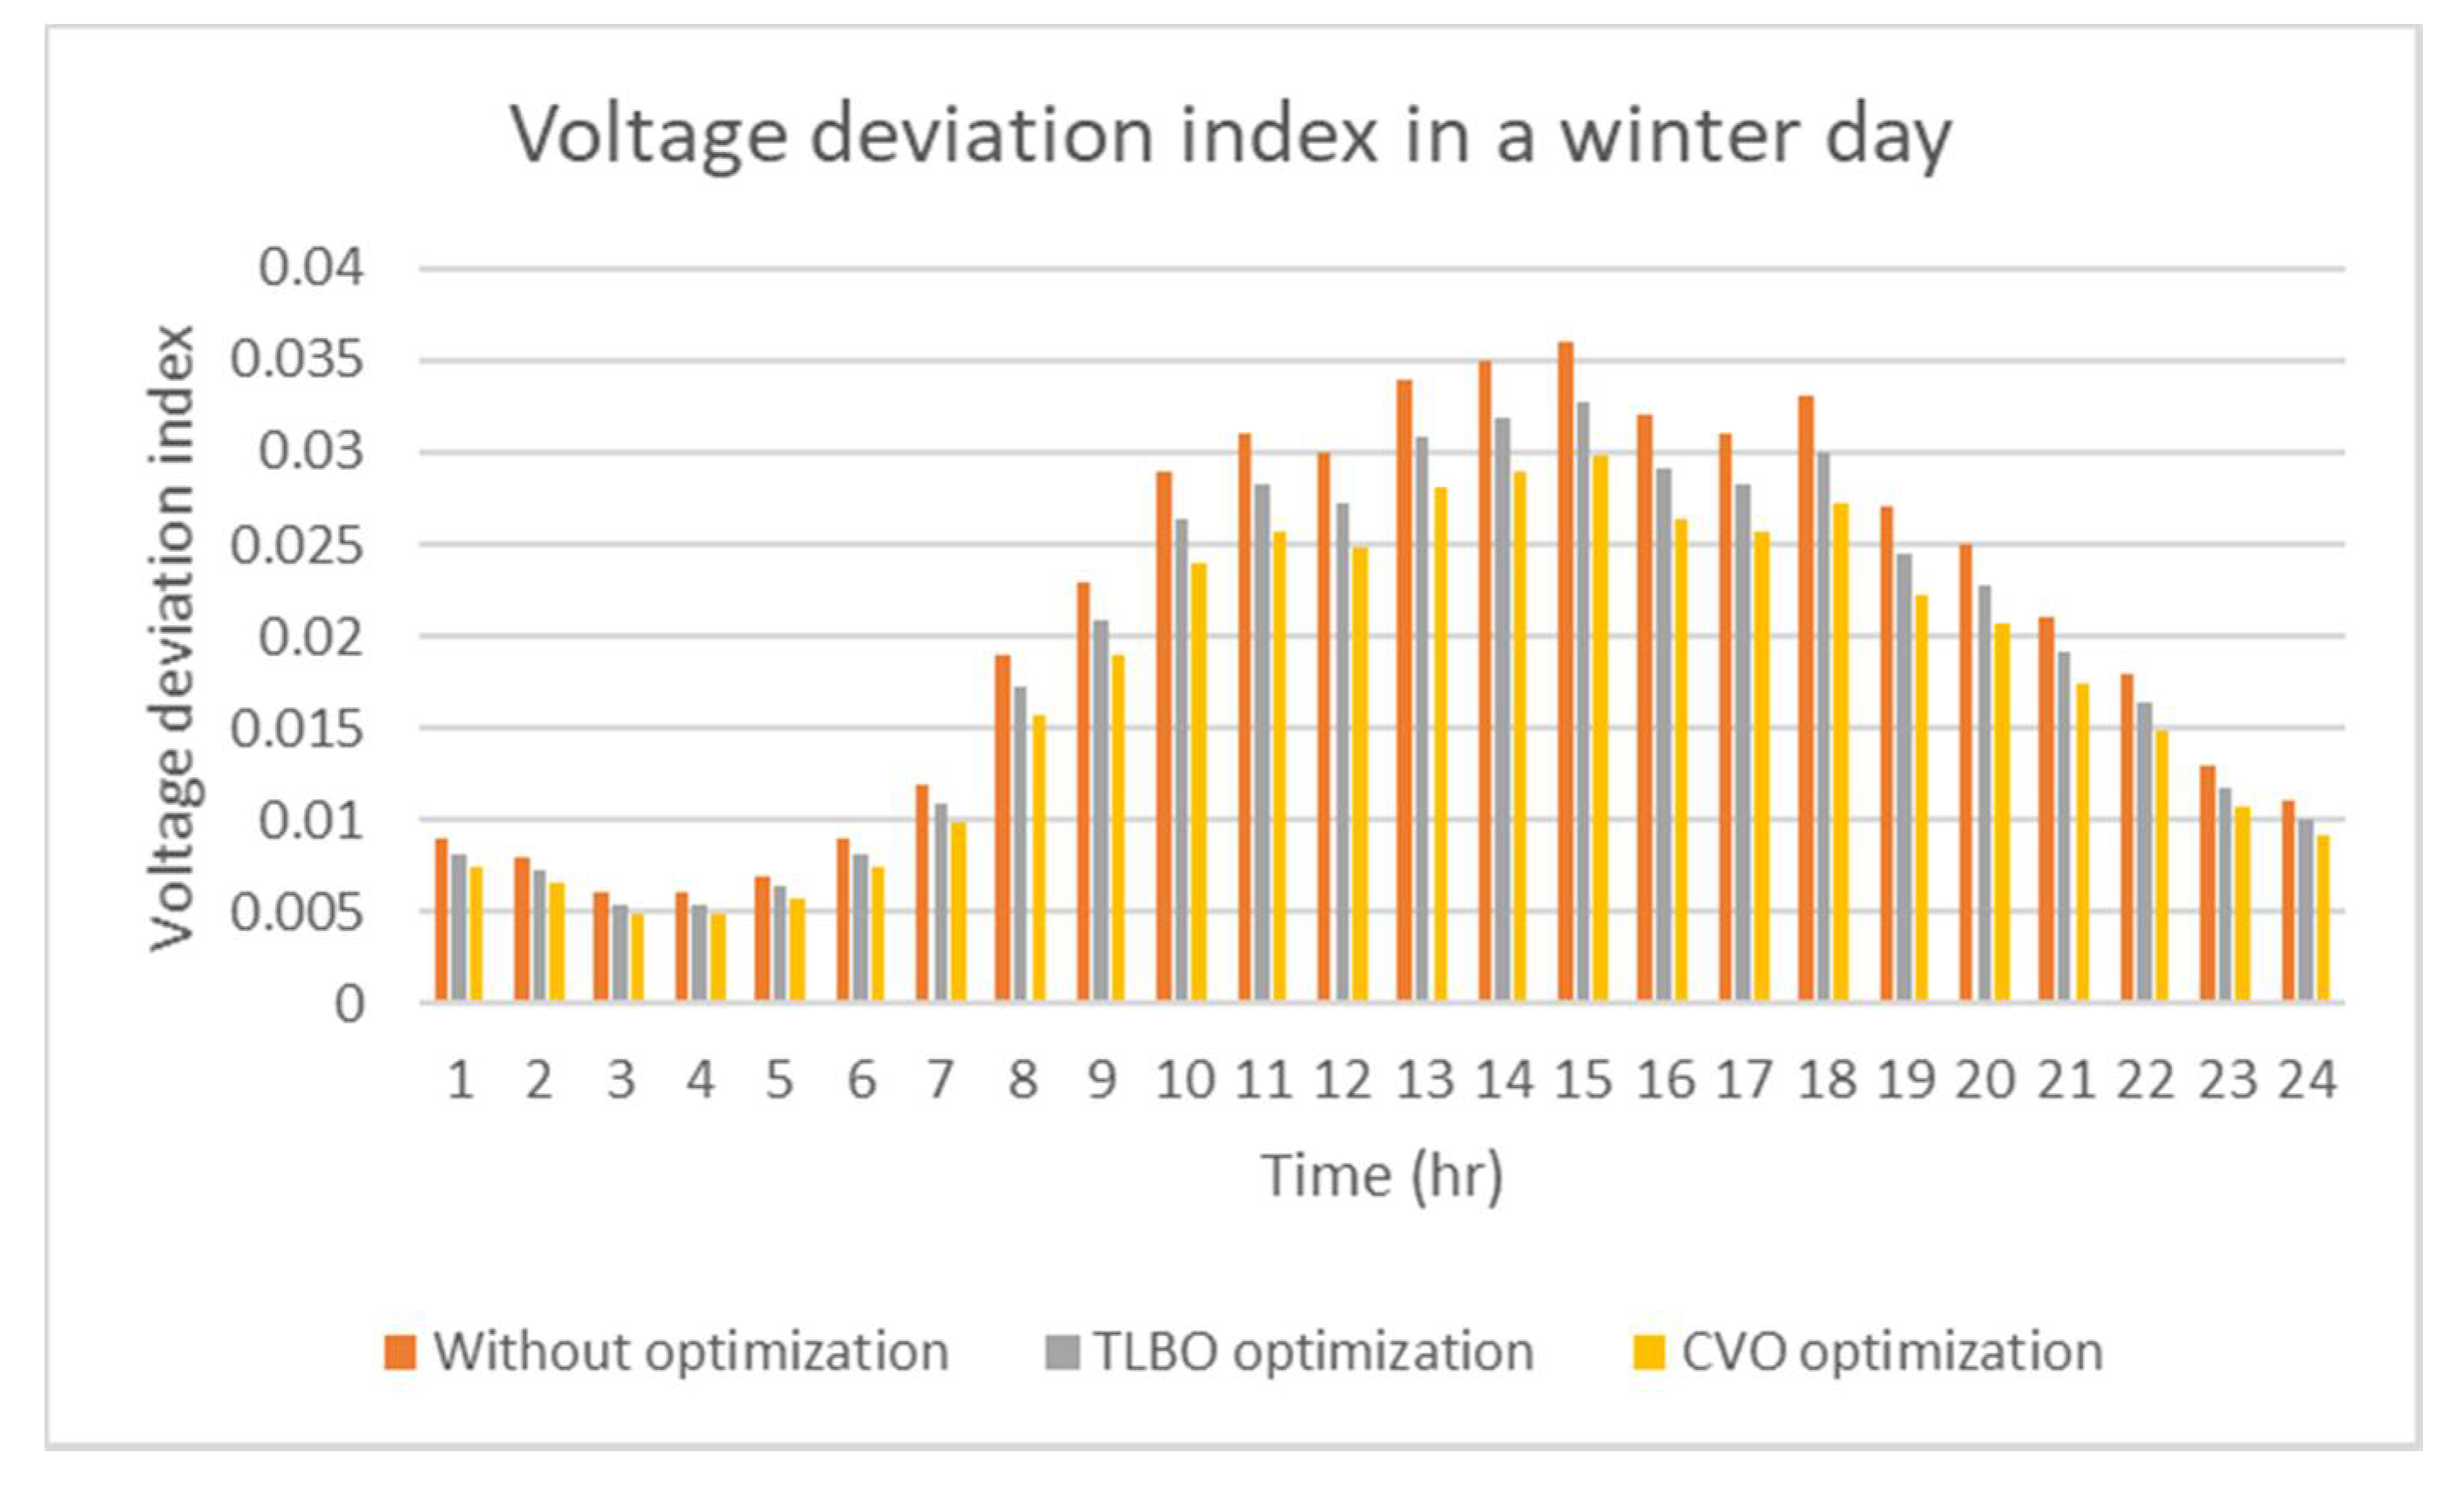
- Maximization of renewable power generation in the Egyptian power system considering also achieving the lowest total power losses possible and minimum voltage deviation.
- The paper presents the application of the new CVO optimization technique to the Egyptian power system. The Egyptian power system performance is compared in the following three cases: (i) with CVO optimal power flow, (ii) with TLBO optimal power flow and (iii) without optimization.
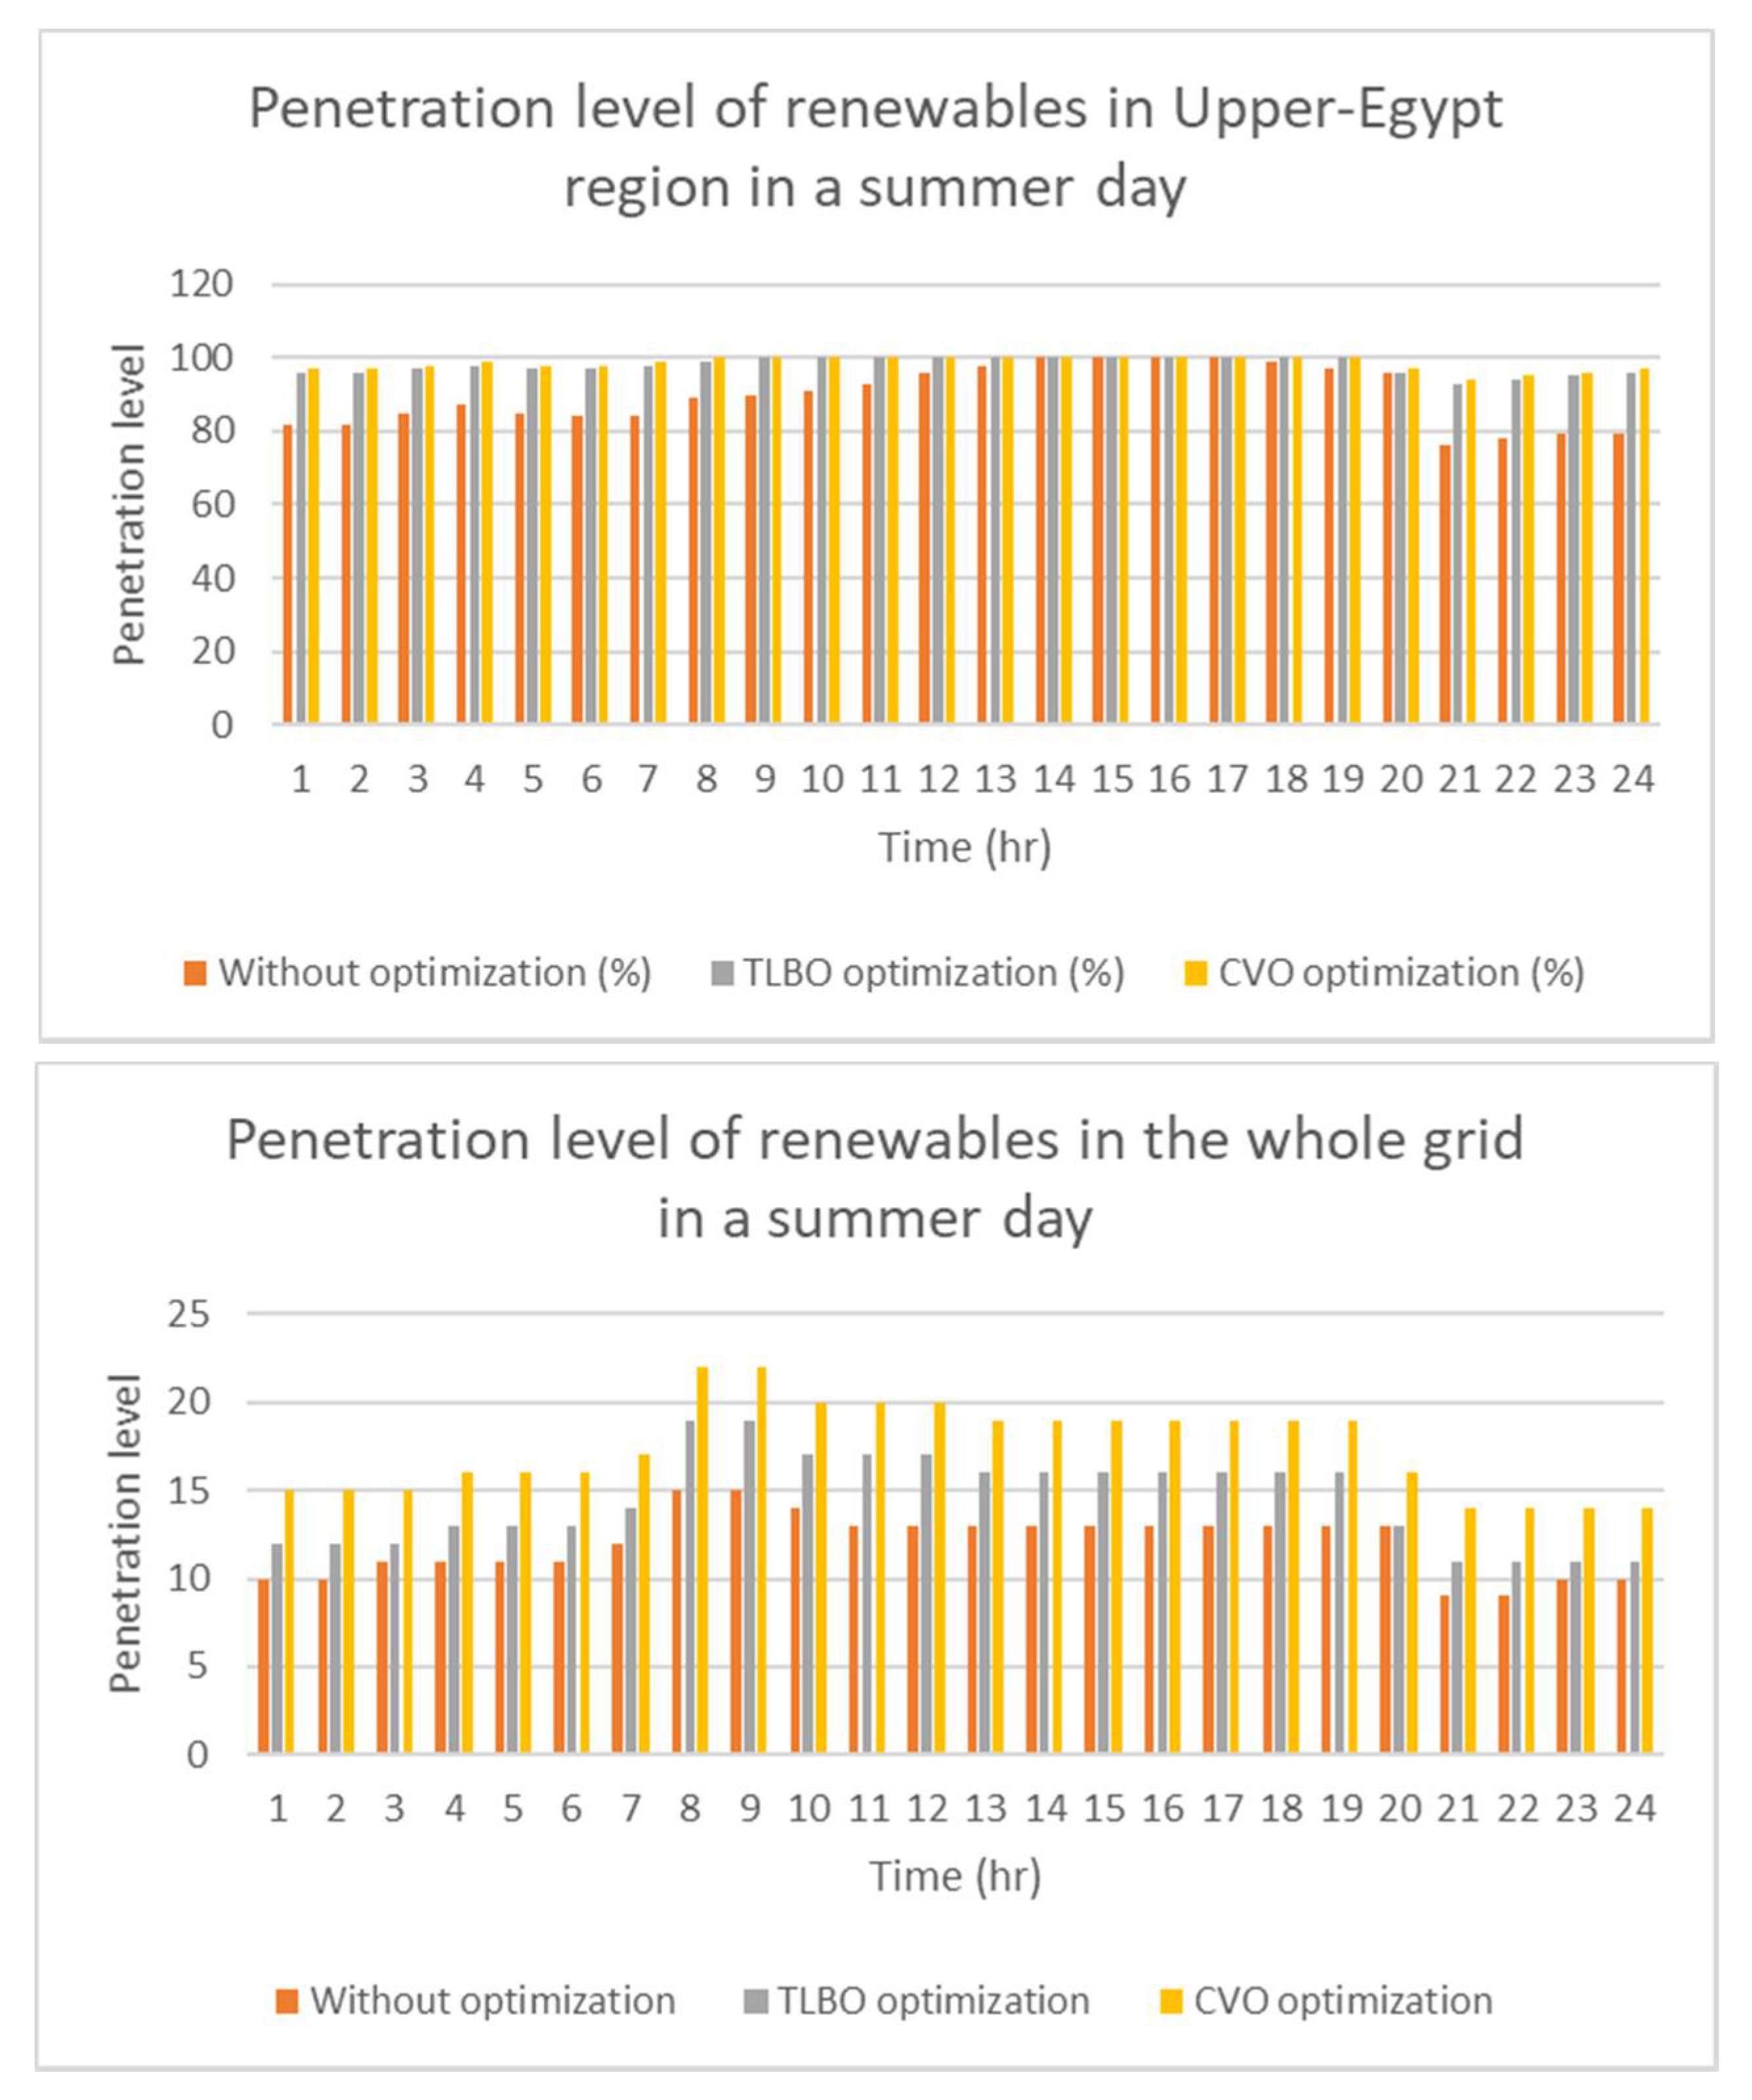
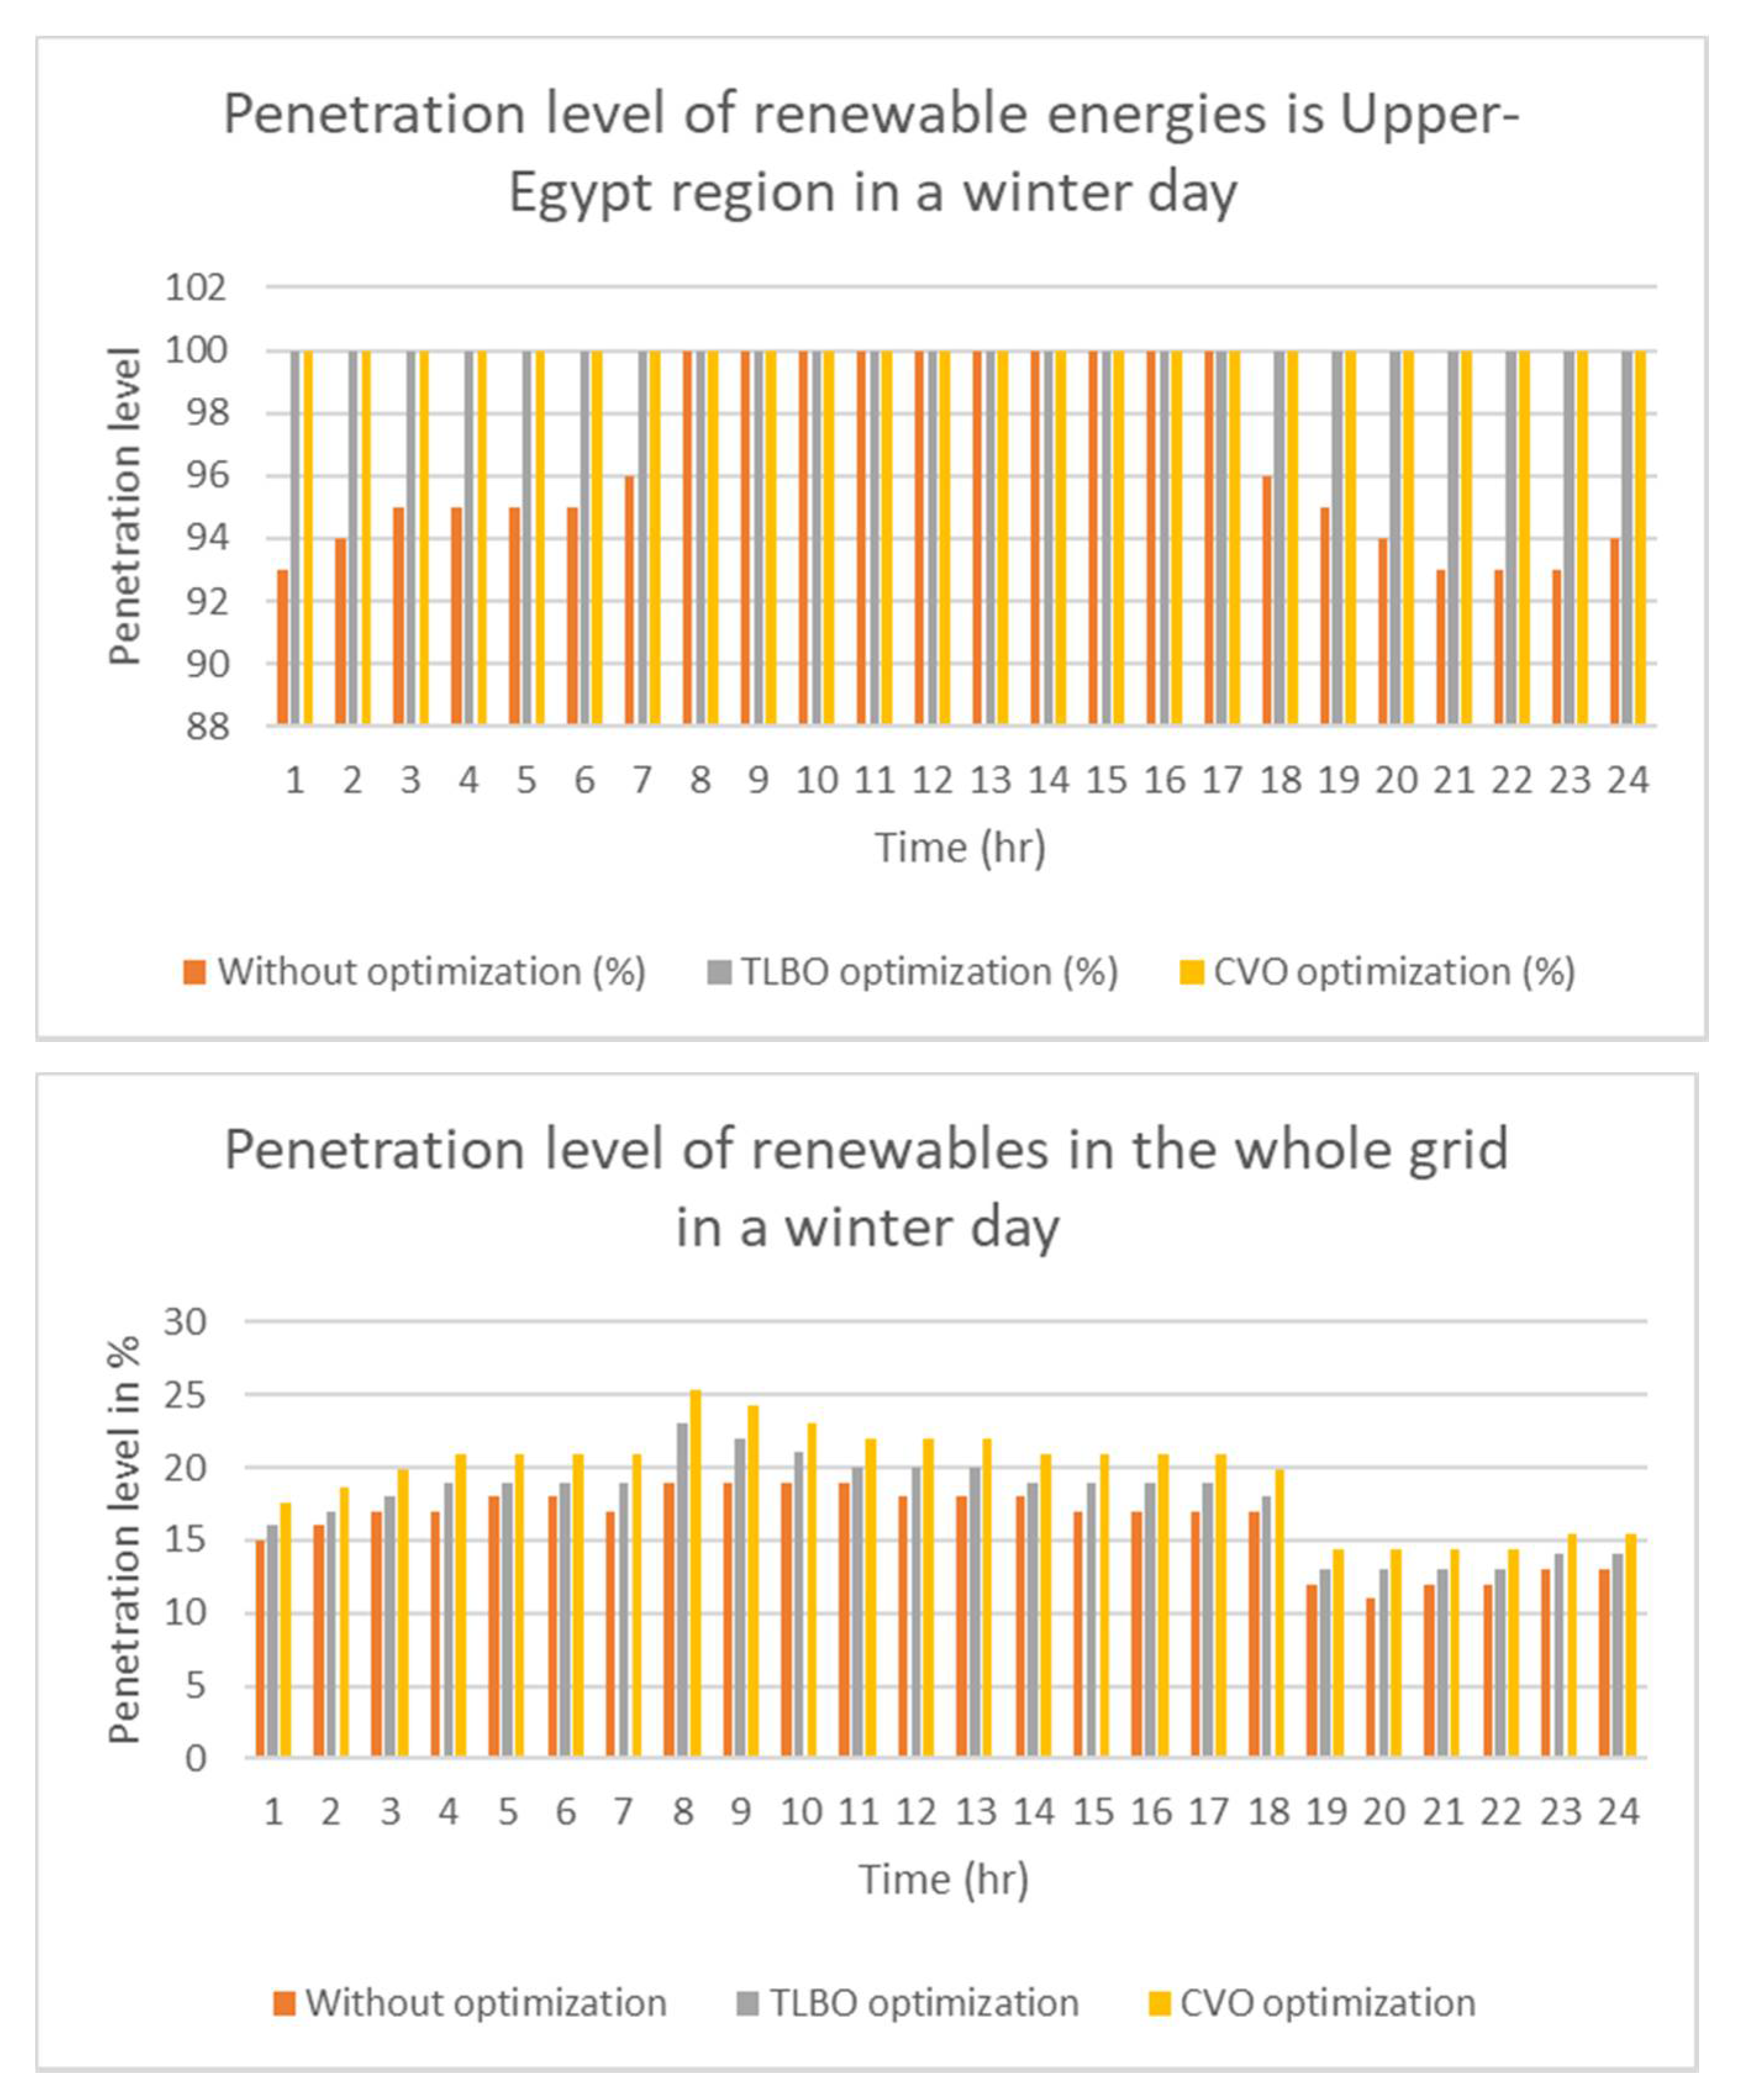
- The research is also focusing on operating the Upper-Egypt region with 100% renewable energy for most of the daytime hours as it currently includes three renewable energy power stations in terms of a large photovoltaic park and two hydro power stations.
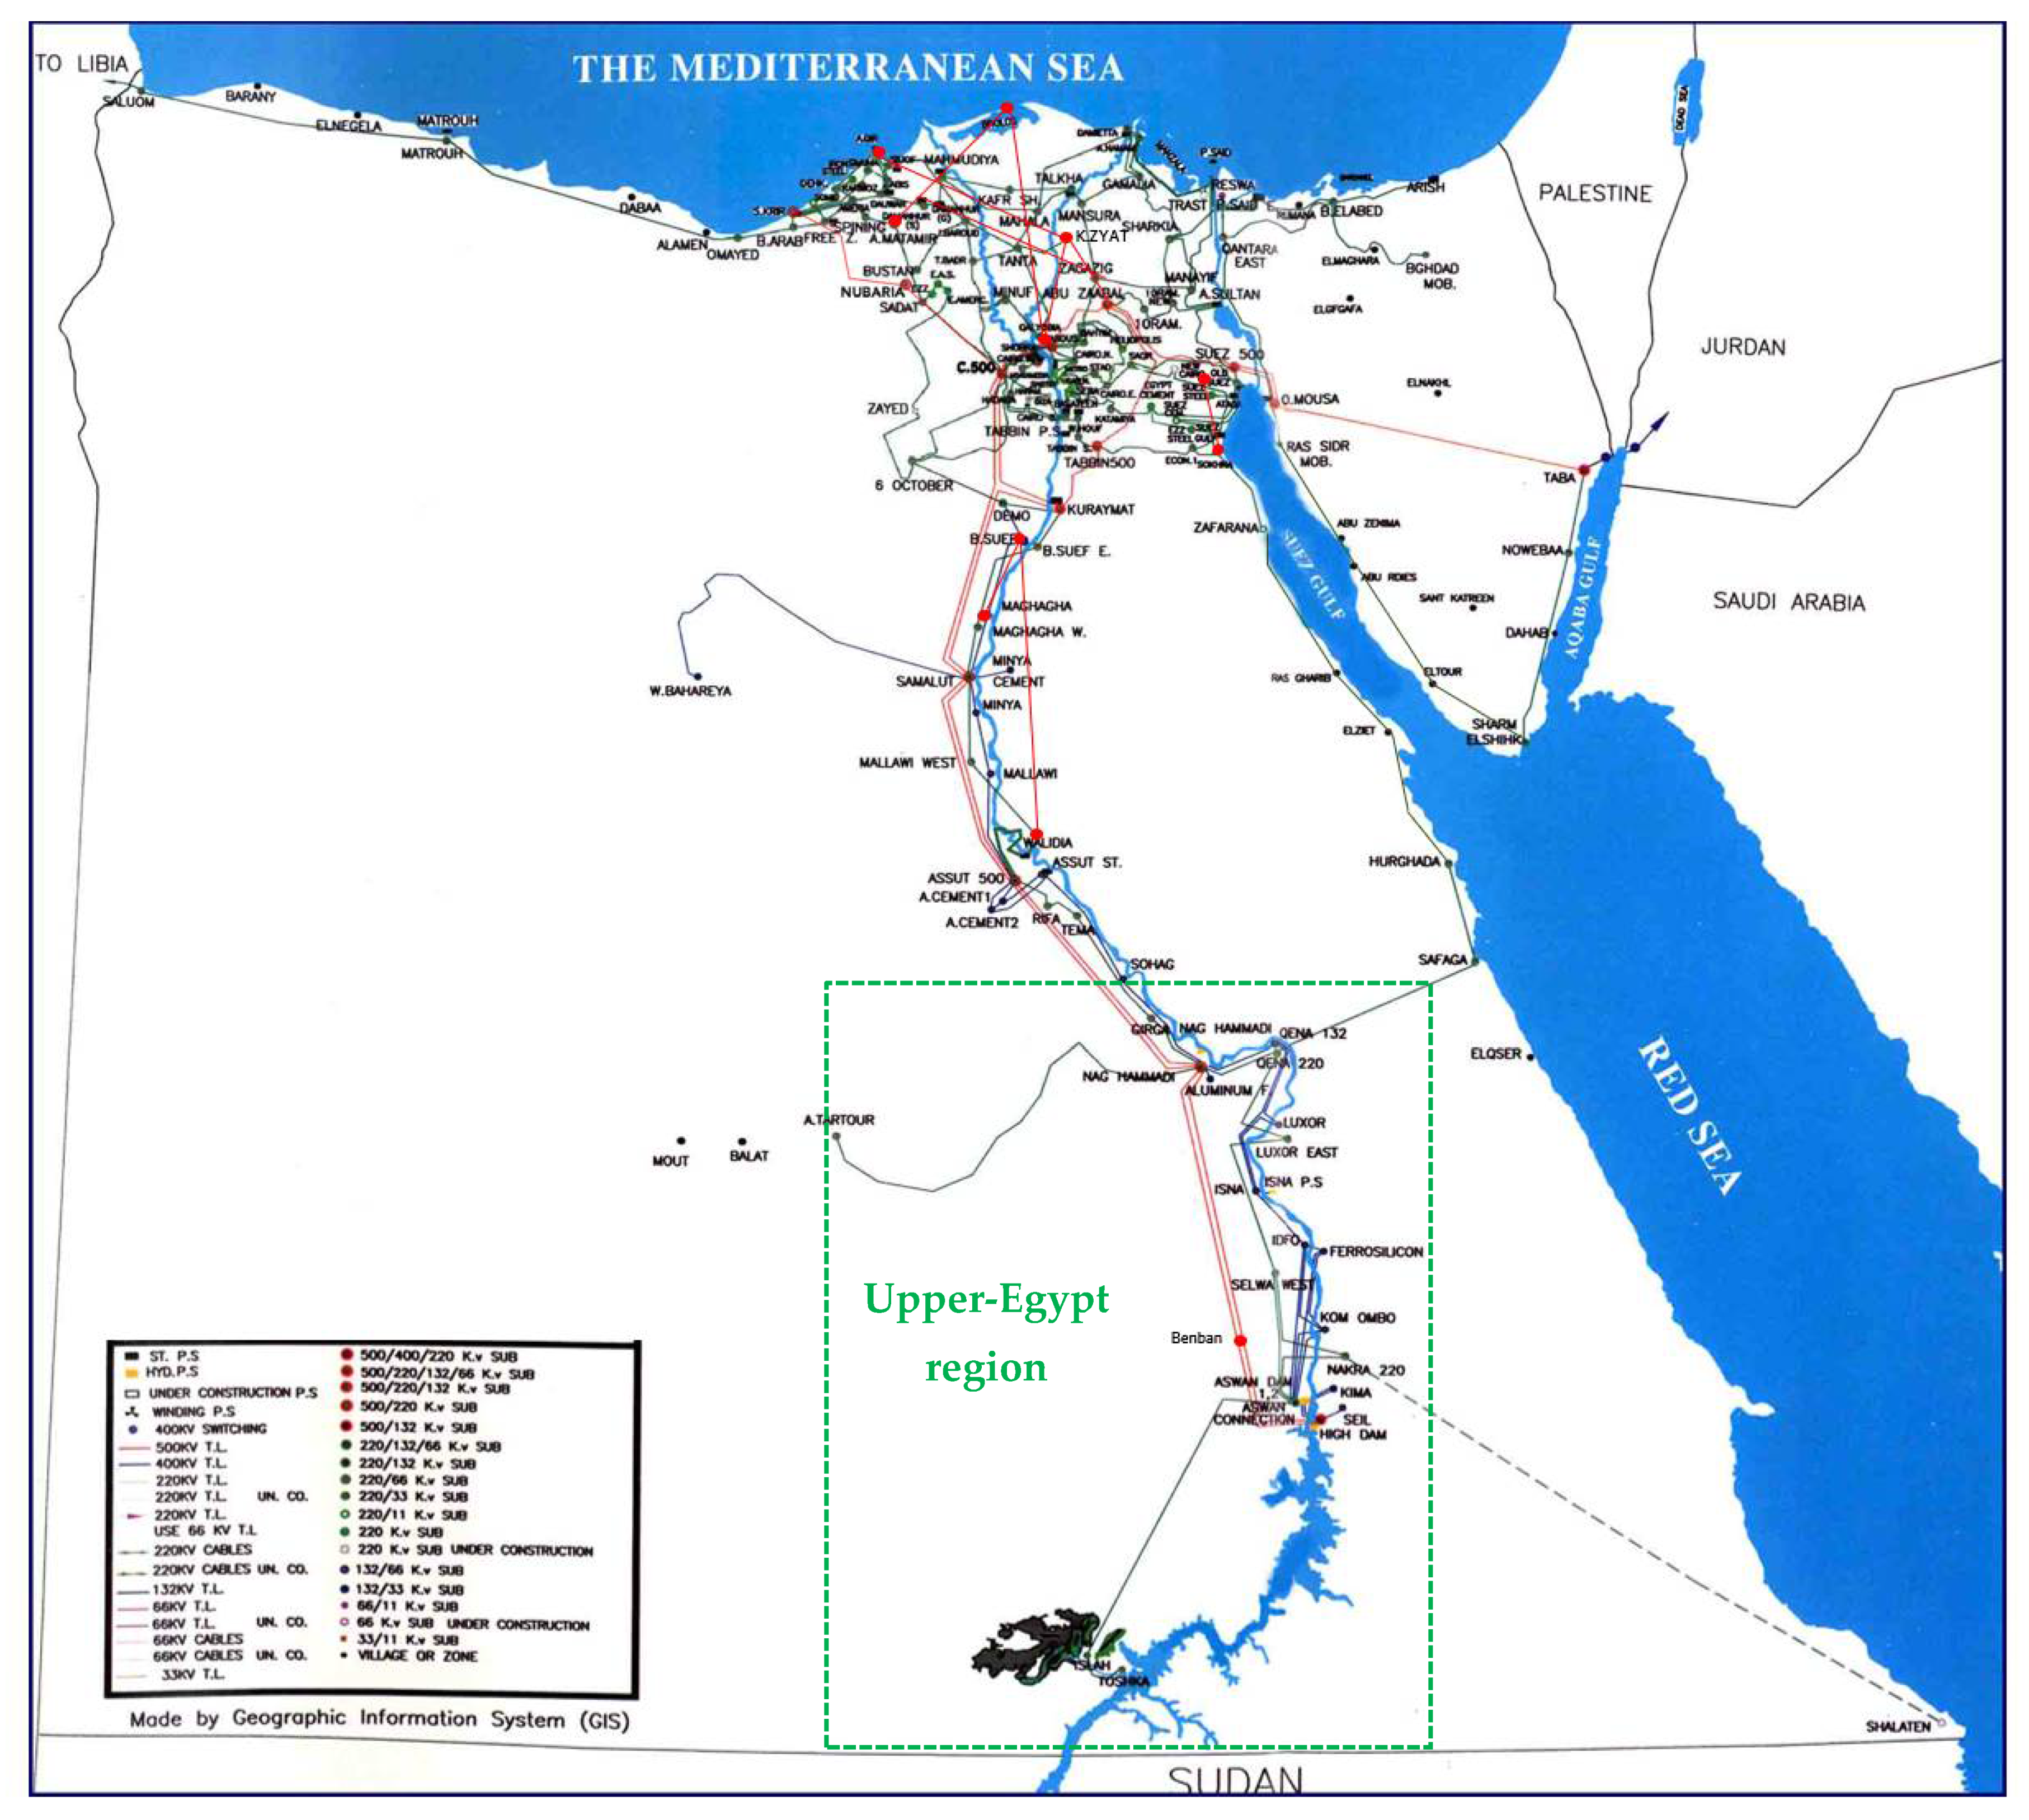
2. Egyptian Power System
- Cairo
- Alexandria
- Canal
- Delta
- Middle-Egypt
- Upper-Egypt
- Power flow calculations
- Optimal power flow calculations
- Short circuit analysis
- Contingency analysis
- Transient analysis
3. Renewable Energies in Egypt
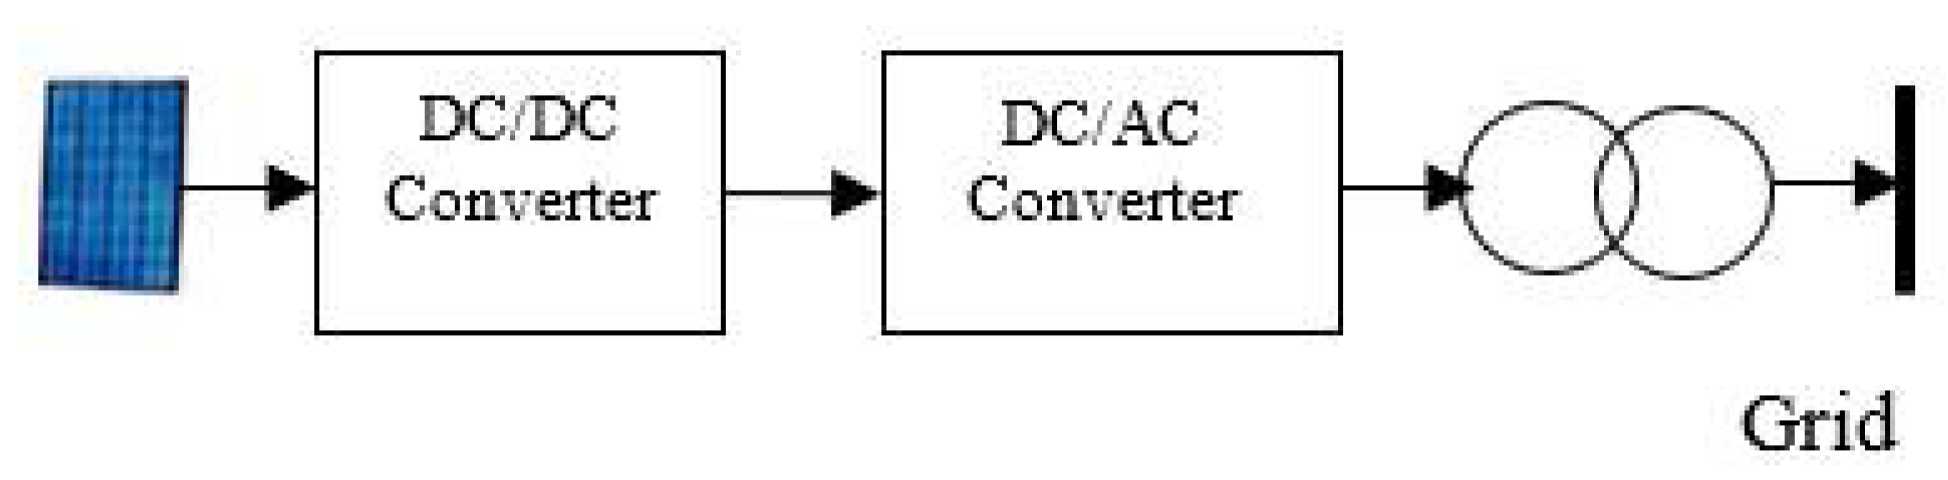
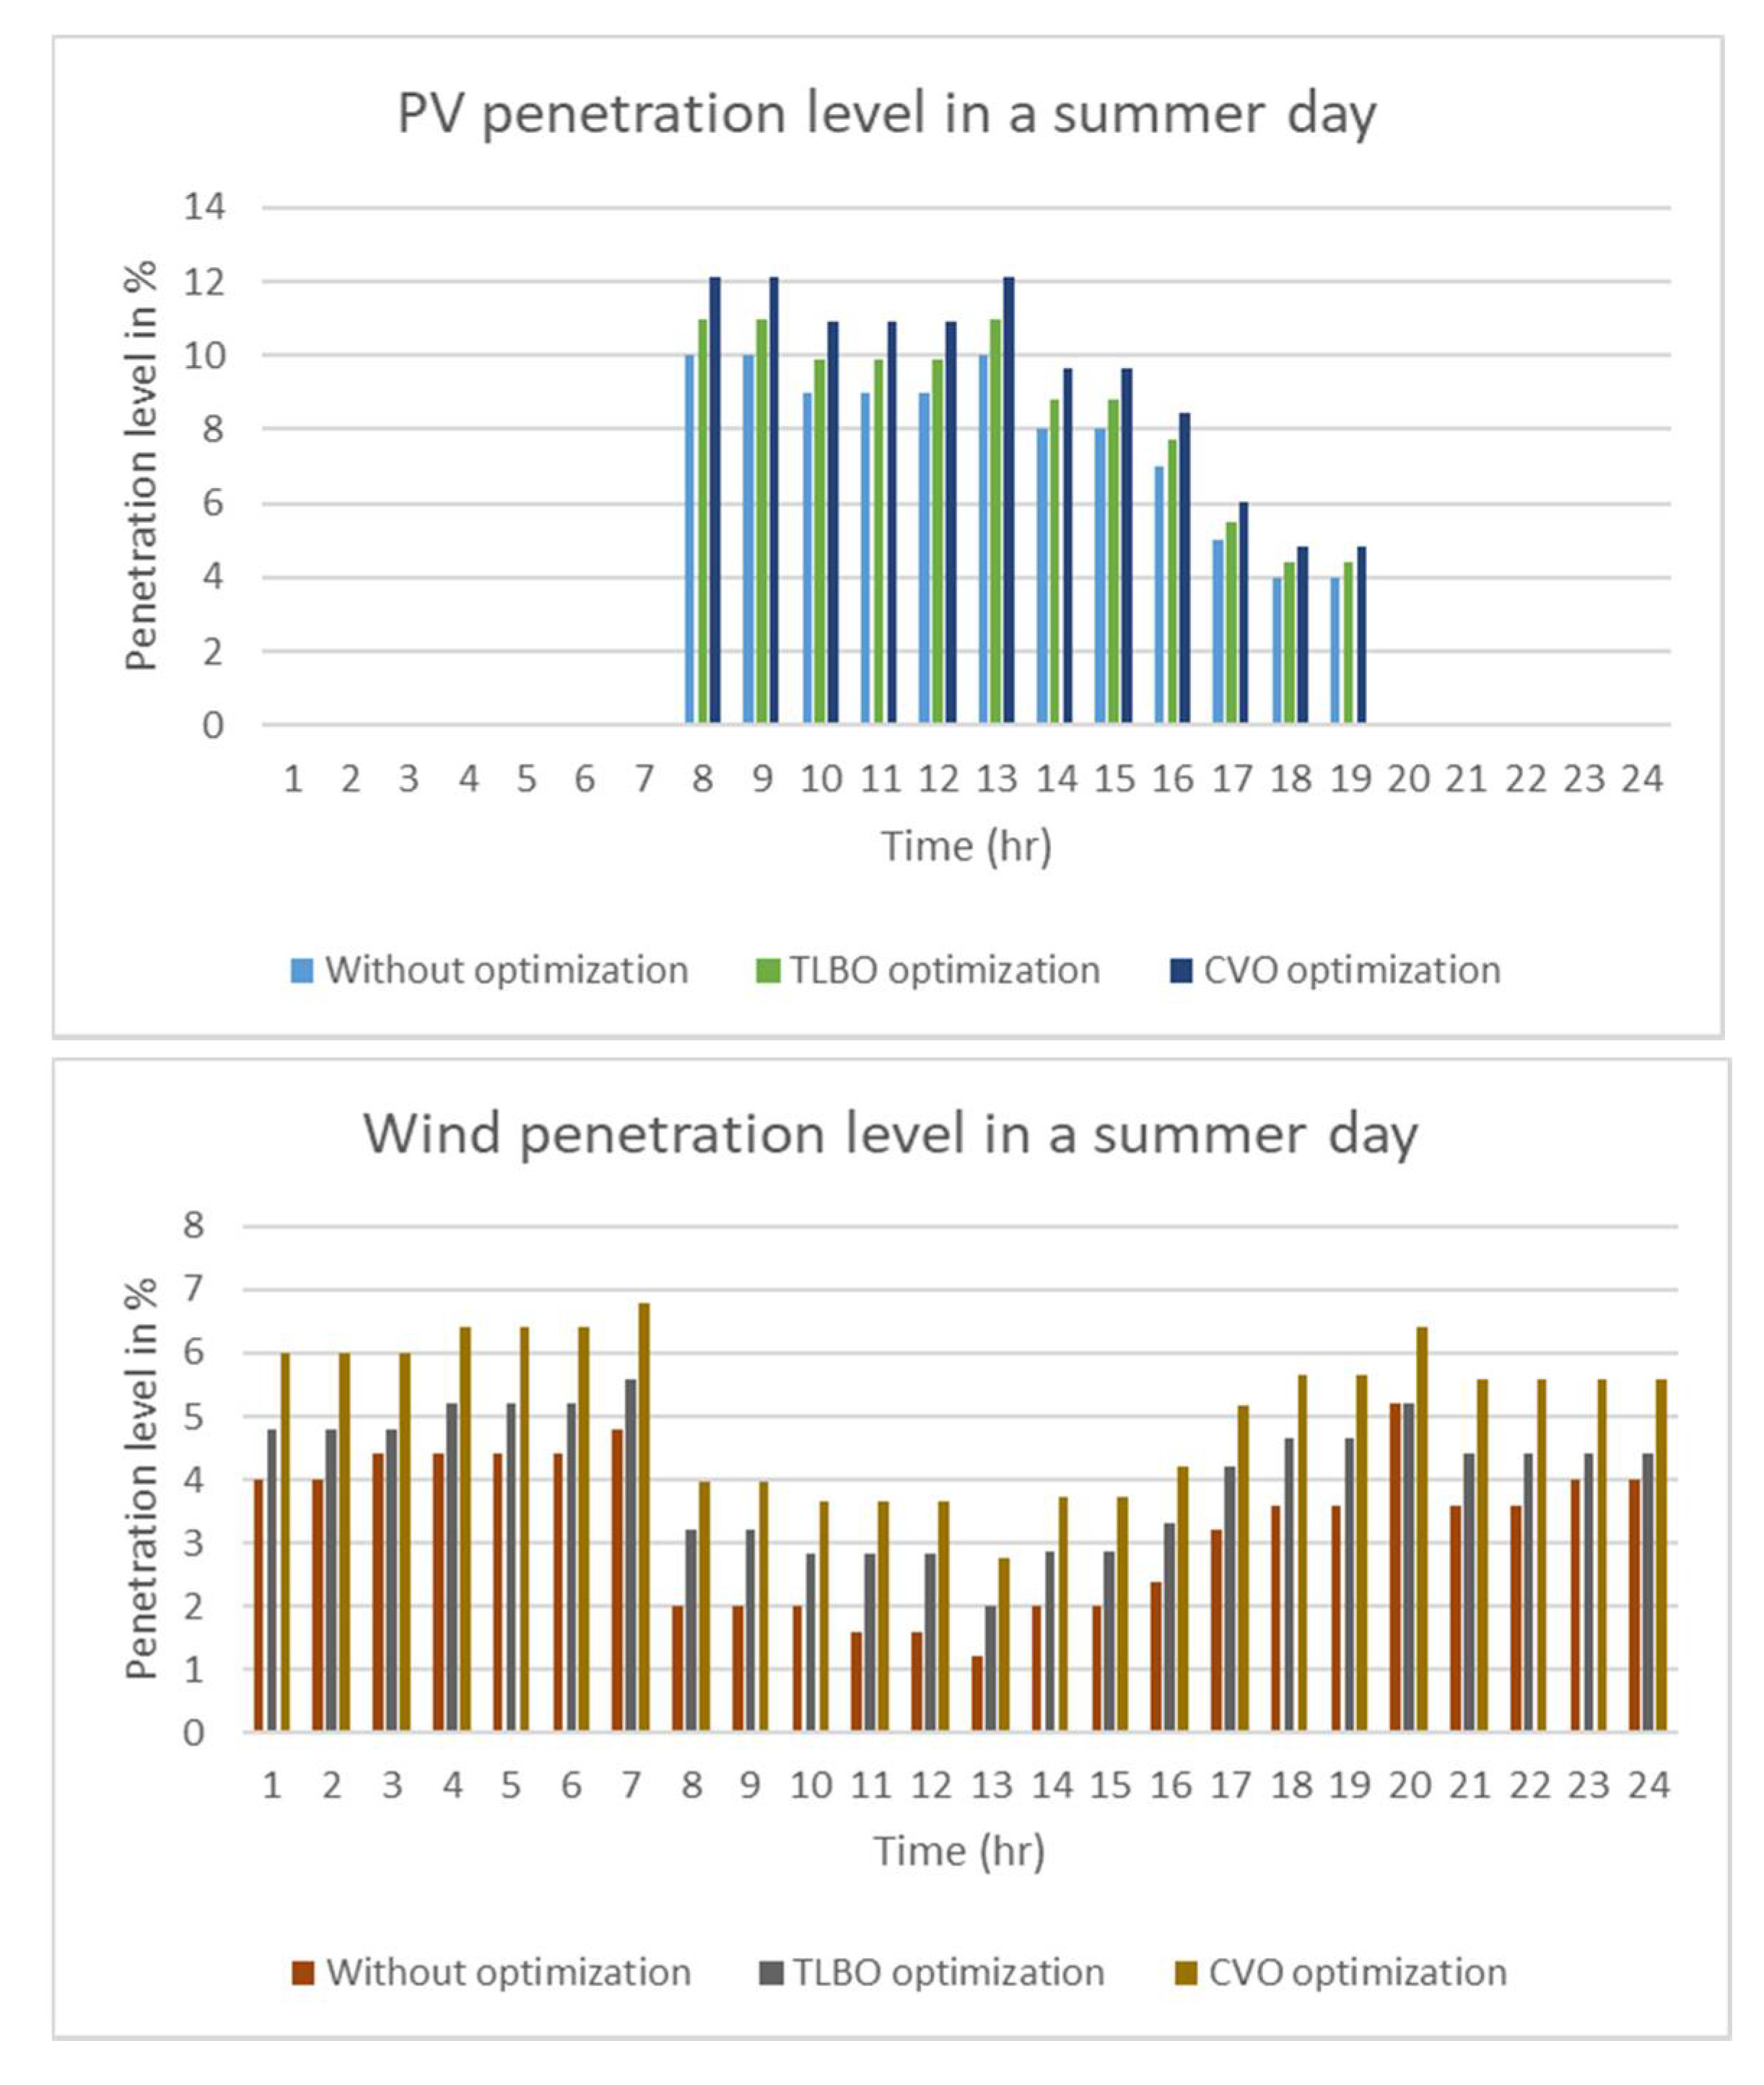
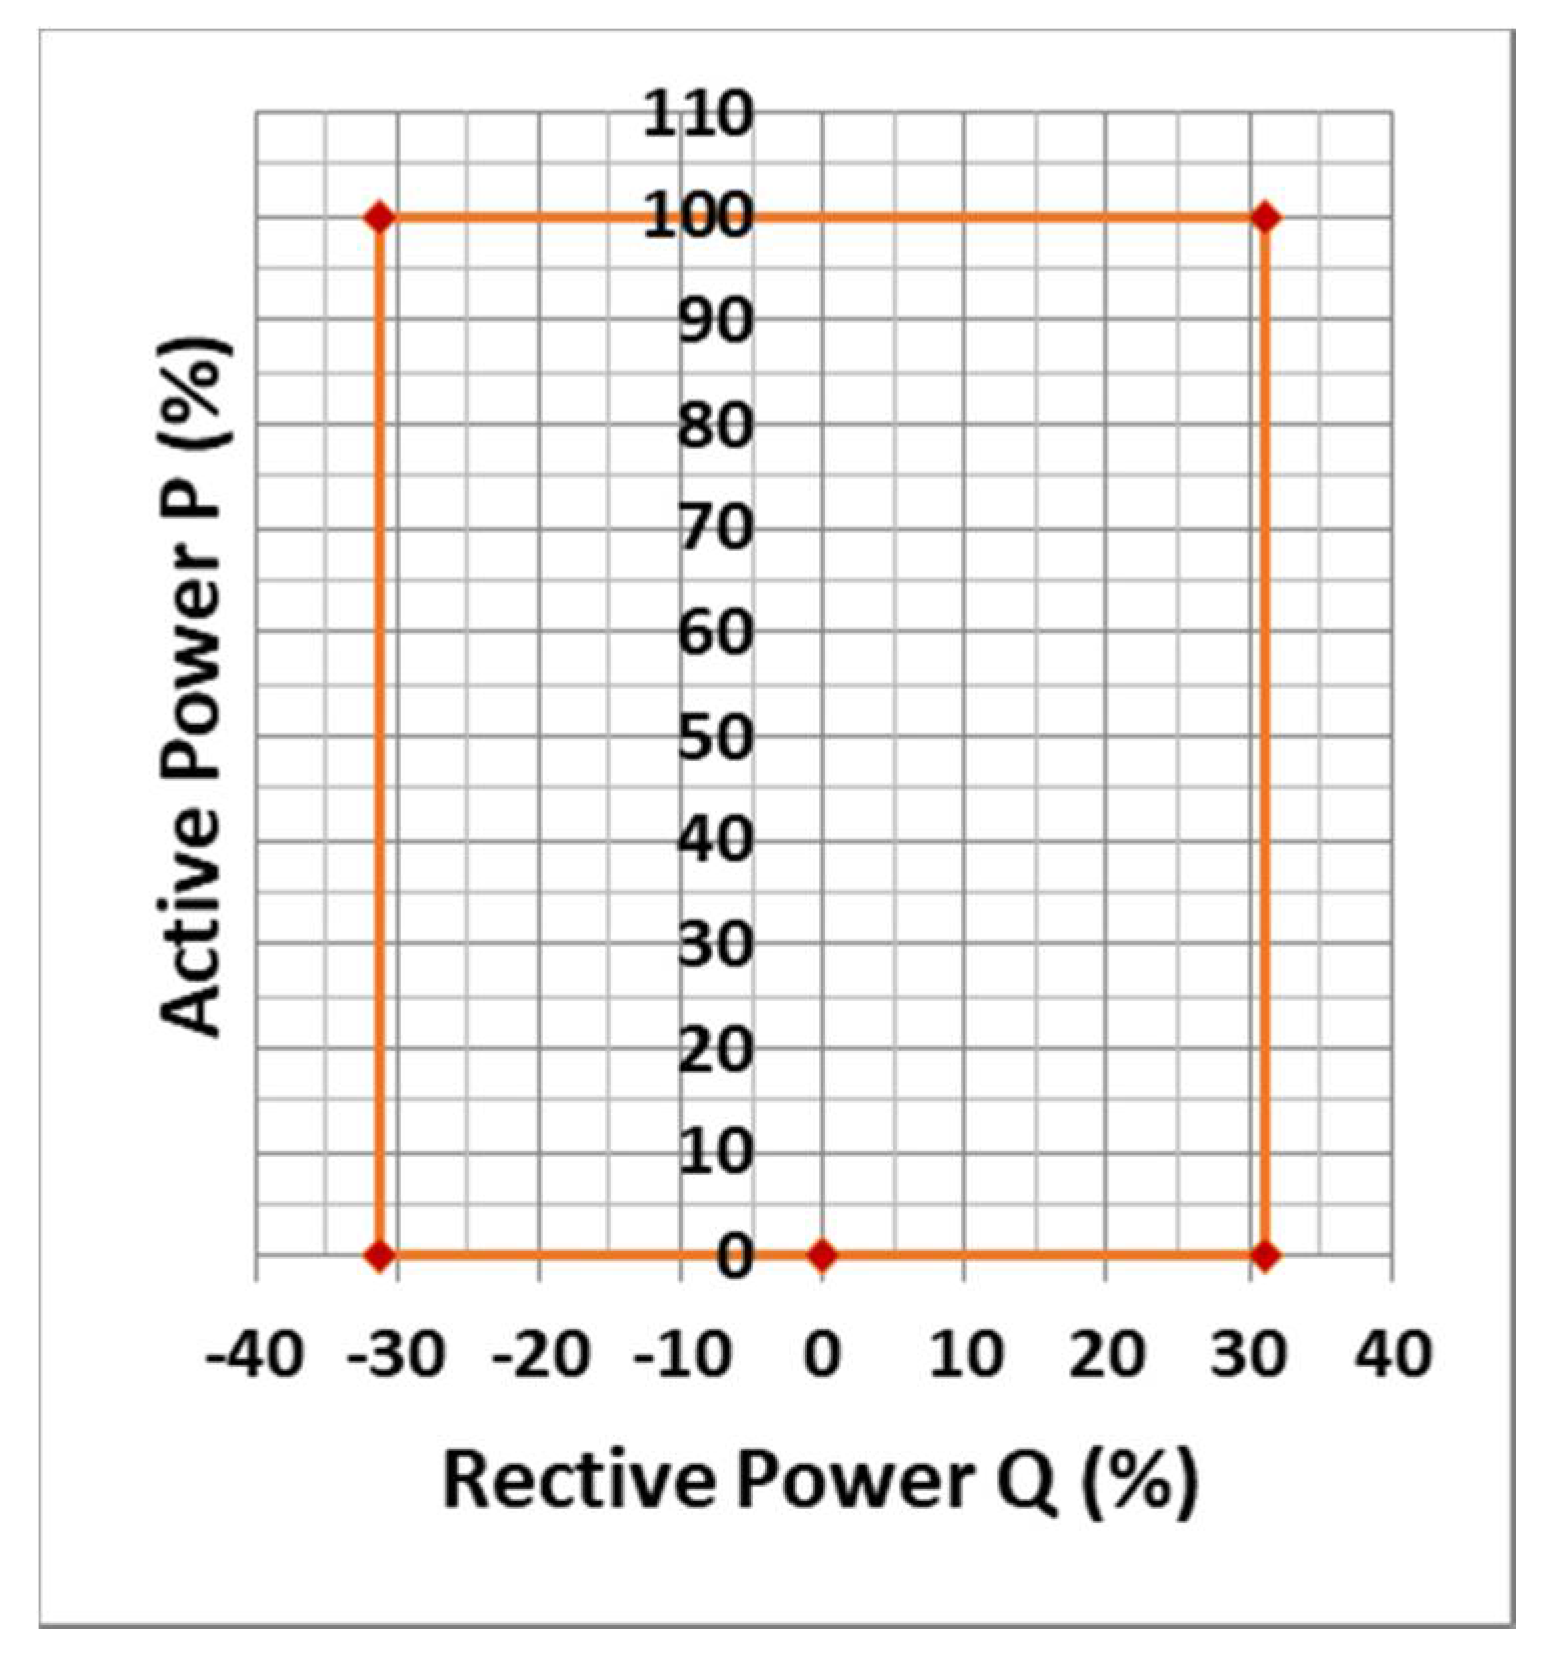
3.1. Photovoltaics
- PQ manner
- Voltage control manner
- Droop control manner
3.2. Hydro Power Stations
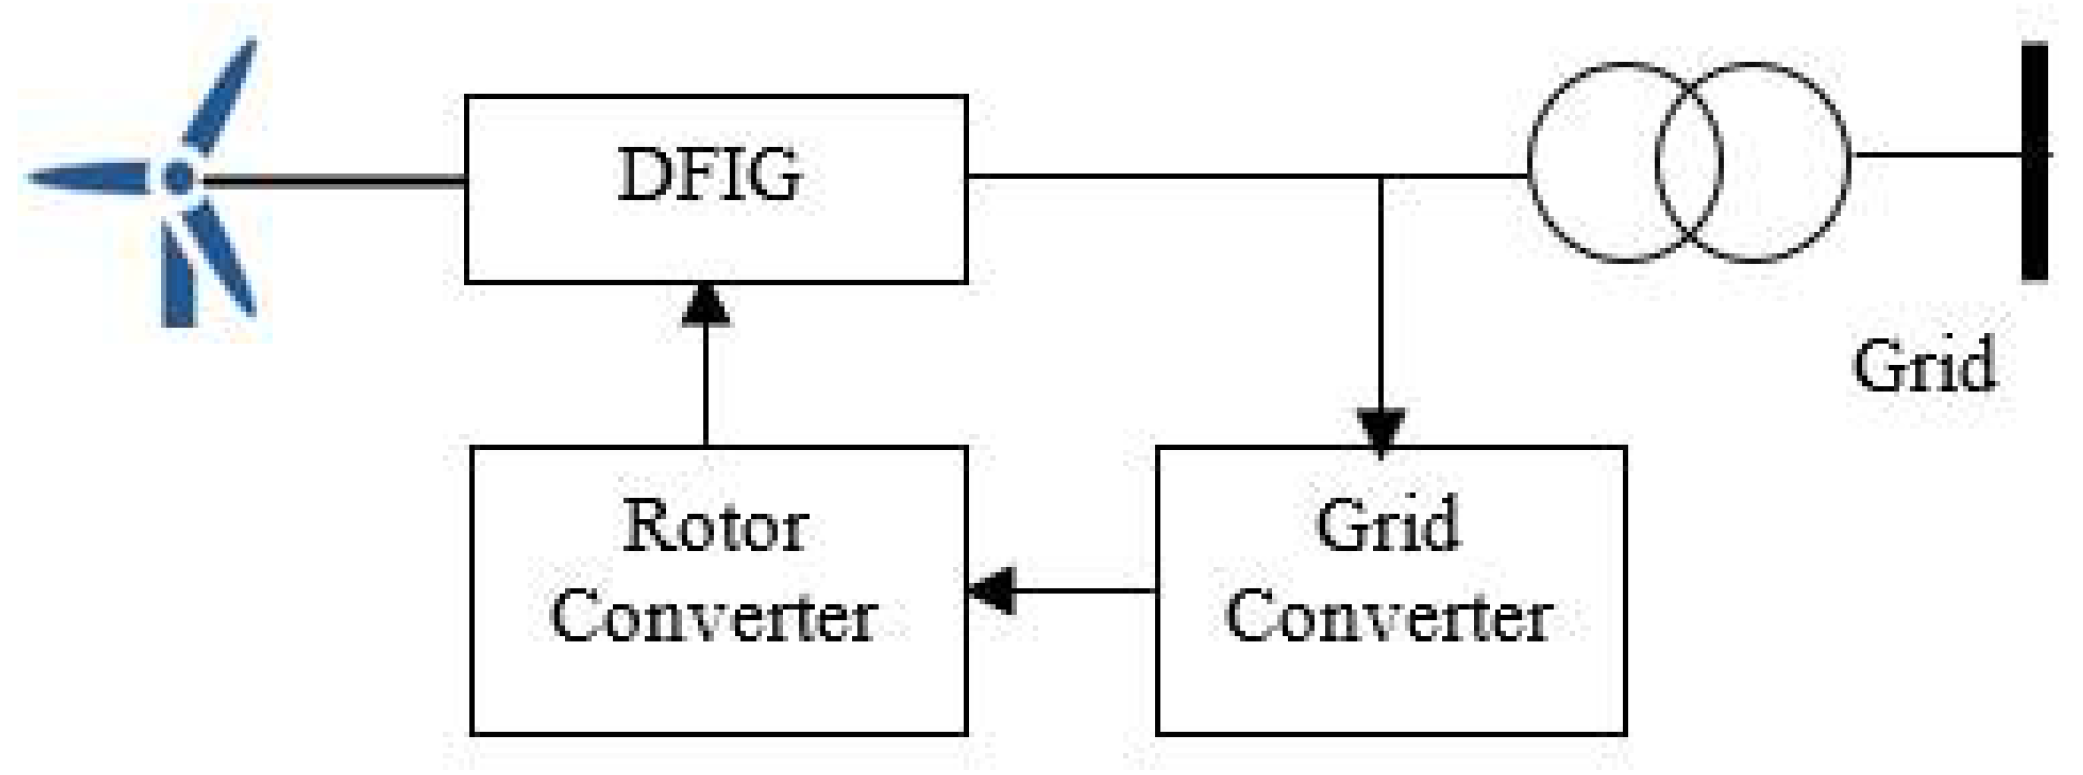
3.3. Wind Farms
4. Egyptian Power Grid Optimization
4.1. Optimization Problem Definition
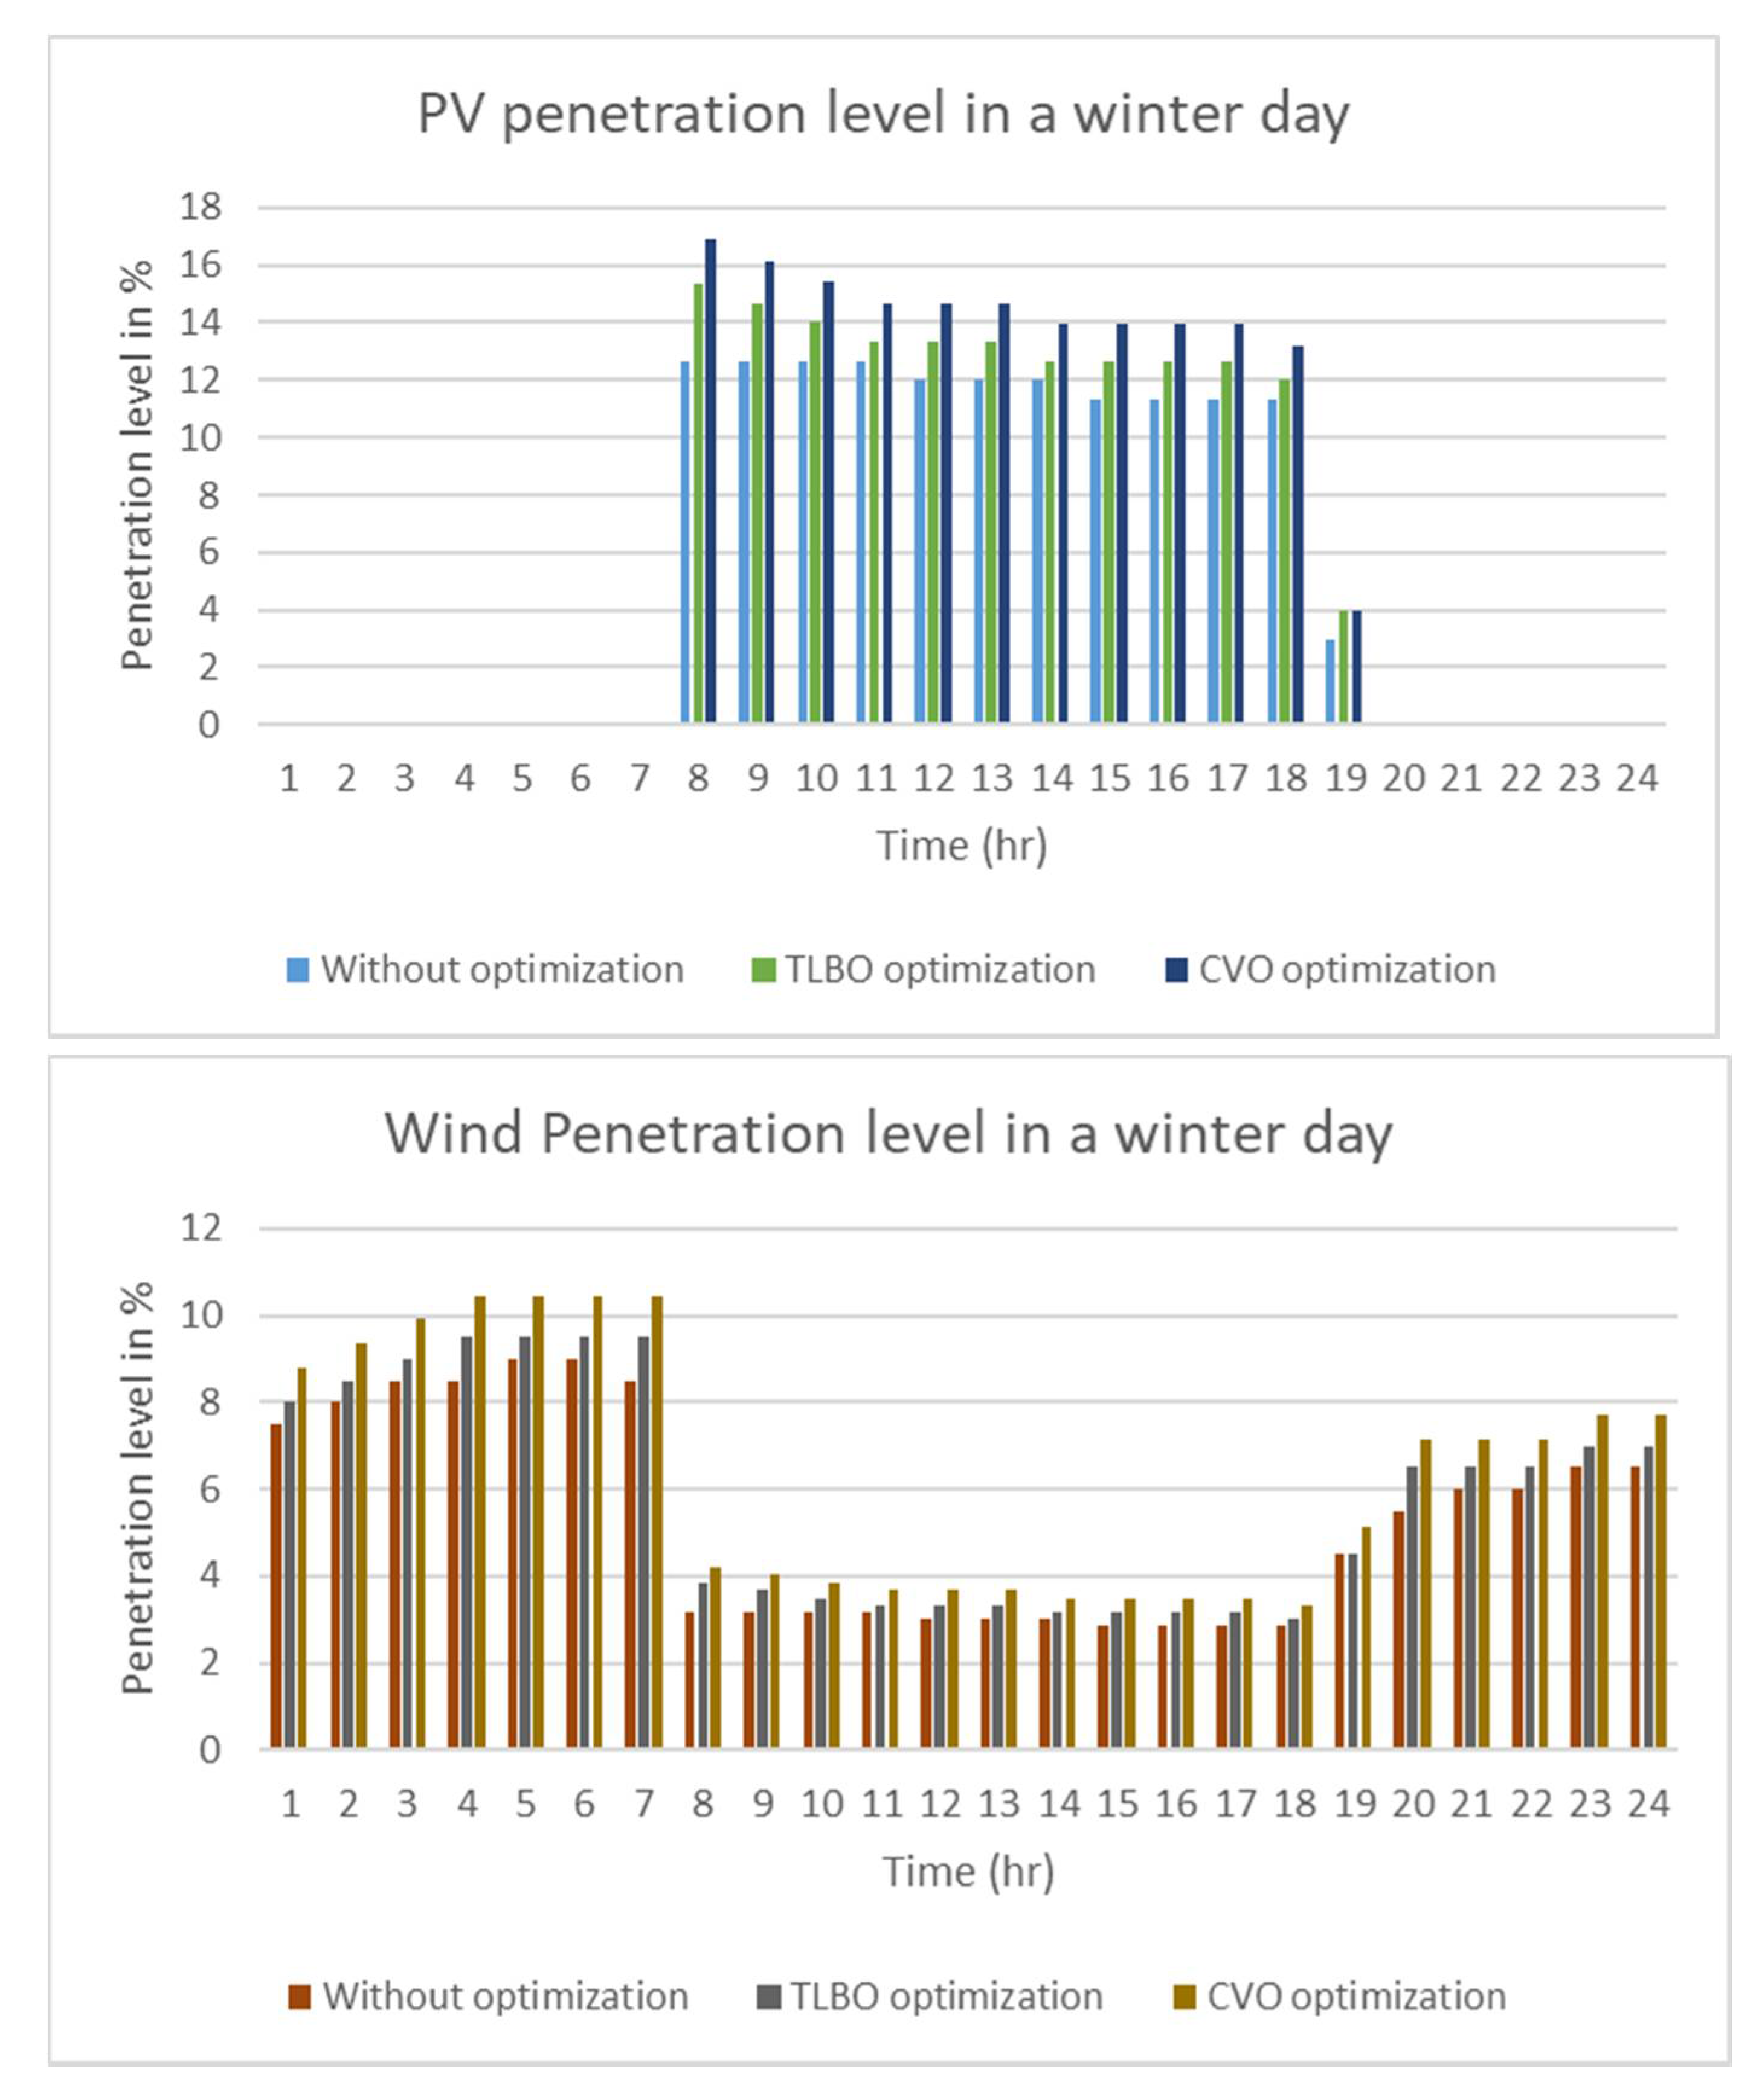
4.1.1. Maximization of the Share of Sustainable energy
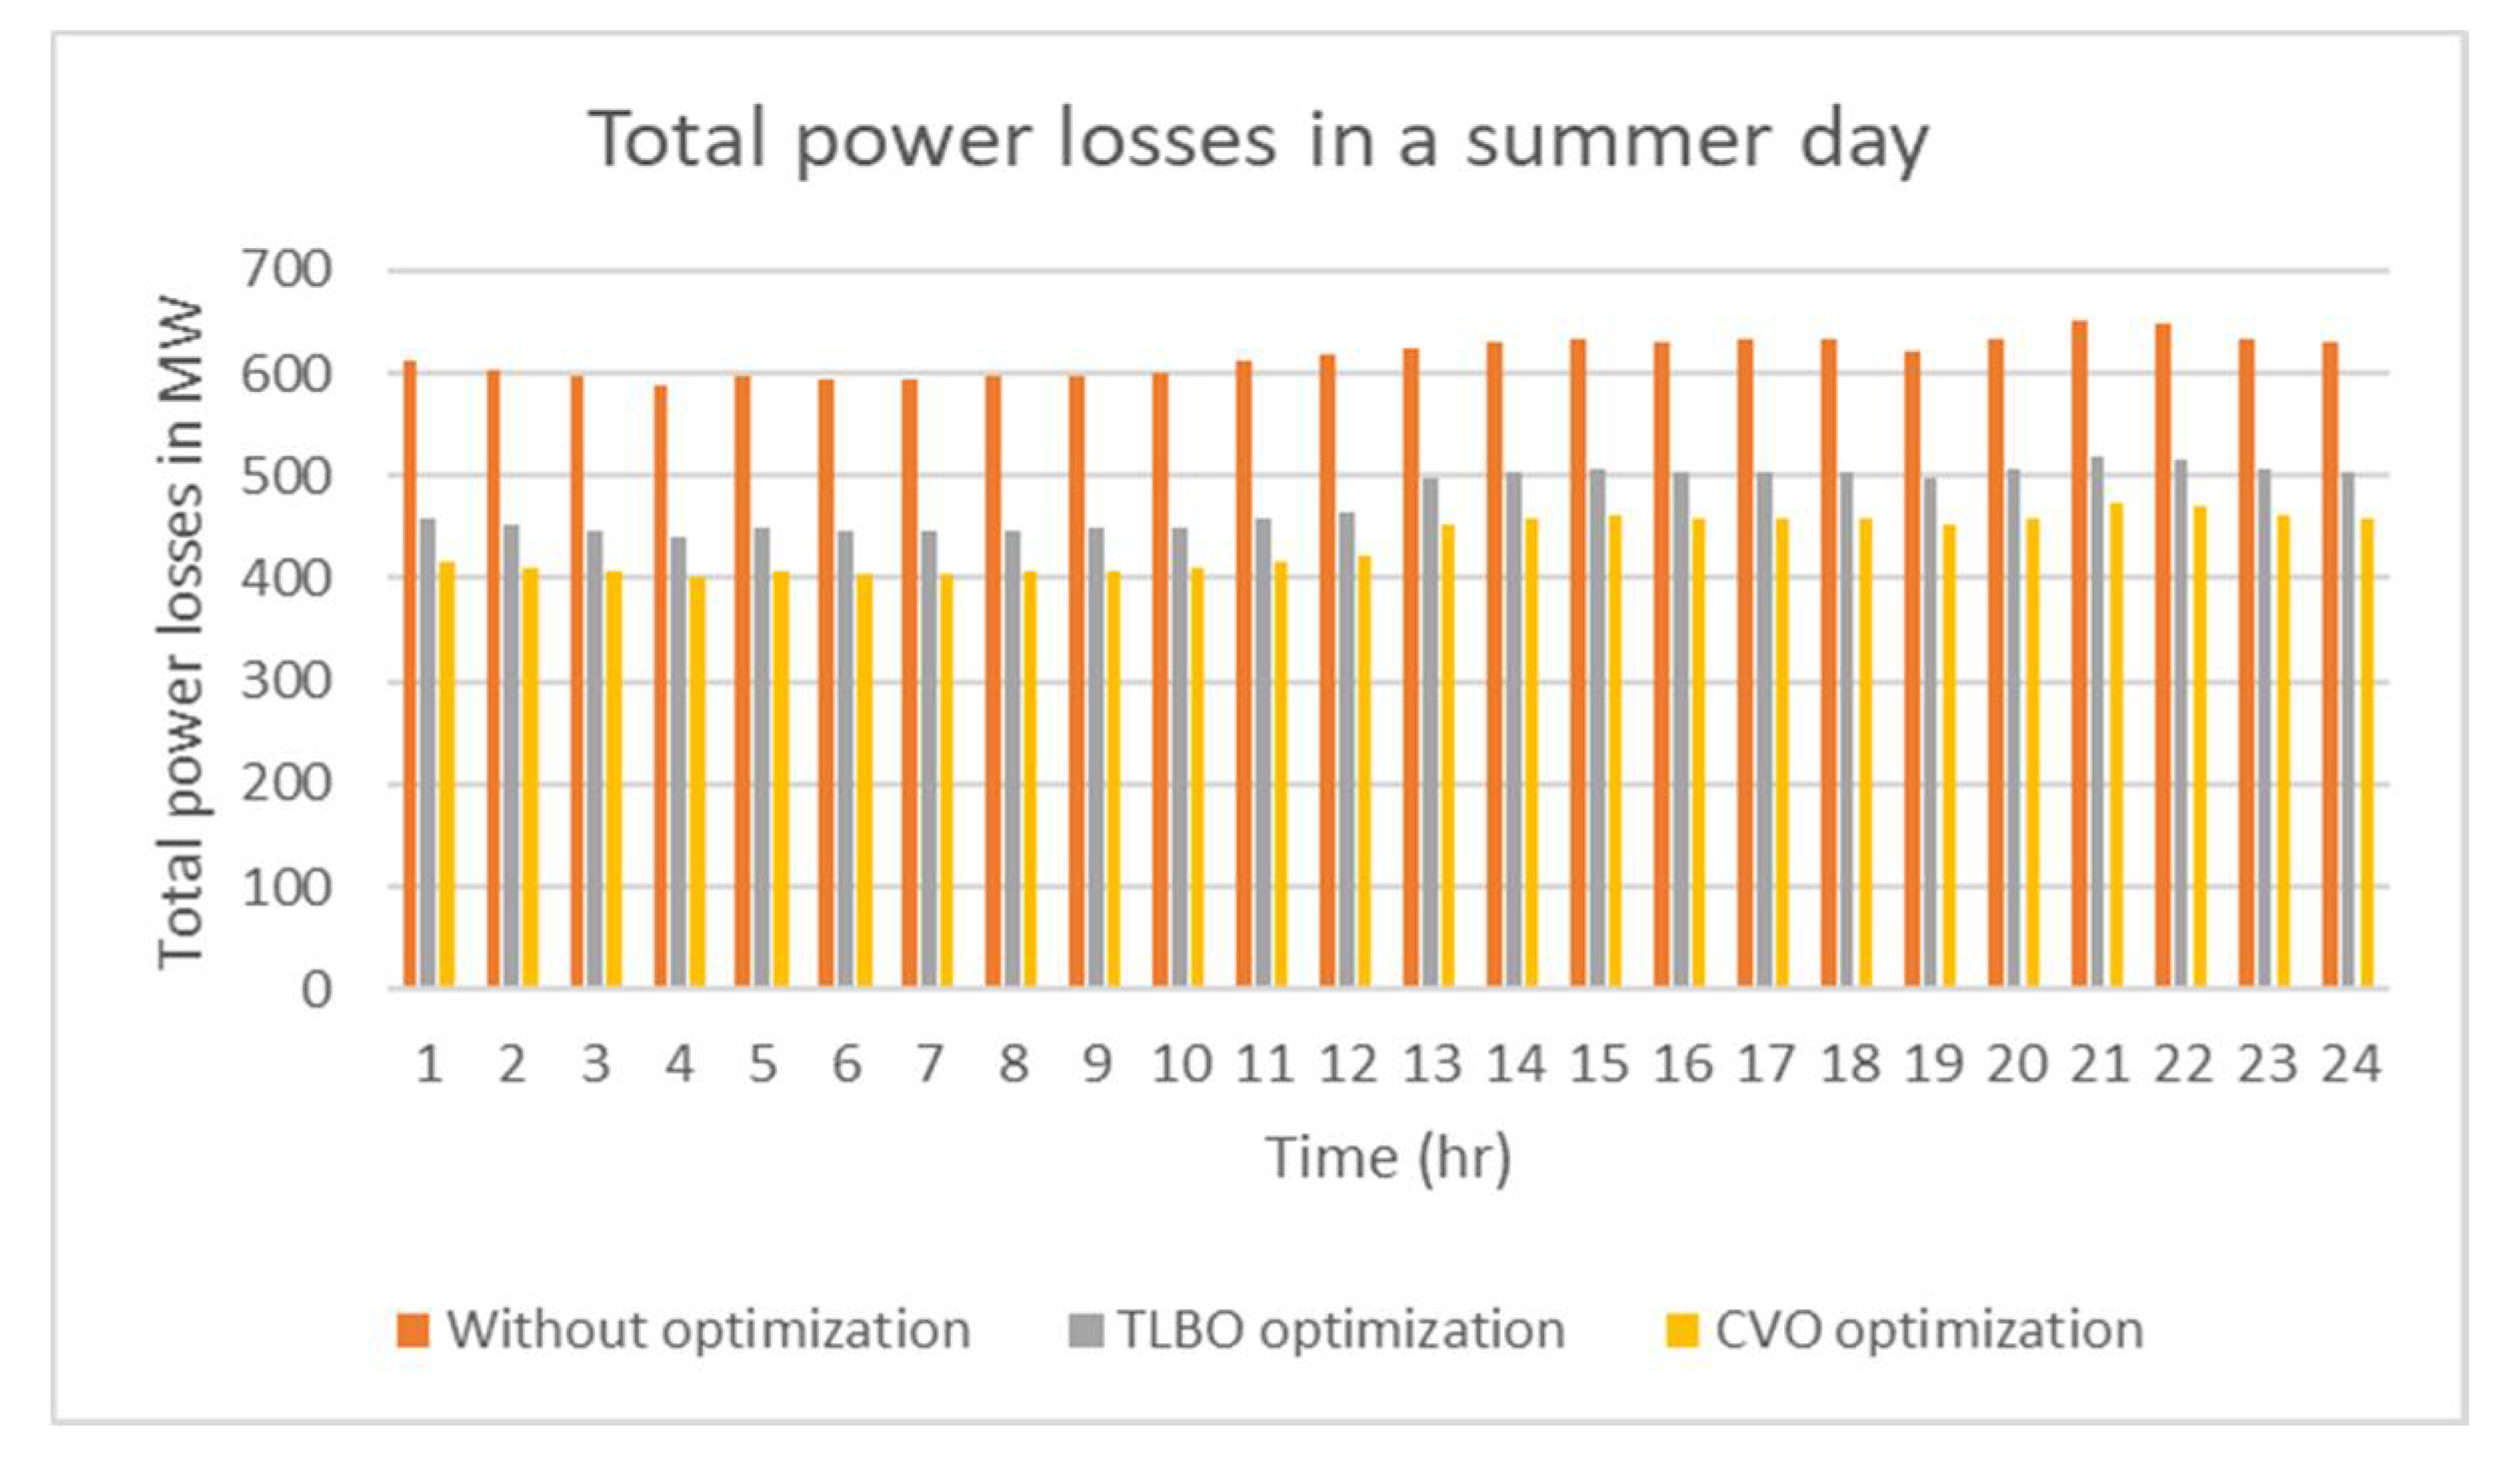
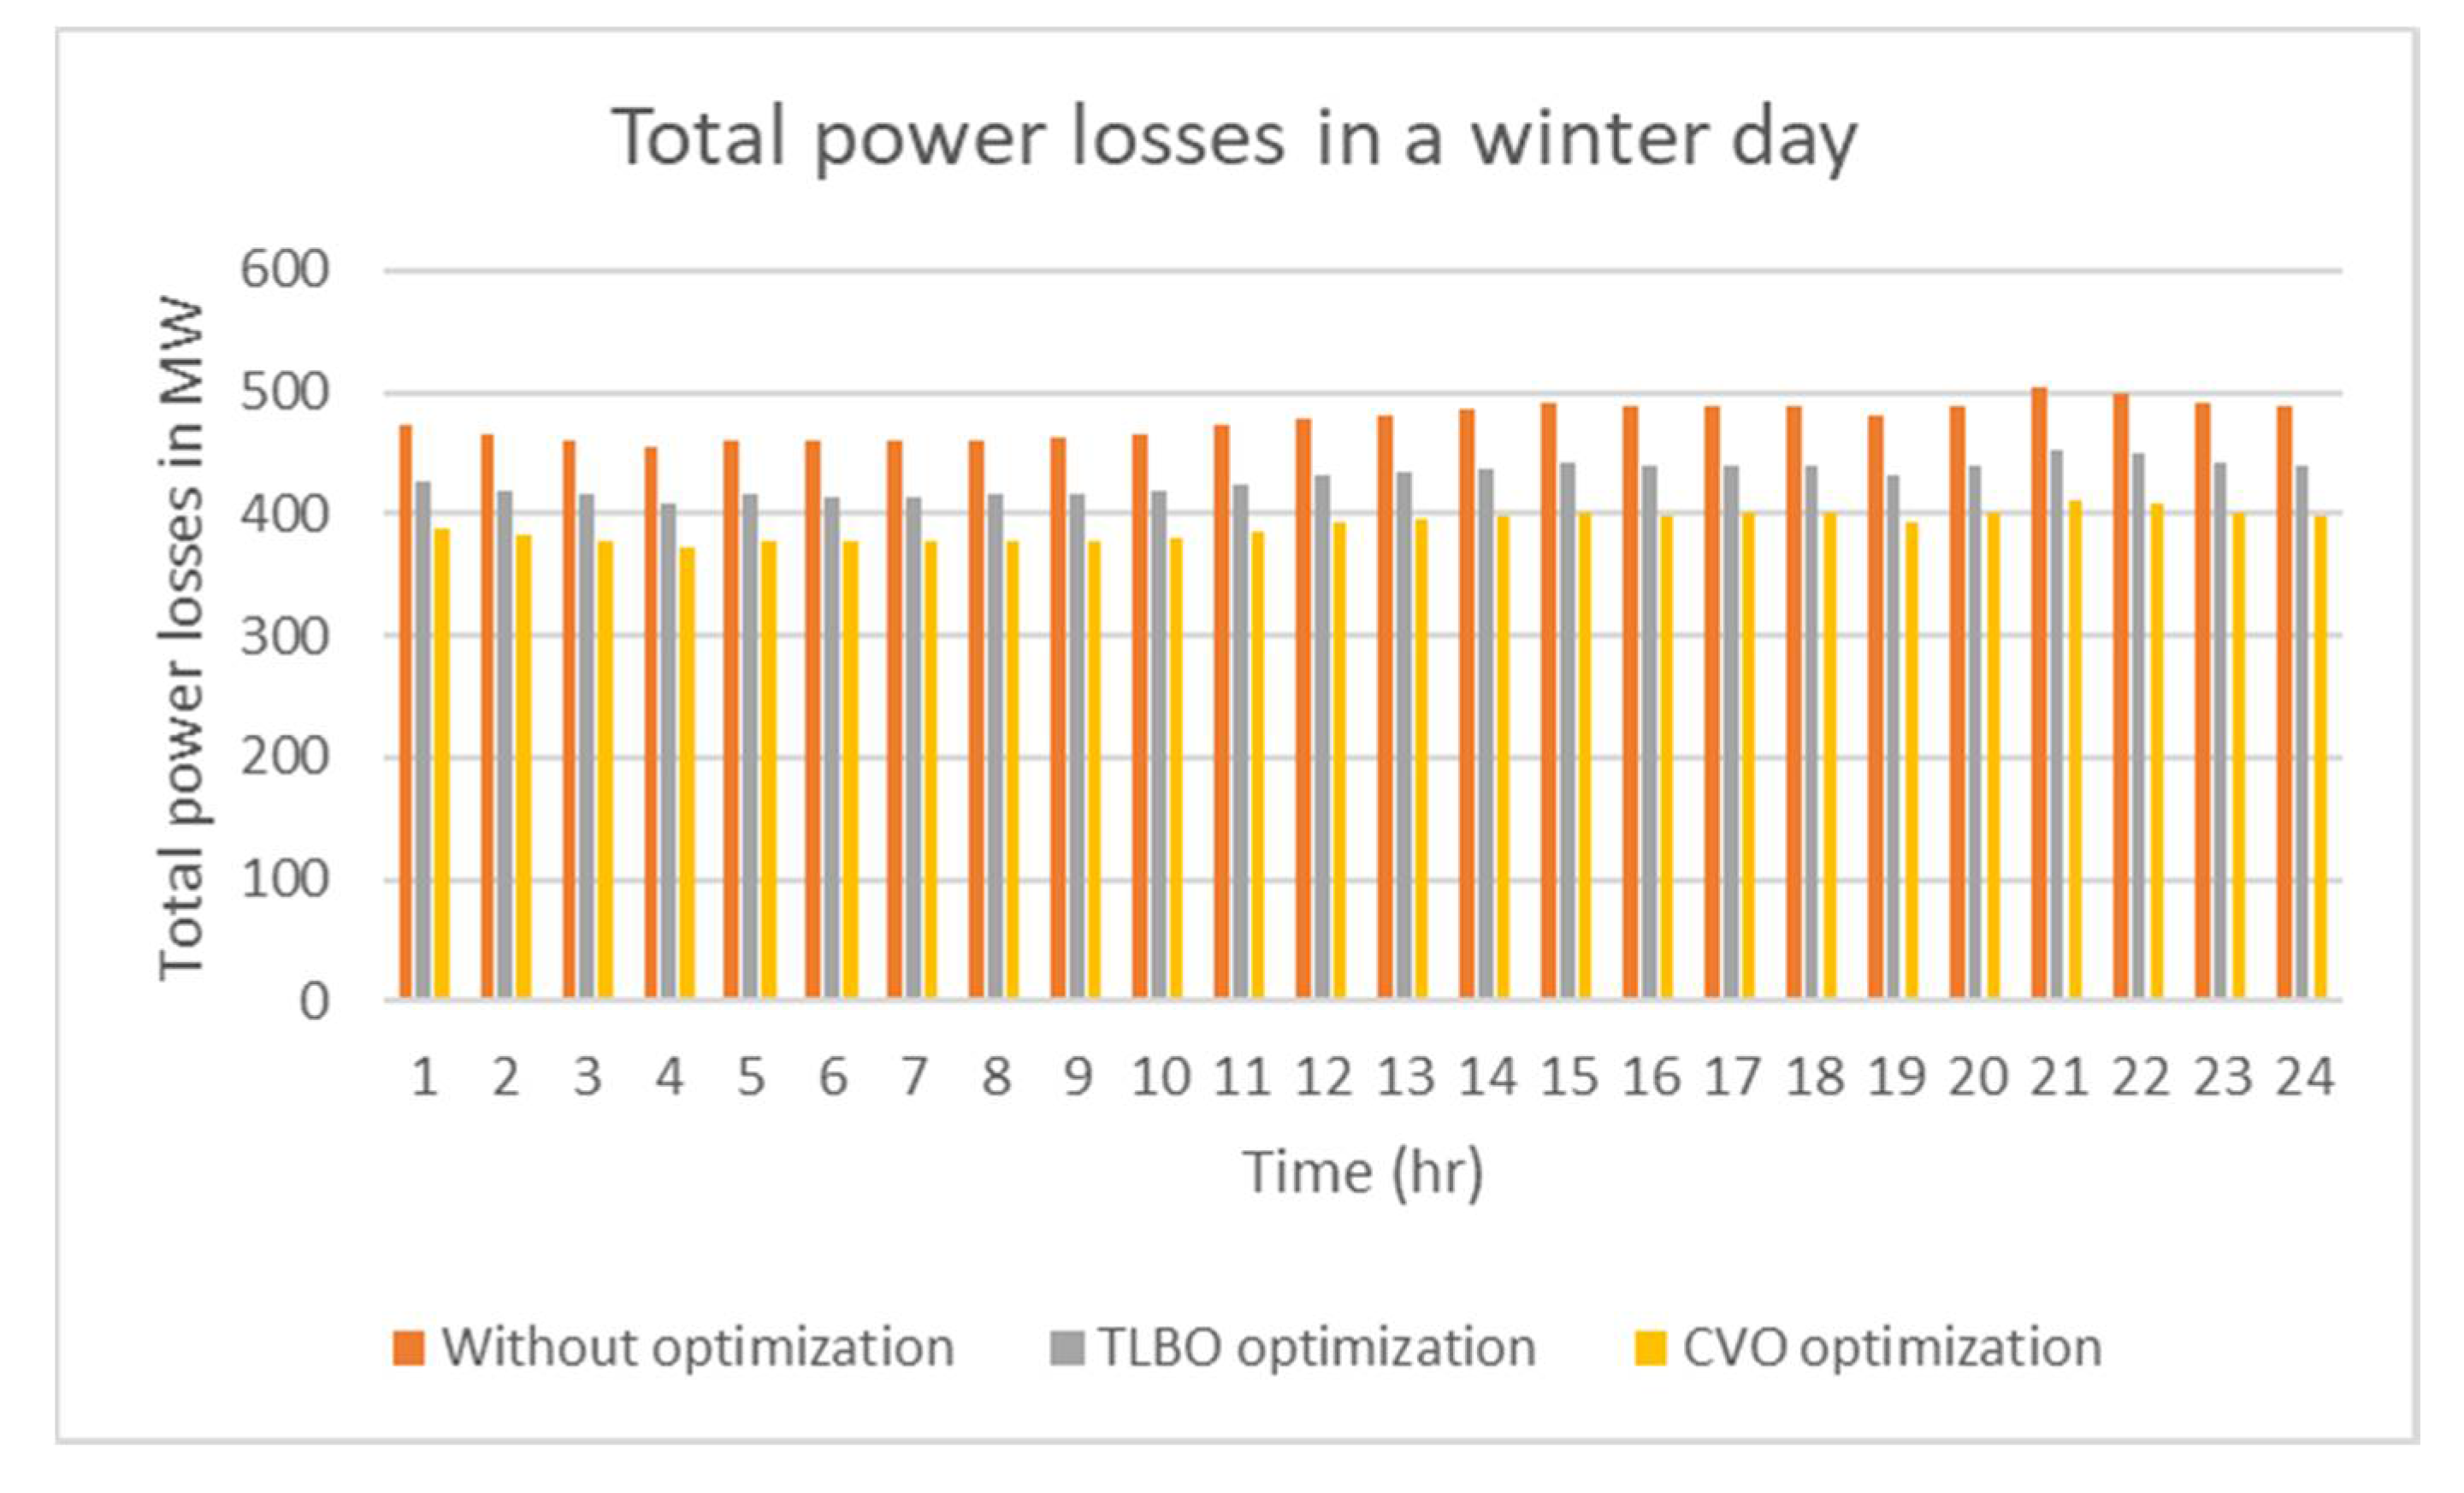
4.1.2. Minimization of Total Power Losses
4.1.3. Minimization of Voltage Deviation
- -
- Equality constraints (load flow equations)
- -
- Inequality constraints (limits)
- -
- Generation limits of each power station
- -
- Bus voltage magnitude level limits
- -
- Cables and transmission lines maximum loading.
- -
- Tap changing limits of each transformer
- -
- Capacitors limits
4.2. CVO Design
- CVO parameters are set with actual values for rates and probabilities, preventing the user from applying an additional study on the appropriate setup configuration.
- In CVO, the solution exploration can stop after several iterations, without an obligation to be configured.
- The high rate of COVID-19 spreading is useful for searching in promising regions more carefully, whereas the use of parallel draining confirms that all regions of the search space are consistently explored.
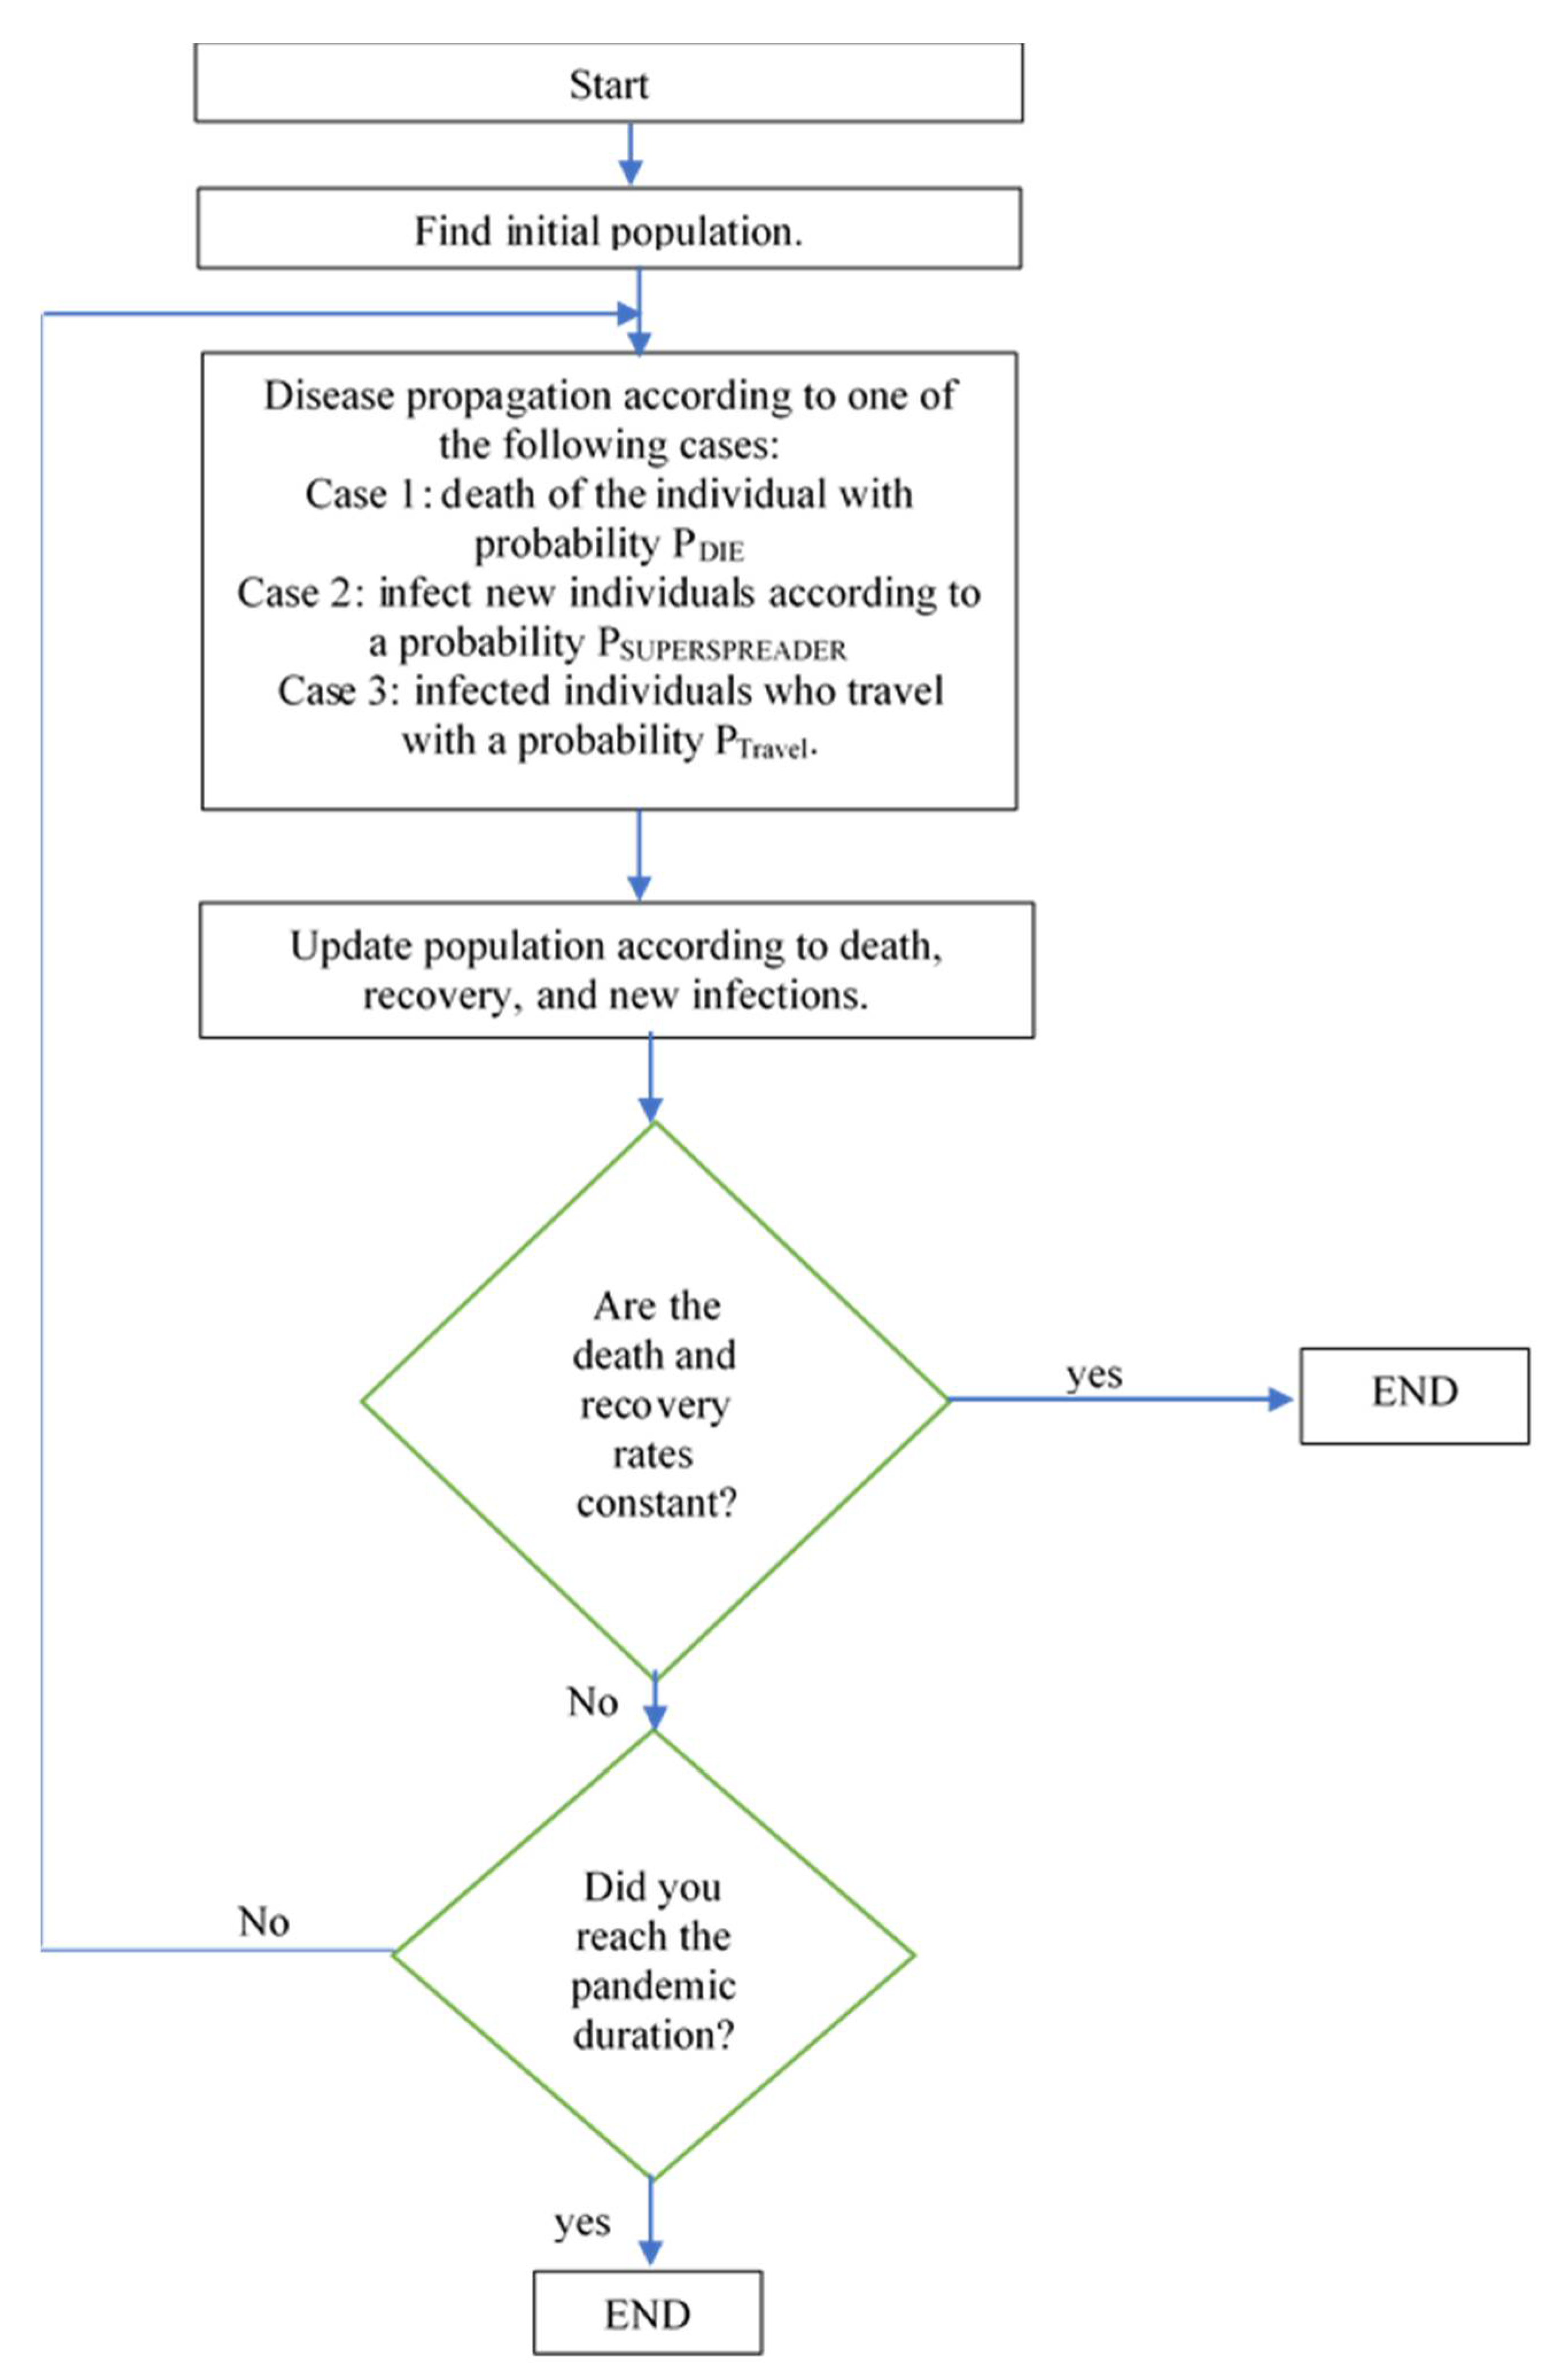
- (1)
- Case 1: each patient has a probability of dying (PDIE) according to the death rate of COVID-19. In this case, patients cannot infect other individuals.
- (2)
- Case 2: patient who is still alive has a probability to infect new individuals according to a probability PSUPERSPREADER. The PSUPERSPREADER is set according to two possibilities:
- (a)
- Ordinary: patient will infect new individuals according to a normal spread rate (RSpreading).
- (b)
- Super spreaders: patient will infect new individuals according to super spreading rate (RSuperspreading).
- (3)
- Case 3: patients either considered ordinary or super spreaders may travel. The patient will explore different solutions in the search space. The probability of the patient to travel (PTravel) and the rate to infect new individuals based on travelling scenario is RTravel.
- (1)
- Death, any individual who has died is recorded in the current population and will not be used furthermore.
- (2)
- Recovered, after each iteration, the recovered individuals are recorded in the recovered population. Any recovered individual has a probability of being re-infected again (PReinfected) at any coming iteration. The isolated individuals, if they are properly isolated will be added to the recovered population too with a probability (PIsolated)
- (3)
- New infected population which includes all the infected individuals of each iteration. It is possible that the new infected individuals are repeated in more than one iteration; the recommendation in this case is to remove the repeated new infection from the population before jumping to the next iteration.
5. Simulation Results
6. Discussions
7. Conclusions
Author Contributions
Funding
Institutional Review Board Statement
Informed Consent Statement
Data Availability Statement
Conflicts of Interest
References
- UN Sustainable Development Goals. Available online: https://sdgs.un.org/goals (accessed on 2 November 2021).
- Rogelj, J.; Den Elzen, M.; Höhne, N.; Fransen, T.; Fekete, H.; Winkler, H.; Schaeffer, R.; Sha, F.; Riahi, K.; Meinshausen, M. Paris Agreement climate proposals need a boost to keep warming well below 2 °C. Nature 2016, 534, 631–639. [Google Scholar] [CrossRef] [PubMed] [Green Version]
- Fayek, H.H. 5G Poor and Rich Novel Control Scheme Based Load Frequency Regulation of a Two-Area System with 100% Renewables in Africa. Fractal Fract. 2020, 5, 2. [Google Scholar] [CrossRef]
- Fayek, H.H.; Abdalla, O.H. Maximization of Renewable Power Generation for Optimal Operation of the Egyptian Grid. In Proceedings of the 2020 IEEE 29th International Symposium on Industrial Electronics (ISIE), Delft, The Netherlands, 17–19 June 2020; pp. 1033–1038. [Google Scholar] [CrossRef]
- International Trade Administration. Available online: https://www.trade.gov/knowledge-product/egypt-renewable-energy (accessed on 2 November 2021).
- Abdalla, H.O.; Fayek, H.H.; Ghany, A.M.A. Secondary Voltage Control Application in a Smart Grid with 100% Renewables. Inventions 2020, 5, 37. [Google Scholar] [CrossRef]
- Agora Integrating Renewables into the Japanese Power Grid by 2030; Report; Japan’s Renewable Energy Institute: Tokyo, Japan, 2018. Available online: https://www.renewable-ei.org/pdfdownload/activities/REI_Agora_Japan_grid_study_FullReport_EN_WEB.pdf (accessed on 2 November 2021).
- Kalloe, N.; Bos, J.; Torres, J.R.; van der Meijden, M.; Palensky, P. A Fundamental Study on the Transient Stability of Power Systems with High Shares of Solar PV Plants. Electricity 2020, 1, 62–86. [Google Scholar] [CrossRef]
- Papaefthymiou, G.; Dragoon, K. Towards 100% renewable energy systems: Uncapping power system flexibility. Energy Policy 2016, 92, 69–82. [Google Scholar] [CrossRef]
- Cosic, B.; Krajacic, G.; Duic, N. A 100% renewable energy system in the year 2050: The case of Macedonia. Energy 2012, 48, 80–87. [Google Scholar] [CrossRef] [Green Version]
- Mikkola, J.; Lund, P. Modeling flexibility and optimal use of existing power plants with large-scale variable renewable power schemes. Energy 2016, 112, 364–375. [Google Scholar] [CrossRef]
- International Renewable Energy Agency (IRENA). Innovative Solutions for 100% Renewable Power in Sweden Report. Available online: https://www.irena.org/publications/2020/Jan/Innovative-solutions-for-100-percent-renewable-power-in-Sweden (accessed on 8 November 2021).
- Doepfert, M.; Castro, R. Techno-economic optimization of a 100% renewable energy system in 2050 for countries with high shares of hydropower: The case of Portugal. Renew. Energy 2021, 165, 491–503. [Google Scholar] [CrossRef]
- de Simón-Martín, M.; de la Puente-Gil, Á.; Borge-Diez, D.; Ciria-Garcés, T.; González-Martínez, A. Wind energy planning for a sustainable transition to a decarbonized generation scenario based on the opportunity cost of the wind energy: Spanish Iberian Peninsula as case study. Energy Procedia 2019, 157, 1144–1163. [Google Scholar] [CrossRef]
- el Río, P.; Silvosa, A.C.; Gómez, G.I. Policies and design elements for the repowering of wind farms: A qualitative analysis of different options. Energy Policy 2011, 39, 1897–1908. [Google Scholar] [CrossRef]
- Wu, J.; Guo, S.; Huang, H.; Liu, W.; Xiang, Y. Information and Communications Technologies for Sustainable Development Goals: State-of-the-Art, Needs and Perspectives. IEEE Commun. Surv. Tutor. 2018, 20, 2389–2406. [Google Scholar] [CrossRef] [Green Version]
- Nikolova, S.; Causevski, A.; Al-Salaymeh, A. Optimal operation of conventional power plants in power system with integrated renewable energy sources. Energy Convers. Manag. 2013, 65, 697–703. [Google Scholar] [CrossRef]
- Abdalla, O.H.; Fayek, H.H.; Abdel Ghany, A.G. Secondary and Tertiary Voltage Control of a Multi-Region Power System. Electricity 2020, 1, 37–59. [Google Scholar] [CrossRef]
- Ghoshal, S.P. Optimizations of PID gains by particle swarm optimizations in fuzzy based automatic generation control. Electr. Power Syst. Res. 2004, 72, 203–212. [Google Scholar] [CrossRef]
- Rao, R.V.; Savsani, V.J.; Vakharia, D.P. Teaching-Learning Based Optimization: A Novel Optimization Method for Continuous Non-Linear Large Scale Problems. Inf. Sci. J. 2012, 183, 1–15. [Google Scholar] [CrossRef]
- Martínez-Álvarez, F.; Asencio-Cortés, G.; Torres, J.F.; Gutiérrez-Avilés, D.; Melgar-García, L.; Pérez-Chacón, R.; Rubio-Escudero, C.; Riquelme, J.C.; Troncoso, A. Coronavirus Optimization Algorithm: A bioinspired metaheuristic based on the COVID-19 propagation model. Big Data 2020, 8, 308–322. [Google Scholar] [CrossRef]
- Abdalla, O.H.; Ghany, A.M.A.; Fayek, H.H. Development of a digital model of the Egyptian power grid for steady-state and transient studies. In Proceedings of the 11th International Conference on Electrical Engineering (ICEENG-11), Cairo, Egypt, 3–5 April 2018. Paper No 83-EPS. [Google Scholar]
- Abdalla, O.H.; Fayek, H.H.; Ghany, A.A. Steady-State and Transient Performances of the Egyptian Grid with Benban Photovoltaic Park. In Proceedings of the Cigre Egypt 2019 Conference, The Future of Electricity Grids—Challenges and Opportunities, Cairo, Egypt, 6–8 March 2019. Paper No. 205. [Google Scholar]
- Shaltout, M.M.; Hassan, A.H.; Fathy, A.M. Total suspended particles and solar radiation over Cairo and Aswan. Renew. Energy 2001, 23, 605–619. [Google Scholar] [CrossRef] [Green Version]
- New and Renewable Energy Authority (NREA)—EcoConServ Environmental Solutions. Benban 1.8 GW PV Solar Park, Egypt Strategic Environmental & Social Assessment: Final Report. 2016, pp. 1–210. Available online: http://www.eib.org/attachments/registers/65771943.pdf (accessed on 9 November 2021).
- EgyptEra. Solar Energy Grid Connection Code; Egyptian Electric Utility and Consumer Protection Regulatory Authority, EgyptEra: Cairo, Egypt, 2021; Available online: http://www.egyptera.org (accessed on 10 November 2021).
- Abdalla, O.H. Technical Requirements for Connecting Medium and Large Solar Power Plants to Electricity Networks in Egypt. J. Egypt. Soc. Eng. 2018, 57, 25–36. [Google Scholar]
- Overseas Private Investment Corporation (OPIC). Available online: https://www3.opic.gov/Environment/EIA/lekelaboo/Main_ESIA.pdf (accessed on 1 November 2021).
- PowerFactory DIgSILENT GmbH. Available online: http://www.digsilent.de (accessed on 2 November 2021).
- World Meter. Available online: https://www.worldometers.info/ (accessed on 10 February 2021).
- Saffari, A.; Khishe, M. Classification of Marine Mammals Using Trained Multilayer Perceptron Neural Network with Whale Algorithm Developed with Fuzzy System. 2020. Available online: https://www.researchsquare.com/article/rs-122787/v1 (accessed on 31 December 2021).
- LMajdoubi, O.; Abdoun, F.; Abdoun, O. A New Optimized Approach to Resolve a Combinatorial Problem: CoronaVirus Optimization Algorithm and Self-organizing Maps. In Digital Technologies and Applications. ICDTA 2021. Lecture Notes in Networks and Systems; Motahhir, S., Bossoufi, B., Eds.; Springer: Cham, Switzerland, 2021; Volume 211. [Google Scholar] [CrossRef]
- Li, Y.; Han, M.; Yang, Z.; Li, G. Coordinating Flexible Demand Reponse and Renewable Uncertainties for Scheduling of Community Integrated Energy Systems with an Electric Vehicle Charging Station: A Bi-Level Approach. IEEE Trans. Sustain. Energy 2021, 12, 2321–2331. [Google Scholar] [CrossRef]
- Li, Y.; Yang, Z.; Li, G.; Zhao, D.; Tian, W. Optimal Scheduling of an Isolated Microgrid with Battery Storage Considering Load and Renewable Generation Uncertainties. IEEE Trans. Ind. Electron. 2019, 66, 1565–1575. [Google Scholar] [CrossRef] [Green Version]


| Time (h) | Total Load (MW) | Solar Radiation (W/m2) | Wind Speed (m/s) |
|---|---|---|---|
| 0 | 29,184 | 0 | 5.5 |
| 1 | 28,799 | 0 | 5.1 |
| 2 | 27,904 | 0 | 4.6 |
| 3 | 27,396 | 0 | 4.0 |
| 4 | 26,728 | 0 | 4.2 |
| 5 | 25,949 | 0 | 4.3 |
| 6 | 25,208 | 14 | 4.8 |
| 7 | 25,329 | 63 | 4.4 |
| 8 | 26,086 | 172 | 4.3 |
| 9 | 28,170 | 395 | 4.1 |
| 10 | 29,147 | 653 | 4.3 |
| 11 | 29,512 | 849 | 4.5 |
| 12 | 30,250 | 979 | 4.8 |
| 13 | 30,476 | 1020 | 4.9 |
| 14 | 30,830 | 978 | 5.3 |
| 15 | 30,546 | 856 | 6.2 |
| 16 | 30,654 | 663 | 7.1 |
| 17 | 30,613 | 417 | 7.9 |
| 18 | 30,190 | 184 | 8.2 |
| 19 | 30,746 | 49 | 8.6 |
| 20 | 31,751 | 2 | 7.5 |
| 21 | 31,348 | 0 | 6.8 |
| 22 | 30,829 | 0 | 5.9 |
| 23 | 30,558 | 0 | 5.6 |
| Time (h) | Total Load (MW) | Solar Radiation (W/m2) | Wind Speed(m/s) |
|---|---|---|---|
| 0 | 18,313 | 0 | 3.8 |
| 1 | 17,210 | 0 | 3.9 |
| 2 | 16,376 | 0 | 3.8 |
| 3 | 15,672 | 0 | 3.9 |
| 4 | 15,268 | 0 | 4.0 |
| 5 | 15,184 | 0 | 3.9 |
| 6 | 16,057 | 24 | 3.9 |
| 7 | 17,261 | 72 | 4.0 |
| 8 | 18,035 | 271 | 4.5 |
| 9 | 19,130 | 608 | 5.0 |
| 10 | 19,975 | 718 | 5.2 |
| 11 | 20,494 | 623 | 5.4 |
| 12 | 20,920 | 491 | 6.0 |
| 13 | 21,113 | 554 | 6.3 |
| 14 | 21,375 | 112 | 6.4 |
| 15 | 21,763 | 45 | 6.6 |
| 16 | 21,984 | 8 | 6.5 |
| 17 | 22,297 | 1 | 6.4 |
| 18 | 24,588 | 0 | 6.2 |
| 19 | 24,154 | 0 | 5.8 |
| 20 | 23,456 | 0 | 5.2 |
| 21 | 22,688 | 0 | 4.7 |
| 22 | 21,733 | 0 | 4.4 |
| 23 | 20,592 | 0 | 4.1 |
| Winter Day | |
|---|---|
| Renewable energy share | 38% |
| Power losses | 10% |
| Voltage deviation | 14% |
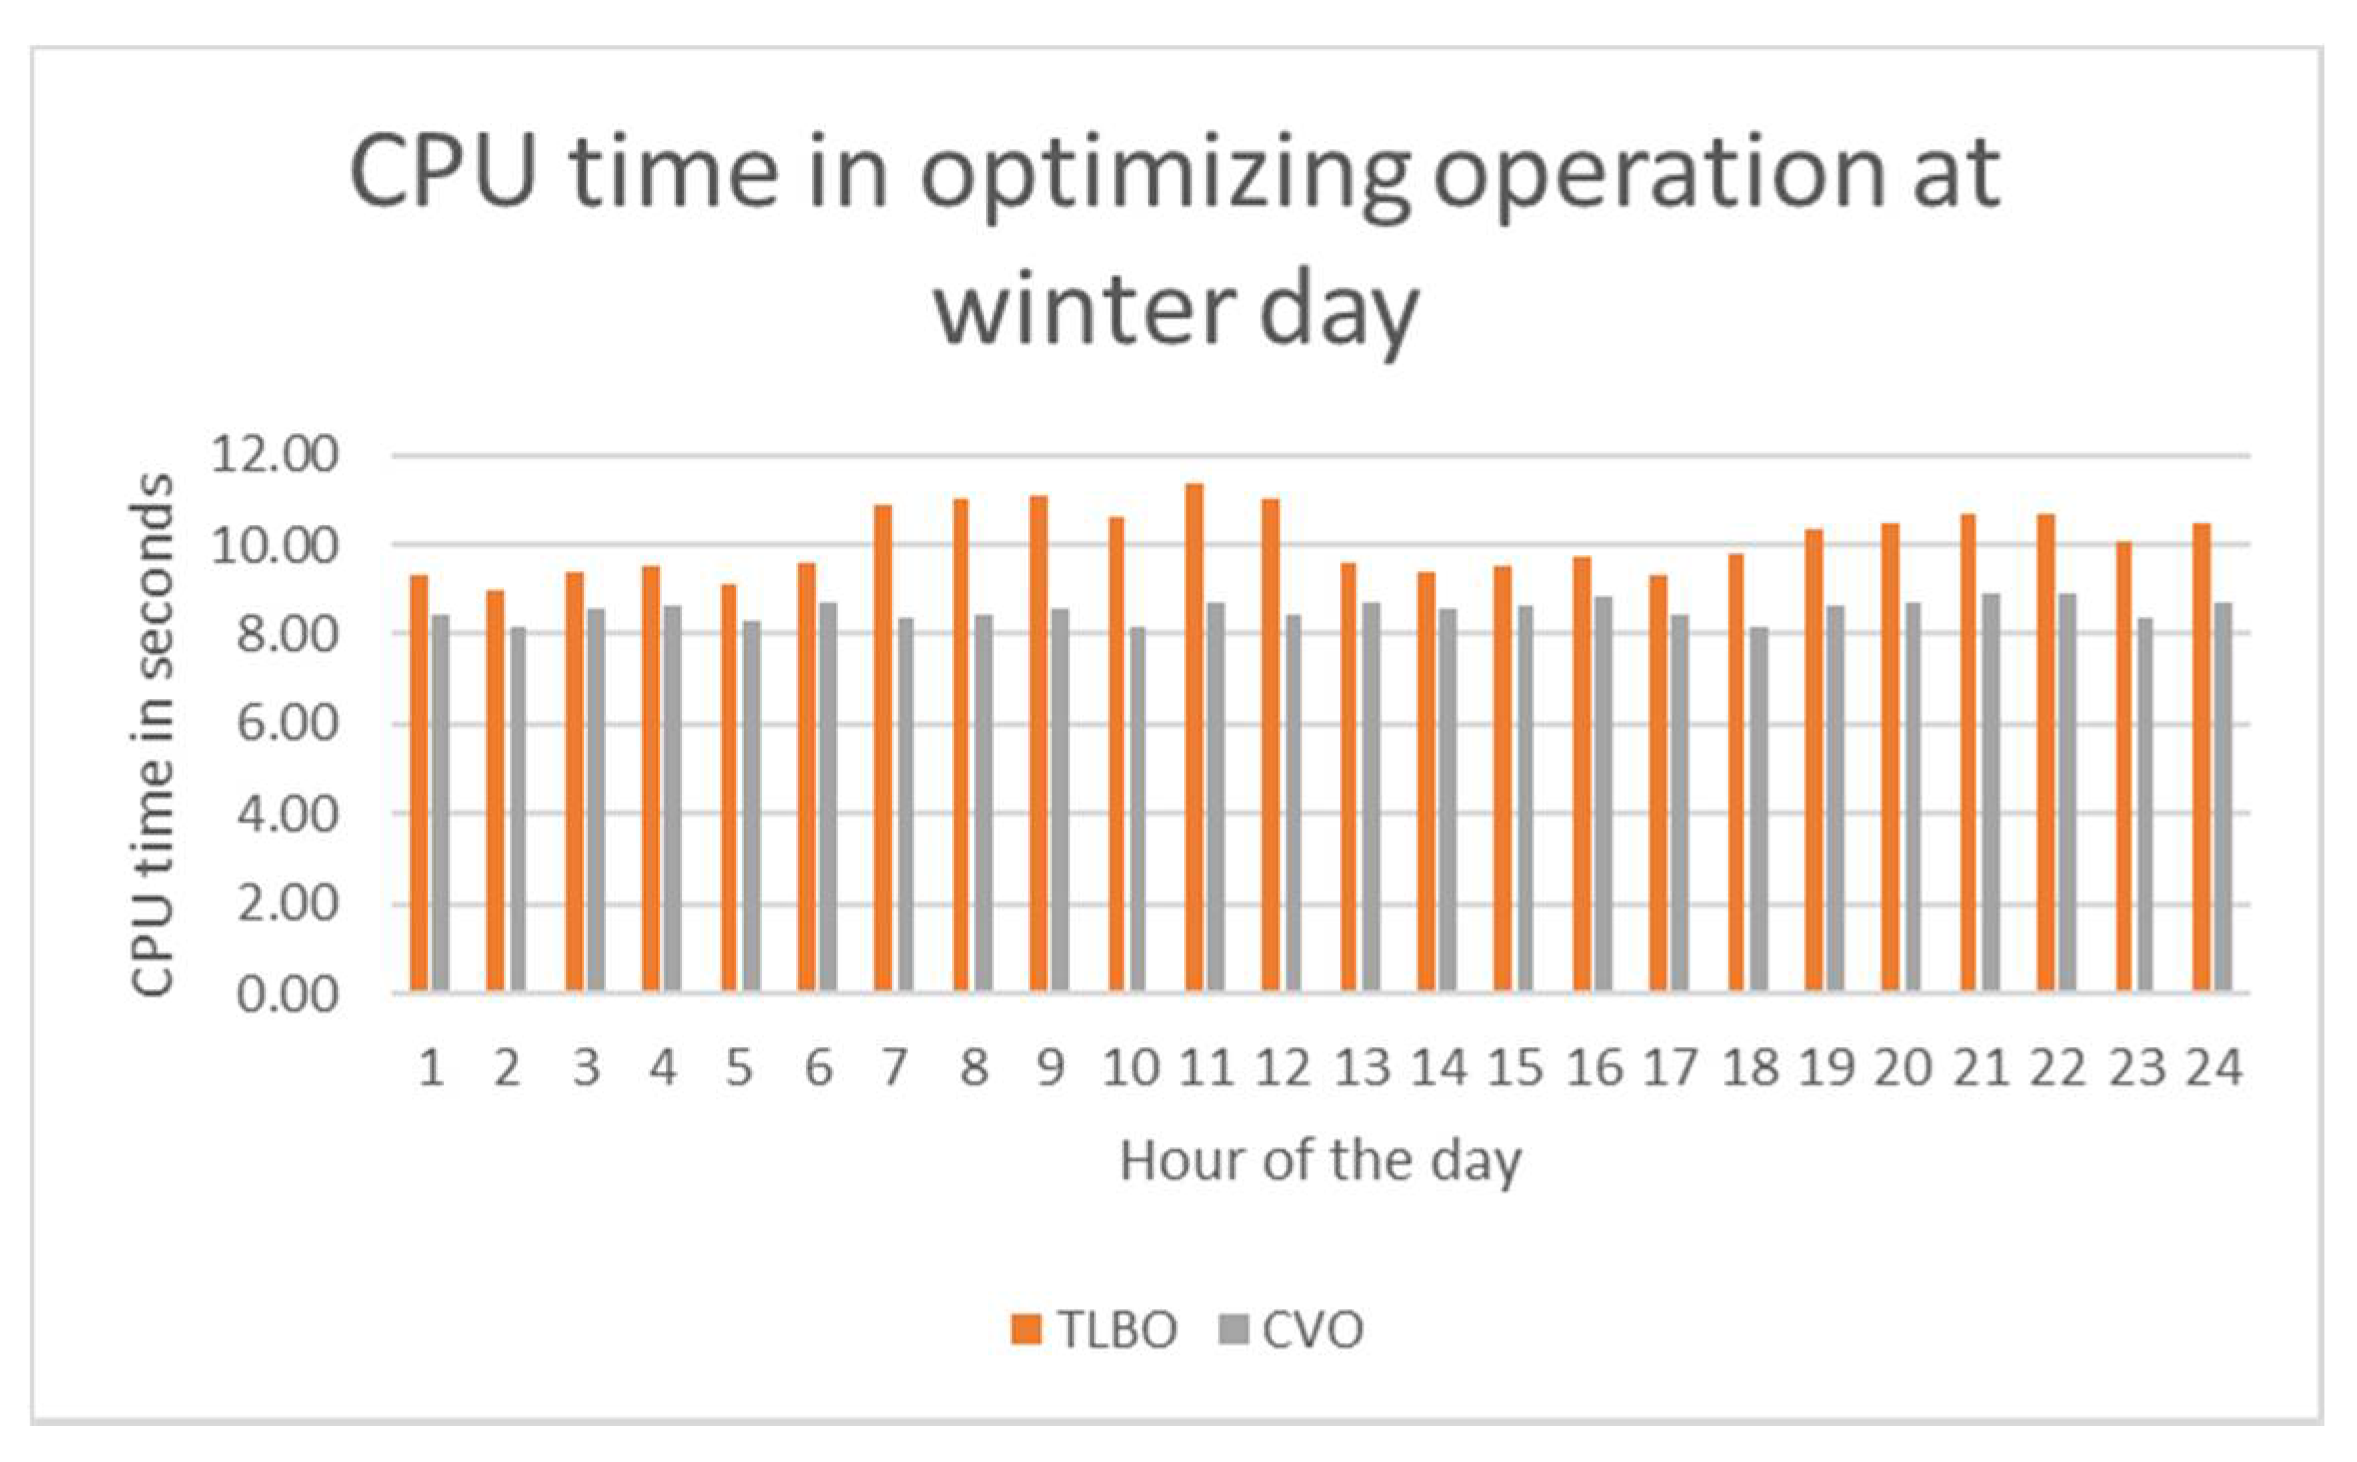
| CPU time | 11% |
| Summer Day | |
| Renewable energy share | 40% |
| Power losses | 20% |
| Voltage deviation | 13% |
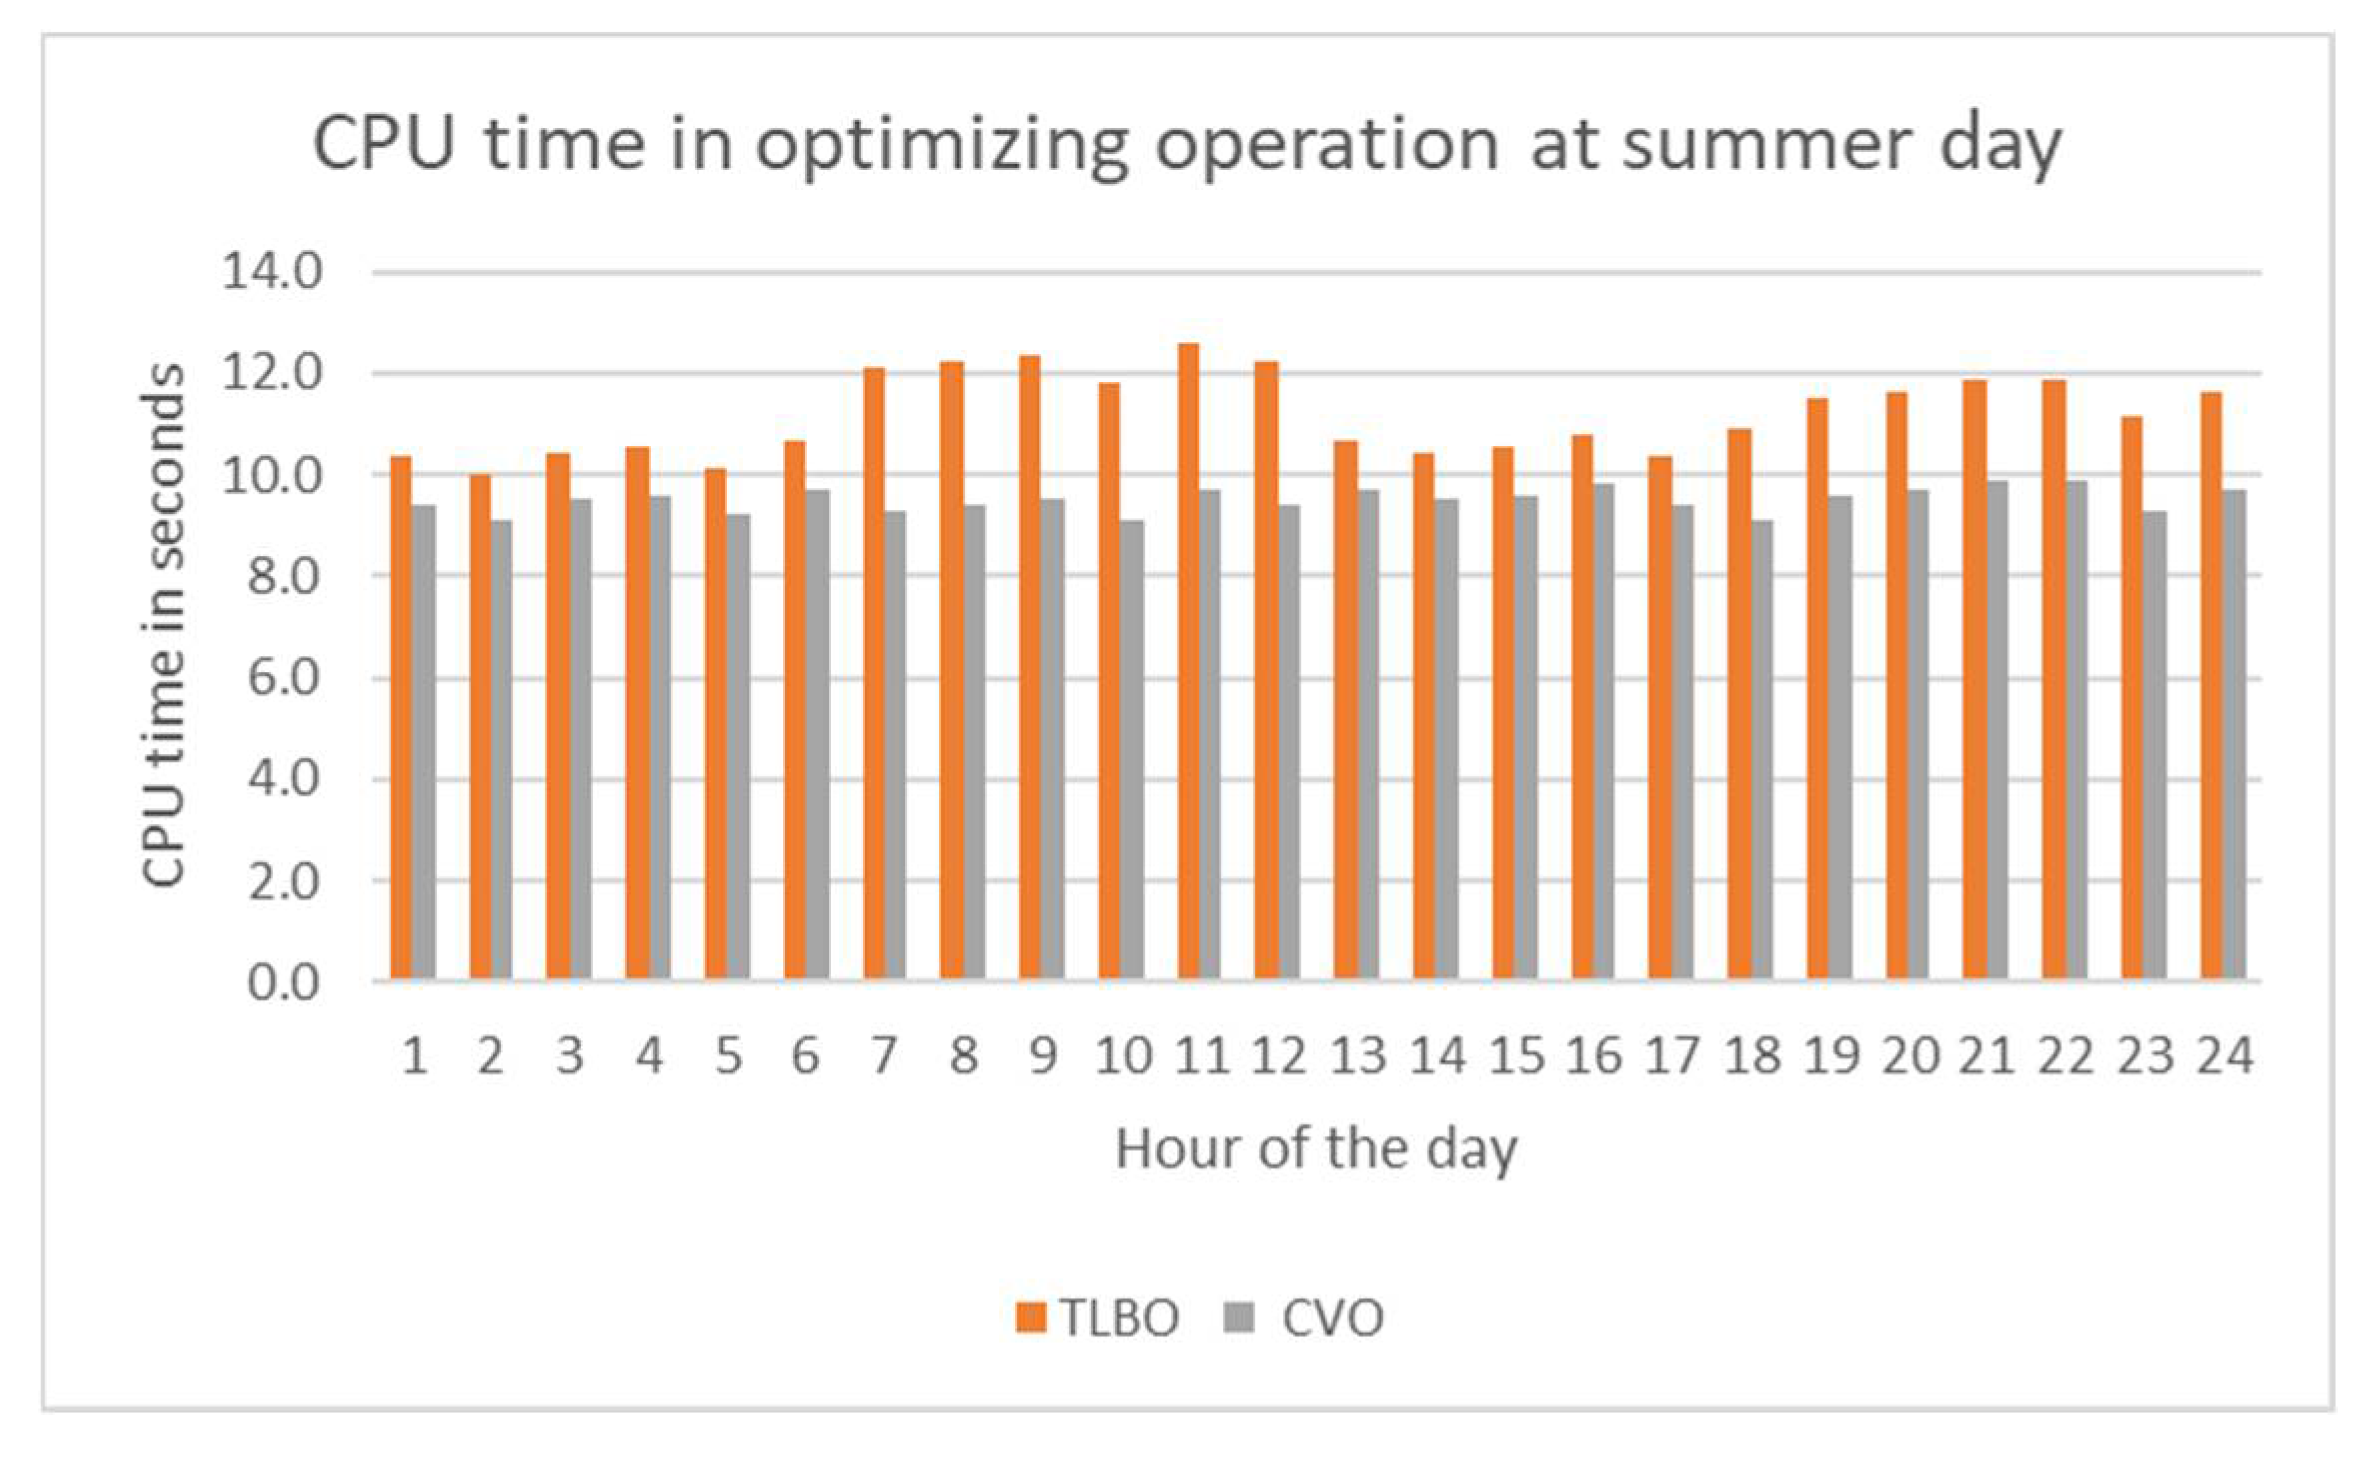
| CPU time | 9% |
Publisher’s Note: MDPI stays neutral with regard to jurisdictional claims in published maps and institutional affiliations. |
© 2022 by the authors. Licensee MDPI, Basel, Switzerland. This article is an open access article distributed under the terms and conditions of the Creative Commons Attribution (CC BY) license (https://creativecommons.org/licenses/by/4.0/).
Share and Cite
Fayek, H.H.; Abdalla, O.H. Operation of the Egyptian Power Grid with Maximum Penetration Level of Renewable Energies Using Corona Virus Optimization Algorithm. Smart Cities 2022, 5, 34-53. https://doi.org/10.3390/smartcities5010003
Fayek HH, Abdalla OH. Operation of the Egyptian Power Grid with Maximum Penetration Level of Renewable Energies Using Corona Virus Optimization Algorithm. Smart Cities. 2022; 5(1):34-53. https://doi.org/10.3390/smartcities5010003
Chicago/Turabian StyleFayek, Hady H., and Omar H. Abdalla. 2022. "Operation of the Egyptian Power Grid with Maximum Penetration Level of Renewable Energies Using Corona Virus Optimization Algorithm" Smart Cities 5, no. 1: 34-53. https://doi.org/10.3390/smartcities5010003
APA StyleFayek, H. H., & Abdalla, O. H. (2022). Operation of the Egyptian Power Grid with Maximum Penetration Level of Renewable Energies Using Corona Virus Optimization Algorithm. Smart Cities, 5(1), 34-53. https://doi.org/10.3390/smartcities5010003