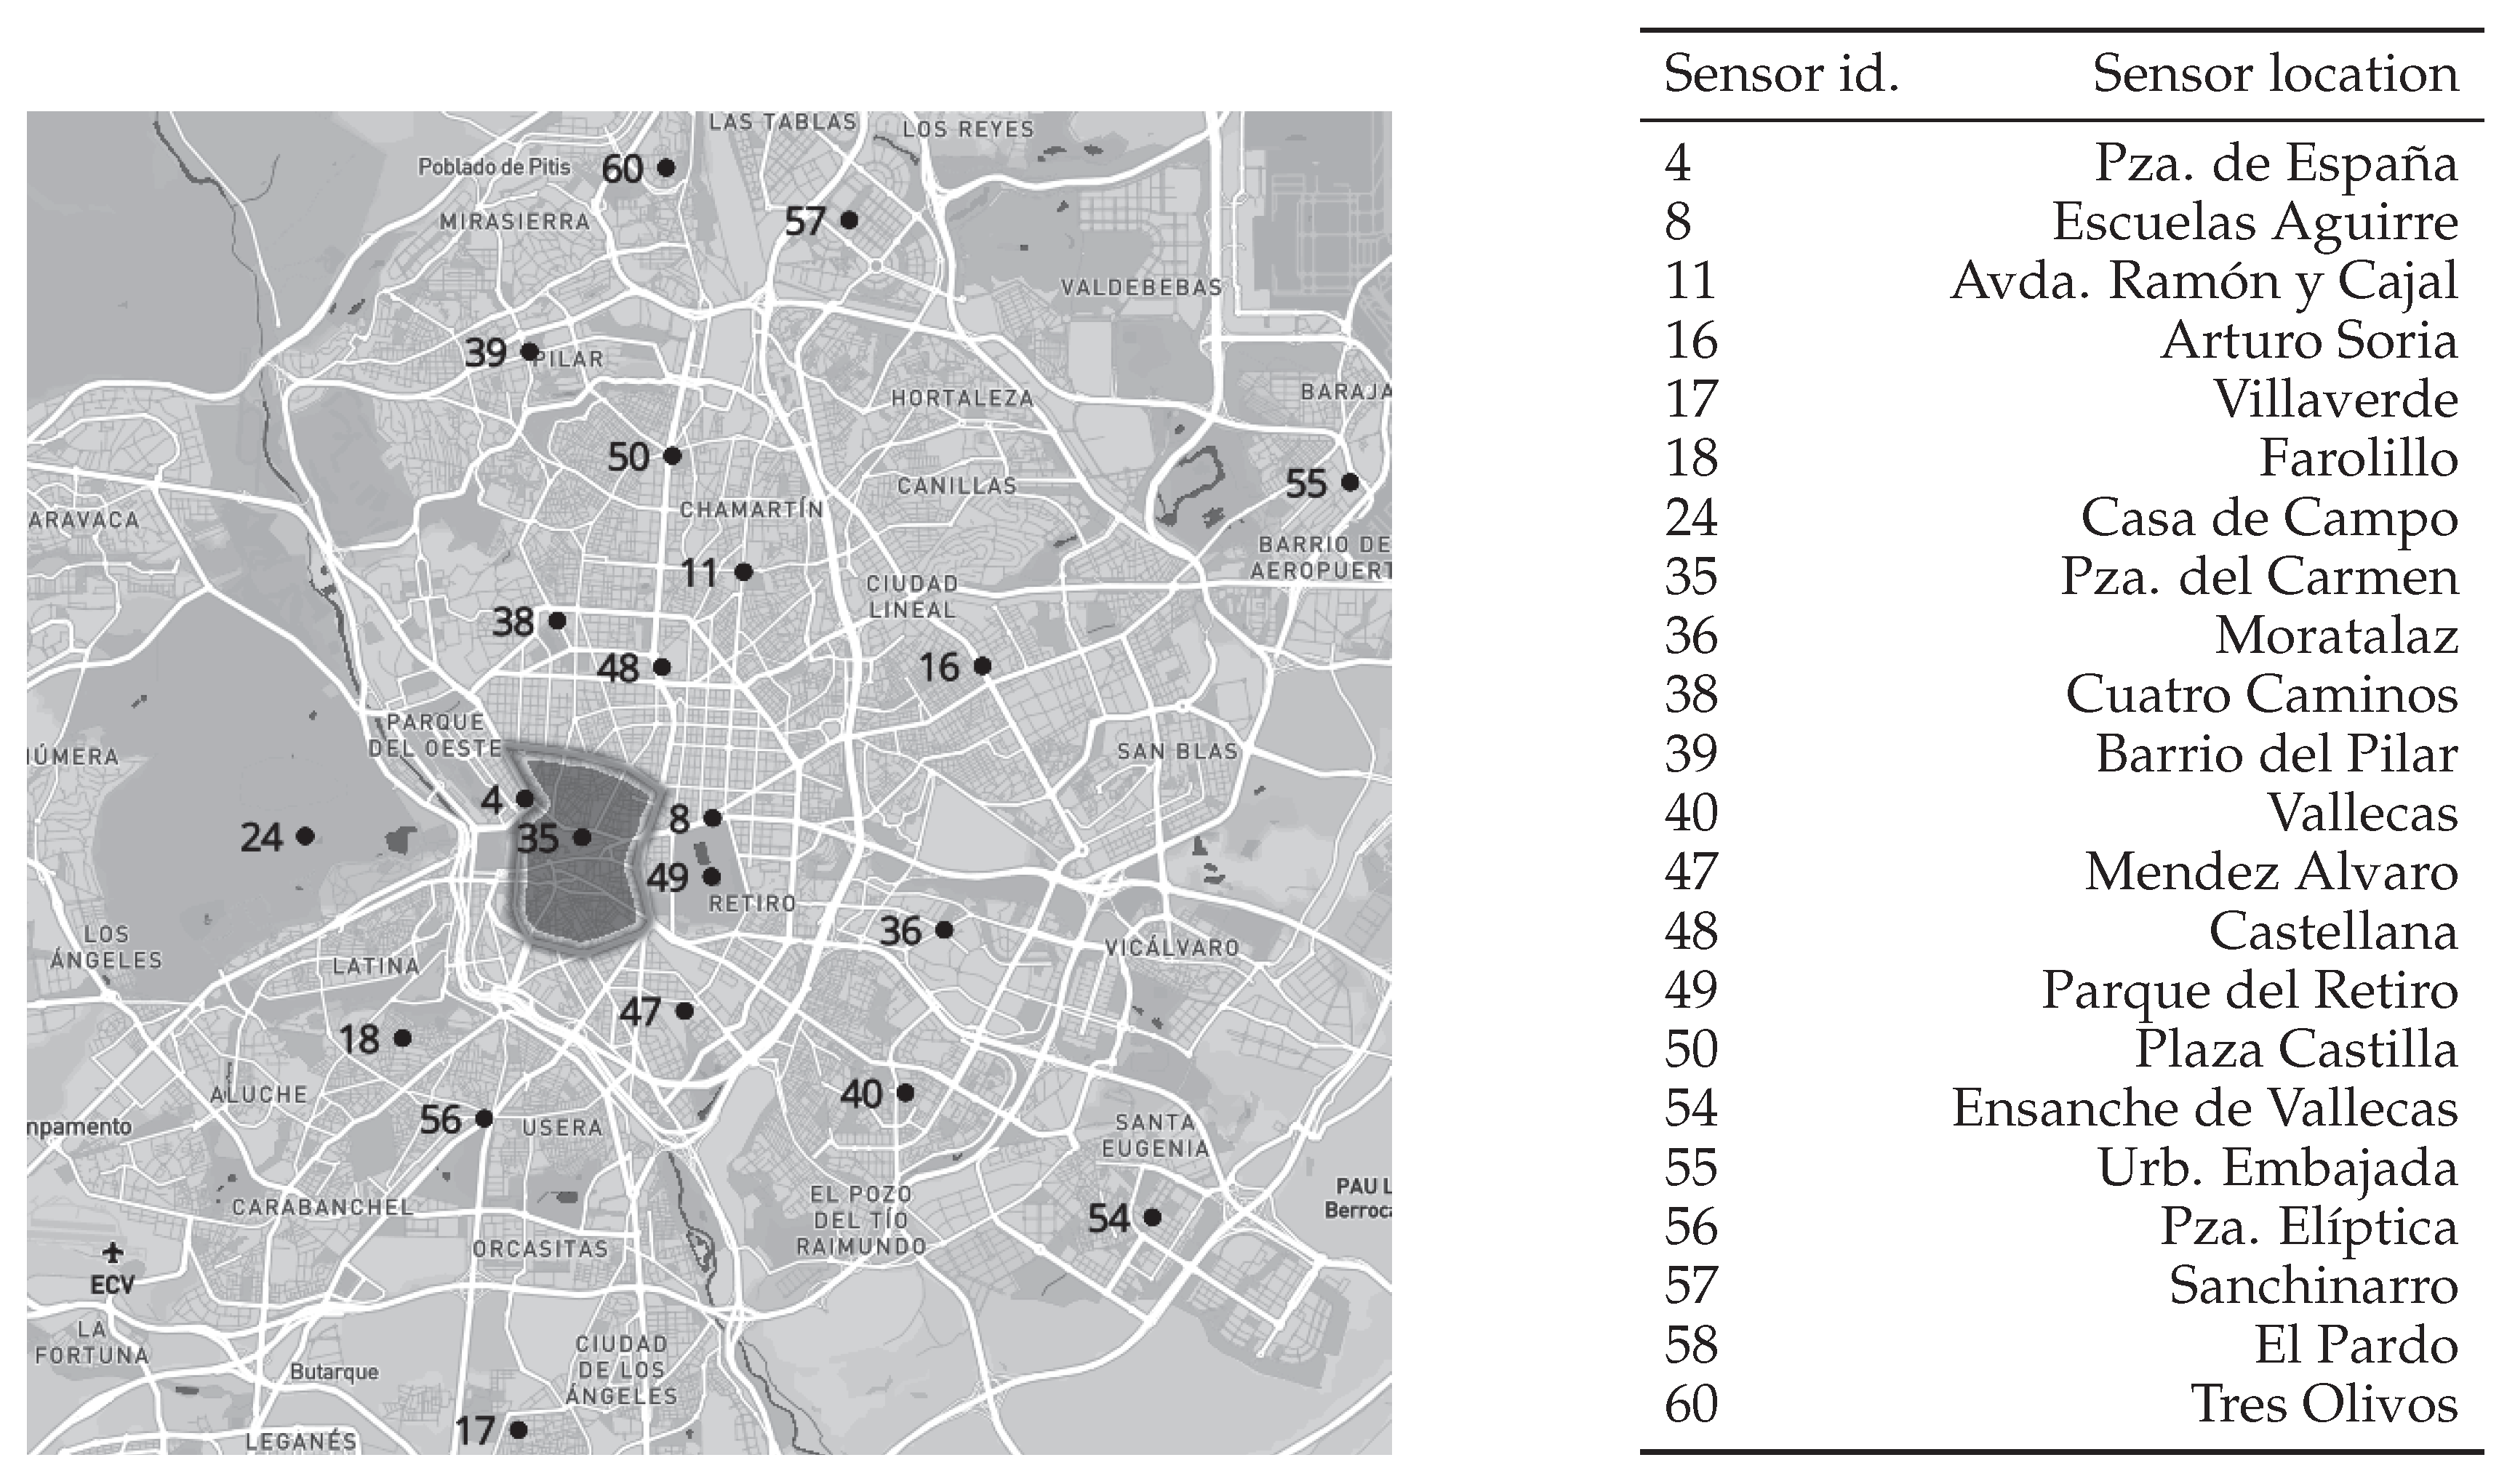
This section analyzes the information gathered by the sensor located in Pza. del Carmen (id. 35), which is the one inside the LEZ. When evaluating the pollution in MC, we face two main drawbacks: fFrst, the sensor does not gather information about PM and PM, and second the noise data shared through ODP does not provide complete data for 2013. Thus, we do not include in this section the analysis of these two air pollutants and the Pre-MC period is defined from December 2014 to November 2018 when the noise is evaluated.
4.1. Air Quality
Table 2 reports the minimum (Min), the maximum (Max), the median (median), and the interquartile range (Iqr) for the concentration of the pollutants sensed in MC during the two periods analyzed here. The last column includes the value of
, and the check-mark (✓) indicates that there is a statistical difference according to the Mann–Whitney U test in such a pollutant for the periods analyzed (i.e.,
p-value < 0.01).
Table 3 presents the percentage of time
that the air pollutant concentration is lower than the threshold defined by the EU.
The evaluated measures are grouped by season because the meteorological conditions (i.e., wind direction and speed, atmospheric pressure, temperature, and relative humidity) affect the chemical behavior of the evaluated pollutants [
65].
Figure 2 and
Figure 3 show the mean concentration of SO
and NO
by month, respectively. Notice that Pre-MC covers a longer amount of time. These figures also illustrate the boxplot of the concentration of the air pollutants for Pre-MC and Post-MC periods and the probability density function (PDF) of the whole data grouped by periods, i.e., Pre-MC and Post-MC.
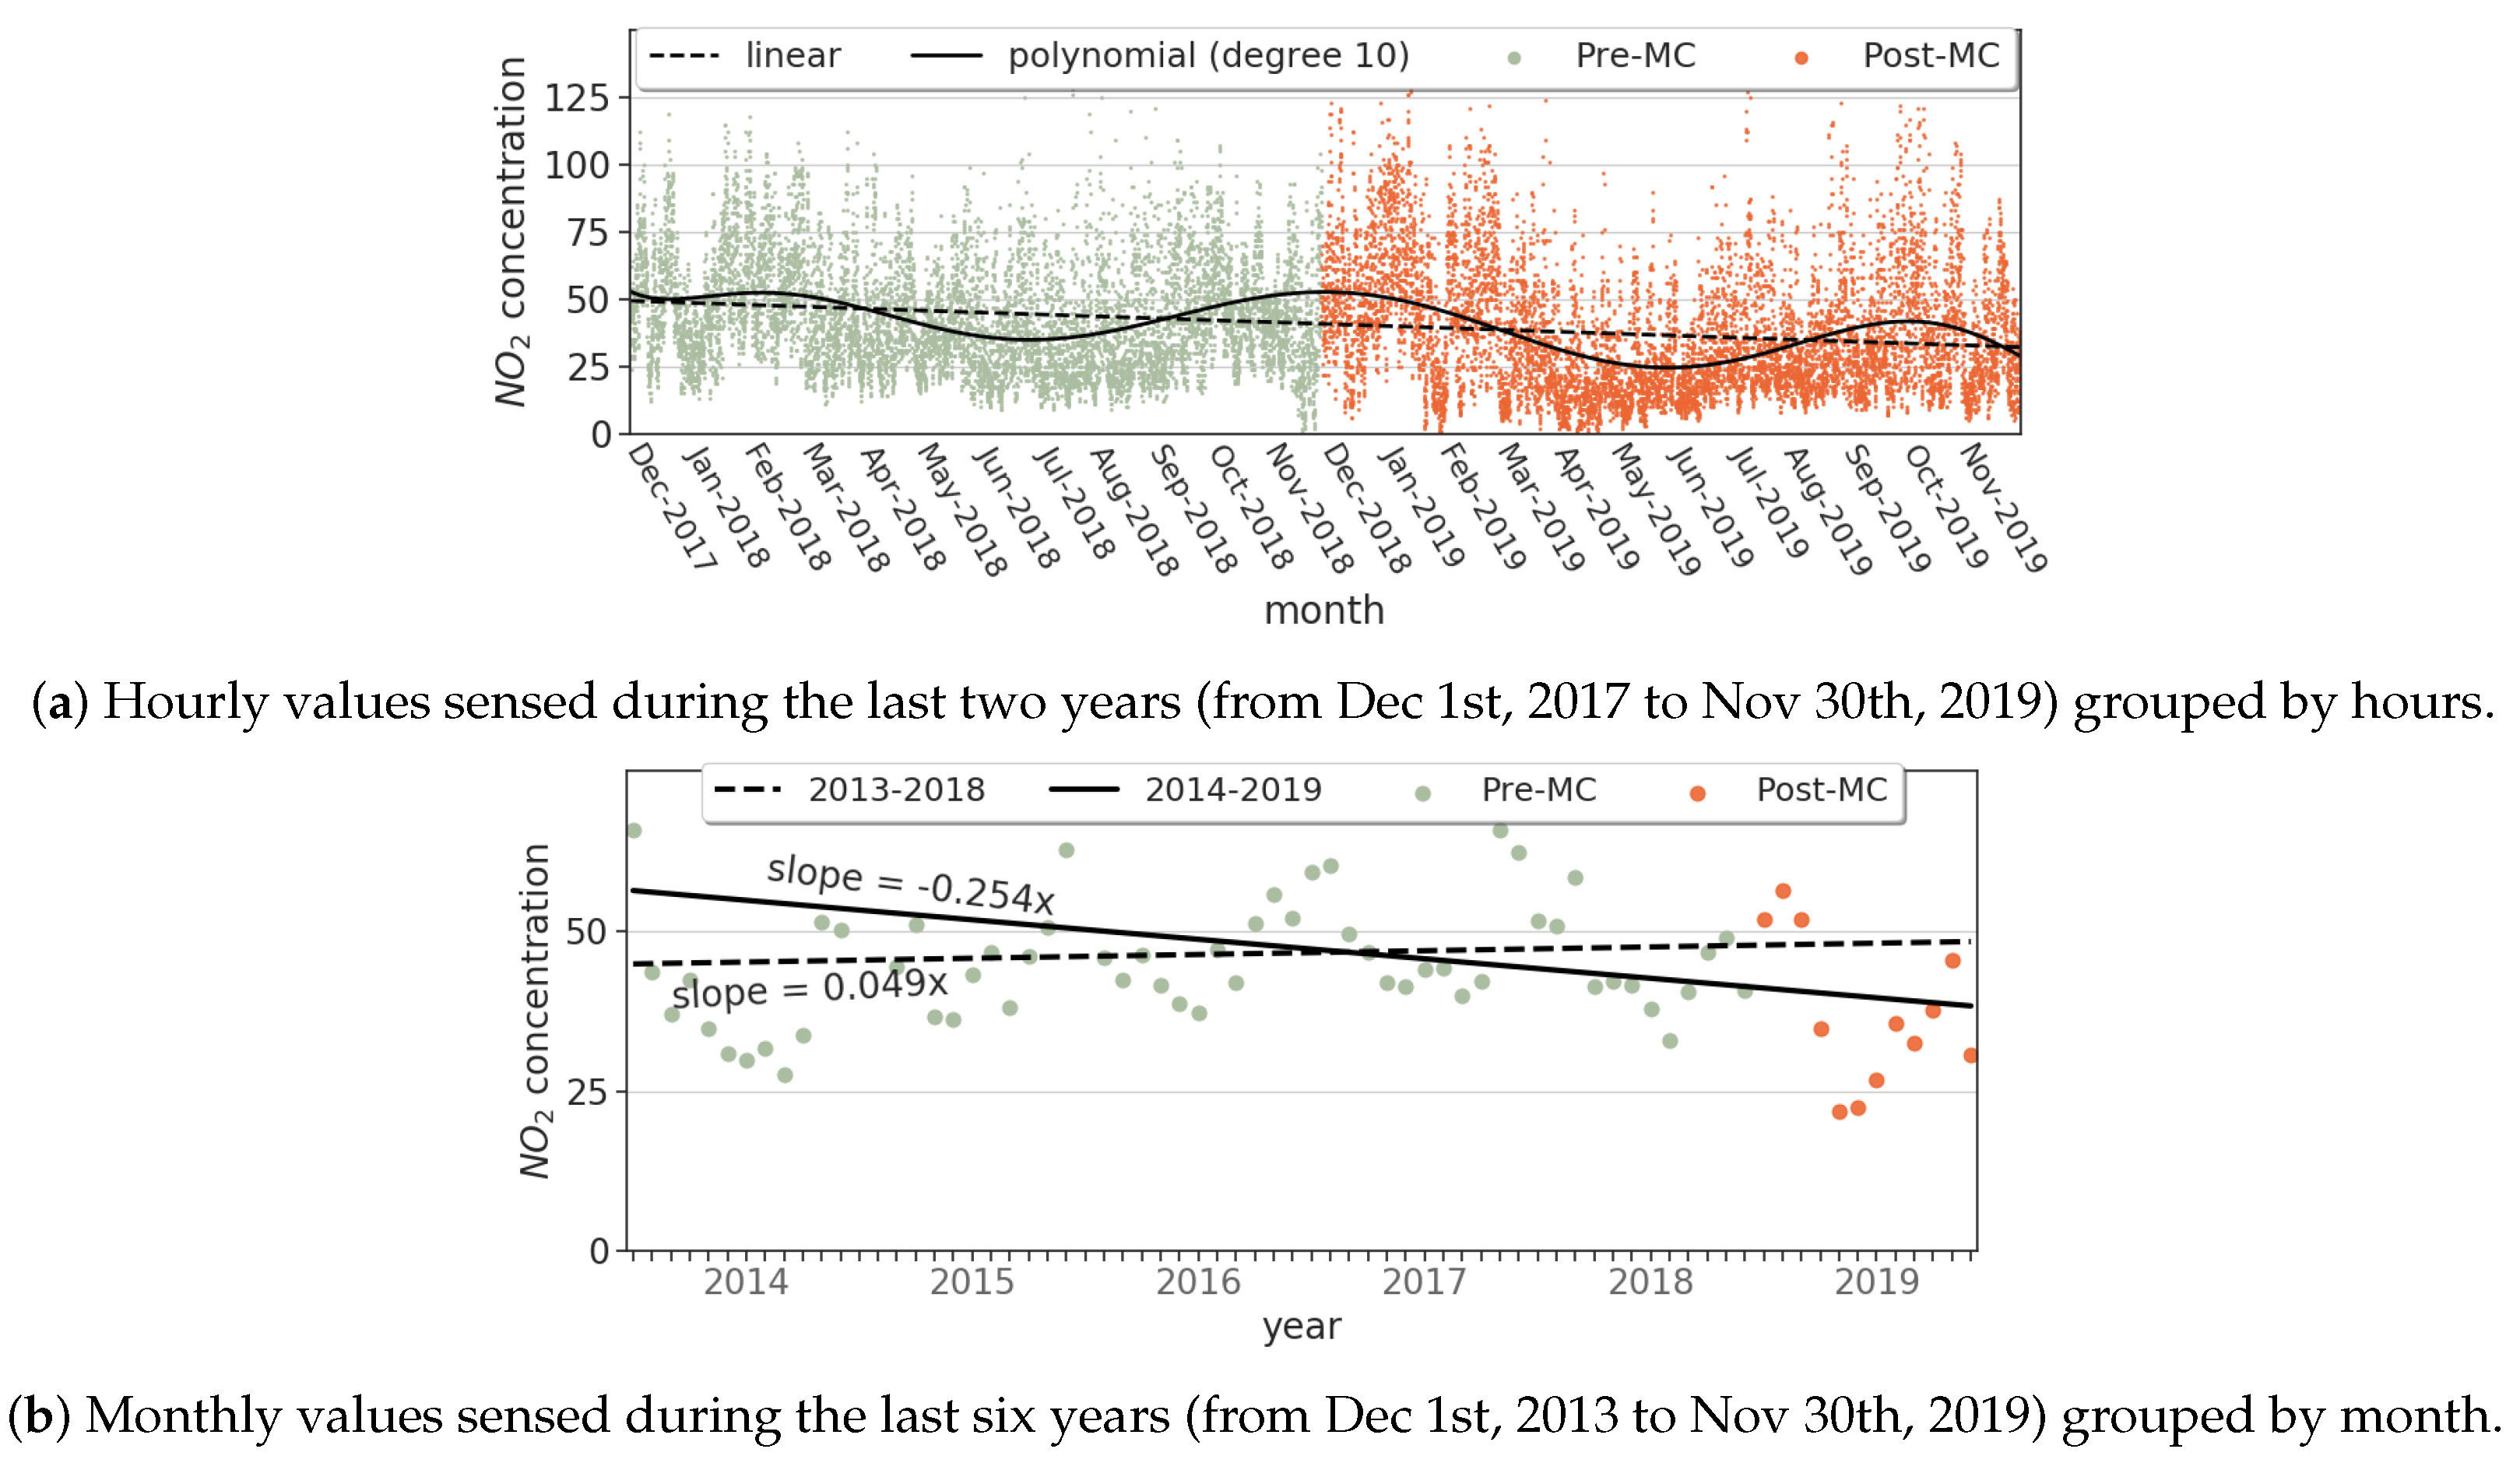
Figure 4 illustrates the regression analysis to evaluate the general trend of NO
through the time. Finally,
Figure 5 and
Figure 6 show also the mean concentration of O
and CO by month, respectively.
The concentration of
in the air is higher during Post-MC than during Pre-MC for all seasons (i.e.,
).
Figure 2 illustrates this increase. This is principally due to the largest sources of SO
emissions being fossil fuel combustion at power plants and other industrial facilities [
65]. Thus, mobility-related measures or policies are not appropriate for reducing SO
concentration in the air.
For both periods, the mean concentration does not exceed the threshold defined by the EU (20
g/m
); however, the maxima values do (see
Table 2).
Table 3 shows that the population is under an SO
concentration lower than the UE threshold during 95.81% of the time for Pre-MC and 94.48% for Post-MC. Thus, the excess of this pollutant is exceptional and negligible, so it is not considered problematic in Spain.
Focusing on NO
, which is the pollutant that almost led Spain to the European Court and the excess of which is a public health concern, its concentration is significantly reduced for all seasons, except winter (i.e., Mann–Whitney U statistical test
p-value < 0.01). The decrease of NO
concentration is lower during winter because of the heavier use of combustion power plants for wintertime home heating (therefore, road traffic may not be the main source of NO
), and also because of the fact that NO
stays in the air longer in the winter [
65].
Figure 3b confirms that warmer seasons have better air quality.
As can be seen in
Figure 3a, the concentration of NO
exceeds, during several months, the maximum one allowed by the EU for both periods (Pre-MC and Post-MC) but with important differences. Thus,
Table 3 results indicate that the population had healthier air for 15.29% longer duration during Post-MC as compared to Pre-MC circumstances (62.17%-46.88%).
Figure 3c confirms that MC is under lower concentration of NO
in the air during Post-MC.
It is noticeable that there is a clear downward trend in the concentration of NO
after the application of the car restrictions (see
Figure 3a). We apply regression analysis to evaluate the general trend of this pollutant.
Figure 4 illustrates two different experiments: First, we take into account all the hourly concentration values during the last two years to see the trend of the closest time (a), and second the sensed values are averaged by month and the trends for the five years previous to the MC measurements (from 2014 to 2018) and also for the last five years (from 2015 to 2019) are evaluated (b). This last experiment analyzes the possible change of trend due to the new mobility policies.
In
Figure 4a, the polynomial regression of grade 10 (black line) shows, first, how NO
concentration increases during colder seasons and decreases in warmer ones and, second, that the pollution values during Post-MC are lower than Pre-MC. In turn, the linear regression (black dashed line) displays a declined trend over time for this air pollutant. In
Figure 4b, the black dashed line that represents the linear regression of NO
concentration before applying MC (five years) has a positive slope (i.e., the NO
concentration tends to increase). The solid black line that represents the general trend after applying MC measures has a negative slope, which indicates that NO
concentration in the air tends to be reduced. Thus, the behavior of the concentration of NO
in the air under the application of MC measures points out that the traffic restriction has a positive effect on air quality.
The concentration of O
shows a similar behavior for both periods (see
Figure 5 and
Table 3). The results in
Table 2 show that the concentration of this pollutant increased after the application of MC during spring, autumn, and winter, but it decreased during summer. All the monthly average O
values are lower than the maximum defined by the EU (120
g/m
). According to
Table 3 values, the population is almost all the time experiencing air without an excess of O
during Post-MC.
The increment of O
that we illustrate in our analysis could be due to the oxidation of NO, i.e., the chemical reaction of O
and NO that forms NO
and O
, which occurs in urban areas [
66]. As the road traffic limitation reduces the concentration of NO, the portion of O
that reacts with NO is lower. Therefore, the levels of O
do not decrease, and subsequently the concentration of NO
produced by the oxidation of NO is lower. In short, this upturn can be a chemical consequence of the reduction in the air of other components’ concentrations.
Regarding CO, as it occurs with O
, the concentration of this pollutant decreases during summer, but increases during the other seasons (see
Table 2 and
Figure 6). While one of the major sources of this pollutant concerning outdoor air is road traffic vehicles or machinery that burn fossil fuels, it seems that the reduction of road traffic does not lead to a decrease of CO in this case. However, according to EU regulations, there is not a need to reduce CO since during the time frame analyzed in this article there is not any measurement over the threshold stipulated by the EU (10 mg/m
).
Finally, the evaluation of SO, NO, O, and CO indicates that the final environmental balance may not always coincide with what was intuitively expected. However, it is important to remark that MC measures are highly effective in reducing NO concentration, which was one of the major motivations for making this move. Therefore the answer to RQ1 (is the deployment of MC effective at reducing the concentration of NO and so improving the air quality in this area?) is yes. The restriction to the road traffic applied in MC has significantly reduced NO concentration.
4.2. Outdoor Noise in MC Area
Table 4 reports the minimum (Min), the maximum (Max), the median (median), and the interquartile range (Iqr) of the levels of noise sensed in MC during the two periods analyzed here. The last column includes the value of
and the check-mark (✓) indicates that there is a statistical reduction in such a noise level between Pre-MC and Post-MC according to the Mann–Whitney U test (i.e.,
p-value < 0.01).
Table 5 presents the percentage of time
that the outdoor noise levels are lower than the threshold values defined by Madrid City Council [
64] (see
Section 3.2).
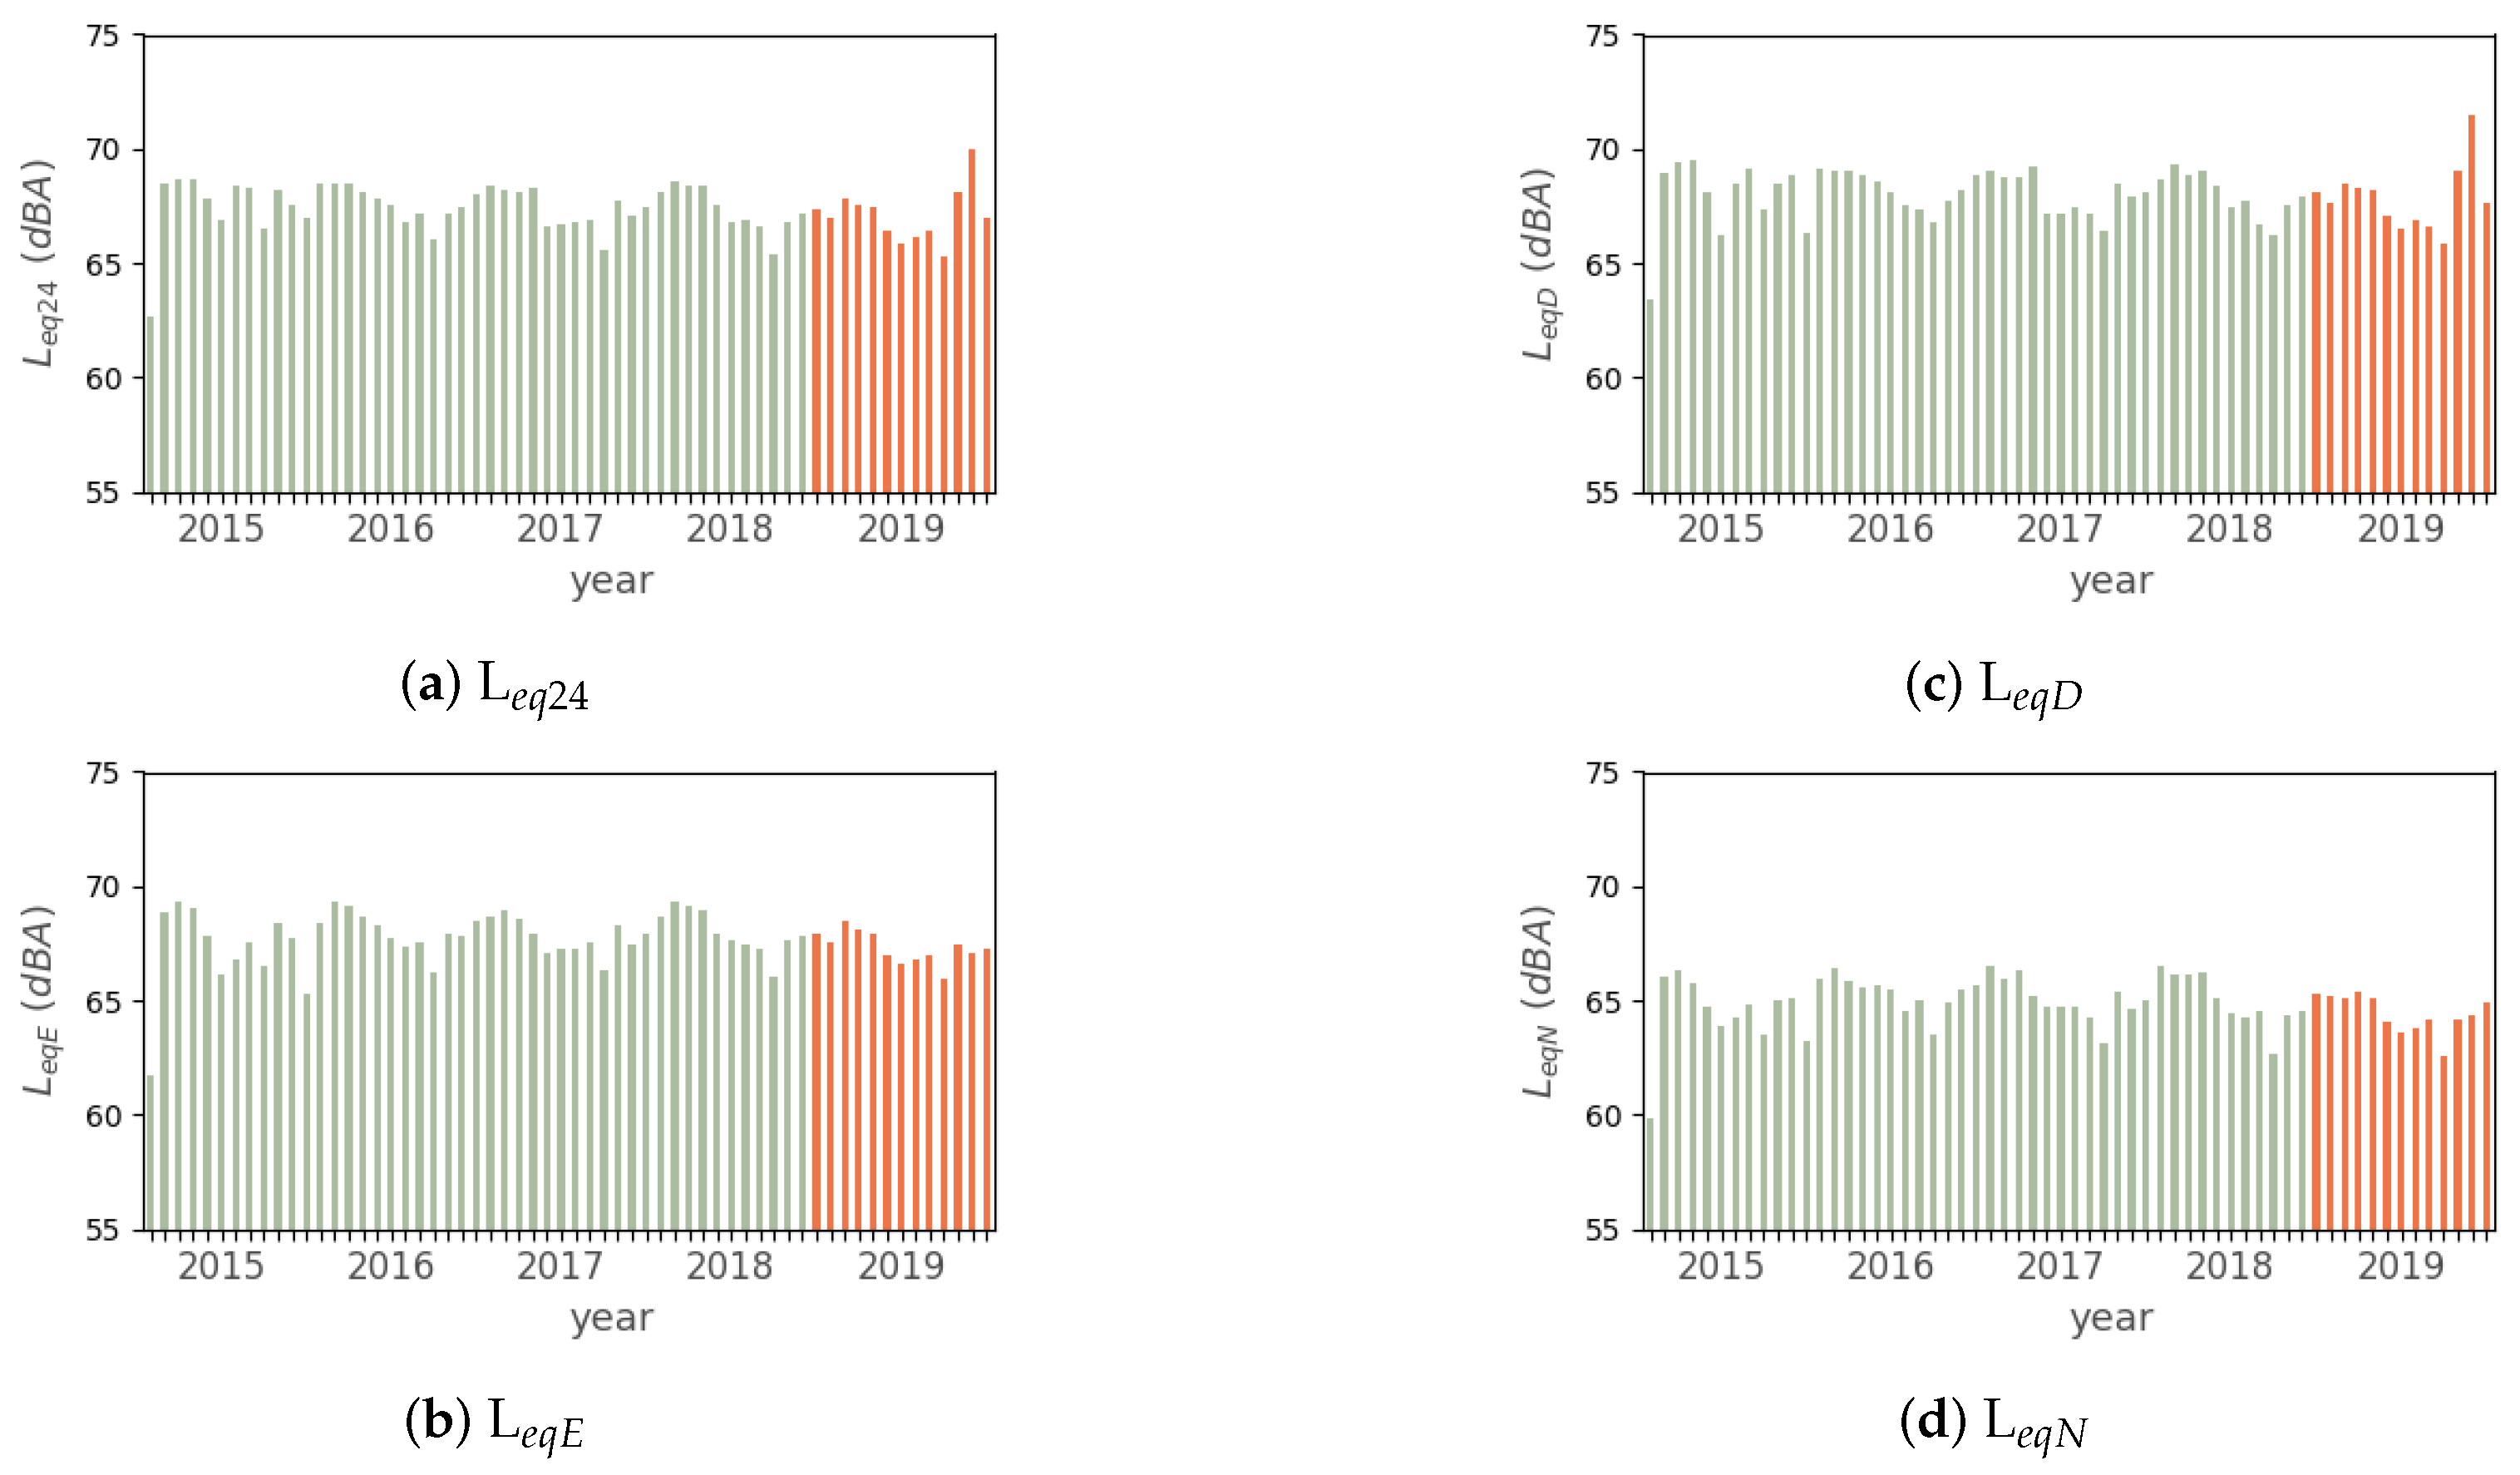
Figure 7 and
Figure 8, and show the mean of the noise level evaluated here grouped by month.
Regarding the equivalent sound pressure levels (L
, L
, L
, and L
), the level the noise is higher during the hours between 7:00 h and 23:00 h than during the night time (see
Table 4 and
Figure 9). This is mainly due to the MC neighborhood being located in a commercial area and the business hours in Madrid usually ending at 22:00 h; thus, there is road traffic until late hours. There is a reduction in the median of all these noise levels during Post-MC. Therefore, in general, the noise is lower during this period. The highest differences between the two evaluated periods are given by the evening (L
) and night (L
) noise levels (see
Table 4).
Focusing on Post-MC time, the levels of noise decrease during the first months but they experience an increase after June, i.e., when MC suffered from the reversal (see
Figure 7). If we focus on L
and L
, this increment is important. Taking into account the noise levels before the reversal, the reduction
for these two levels of noise is significantly higher, i.e.,
= −0.52 dBA and
= −0.45 dBA. Thus, we can observe a negative impact on the noise pollution of the reversal that is mainly experienced at the time between 7:00h and 19:00h.
Evaluating
during Pre-MC and Post-MC,
Table 5 shows that the outdoor levels of noise practically always surpass the thresholds of the city council. During the night the levels of noise are never lower than 55 dBA, which is the threshold for these hours. Notice that we are evaluating equivalent sound pressure levels averaged for every day.
Figure 7 also illustrates how the noise levels generally exceed the thresholds, i.e., the monthly average levels of noise are higher than 65 dBA for L
and L
and higher than 55 dBA for L
. Therefore, other measures must be applied to further reduce outdoor noise in this area.
Focusing on the percentile noise levels (L
, L
, and L
), Pre-MC and Post-MC differences are statistically significant. The best improvement
is shown by L
(see
Table 4), which represents the residual background levels of noise of the urban area analyzed. As the continuous road traffic flow is one of the main sources of the background noise, the reduction of traffic transit provokes a decrease in this type of noise.
L, which statistically represents the median of the fluctuating levels of noise, is also reduced, i.e., = −0.71. The reduction of the annoying peaks in noise (i.e., L) is lower than for the other two percentile levels ( = −0.37). This represents a limited decrease of 0.5% regarding the median value of this noise during Pre-MC (70.70 dBA).
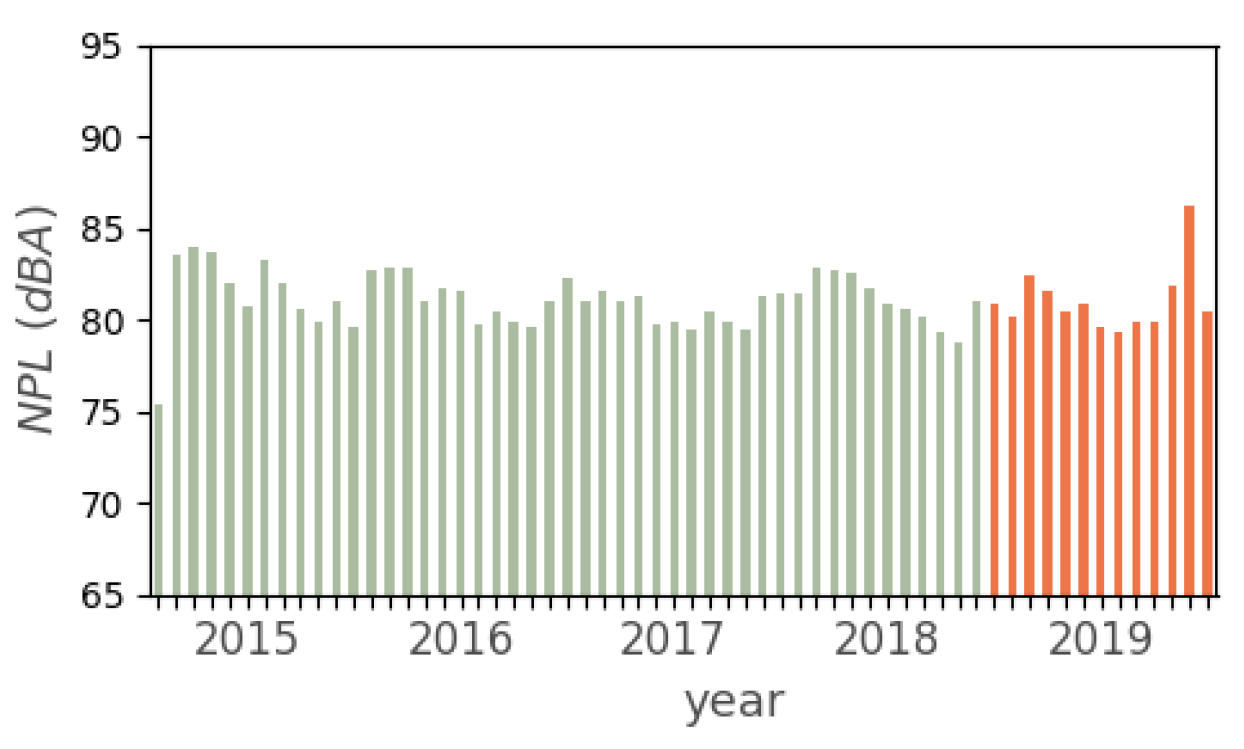
There is not a statistically significant reduction of NPL (see
Table 4) and the average improvement is 0.00. Besides, as the computation of this metric depends on L
, it undergoes the same increase during the last months of Post-MC after the reversal of MC (see
Figure 10).
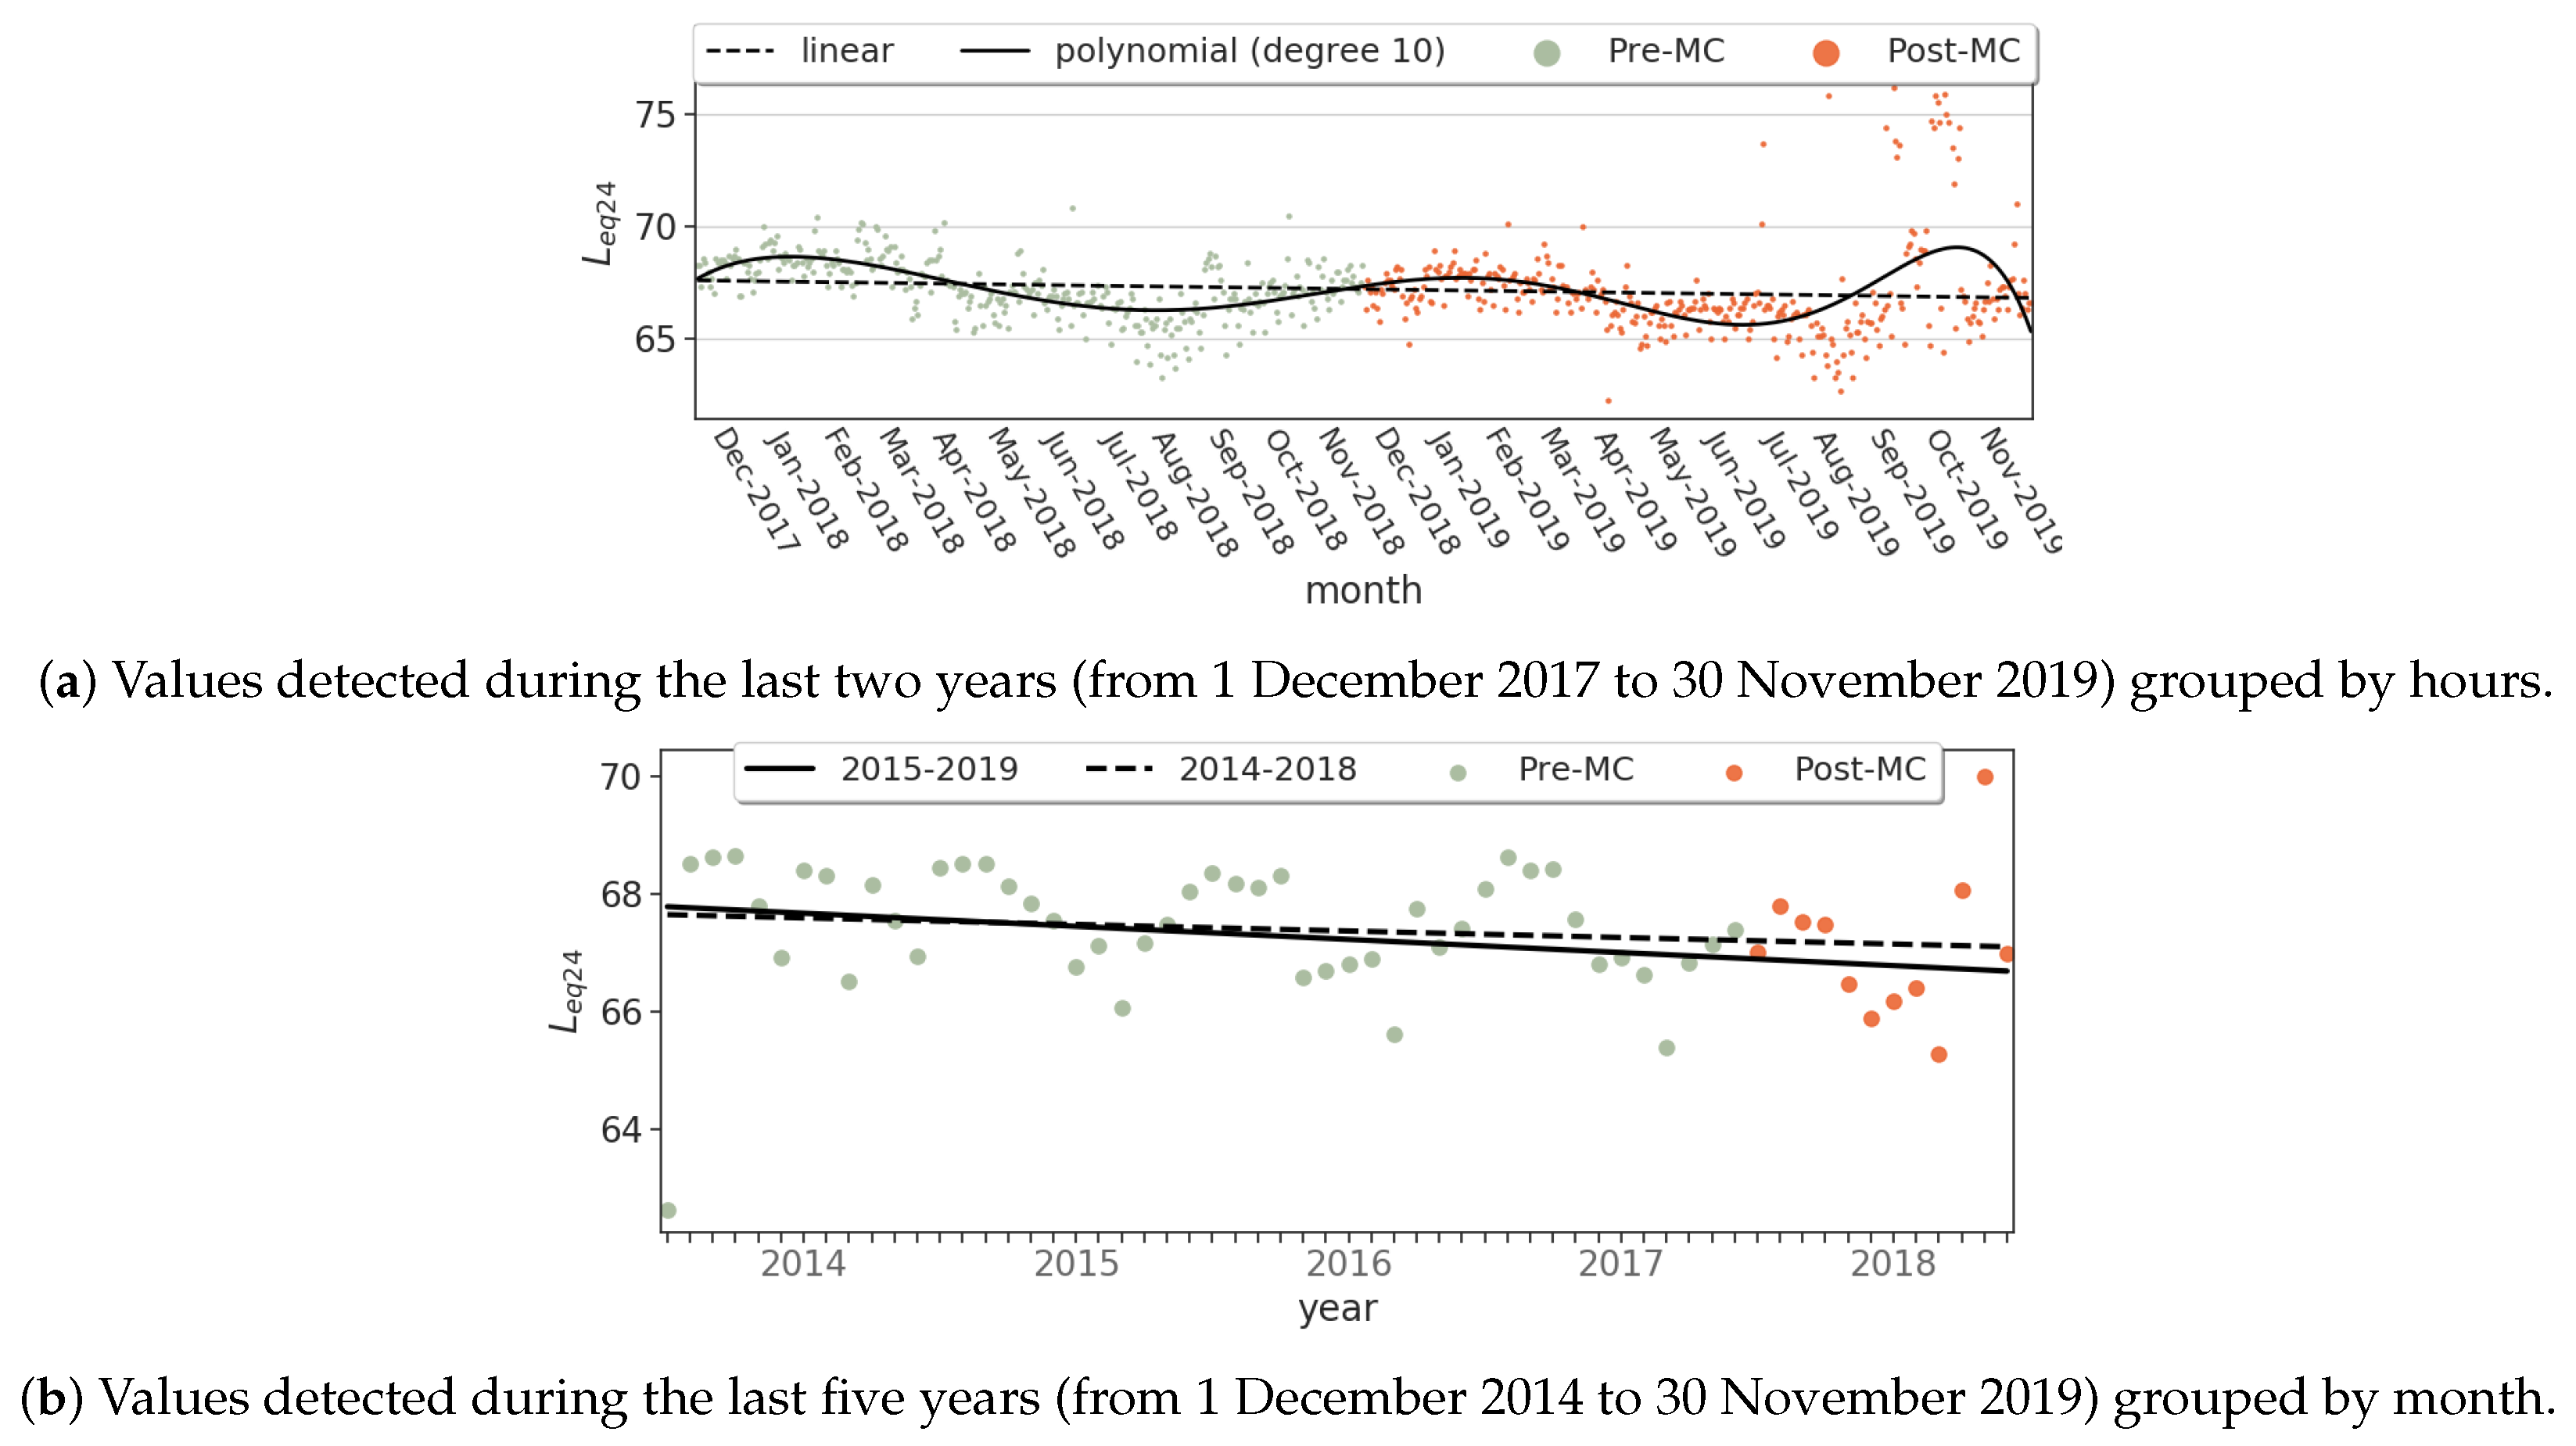
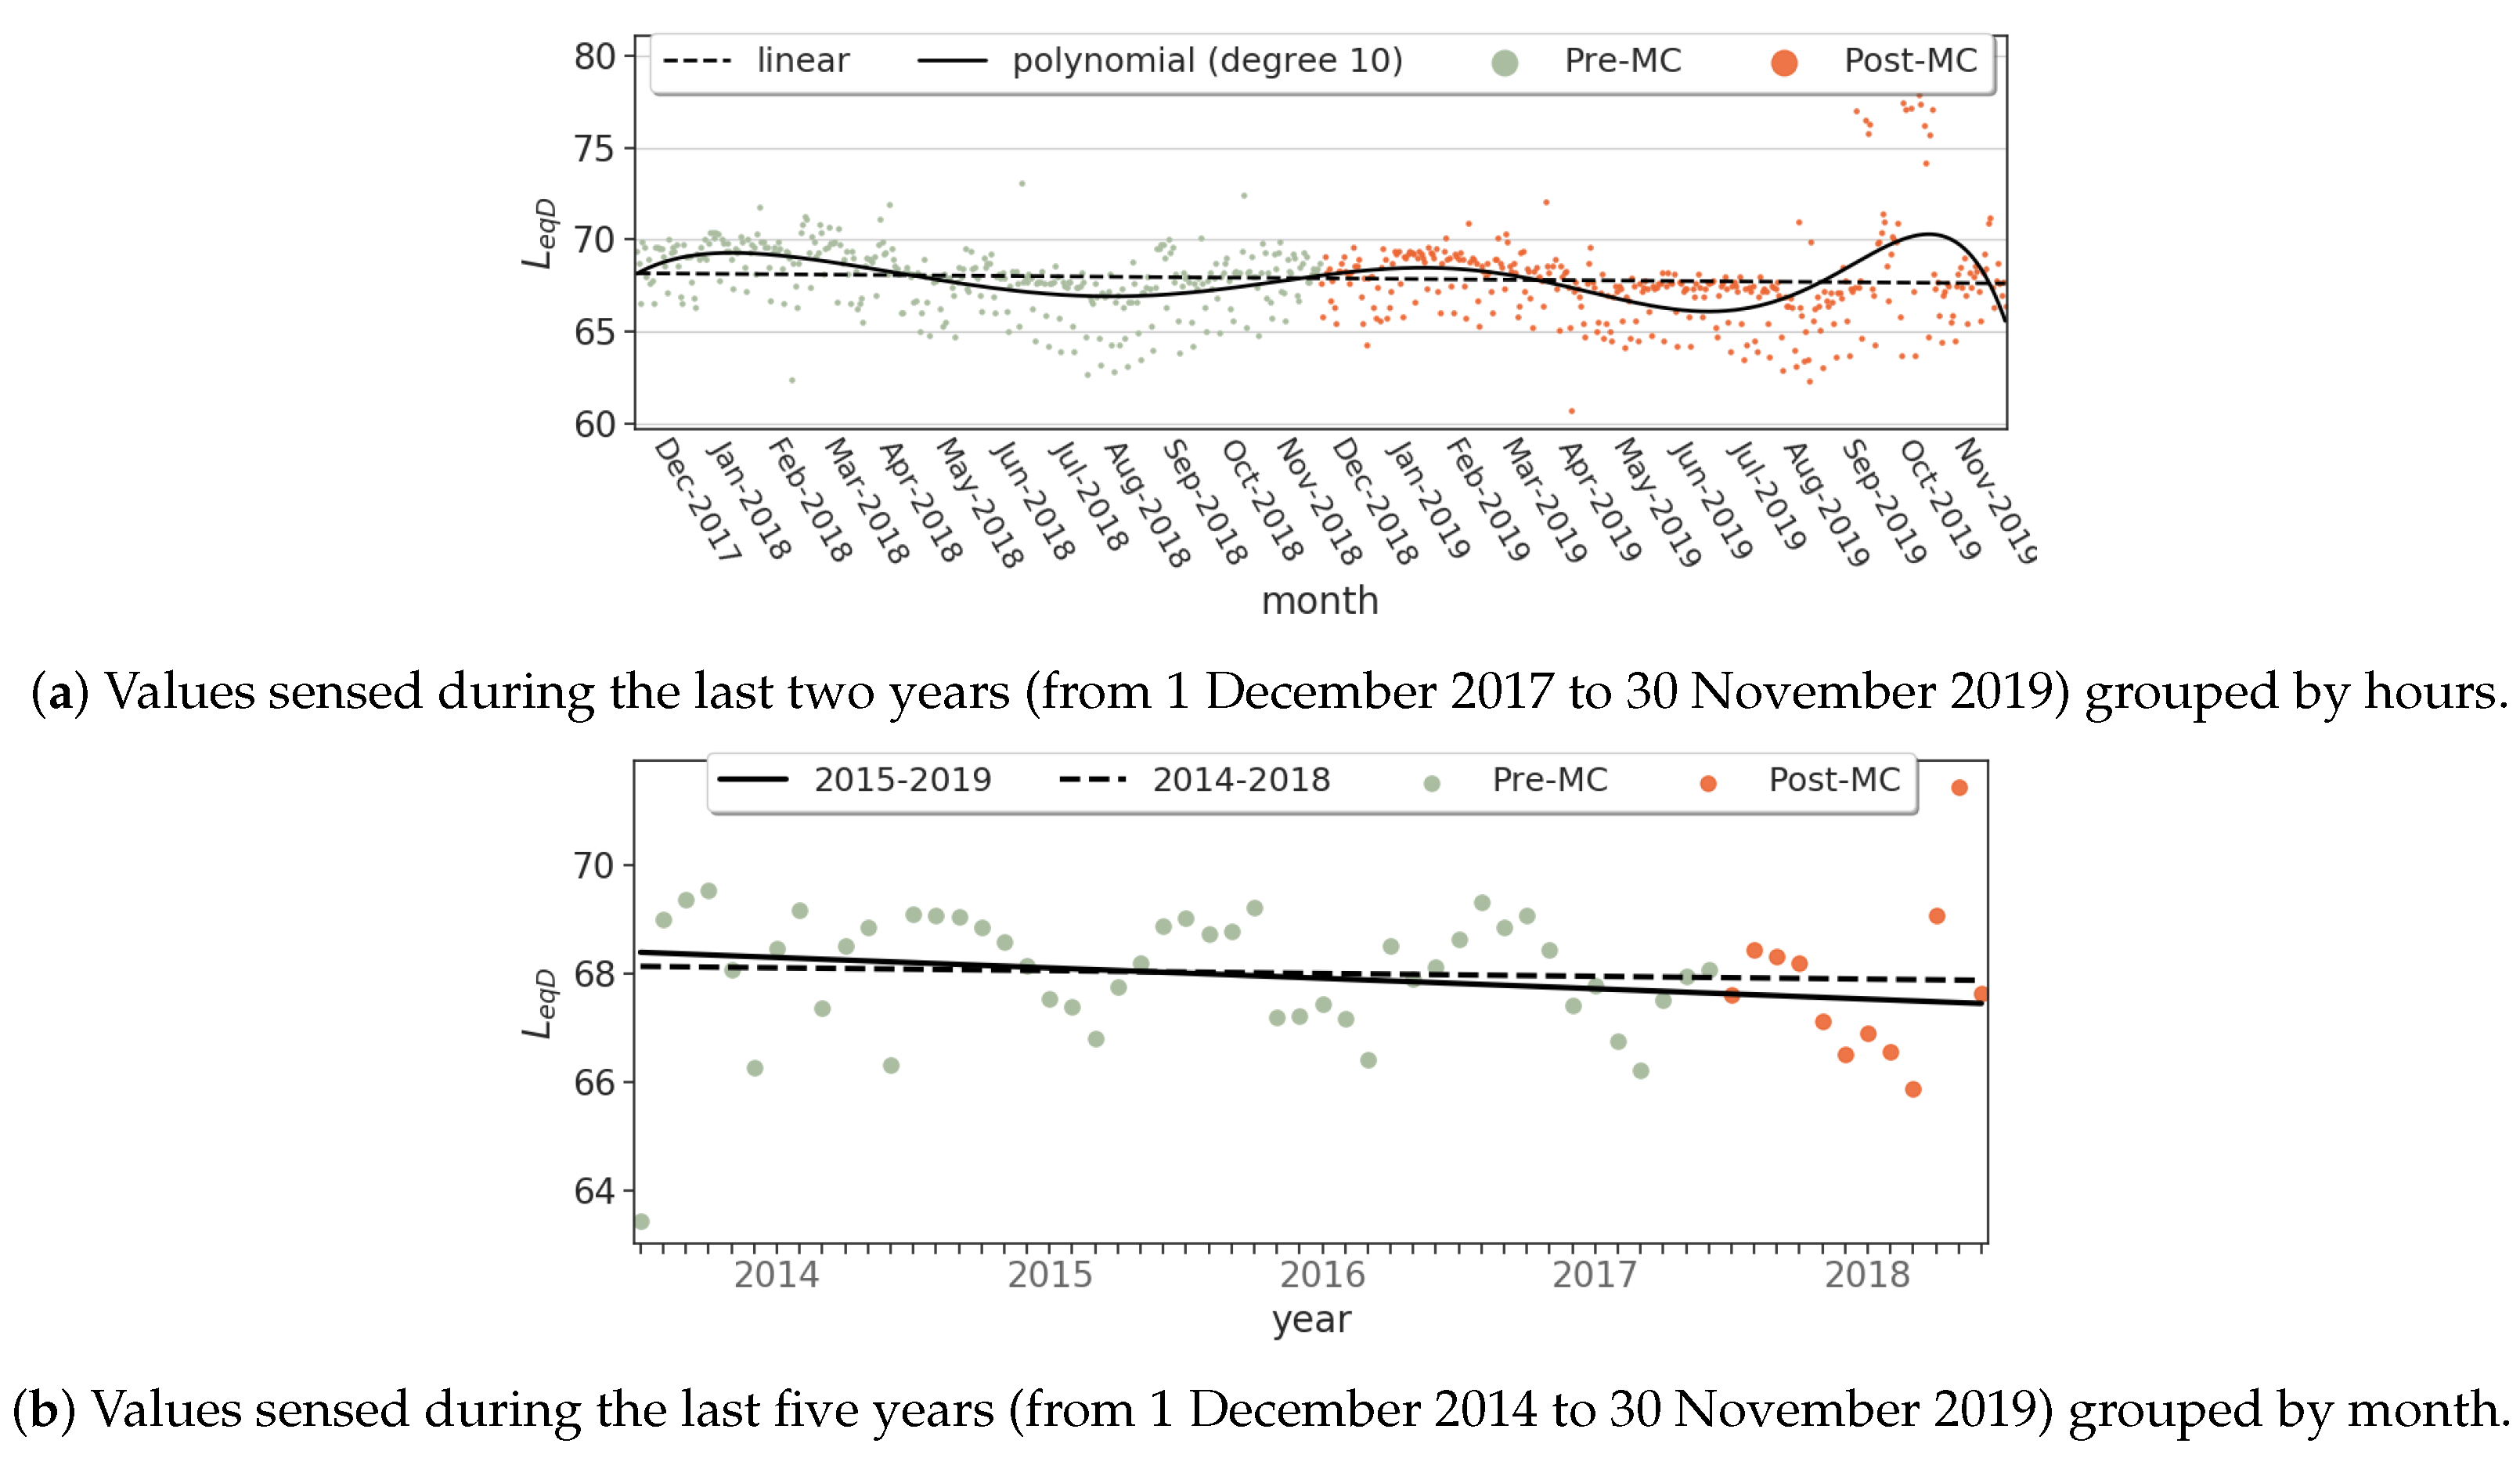
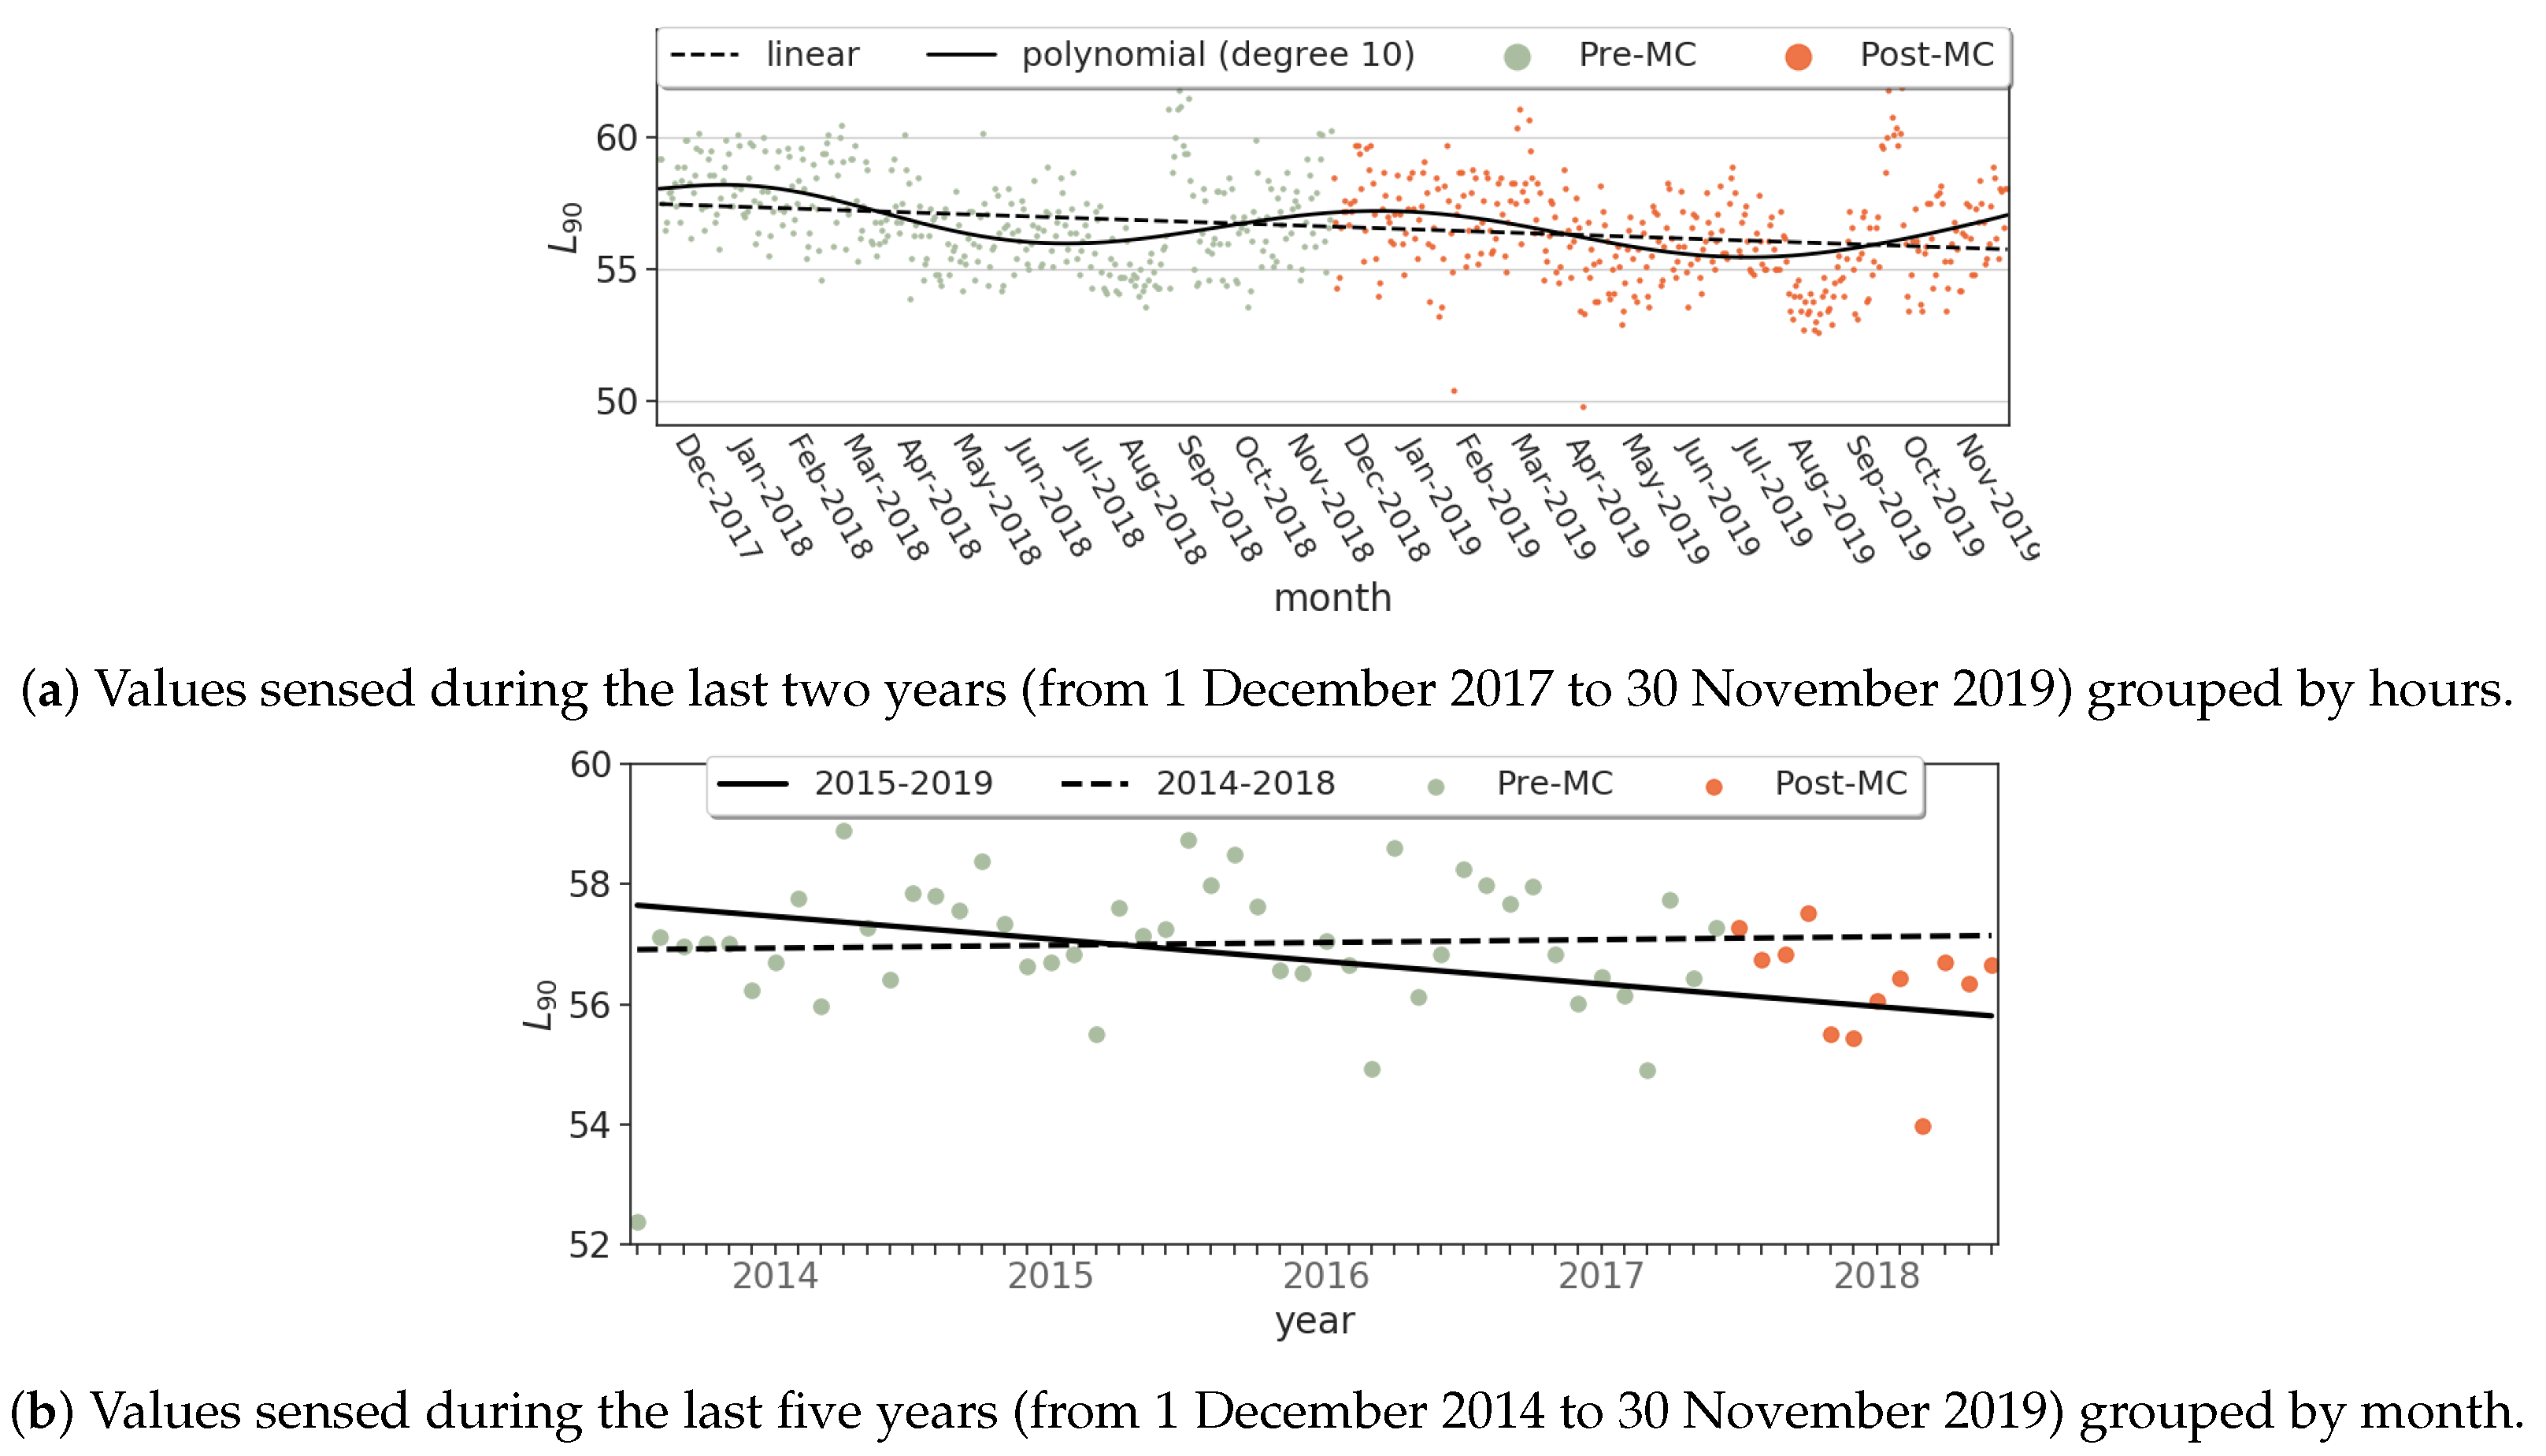
Figure 11,
Figure 12 and
Figure 13 illustrate the trend of some representative levels of sound (L
, L
, and L
). When evaluating the trend of the last two years (on top of each figure), we observe similar behavior: (a) The polynomial regression of grade 10 (black line) illustrates the most marked reduction of the levels of noise during Post-MC until June 2019 when the MC was reversed, and (b) the linear regression (black dashed line) shows that the noise in MC is marginally reduced over time (i.e., the function presents negative slopes but close to zero).
At the bottom of
Figure 11,
Figure 12 and
Figure 13, the black dashed lines that represents the linear regression of the levels of noise before applying MC (from 2014 to 2018) have slopes close to zero or even positive in the case of L
, i.e., there is an increase of outdoor noise in the area. The solid black line that represents the general trend after applying MC measures (last four years) has a steeper negative slope, which is higher in the case of L
. Thus, the car restrictions tend to improve the background noise generated by road traffic.
Finally, we have computed the PDF of the L
, L
, and L
noise values to confirm that there is a slight reduction in the outdoor levels of noise in the area of MC.
Figure 14 illustrates that the distributions of values detected Post-MC are more likely to be lower than the Pre-MC ones (the Post-MC distribution is lightly shifted to the left). However, while there is such a reduction, it is notorious that other types of measures are needed to mitigate this source of health problems and discomfort because the levels of noise exceed the thresholds set by the institutions nearly all the time during both evaluated periods, Pre-MC and Post-MC.
According to these results, we answer RQ2: Is the definition of an LEZ an effective measure to reduce environmental noise levels?. MC slightly reduces the outdoor levels of noise, mainly the background noise produced by road traffic. However, this decrease is not enough to keep the noise in the range of healthy levels.
