A Methodological Framework for the Selection of Key Performance Indicators to Assess Smart City Solutions


 , ,
, ,
Abstract
:1. Introduction
1.1. The Role of Cities towards Urban Sustainability
1.2. The Role of KPIs and Smart City Assessment Frameworks
2. Methodology
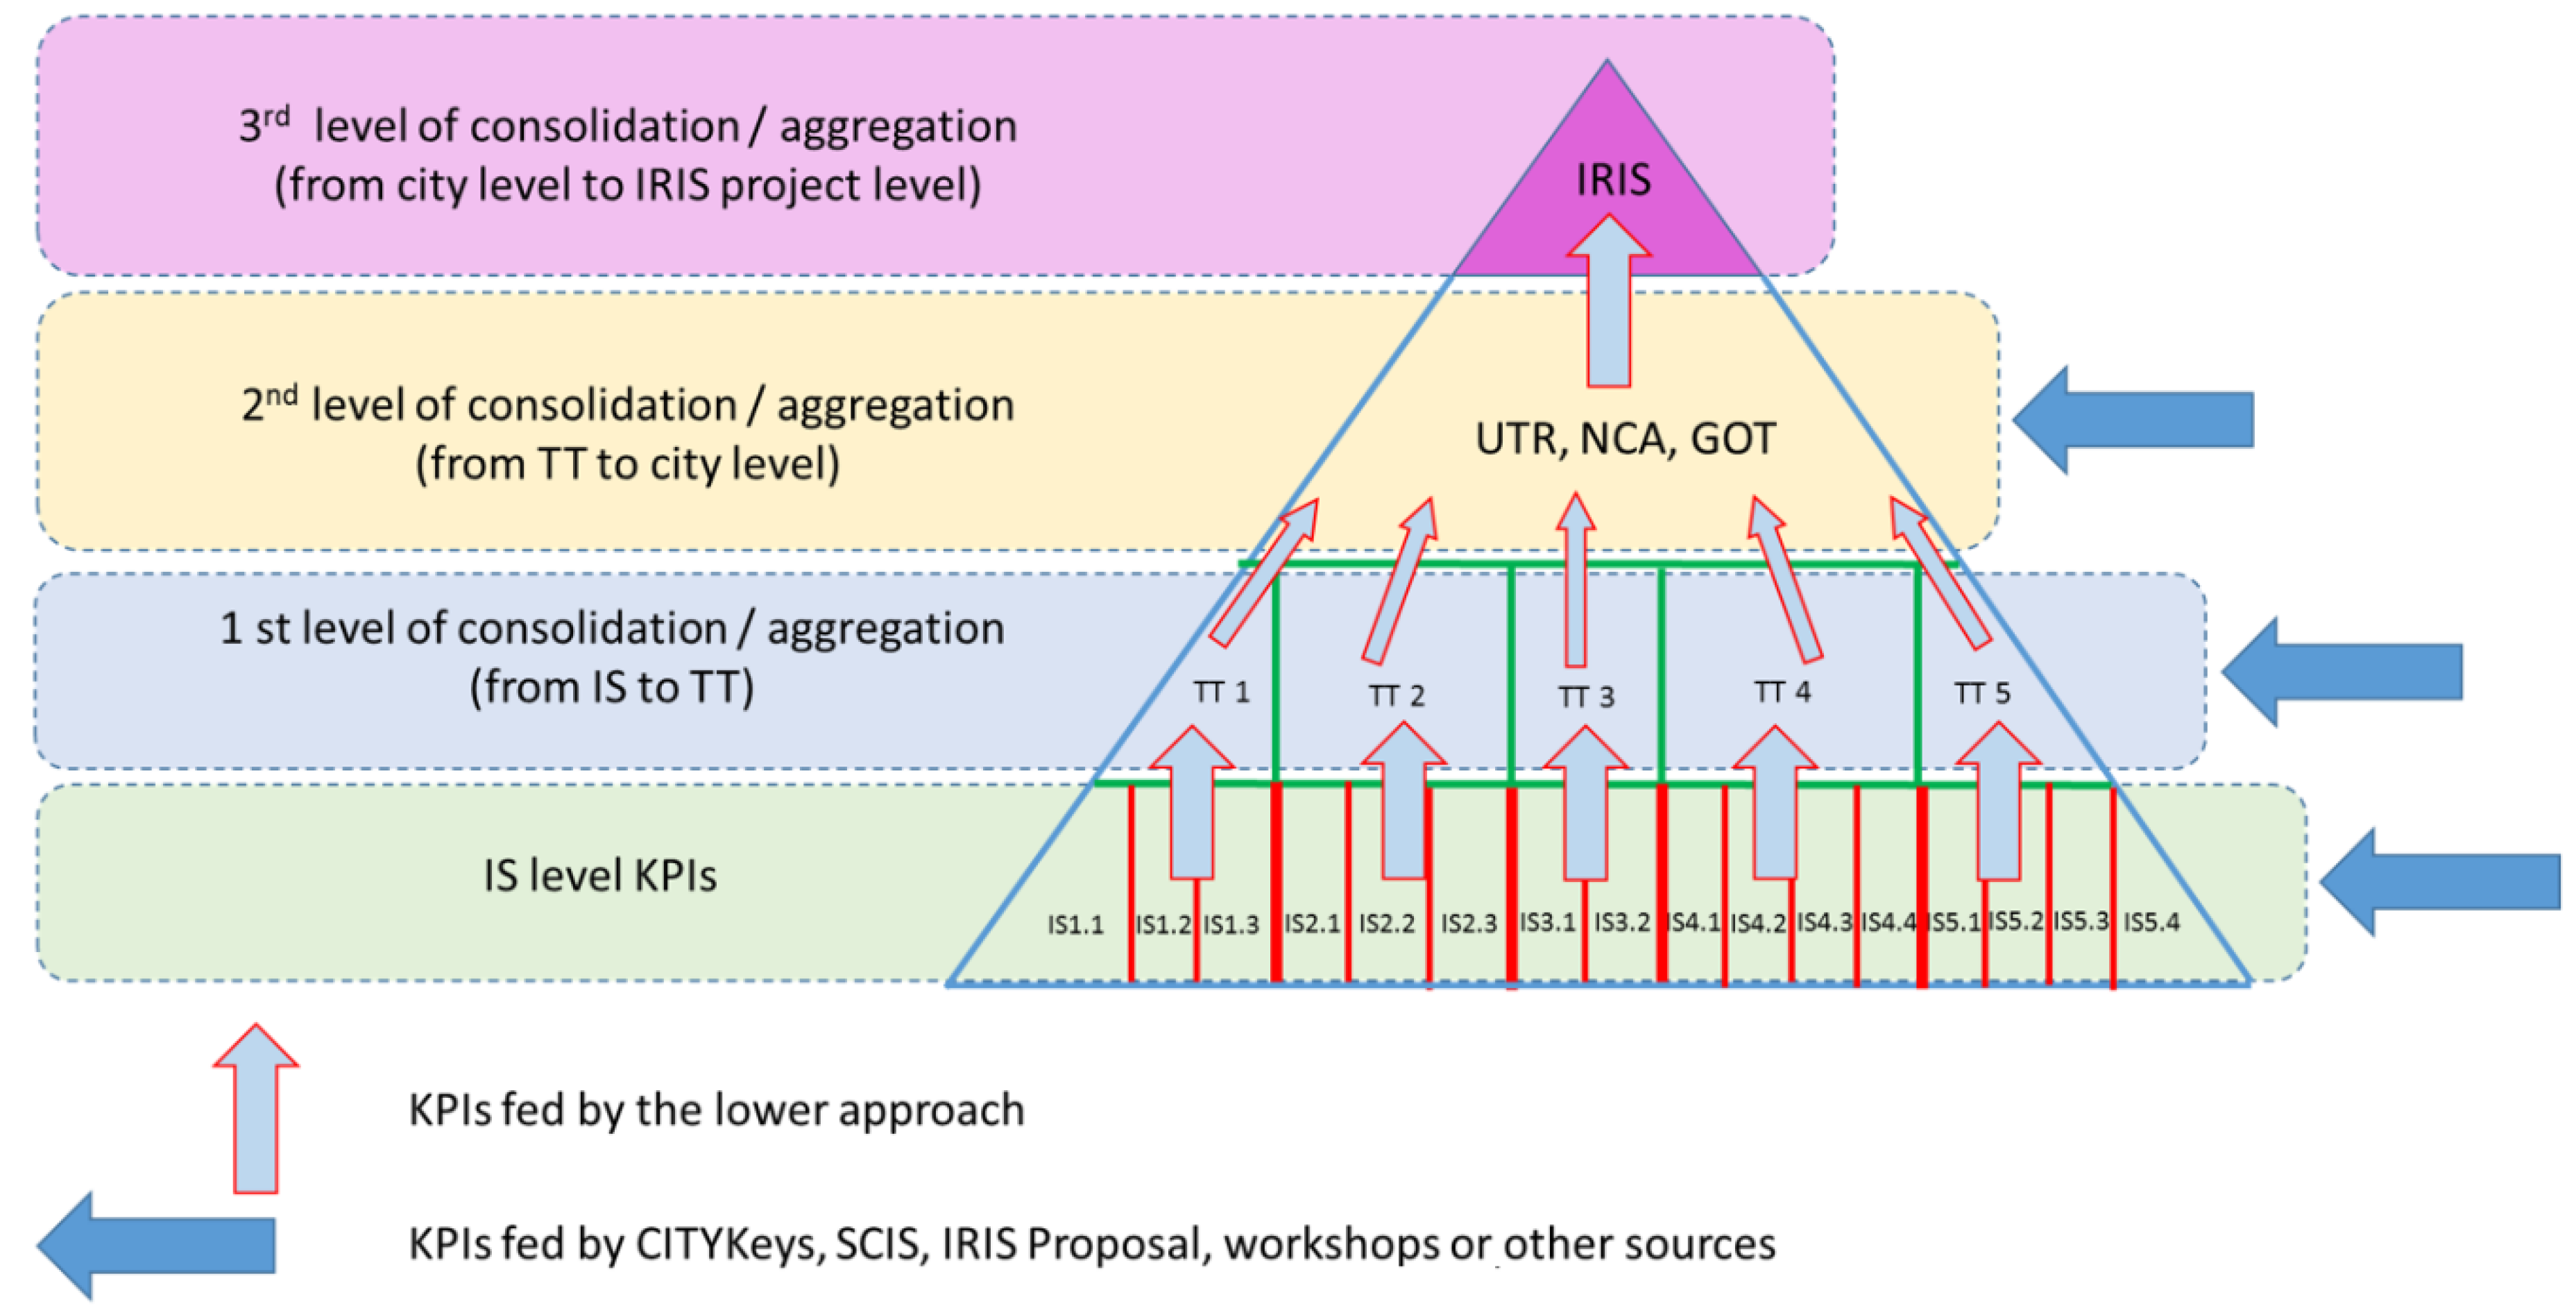
2.1. Clustering Solutions in Transition Tracks
- TT#1: Smart renewables and closed-loop energy positive districts: Integrating (a) a high share of locally produced and consumed renewable energy at district scale; (b) energy savings at building level reducing the citizens’ energy bill; and (c) energy savings at the district level. These solutions integrate high renewables penetration like district-scale PV and biomass for district heating, near-zero energy housing retrofit, energy efficient low temperature district heating and smart public lighting that is energy efficient, powered by renewables and connected to the district energy system.
- TT#2: Smart Energy Management and Storage for Grid Flexibility: Integrating smart energy management and renewable energy storage for (a) maximum profits of renewable power/heat/gas; (b) maximum self-consumption reducing grid stress and curtailment; and (c) unlocking the financial value of grid flexibility. These solutions include smart ICT to interconnect energy management systems at home, building and district level, and to integrate maximal renewables production, V2G storage in e-cars operated in car sharing systems with additional stationary energy storage.
- TT#3: Smart e-Mobility Sector: Integrating electric vehicles and e-car sharing systems in the urban mobility system offering (a) local zero-emission mobility; (b) lower household mobility costs; and (c) smart energy storage in V2G car batteries. These solutions include extensive deployment of (V2G) e-cars, exploitation of (V2G) e-cars in local car sharing systems and district-wide smart (V2G) charging stations powered mainly by renewables.
- TT#4: City Innovation Platform (CIP): Cutting edge information technology and data framework enabling the above-mentioned solutions, maximizing cost-effectiveness of the integrated infrastructure. Next, the City Innovation Platform with open, standards-based application program interfaces (APIs) provides meaningful data and information services for households, municipalities and other stakeholders, allowing for a data market with new business models. A common architecture, harmonized data models and a sustainable data governance plan ensure the interoperability and replicability of the solutions, transferring them from city to city. The city data market and the service marketplace manage access to all data and services, with appropriate licenses and flexible pricing models in and across cities and allowing real-time KPI monitoring and benchmarking of smart energy and mobility performances.
- TT#5: Citizen Engagement and Co-Creation: This orients to design and demonstration of feedback mechanisms and inclusive services for citizens to achieve that they are intrinsically motivated to (a) save energy; (b) shift their energy consumption to periods with redundant renewables; (c) use electric vehicles; and (d) change the vehicle ownership culture towards a use or common mobility assets culture. These solutions include game-theory based engagement methods and instruments ranging from co-creating infotainment apps, local school campaigns, offering training on the job to students living in the district by partaking in the demo activities, competitive energy games using the home energy management system, energy ambassadors creating local energy communities, to crowd-funding creating a sense of being part of the solution.
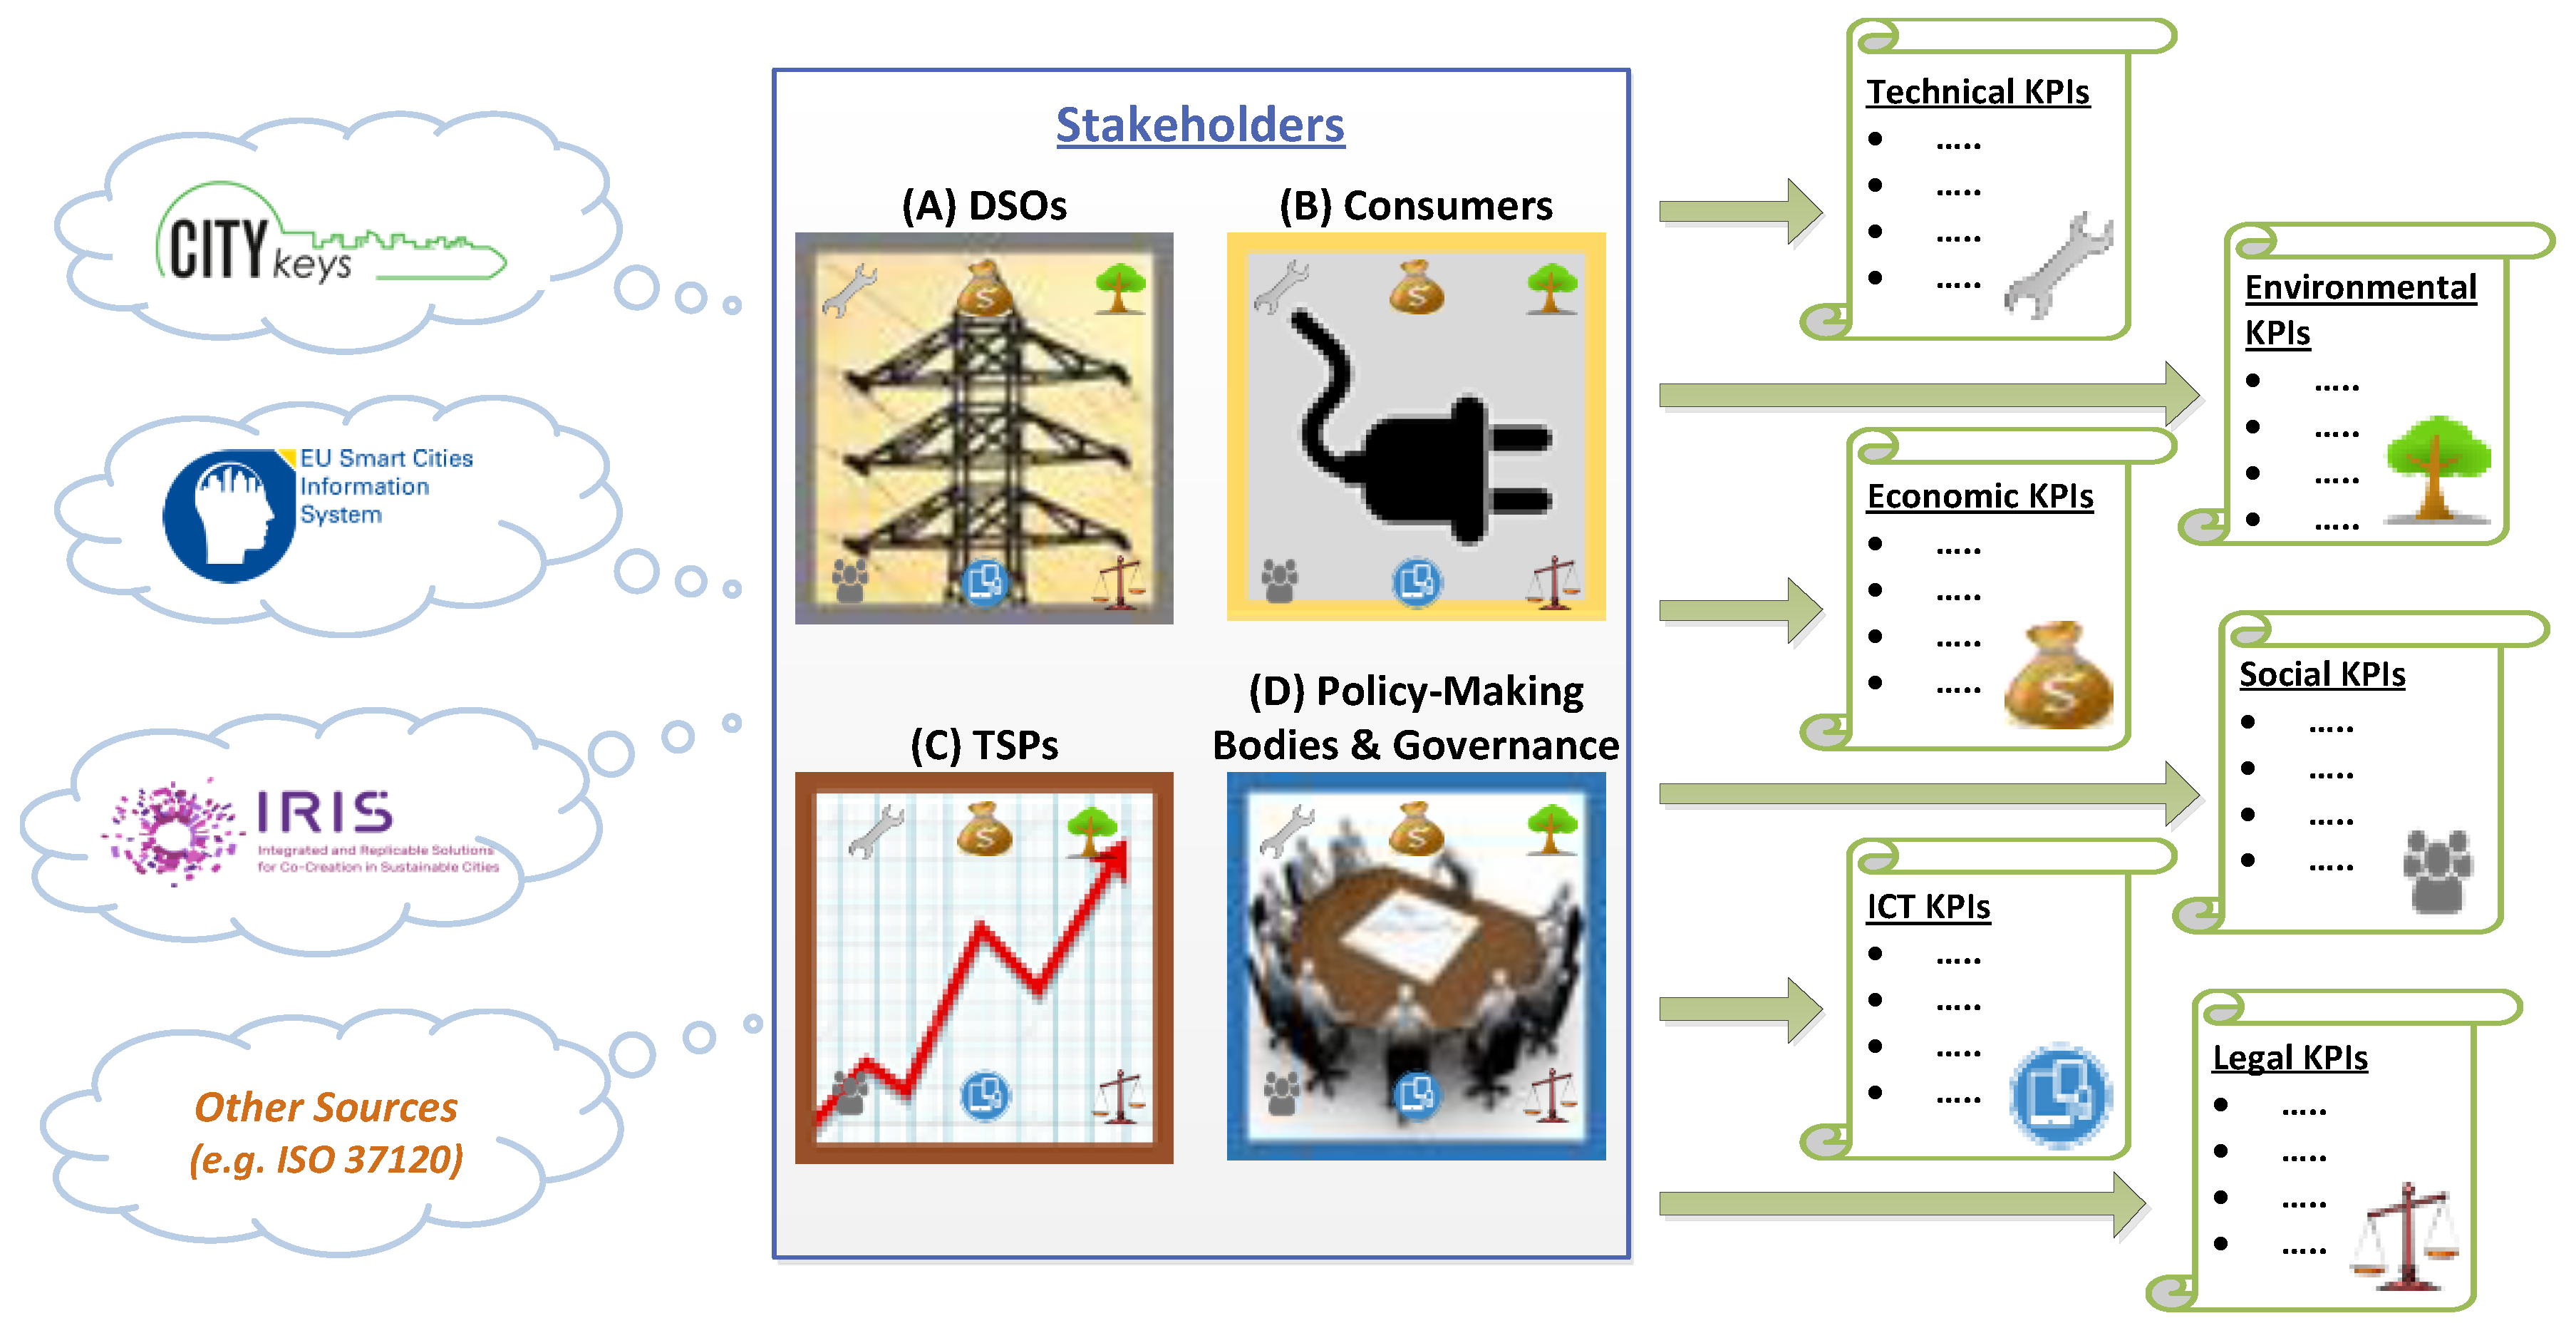
2.2. Definition of the Main Groups of Stakeholders
2.2.1. Distribution System Operators (DSOs)
2.2.2. Consumers (End-Users)
2.2.3. Technology and Service Providers (TSPs)
2.2.4. Policy-Making Bodies and Governance
2.3. Definition of KPIs Dimensions
- KPIs measuring Technical Performance, such as the energy consumption, the RES generation ratio, the peak load reduction, etc.
- KPIs measuring Environmental Performance, such as CO2 emissions reduction.
- KPIs measuring Economic Performance, such as the average cost of energy consumption, the average estimation of cost savings, etc.
- KPIs measuring Social Performance, such as the degree of users’ satisfaction.
- KPIs measuring the Performance of ICT, such as people utilizing apps which enable the residents to monitor and analyse their energy consumptions, home energy management systems, etc.
- KPIs measuring Legal Performance, such as the level of adaptation of electricity/heat integration in the legal framework, legal barriers for usage of biofuels for energy exploitation purposes, etc.
2.3.1. Technical Dimension
2.3.2. Environmental Dimension
2.3.3. Economic Dimension
2.3.4. Social Dimension
2.3.5. ICT Dimension
2.3.6. Legal Dimension
2.4. Definition of KPIs Repository
- Relevance: Each indicator should have a significant importance for the evaluation process. The indicators should be selected and defined in such a way that the implementation of the smart city project provides a clear signal in the change of the indicator value.
- Completeness: The set of indicators should consider all aspects of the implementation of smart city projects.
- Availability: Data for the indicators should be easily available. As the inventory for gathering the data for the indicators should be kept as limited as possible, in time and effort, the indicators should be based on data that either: (a) are available from the project leader or others involved in the innovation case that is being evaluated; (b) or can easily be compiled from public sources, and c) or can easily be gathered from interviews, maps, or terrain observations.
- Measurability: The identified indicators should be capable of being measured, preferably as objectively as possible. For the majority of indicators in the ICT, social and legal dimensions, quantitative measurability is limited. Social sciences provide approaches to deal with qualitative information in a semi-quantitative way [34].
- Reliability: The definitions of the indicators should be clear and not open for different interpretations. This holds for the definition itself and for the calculation methods behind the indicator.
- Familiarity: The indicators should be easy to understand by the users.
- Non-redundancy: Indicators within a system/framework should not measure the same aspect of a subtheme.
- Independence: Small changes in the measurements of an indicator should not influence preferences assigned to other indicators in the evaluation. However, as the current energy systems in many cities are still largely based on fossil fuels, there is a direct relation between a reduction in the use of energy and the reduction of the emission of carbon dioxide. This will lead, to a certain extent, to double-counting the impact.
2.5. Definition of the Levels of Evaluation Per KPI
2.6. Threshold Definition Per KPI
- Baseline: Baseline is a measurement taken in the beginning of the project. If the threshold is the baseline, then the scope is to check the difference in the actual result because of the implementation of the proposed technology solution.
- Business as Usual (BaU): BaU is a more complex threshold, since it takes into consideration the change in the value of the KPI throughout the time period of the project, without the implementation of the tested technology solution. It takes into account the general tendency of the change in the KPI value. The BaU threshold comprises a more realistic view on the tested technology impact on its environment but is more difficult to be estimated.
- Other threshold: A threshold value could be defined by the evaluator, without it being either a baseline or a BaU. This could apply to KPIs that have not been estimated in the past, such as the legal KPIs or some social KPIs that are measured with the Likert scale.
2.7. Align with Monitoring and Evaluation Planning
2.8. Scalability and Replicability Analysis
3. Implementation
- Most of the KPIs fall under the technical (18 KPIs), social (17 KPIs) and ICT (15 KPIs) dimensions, which is to be expected, considering the variety and special characteristics of each technological solution included in smart city projects and the need for smart cities to be inclusive.
- The significant majority (72 out of 75) of KPIs can be assessed on a city level. The end-goal of smart city projects is to make an impact on a city level, thus this result is fully justified. Especially regarding environmental, economic, ICT and legal dimensions all KPIs are also addressed on a city level. On the contrary, only 18 KPIs are assessed on an ESU level, while most of them (eight KPIs) are falling under the technical dimension.
- The major group of stakeholders identified that are interested in the implementation of the proposed KPIs (61 out of 75 KPIs) corresponds to the TSPs. This further confirms the crucial role of private sector and prosumers in the successful implementation of smart city solutions. DSOs (37 out of 75 KPIs) are mostly interested in the technical, economic and legal dimensions, whereas consumers, including citizens (49 out of 75 KPIs) and policy-making bodies and governance (49 out of 75 KPIs) are paying significant emphasis on environmental, social and legal dimensions.
- A very high interrelation is observed between the building and set of buildings and ESU and set of ESU levels of assessment, since the same KPIs can be used for assessing both levels.
4. Conclusions and Further Considerations
Author Contributions
Funding
Acknowledgments
Conflicts of Interest
References
- United Nations, Economic and Social Council. Progress towards the Sustainable Development Goals: Report of the Secretary-General; E/2017/66; United Nations Digital library: New York, NY, USA, 11 May 2017. [Google Scholar]
- Eurostat. Urban Europe, Statistics on Cities, Towns and Suburbs, 2016 ed.; Eurostat: Luxembourg, 2016. [Google Scholar] [CrossRef]
- Europa. Available online: https://ec.europa.eu/clima/policies/international/paris_protocol/cities_en (accessed on 11 February 2019).
- United Nations. The Sustainable Development Goals Report 2018; United Nations Publications: New York, NY, USA, 2018; ISBN 978-92-1-101390-0. [Google Scholar]
- Buildings Performance Institute of Europe (BPIE). The Concept of the Individual Building Renovation Roadmap–An in-Depth Case Study of Four Frontrunner Projects; iBRoad: Madrid, Spain, 2018. [Google Scholar]
- European Environment Agency (EEA). Urban Environment. Available online: https://www.eea.europa.eu/themes/urban/intro (accessed on 11 February 2019).
- European Commission. Analyzing the Potential for Wide Scale Roll out of Integrated SMART Cities and Communities Solutions; Report written for DG Energy; European Commission: Brussels, Belgium, 2016; Available online: https://ec.europa.eu/energy/sites/ener/files/documents/d2_final_report_v3.0_no_annex_iv.pdf (accessed on 11 February 2019).
- European Commission. Accelerating Clean Energy Innovation; COM (2016) 763 Final; European Commission: Brussels, Belgium, 2016. [Google Scholar]
- SWD (2016) 414 Final. Commission Staff Working Document, Impact Assessment Accompanying the Document Proposal for a Directive of the European Parliament and of the Council Amending Directive 2010/31/EU on the Energy Performance of Buildings; European Commission: Brussels, Belgium, 2016. [Google Scholar]
- United Nations, General Assembly. Transforming Our World: The 2030 Agenda for Sustainable Development. A/RES/70/1; UN General Assembly; 21 October 2015. Available online: https://www.un.org/en/development/desa/population/migration/generalassembly/docs/globalcompact/A_RES_70_1_E.pdf (accessed on 11 February 2019).
- Monzon, A. Smart cities concept and challenges: Bases for the assessment of smart city projects. In Proceedings of the 2015 International Conference on Smart Cities and Green ICT Systems (SMARTGREENS), IEEE, Lisbon, Portugal, 20–22 May 2015. [Google Scholar]
- Caird, S.; Hudson, L.; Kortuem, G. A Tale of Evaluation and Reporting in UK Smart Cities; The Open University: Main Campus, UK, 2016; p. 51. ISBN 9781473021082. [Google Scholar]
- Silva, B.N.; Khan, M.; Han, K. Towards sustainable smart cities: A review of trends, architectures, components, and open challenges in smart cities. Sustain. Cities Soc. 2018, 38, 697–713. [Google Scholar] [CrossRef]
- Dameri, R.P. Smart City Definition, Goals and Performance. In Smart City Implementation; Progress in IS; Springer: Cham, Switzerland, 2017. [Google Scholar] [CrossRef]
- Marijuan, A.G.; Etminan, G.; Moller, S. Smart Cities Information System: Key Performance Indicator Guide v.2.0.; EU SCIS; 1 February 2017; ENER C2/2013-463/S12.691121. Available online: https://www.smartcities-infosystem.eu/sites/default/files/document/scis_kpi_guide.pdf (accessed on 4 March 2019).
- Bosch, P.; Jongeneel, S.; Rovers, V.; Neumann, H.M.; Airaksinen, M.; Huovila, A. CITYkeys Indicators for Smart City Projects and Smart Cities; CITYkeys, Grant Agreement No. 646440; CITYkeys: Hong Kong, China, 2017. [Google Scholar] [CrossRef]
- Mabe, L.; Vallejo, E.; Hernandez, P.; Quijano, A.; Torre, C.D. Deliverable 1.1: Indicators Tools and Methods for Advanced City Modeling Diagnosis. WP1, T.1.1, June 2018; MatchUP H2020 Project, Innovation Action—Grant Agreement No. 774477. Available online: http://www.matchup-project.eu/wp-content/uploads/2019/03/D1.1.-Indicators-tools-and-methods-for-advanced-city-modelling-and-diagnosis_Final.pdf (accessed on 4 March 2019).
- Quijano, A.; Vasallo, A.; Gallego, M.; Moral, A.; Egusquiza, A. Deliverable 7.2: KPIs Definition. V1.0, WP7, T7.1, July 2016; SmartEnCity H2020 Project, Grant Agreement No. 691883. Available online: https://smartencity.eu/media/smartencity_d7_2_kpis_definition_v1.0.pdf (accessed on 4 March 2019).
- Quijano, A.; Vicente, J.; Paya, I.G.; Azcona, K.U.; Hernandez, P.; Albaina, A.; Tamm, J.; Kikas, M.; Kamenjuk, P.; Sorensen, S.S.; Bernhard, N. Deliverable 7.4: City Impact Evaluation Procedure. V1.0, WP7, T7.1, January 2017; SmartEnCity H2020 Project, Grant Agreement No. 691883. Available online: https://smartencity.eu/media/smartencity_d7.4_city_impact_procedure_v1.0_1.pdf (accessed on 4 March 2019).
- Karvonen, A.; Evans, J. Deliverable 2.1: Common Monitoring and Impact Assessment Framework. V2.0, WP2, T1, February 2017; Triangulum H2020 Project, Grant Agreement No. 646578. Available online: http://www.triangulum-project.eu/wp-content/uploads/2017/12/D2.1_Common_Monitoring_and_Impact_Assessment_Framework__V2.0_.pdf (accessed on 4 March 2019).
- Claesson, J.; Nilsson, A.; Palm, B.; Robert, M.; Shahrokni, H.; Solacolu, A.M.; Wallin, J. Evaluation Plan, Version 13.3; GrowSmarter H2020 Project; 9 May 2017; Ref. Ares (2017) 3094775; Available online: http://www.grow-smarter.eu/fileadmin/editor-upload/Reports/D5.1_Evaluation_plan_WP5.pdf (accessed on 4 March 2019).
- Lombardi, P.; Giordano, S.; Farouh, H.; Yousef, W. Modelling the smart city performance. Innov. Eur. J. Soc. Sci. Res. 2012, 25, 137–149. [Google Scholar] [CrossRef]
- Hara, M.; Nagao, T.; Hannoe, S.; Nakamura, J. New Key Performance Indicators for a Smart Sustainable City. Sustainability 2016, 8, 206. [Google Scholar] [CrossRef]
- Tan, S.; Yang, J.; Yan, J.; Lee, C.; Hashim, H.; Chen, B. A holistic low carbon city indicator framework for sustainable development. Appl. Energy 2017, 185, 1919–1930. [Google Scholar] [CrossRef]
- Girardi, P.; Temporelli, A. Smartainability: A methodology for assessing the sustainability of the smart city. Energy Procedia 2017, 111, 810–816. [Google Scholar] [CrossRef]
- Dall’O, G.; Bruni, E.; Panza, A.; Sarto, L.; Khayatian, F. Evaluation of cities’ smartness by means of indicators for small and medium cities and communities: A methodology for Northern Italy. Sustain. Cities Soc. 2017, 34, 193–202. [Google Scholar] [CrossRef]
- Albino, V.; Berardi, U.; Dangelico, R.M. Smart Cities: Definitions, Dimensions, Performance, and Initiatives. J. Urban. Technol. 2015, 22, 3–21. [Google Scholar] [CrossRef]
- Li, Y.; O’ Donell, J.; Garcia-Castro, R.; Vega-Sanchez, S. Identifying stakeholders and key performance indicators for district and building energy performance analysis. Energy Build. 2017, 155, 1–15. [Google Scholar] [CrossRef]
- Ahvenniemi, H.; Huovila, A.; Pinto-Seppa, I.; Airaksinen, M. What are the differences between sustainable and smart cities? Cities 2017, 60, 234–245. [Google Scholar] [CrossRef]
- IRIS Project. Co-creating Smart and Sustainable Cities. Available online: https://irissmartcities.eu/ (accessed on 4 March 2019).
- ENTSO-E. Overview of Internal Electricity Market Related Project Work; ENTSO-E: Brussels, Belgium, 2014. [Google Scholar]
- Keeble, J.J.; Topiol, S.; Berkeley, S. Using indicators to measure sustainability performance at corporate and project level. J. Bus. Ethics 2003, 44, 149–158. [Google Scholar] [CrossRef]
- Rooijen, T.; Nesterova, N. Deliverable 4.10: Applied framework for evaluation in CIVITAS PLUS II, WP4, May 31 2013; Civitas Wiki Project; Grant Agreement No.: 296081. Available online: https://civitas.eu/sites/default/files/Results%20and%20Publications/civitas_wiki_d4_10_evaluation_framework.pdf (accessed on 7 March 2019).
- Holland, J.; Campbell, J.R. Methods in Development Research: Combining Qualitative and Quantitative Approaches; Practical Action: Dhaka, Bangladesh, 2005. [Google Scholar]
- Pramangioulis, D.; Atsonios, K.; Nikolopoulos, N.; Rakopoulos, D.; Grammelis, P.; Kakaras, E. A methodology for determination and definition of key performance indicators for smart grids development in island energy systems. Energies 2019, 12, 242. [Google Scholar] [CrossRef]
- European Commission, EU Smart Cities Information System. The Making of a Smart City: Replication and Scale-up of Innovation in Europe; European Commission: Brussels, Belgium, 2018. [Google Scholar]
- Winden, W.; Buuse, D. Smart City Pilot Projects: Exploring the Dimensions and Conditions of Scaling Up. J. Urban Technol. 2017, 24, 51–72. [Google Scholar] [CrossRef]
- Calvo, A.R.; Cossent, R.; Frias, P. Scalability and replicability analysis of large-scale smart grid implementations: Approaches and proposals in Europe. Renew. Sustain. Energy Rev. 2018, 93, 1–15. [Google Scholar] [CrossRef]
- Sigrist, L.; May, K.; Morch, A.; Verboven, P.; Vingerhoets, P.; Rouco, L. On Scalability and Replicability of Smart Grid Projects—A case study. Energies 2016, 9, 195. [Google Scholar] [CrossRef]
- Calvo, A.R. Scalability and Replicability of the Impact of Smart Grid Solutions in Distribution Systems. Ph.D. Thesis, Universidad Pontificia Comillas de Madrid, Instituto de Investigacion Tecnologica, Madrid, Spain, 2017. Available online: https://repositorio.comillas.edu/rest/bitstreams/100070/retrieve (accessed on 4 March 2019).
- European Commission, Directorate-General for Energy. Analysing the Potential for Wide Scale Roll-Out of Integrated SCC Solutions; Final Report; European Commission: Brussels, Belgium, June 2016. [Google Scholar]
- +CityxChange Expected Impacts. Available online: https://cityxchange.eu/impact/ (accessed on 4 March 2019).
- STARDUST, The Main Impacts. Available online: http://stardustproject.eu/impacts/ (accessed on 6 March 2019).
- Eto, J.H. Reliability Metrics and Reliability Value-Based Planning. Distribution Systems and Planning Training for New England Conference of Public Utility Commissioners. Available online: https://emp.lbl.gov/sites/default/files/6._170928_necpuc_training_reliability_metrics_and_rvbp.pdf (accessed on 7 November 2018).
- EU Building Stock Observatory database. Available online: https://ec.europa.eu/energy/en/eu-buildings-database (accessed on 6 March 2019).
- GrowSmarter, Targets and Evaluation. Available online: http://www.grow-smarter.eu/solutions/the-targets/ (accessed on 6 March 2019).
- REPLICATE, Objectives. Available online: https://replicate-project.eu/about/objectives/ (accessed on 6 March 2019).
- Covenant of Mayors for Climate and Energy. Available online: https://www.covenantofmayors.eu/ (accessed on 6 March 2019).
- Vulog. What is the Potential Market of Free-Floating Carsharing. Available online: https://www.vulog.com/en/potential-market-free-floating-carsharing/ (accessed on 5 March 2019).
- European Automobile Manufacturers Association. Distribution of EV Charging Points across the EU. Available online: https://www.acea.be/press-releases/article/electric-cars-unrealistic-co2-targets-proposed-by-eu-parliament-ignore-lack (accessed on 6 March 2019).
- SmarterTogether, Expected Results. Available online: https://www.smarter-together.eu/about/expected-results (accessed on 6 March 2019).
- Analysis Associated with the Roadmap to Resource Efficient Europe (European Commission Staff Working Paper, SEC (2011) 1067). Available online: http://ec.europa.eu/environment/resource_efficiency/pdf/working_paper_part1.pdf (accessed on 6 March 2019).
- World Health Organization. WHO Air Quality Guidelines for Particulate Matter, Ozone, Nitrogen Dioxide and Sulphur Dioxide, Global Update 2005, Summary of Risk Assessment; WHO: Geneva, Switzerland, 2006; WHO/SDE/PHE/OEH/06.02. [Google Scholar]
- Nwasinachi, U.; Agunwamba, M.; Agunwamba, J.C. Assessment of noise pollution from electricity generators in a high-density residential area. Afr. J. Sci. Technol. Innov. Dev. 2015, 7, 306–312. [Google Scholar] [CrossRef]
- Sun Electronics. Photovoltaic Systems as an Investment—Payback Period. Available online: https://sunelec.com/cms/rebates-incentives/photovoltaic-systems-as-an-investment-payback-period/ (accessed on 4 December 2018).
- Sinetech. What Is So Great about Solar? Let’s Take a Look. Available online: http://www.sinetech.co.za/news-pv-solar-offers-best-return-on-your-investment.html (accessed on 6 December 2018).
- Artola, I.; Rademaekers, K.; Williams, R.; Yearwood, J. Boosting Building Renovation: What Potential and Value for Europe? Study for the ITRE Committee. Directorate-General for Internal Policies, Policy Department A; Economic and Scientific Policy: Naples, Italy, 2016; IP/A/ITRE/2013-046. [Google Scholar]

| Project Name | Description | Assessment Framework | Ref. |
|---|---|---|---|
| MATCHUP—Maximizing the upscaling and replication potential of high level urban transformation strategies | Based on a citizen-centric approach, MATCHUP demonstrates solutions in the energy, mobility and ICT fields with a view to boost local economies and their quality of life. MATCHUP will deploy large scale demonstration projects in three cities: Valencia (ES), Dresden (DE) and Antalya (TR). | The framework structure designed for the evaluation of the performance of a city is based in the definition of city indicators in four fields (energy efficiency/mobility and transport/ICTs and urban platform/citizens and society), further grouped into 27 domains consisting of 188 indicators. The indicators can be further aggregated into indices. | [17] |
| SmartEnCity—Towards Smart Zero CO2 Cities across Europe | SmartEnCity’s main objective is to develop a highly adaptable and replicable systemic approach for transforming European cities into sustainable, smart and resource-efficient urban environments. The SmartEnCity concept will be implemented in three cities, Vitoria-Gasteiz (ES), Tartu (EE) and Sonderborg (DK). | A procedure is defined which integrates evaluation protocols to estimate the overall impact and performance of solution at city level with the utilization of high level indicators in the energy, transport and ICT sectors. A generalized evaluation plan is available including indicators for city diagnosis (six domains; 149 indicators), to evaluate interventions performance (139 indicators) and quantify the impact at the city level. | [18,19] |
| Triangulum—The Three Point Project/Demonstrate. Disseminate. Replicate. | Triangulum sets to demonstrate, disseminate and replicate solutions for Europe’s future smart cites. The cities of Manchester (UK), Eindhoven (NL) and Stavanger (NO) serve as a testbed for innovative projects focusing on sustainable mobility, energy, ICT and business opportunities. | An approach is followed distinguishing the assessment of impacts of demonstration projects and the process through which they are monitored. A seven-stage methodology for developing impact indicators is proposed. Detailed impact and data mapping tables are available. Five impact domains have been defined: energy, transport, citizen engagement, socioeconomic, financial and ICT. | [20] |
| GrowSmarter—Transforming Cities for a Smart, Sustainable Europe | GrowSmarter aims to stimulate city uptake of smart solutions by using the three cities of Stockholm (SE), Cologne (DE) and Barcelona (ES) as a way to showcase 12 Smart City solutions: from advanced information and communication technology and better connected urban mobility, to incorporating RES directly into the city’s supply network. | The evaluation of the project’s measures is done with the purpose of determining if the expected goals are met and what are the social costs due to the implementation of the measures. The measures are divided into three main categories (low energy districts, integrated infrastructure and sustainable urban mobility) and various sub-categories. For each measure at least one KPI is determined. | [21] |
| Questions for the Evaluation of the 2nd Life Batteries Implementation | Dimension |
|---|---|
| Do they need maintenance often? | Technical |
| Are there any CO2 savings because of their implementation? | Environmental |
| Is their cost per year higher than that of brand-new batteries? | Economic |
| Is the idea publicly accepted or are they not trusted? | Social |
| Do they correlate well with other components in a smart grid? | ICT |
| Is their use accepted by the legal framework? | Legal |
| Level of Evaluation | Description |
|---|---|
| Building | This concerns the energy performance balance of: (a) the delivered energy required to meet the energy needs; and (b) the exported energy. The delivered energy is to be expressed per energy carrier. If part of this delivered energy is allocated to energy export, it also needs to be specified in the data collection where the electricity produced is not used in the building. In this case the corresponding amount of gas allocated to electricity production shall be specified in order to be able to calculate the energy performance of the building. At the building level the data required is (calculation procedure goes from the energy needs to the primary energy): (a) Energy needs per area of application; (b) energy technologies supplying these energy needs; (c) energy storage units; and (d) delivered energy to each energy supply units expressed per energy carrier. |
| Set of Buildings | The assessment for a set of buildings is done by the aggregation of building units. The indicators can then be calculated for the sum of the buildings as a group. |
| Energy Supply Unit (ESU) | At the ESU level, the approach to be followed is similar to the building level. Delivered energy per energy carrier and output energy allocated to energy carrier need to be specified. Additionally, and depending on the energy supply unit, different indicators can be calculated. This evaluation level refers to building integrated energy supply units as well as large-scale energy supply units. |
| Set of Energy Supply Units | The assessment for a set of ESU is done by the aggregation of energy supply units. The indicators can then be calculated for the sum of the energy supply units. |
| Neighbourhood | This level of evaluation (area or neighbourhood) is composed by the aggregation of different entities. The energy flows at this point need to be defined. The following information is required to define the energy system: (a) Energy carriers used at the implementation area level and the primary energy factors corresponding to this area; (b) demonstration units involved (buildings, energy supply units, storage units and distribution systems); (c) delivered energy to each ESU and building allocated to the corresponding energy carrier; (d) output energy of each ESU and, if applicable, output energy exported out of the boundary allocated to the amount of delivered energy carrier; and (e) energy flows between technologies and buildings (which ESU is supplying which building or ESU). Due to the complexity of these systems, indicators can only be calculated if a full set of data is available. |
| City | Most smart city projects demonstrate solutions in city environment (the approach to be followed is similar to the neighbourhood but on a wider scale). Evaluation at a national level may be needed for the legal performance indicators. |
| Domain | Scalability | Replicability |
|---|---|---|
| Technology | Modularity, maturity of technology, network support, interface | Standardization of the technology, maturity of the technology, interoperability, network support |
| Socio-cultural | Social compatibility/consent, Interaction | Social compatibility/acceptance, market demand/response to citizenry needs, IT literacy level |
| Political–Institutional | Regulatory environment, institutional support, ecosystem | Need to change in rules and regulations, Regulatory environment, institutional support, ecosystem |
| Economic/Business | Possibility to achieve economies of scale, profitability | Macro-economic factors, business model, market design |
| Name of KPI | Definition/Description | KPI Formula | Unit | Level of Assessment 1 | Relevant Stakeholders 2 | Indicative KPI Threshold/Targets 3 |
|---|---|---|---|---|---|---|
| 1.1: Degree of energetic self-supply by RES | The ratio of locally produced energy from RES and the energy consumption over a period of time (e.g., month, year). DE is separately determined for thermal (heating or cooling) energy and electricity. | DET/E = Degree of thermal/electrical energy self-supply based on RES LPET/E = Locally produced thermal/electrical energy TEC/EEC = Thermal/electrical energy consumption (monitored) | % | C, D, E, F | I, II, III | EU 2030 target: >27% +CITYXCHANGE [42]: 47.7% STARDUST [43]: 62% (49% on electricity) |
| 1.2: Reduced energy curtailment of RES and DER | Reduction of energy curtailment due to technical/operational problems. | EnI = Energy not Injected | % | C, D, E, F | I, III | +CITYXCHANGE: <1% |
| 1.3: Average number of electrical interruptions per customer per year | The total number of customer interruptions (numerator) divided by the total number of customers served (denominator). The result shall be expressed as the average number of electrical interruptions per customer per year. | NEIav = Avg number of electrical interruptions per customer per year NCItot = Total number of customer interruptions NCtot = Total number of customers served | #/year | E, F | I, II | <1.5 interruptions/year [44] |
| 1.4: Average length of electrical interruptions (in hours) | The sum of the duration of all customer interruptions in hours (numerator) divided by the total number of customer interruptions (denominator). The result shall be expressed as the average length of electrical interruptions in hours. | DEIav = Average length of electrical interruptions in hours DCItot = Sum of the duration of all customer interruptions in hours NCItot = Total number of customer interruptions | hours | E, F | I, II | <2.5 h per customer per year [44] |
| 1.5: Energy Demand and Consumption | The energy entering the system in order to keep operation parameters (e.g., comfort levels). The energy demand is based on the calculated figures and the energy consumption is based on the monitored data. This indicator can be used to assess the energy efficiency of a system. | Ed/C = Energy demand/consumption (simulated/monitored) TEd/C = Thermal energy demand/consumption (simulated/monitored) EEd/C = Electrical energy demand/consumption (simulated/monitored) Ab = Floor area of the building [m2] | kWh/(m2∙month) kWh/(m2∙year) | ALL | I, III, IV | <158.76 kWh/m2∙year (observed consumption of EU28 residential stock in 2014) [45] |
| 1.6: Energy Savings | The reduction of the energy consumption to reach the same services (e.g., comfort levels) after the interventions, taking into consideration the energy consumption from a reference period. | EST/E = Thermal/Electric energy savings TEC/E = Thermal/Electric energy consumption of the demonstration-site ERT/E = Thermal/Electric energy reference demand or consumption (simulated or monitored) of demonstration-site | % | ALL | I, II, III | EU 2030 target: >27% GROWSMARTER [46]: 60% REPLICATE [47]: 56% STARDUST: 58% |
| 1.7: Smart Storage Capacity | Includes all the energy storage technologies integrated in the city smart grid containing electricity, heating and mobility. This KPI presents the impact in the use of smart energy storage systems. | % | D, E, F | I, III | Highly depends on applied solutions | |
| 1.8: Battery Degradation Rate | The capacity losses of the batteries used in project, through use (some cycles) and through time (some years). The conclusions of this KPI concern the effectiveness of this technology, the need for maintenance and, thus, gives useful data concerning the financial feasibility of its integration. | BDRC = BDR per cycle BDRY = BDR per year BC0 = initial battery capacity BCn = battery capacity after n cycles n = number of cycles Y = number of years | % | C, D | I, II, III | Highly depends on applied solutions-technologies |
| 1.9: Storage Energy Losses | The energy losses because of battery storage, including the added voltage transformations. The conclusions of this KPI gives useful data concerning the financial feasibility of its integration. | Einput = the energy input in a piece of energy storage equipment Eoutput = the energy output of a piece of energy storage equipment | % | A, B, C | I, II, III | Highly depends on applied solutions-technologies |
| 1.10: Maximum Hourly Deficit (MHDx) | The maximum ratio of the difference between load and on-site renewable energy generation to load for each energy type. It is calculated taking the largest value of those ratios calculated for each hour of the year, for those hours when local renewable supply is smaller than the demand. | If: | No unit | A, B, E, F | I, II, III | Highly depends on applied solutions-technologies |
| 1.11: Technical Compatibility | An indication of the technical compatibility of the smart city solution, meaning the extent to which the solution fits with current practices, administrative and existing technological standards/infrastructures. | Five-point Likert scale (No unit) | ALL | I, III, IV | Very high: no adjustments are needed; immediate implementation. | |
| 1.12: Improved Interoperability | Interoperability is the ability of a system (or product) to work with other systems by providing services to and accepting services from other systems and to use the services so exchanged to enable them to operate effectively together (ISO/TS 37151). The indicator assesses the improvement in interoperability in a qualitative manner. | Five-point Likert scale (No unit) | ALL | I, III | Excellent: the project increases interoperability extensively. | |
| 1.13: Energy consumption data aggregated by sector fuel | Energy consumption of the mobility sector. It should be assessed for public transport (before and after) as well as for private vehicles (before and after). | EnC: Energy Consumption | GJ | E, F | I, III, IV | Highly depends on city profile. Relevant values for municipalities are available in their SEAP [48] |
| 1.14: Free Floating subscribers | The successful implementation of a free-floating car-sharing system mostly depends on the use of the vehicles, which is highly related to the service subscribers. This indicator assesses the increase in the number of subscribers to the free-floating car-sharing service. | # | A, B, E, F | III, IV | 60,000 per city (rough estimation considering that there are currently 3 M subscribers corresponding to 50 cities) [49] | |
| 1.15: Yearly km made through the e-car sharing system instead of private conventional cars | The key element of a car-sharing system is the usage of the system, not only in terms of users but in terms of kilometres. This indicator will assess the number of kilometres done using the car-sharing service. | km/year | A, B, E, F | III, IV | 9 M km/year (considering KPI 1.16 and an average annual travel per car-sharing vehicle of 15,000 km) | |
| 1.16: Number of efficient vehicles deployed in the area | A car-sharing system needs a critical number (mass) of vehicles in order to be useful for the users. This indicator assesses the level of service offered by measuring the number of efficient vehicles in the area. | vehicles/km2 | E, F | II, III, IV | >600 vehicles (rough estimation considering that there are currently 30,000 shared cars corresponding to 50 cities) [49] | |
| 1.17: Number of EVs charging stations and solar powered V2G charging stations deployed in the area | Charging infrastructure development is critical for the promotion of electromobility and the deployment of EVs. This indicator assesses the level of service with regards to charging capabilities offered by measuring the number of electric vehicles charging stations deployed in the area. Additionally, it measures the number of solar powered V2G stations comparing it with the total number of stations. | stations/km2, % | E, F | ALL | This value highly depends on the country of the smart city [50] REPLICATE: >200 EV units; 228 charging points | |
| 1.18: Improved flexibility of service delivery following citizen feedback phases | This KPI measures the improved flexibility of service delivery following citizen feedback phase(s). | Five-point Likert scale (No unit) | E, F | III, IV | n/a | |
| Name of KPI | Definition/Description | KPI Formula | Unit | Level of Assessment 1 | Relevant Stakeholders 2 | Indicative KPI Threshold/Targets 3 |
|---|---|---|---|---|---|---|
| 2.1: Carbon dioxide Emission Reduction | CO2 accounts for a major share of Greenhouse Gas emissions in urban areas. The main sources for CO2 emissions are combustion processes related to energy generation and transport. CO2 emissions can therefore be considered a useful indicator to assess the contribution of urban development on climate change. | Edel,i = the delivered energy for energy carrier i Eexp,i = the exported energy for energy carrier i Kdel,i = the CO2 coefficient for delivered energy carrier i Kexp,i = the CO2 coefficient for exported energy carrier i | tones/year, % | ALL | ALL | EU 2030 target: >40% +CITYXCHANGE: 12,801 tonnes/year GROWSMARTER: 60% SMARTER TOGETHER [51]: 50–60% |
| 2.2: Increase in Local Renewable Energy Generation | The share of RE production in itself gives an idea of the rate of self-consumption of locally produced energy, which is an indicator of the flexibility potential of the local energy system. The indicator account for the increase of the renewable energy generation due to the intervention. | LRE(H)G = Annual Local Renewable Electricity (Heating/Cooling) Generation E(H)RES = Annual electricity (Heating/Cooling) generated by RES E(H)C = Annual Electricity (Heating/Cooling) consumption | % | C, D, E, F | I, IV | EU 2030 Target: 27% STARDUST: 62% |
| 2.3: Increased efficiency of resources consumption | This KPI measures the percentage reduction in material consumption of the project/initiative. | ERC = Percentage reduction in material consumption of the project CMB = Baseline material consumption of the project [t] CMF = Final material consumption of the project [t] CMBF = Baseline final material consumption [t] | % in tonnes | A, B, E, F | II, III, IV | >20% (considering a Factor 5 of improvement to respond adequately to global trends) [52] |
| 2.4: Reduction in annual final energy consumption | The final energy consumption of the project taking into account all forms of energy (e.g., electricity, gas, heat/cold, fuels) and for all functions (transport, buildings, ICT, industry, etc.). The final energy consumption is the energy actually consumed by the end-user. | RECAF = Percentage of the decrease in energy consumption caused by the project EBtot = Total use of energy per year (kWh) on-site or within the project boundaries before the project EAtot = Total use of energy per year (kWh) on-site or within the project boundaries after the project | % | A, B, E, F | ALL | EU 2030 Target: 27% STARDUST: 58% |
| 2.5: Decreased emissions of Particulate matter | This KPI measures the percentage reduction in PM10 and PM2.5 emissions achieved by the project/initiative. | % | E, F | ALL | End-goal to reach 20 and 10 μg/m3 annual mean concentration for PM10 and PM2.5 respectively (World Health Organization [53]) | |
| 2.6: Decreased emission of nitrogen oxides (NOx) | This KPI measures the percentage reduction in NOx emissions (NO and NO2) achieved by the project/initiative. | % | E, F | ALL | End-goal to reach 40 μg/m3 annual mean concentration for NO2 (World Health Organization (WHO) guidelines) | |
| 2.7: Noise pollution | Prolonged exposure to noise can lead to significant health effects. Urban environmental noise pollution relates a lot to noise caused by traffic. This KPI measures the noise levels before and after the activities of the project/initiative. | (dB level before/dB level after) × 100 | dB level, % | E, F | ALL | <50 dB (WHO guidelines for residential areas) [54] |
| Name of KPI | Definition/Description | KPI Formula | Unit | Level of Assessment 1 | Relevant Stakeholders 2 | Indicative KPI Threshold/Targets 3 |
|---|---|---|---|---|---|---|
| 3.1: Payback | The payback period is the time it takes to cover investment costs and is usually considered to assess risks. Investments with a short PBP are considered safer than those with a longer one. | Type A static: m can be calculated as average annual costs in use savings (€/a) 𝐸𝑃𝐼𝐵𝑅 (€) = Energy-related investment Dynamic Types can be also applied. | years | ALL | I, III | Highly depends on applied solutions (e.g., 5–20 years for PVs [55]) STARDUST: 2–7 years |
| 3.2: Return on Investment (ROI) | ROI enables the evaluation of the feasibility of an investment or the comparison between different possible investments. It is defined as the ratio between the total incomes/net profit and total investment of the project. | ROIT = Return on Investment (%) 𝑇 = Duration of the economic analysis period: T = 10, 15 and 20 [yr] | % | ALL | I, III | Highly depends on applied solutions (e.g., >20% for PVs [56]). Typical values are: 2–5% STARDUST: 9–44% |
| 3.3: Reduction of energy cost | This KPI can assess the economic benefits of a scheduling strategy for prosumers coordinated by an aggregator. The KPI measures the cost of the energy traded by an aggregator, both as a baseline and when ICT are implemented. | COST = the electricity price at a given period of time | % | ALL | I, II, III | In relevance with the total energy savings goals |
| 3.4: Total Investments | An investment is defined as an asset or item that is purchased or implemented with the aim to generate payments or savings over time. | EPIER = Total investment for all interventions related to energy aspects per conditioned area [€/m2] IER = Total investment (€) Ad = Total floor area of the system renovated [m2] | €/m2 or €/kW | ALL | I, II, III | Highly depends on applied solutions |
| 3.5: Total Annual costs | The total annual costs are defined as the sum of capital-related annual costs, requirement-related, operation related costs and other costs. The total annual costs are related to the considered interval of time (year). To make different objects comparable the same types of costs have to be included in the calculation. | 𝑇𝐴𝐶i = Total annual energy cost of the system after the intervention (i.e., energy, operation & maintenance, financial) for year i (€/year) 𝐶𝐸 Total annual cost of the system supply (€/year) 𝐶𝑂&𝑀 Total annual cost of the operation and maintenance of the facility (€/year) 𝐶𝐹 Total annual financing cost, if applies (€/year) | €/year | ALL | I, II, III | Highly depends on applied solutions |
| 3.6: Financial benefit for the end-user | One dimension of value creation by the smart city projects/initiatives is the extent to which they generate cost savings for end-users. Cost savings can be generated, for example, through a reduction in energy use, the generation of renewable energy on site, or reduction in housing costs. | Financial benefit = TotalCostref − TotalCostR and I | €/household/year | A, B, E, F | II, IV | >1700€/household/year (considering energy savings of at least 50%—see KPI 1.5—a median cost per unit of energy for households across the EU28 to be 0.24 €/kWh [57] and annual energy consumption for all end-uses is 14,318 kWh per active dwelling (2014 data) [45] |
| 3.7: Grants | Grants are non-repayable funds that a grant maker, such as the government, provides to a recipient, e.g., a business, for ideas and projects to provide public services and stimulate the economy. | GrER Share of the investment in energy retrofitting that is covered by grants (%) GER Total grants received for the energy retrofitting of the district (€) IER Total investment for all the interventions related to energy retrofitting (€) | % | ALL | II, III, IV | Highly depends on applied solutions |
| 3.8: Fuel poverty | The indicator is derived from the UK definition, according to which households are considered as energy poor if their energy bill consumes 10% or more of the household income. This KPI measures the change in percentage points of (gross) household income spent on energy bills. | percentage point change in income spent | % | A, B, E, F | ALL | 100% (cut off energy bills by half) |
| 3.9: CO2 reduction cost efficiency | Costs in euros per ton of CO2 saved per year. Many smart city projects are intrinsically aimed at reducing the amount of CO2 emitted during their lifetime. Those projects which prove to be able to significantly reduce their carbon footprint, whilst keeping the related costs at a minimum, are considered to be interesting projects for up scaling. | This indicator is calculated on an annual basis, taking the annual reduction in CO2 emissions, and the annual costs of the project (which is the annualised investment plus current expenditures for a year). Note: Only the additional costs for energy/CO2 related measures (to the extent discernible) are taken into account in the total costs’ calculation. | €/(ton of CO2 × year) | A, B, E, F | I, III, IV | Highly depends on applied solutions |
| 3.10: Stimulating an innovative environment | The extent to which the project is part of or stimulates an innovative environment. A project can stimulate an environment that enhances innovations, either by being part of it or by contributing to it. | Five-point Likert scale (No unit) | E, F | III, IV | Excellent: the project is an essential part of and stimulates an innovative environment. | |
| 3.11: Awareness of economic benefits of reduced energy consumption | This KPI measures the awareness of economic benefits of reduced energy consumption | % | E, F | II | n/a | |
| Name of KPI | Definition/Description | Unit | Level of Assessment 1 | Relevant Stakeholders 2 | Indicative KPI Threshold/Targets 3 |
|---|---|---|---|---|---|
| 4.1: Consumers’ engagement | The implementation of ICT solutions can also be related to the involvement of the users in the control over the energy use in the building. This KPI includes the number of final users involved and/or the number of people with increased capacity. | # | A, B, E, F | II, III, IV | n/a |
| 4.2: Professional stakeholder involvement | The extent to which professional stakeholders outside the project team have been involved in planning and execution. In this context, relevant stakeholders may include: industry or business associations, local councils, government departments, politicians, environmental organisations, architects, project developers. | Five-point Likert scale (No unit) | E, F | III, IV | High involvement: stakeholders are actively involved on an almost day-to-day basis in developing the project plan and advising on its implementation. |
| 4.3: Social Compatibility | The extent to which the project’s solutions fit with people’s ‘frame of mind’ and do not negatively challenge people’s values or the ways they are used to do things. If an innovation requires people to significantly think differently its implementation in society will be more difficult. | Five-point Likert scale (No unit) | E, F | II, IV | Very high: the solution does not differ from the usual way of doing things in operational sense and is fully consistent with existing norms. |
| 4.4: Ease of use for end users of the solution | The extent to which the solution is perceived as difficult to understand and use for potential end-users. It is presumed that a smart city solution that is easy to use and understand will be more likely adopted than a difficult solution. | Five-point Likert scale (No unit) | E, F | II, III, IV | Very easy: the solution is easy to understand and use. |
| 4.5: Advantages for end-users | The extent to which the project offers clear advantages for end users. The advantage can take many forms, for instance cost savings, improved quality and increased comfort. It is presumed that solutions which have a higher level of advantages to end users will be more likely to be adopted than solutions which have negative or no advantages. | Five-point Likert scale (No unit) | E, F | II, III, IV | Very high advantage: The project offers a very high advantage to end users as the applied technologies have a direct and a positive effect on them. |
| 4.6: Advantages for stakeholders | The extent to which the project offers clear advantages for stakeholders. This advantage could, for example, be ease of management or reduced maintenance costs. | Five-point Likert scale (No unit) | ALL | I, III, IV | Very high advantage: The project offers a very high advantage to stakeholders as the applied technologies have a direct and an extremely positive effect on them. |
| 4.7: People reached | Percentage of people in the target group that have been reached and/or are activated by the project. A Smart City project is usually most successful if the entire target group of a service participates. | % | E, F | II, III, IV | >75% (own estimations) |
| 4.8: Thermal comfort | The quality of the delivered heating/cooling service is certainly a matter of technical aspects that can be measured with quantified technical indicators, but also a matter of the opinion of the service receivers. | Five-point Likert scale (No unit) | A, B, E | II, III | Very satisfying thermal comfort |
| 4.9: Increased environmental awareness | Awareness of environmental problems is important for creating support for environmental projects and programs. This indicator assesses the extent to which the project has used opportunities for increasing environmental awareness and educating about sustainability and the environment. | Five-point Likert scale (No unit) | E, F | II, III, IV | Excellent: relevant were taken into account in the project communication; the project utilized every possibility to address this issue. |
| 4.10: Increased consciousness of citizenship | The extent to which the project has contributed in increasing consciousness of citizenship. Consciousness of citizenship is the awareness (consciousness) of one’s community, civic rights and responsibilities and as such contributes to the sense of community. | Five-point Likert scale (No unit) | E, F | II, III, IV | High: increasing civic consciousness was (one of) the main goals of the project and has done substantial effort to enhance it. |
| 4.11: Increased participation of vulnerable groups | Vulnerable and other groups whose opinions or contributions are not reflected well enough in our society (like women, minorities and the disabled), require special attention to be included in the community, thereby enhancing social cohesion and diversity. | Five-point Likert scale (No unit) | E, F | II, III, IV | Excellent: Participation of groups not well represented in society has clearly been improved due to the project. |
| 4.12: Local job creation | One of the pillars of the smart city projects is to improve the economy by reducing costs and energy, but also by fostering the local economy and the local eco-systems. This indicator assesses the creation of direct jobs from the implementation and operation of the respective solutions. | # | A, B, E, F | II, IV | +CITYXCHANGE: 900 SMARTER TOGETHER: 1400GROWSMARTER: 1500 |
| 4.13: Local community involvement in the implementation phase | The extent to which residents/users have been involved in the implementation process. | Five-point Likert scale (No unit) | E, F | II | Community self-development: the project planners have empowered community actors to manage the project implementation and evaluate the results. |
| 4.14: Increased citizen awareness of the potential of smart city projects | Measures the increased citizen awareness of the socio-cultural potential of smart city projects. | Five-point Likert scale (No unit) | E, F | II | n/a |
| 4.15: Number of city officials and urban experts trained to conduct the meaningful and ethical engagement of citizens | Measures the number of city officials and urban experts trained to conduct the meaningful and ethical engagement of citizens. | # | E, F | IV | n/a |
| 4.16: Provision of a localised multi stakeholder co-creation and co-production Field Guide for Citizen Engagement activities | Measures the provision of a localised multi stakeholder co-creation and co-production Field Guide for Citizen Engagement activities (number of co-creation objects added to field guide). This is the direct aim of the Citizen Engagement approach. | # | E, F | II | n/a |
| 4.17: Participation of citizens, citizen representative groups and citizen ambassadors in the co-creation of local/micro KPIs for Citizen Engagement for Smart Cities | Measures the participation (number) of citizens, citizen representative groups and citizen ambassadors in the co-creation of local/micro KPIs for Citizen Engagement for Smart Cities | # | E, F | II | n/a |
| Name of KPI | Definition/Description | KPI Formula | Unit | Level of Assessment 1 | Relevant Stakeholders 2 | Indicative KPI Threshold/Targets 3 |
|---|---|---|---|---|---|---|
| 5.1: Peak load reduction | Peak load is the maximum power consumption of a building or a group of buildings to provide certain comfort levels. With the correct application of ICT systems, the peak load can be reduced on a high extent and therefore the dimension of the supply system. | % | A, B, E, F | I, III | n/a | |
| 5.2: Number of customers that are positive about how energy systems are controlled | All the end-users involved in the demonstrations are asked whether they are satisfied with the provided services including the ICT systems. This is done with a yes/no question and the value of the indicator is given by the percentage of satisfied end-users. | % | A, B, E, F | II, III, IV | n/a | |
| 5.3: Reliability | With the application of ICT measures it is possible to correct a potential misbehaviour of the system and avoid unexpected stops. | % | C, D, E, F | II, III | n/a | |
| 5.4: Increased system flexibility for energy players | The ability of the system to respond to—and stabilize/balance—supply and demand in real-time, as a measure of the demand side participation in energy markets-energy efficiency intervention. | 𝑆𝐹 is the amount of load capacity participating in demand side management. | %, W/€ | E, F | I, III | n/a |
| 5.5: Increased hosting capacity for RES, EVs and other new loads | This KPI is intended to give a statement about the additional loads that can be installed in the network, when R and I solutions are applied, and compared to the BAU scenario. | EHC: the enhanced hosting capacity of new loads when R and I solutions are applied with respect to BAU scenario. HC: the additional hosting capacity of new loads applied with respect to currently connected generation (GW or MW). | % | E, F | I, II, III | n/a |
| 5.6: Impact of ICT apps into mobility | Impact of ICT apps into switching from non-sustainable mobility into sustainable mobility, this is, change on modal split. | % | E, F | III, IV | n/a | |
| 5.7: Developer engagement | Measures the use of open datasets by developers (Number of API calls per month). Developers are important stakeholders in the open data market. It is important to gain insight in the variety, importance and value of data used and not used by the developers. | # | F | III | n/a | |
| 5.8: Data safety | Number of blocked malicious hacking attempts. From DDoS to someone taking control of the servers, the risks are diverse. | # | F | II, III, IV | n/a | |
| 5.9: Data loss prevention | Lost data points in a period. Managing data brings a lot of opportunities but also some safety issues. To know if data has been stolen, leaked or otherwise distributed it is important that monitoring is in place. | # | F | II, III, IV | n/a | |
| 5.10: Usage of open source software | The use of open source software means less possibilities of vendor lock-in and more space for communities to develop together smart city solutions. It also lowers the software costs. | Five-point Likert scale (No unit) | F | III, IV | n/a | |
| 5.11: Expiration date of open data | Percentage of out-dated datasets on a city platform per timeframe. Open data can become out-dated and obsolete, which acts negatively on the attractiveness of using data from platforms. By monitoring the expiration dates of the data, the owner gets a message to renew or remove the datasets. | % | F | III, IV | n/a | |
| 5.12: Quality of open data | Percentage of data that uses DCAT standards. The quality of open data is better if standardized. Processes get easier when data standards are applied. The DCAT standard allows municipal employees to produce data in a standardized way. | % | F | III, IV | n/a | |
| 5.13: Platform downtime | Downtime per timeframe. To run a stable platform, monitoring is required to fix bugs and quickly improve the software environments. | Minutes/(h, d, w, m) | F | III, IV | n/a | |
| 5.14: Open data based solutions | Number of services based on open data. To gain insight of the use of open data, mapping the applications developed based on the open data is vital. | #/(month, year) | F | II, III, IV | n/a | |
| 5.15: Number of active ‘touch points’ identified | Measures the number of active ‘touch-points’ identified where citizens have a degree of interaction with solution. This is the basis for distinguishing communication and CE activities and for prioritising and mapping suitable activities to each IS. | # | E, F | II, IV | n/a | |
| Name of KPI | Definition/Description | Unit | Level of Assessment 1 | Relevant Stakeholders 2 | Indicative KPI Threshold/Targets 3 |
|---|---|---|---|---|---|
| 6.1: Green Building self-consumption Legal Framework Compatibility | The level of suitability of the legal framework for the integration of self-consumption RES generation solutions in buildings. | Five-point Likert scale (No unit) | F | ALL | Full legal support: The legal framework fully approves the integration of the proposed solution. |
| 6.2: Symbiotic waste heat Legal Framework Compatibility | The level of suitability of the legal framework for the integration of symbiotic waste heat solutions. | Five-point Likert scale (No unit) | F | ALL | Full legal support (see above) |
| 6.3: Energy flexibility policies Legal Framework Compatibility | The level of suitability of the legal framework for the integration of energy flexibility policies such as incentives for peak-shaving. | Five-point Likert scale (No unit) | F | ALL | Full legal support (see above) |
| 6.4: Smart EVs Legal Framework Compatibility | The level of suitability of the legal framework for the integration of private EVs and public transport EVs in the city mobility policies. | Five-point Likert scale (No unit) | F | ALL | Full legal support (see above) |
| 6.5: City platform Legal Framework Compatibility | The level of suitability of the legal framework for the integration of a web city platform for the energy management and citizen engagement. This takes into account not only whether the platform is permitted, but also what measurements are taken in order to maintain system security and privacy. | Five-point Likert scale (No unit) | F | ALL | Full legal support (see above) |
| 6.6: Change in rules and regulations | It shows the extent to which the project is able to change the context in which they were applied, by providing a different interpretation of existing rules and regulations. The change in local rules has an important signalling function which can inspire a new interpretation of the rules in other locations. | Five-point Likert scale (No unit) | F | ALL | High impact: Project has led to a public discussion, leading to a change in rules and regulations. |
| 6.7: Measure extent to which privacy by design is ensured | Measures the extent (number of measures) to which privacy by design has been ensured. Trust is paramount to the adoption of smart city solutions, which must fully respect individual freedom and the right to privacy. | # | F | III, IV | n/a |
© 2019 by the authors. Licensee MDPI, Basel, Switzerland. This article is an open access article distributed under the terms and conditions of the Creative Commons Attribution (CC BY) license (http://creativecommons.org/licenses/by/4.0/).
Share and Cite
Angelakoglou, K.; Nikolopoulos, N.; Giourka, P.; Svensson, I.-L.; Tsarchopoulos, P.; Tryferidis, A.; Tzovaras, D. A Methodological Framework for the Selection of Key Performance Indicators to Assess Smart City Solutions. Smart Cities 2019, 2, 269-306. https://doi.org/10.3390/smartcities2020018
Angelakoglou K, Nikolopoulos N, Giourka P, Svensson I-L, Tsarchopoulos P, Tryferidis A, Tzovaras D. A Methodological Framework for the Selection of Key Performance Indicators to Assess Smart City Solutions. Smart Cities. 2019; 2(2):269-306. https://doi.org/10.3390/smartcities2020018
Chicago/Turabian StyleAngelakoglou, Komninos, Nikos Nikolopoulos, Paraskevi Giourka, Inger-Lise Svensson, Panagiotis Tsarchopoulos, Athanasios Tryferidis, and Dimitrios Tzovaras. 2019. "A Methodological Framework for the Selection of Key Performance Indicators to Assess Smart City Solutions" Smart Cities 2, no. 2: 269-306. https://doi.org/10.3390/smartcities2020018
APA StyleAngelakoglou, K., Nikolopoulos, N., Giourka, P., Svensson, I.-L., Tsarchopoulos, P., Tryferidis, A., & Tzovaras, D. (2019). A Methodological Framework for the Selection of Key Performance Indicators to Assess Smart City Solutions. Smart Cities, 2(2), 269-306. https://doi.org/10.3390/smartcities2020018