Article

CitySpeed: A Crowdsensing-Based Integrated Platform for General-Purpose Monitoring of Vehicular Speeds in Smart Cities

1
Department of Technology, State University of Feira de Santana, Feira de Santana 44036-900, Brazil
2
Applied Computing Graduation Program, State University of Feira de Santana, Feira de Santana 44036-900, Brazil
3
Digital Metropolis Institute, Federal University of Rio Grande do Norte, Natal 59078-970, Brazil
*
Author to whom correspondence should be addressed.
Smart Cities 2019, 2(1), 46-65; https://doi.org/10.3390/smartcities2010004
Submission received: 13 January 2019 / Revised: 28 January 2019 / Accepted: 29 January 2019 / Published: 1 February 2019
(This article belongs to the Special Issue Camera Sensors in Smart Cities)

Abstract

:
The development of crowdsensing-based technologies has allowed for the use of smartphones in large-scale data collection for different scopes of applications, mostly in a transparent and ubiquitous way. When concerning urban areas and smart city initiatives, the collection and further analysis of information about the highest number of vehicles is of paramount importance, potentially supporting more efficient mobility planning and management actions in modern cities. In this context, this article proposes a public general-purpose platform for acquisition and visualization of vehicular speeds, which can then be exploited by any additional application. For that, a crowdsensing-based mobile software application was developed to collect instantaneous speeds provided by smartphone GPS, formatting and distributing this information to a database system. Such historical data can then be exported or visualized through a web-based comprehensive interface, which provides valuable data when planning traffic mobility in cities; for example, indicating areas with heavier traffic over a certain time period. Therefore, allowing the use of many different search filters and supporting data delivery in the JSON format, the CitySpeed platform can provide services not supported by popular applications, such as Waze and Google Maps, and potentially assist smart city initiatives in this area.

1. Introduction

The growth of cities and urban centers has brought complex challenges, in terms of the planning and management of energy resources, mobility, pollution, and safety, demanding technological solutions in many different areas [1,2]. In reality, initiatives to promote a better quality of life in large cities may not be easy to implement due to many factors, but new technologies can play an important role when providing mechanisms to support them [3,4]. In this context, innovative crowdsensing-based solutions are gaining attention, and may facilitate the manner in which large amounts of data are acquired and processed. As a result, this paradigm provides an effective resource that can accelerate some of the expected transformations promised by the construction of smart cities [5].
In recent years, smart city initiatives have become a reality, with solutions being developed for many different common challenges in modern cities [6,7]. For these scenarios, data acquisition, storage, and processing are crucial when implementing different smart-city applications, and there are many ways to perform such actions. First, the advent of Internet of Things technologies and the maturation of wireless sensor networks have created some of the fundamentals for providing sensed data to a lot of applications [8,9]. On the other hand, the widespread use of smartphones and 4G/5G communication technologies have also provided a wealthy environment for distributed data acquisition. The availability of large amounts of data has paved the way for the construction of smart-city applications, since “data” are a crucial asset for improved planning and management of urban areas.
A consolidated data source for smart cities and generic people-centric applications is provided by the “crowdsensing” paradigm [10]. The paradigm is centered on the premise that a number of users can collaboratively and spontaneously provide some kind of data for further processing in applications, in a low-cost and potentially mobile way. For an increasing number of smart-city applications, crowdsensing-based approaches have been used as a reliable and efficient source of data [5].
The crowdsensing paradigm is based on the idea of “collaboration” [5]. In general, people using a particular service (e.g., a smartphone app) provide data and receive, in exchange, a “benefit”; for example, information about how to avoid roads with heavy traffic, or indications of where to shop cheaper. Actually, this principle is self-beneficial, in the sense that people contribute data which may benefit themselves in different ways, and this “reward” is the main motivation for the adoption of such a paradigm by the users. Moreover, the principle of portability is largely exploited in modern crowdsensing-based applications, allowing different platforms to run the same application on multiple devices and to provide real-time data [5,11].
A highly relevant issue in large cities is urban mobility. In fact, this issue is strongly related to the way of living in cities and it directly impacts the perceived quality of life by the inhabitants of the city. In recent years, some traffic management solutions have arisen, exploiting different technologies. For the particular case of crowdsensing, some applications were developed around this paradigm, becoming popular solutions and fostering new investments in this area.
Crowdsensing-based applications for smart cities may exploit different types of data. Among them, information about the speed at which vehicles travel in lanes in a particular region can be used to understand the overall behavior of the city from different perspectives. In short, the following information may be inferred when speed data are processed:
  • Traffic load: The monitoring of traffic conditions in order to verify and to monitor vehicle speeds is an important service in urban centers, but it is also a complex task. This is due, among other factors, to the presence of various traffic elements (pedestrians, motor vehicles, and non-motorized vehicles), often on a large scale. This problem encourages the development of mechanisms to estimate the traffic load and to predict it;
  • Traffic planning: Efficient mobility planning is achieved when the traffic load is known, allowing modifications in the traffic flows and also advising the construction of new roads, bridges, and viaducts. For this, historical traffic information is highly required;
  • Pollution: Large cities are subject to high levels of pollution, most of it produced by motorized vehicles [12,13]. As traffic increases pollution, efficient traffic management becomes even more necessary [14].
Through (mobile) crowdsensing, a large amount of data can be collected during the daily activity of people, with a very low impact on their device performance and, ideally, in a ubiquitous way. As people usually carry their mobile (smart)phones while they are moving in vehicles (as drivers or riders), information about the vehicle speeds can be acquired, allowing analyses that can better support traffic management and planning in urban areas.
Crowdsensing for traffic monitoring is not a novelty, and popular application tools as Google Maps [15] and Waze [16] already perform some of the mentioned services. However, although such applications are useful for their users, they are not useful for traffic planning and management in a broader scale; for example, they are not helpful for a traffic engineer to improve traffic in a city, as they do not present historical data.
This article, then, describes the development of a novel platform to monitor the speed of vehicles through smartphone-based crowdsensing, providing data that may better support traffic planning and management in urban areas. Doing so, valuable data can be acquired and processed for an uncountable number of services. The developed platform, referred to as CitySpeed, innovates through the following characteristics:
  • Public data: The CitySpeed platform acquires data about vehicle speeds and stores such data in a public and open database, which can then be easily exploited by any other application. Such data can also be retrieved in a well-formatted standard (JSON);
  • Historical data: All acquired data are available to be accessed, allowing historical processing and visualization of vehicle speeds. This may be highly desirable for better planning of traffic and general mobility in modern cities;
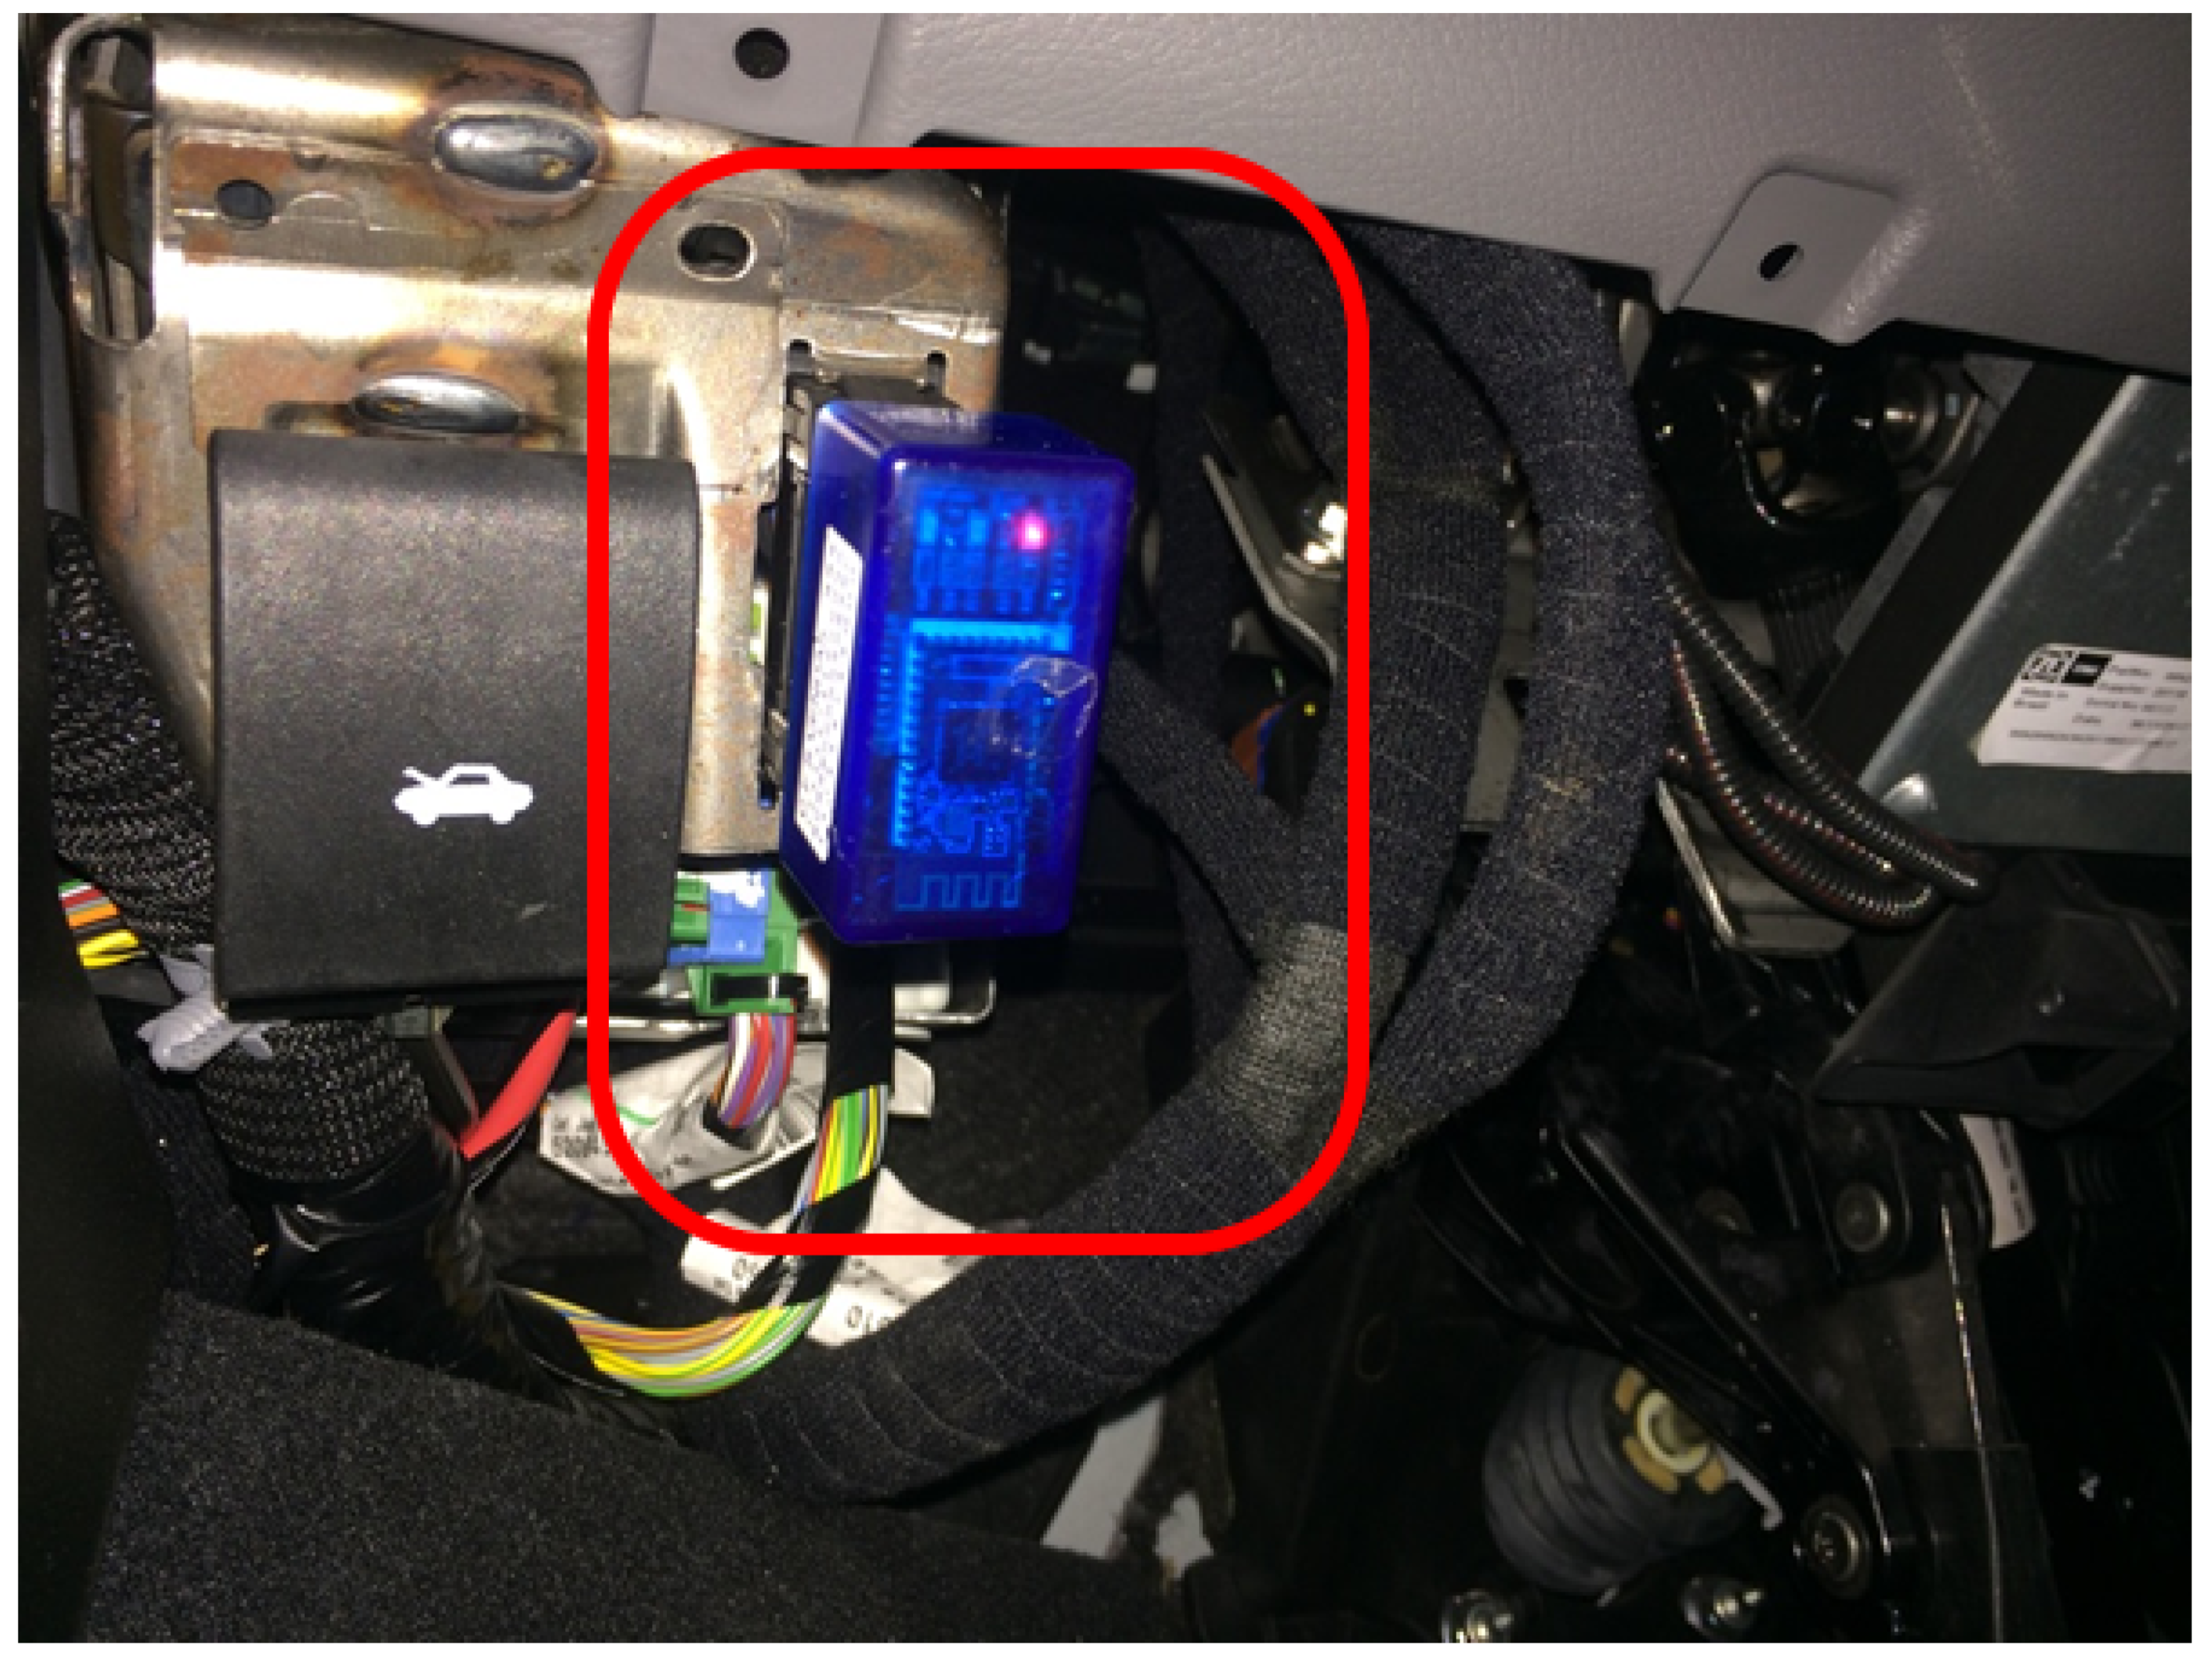
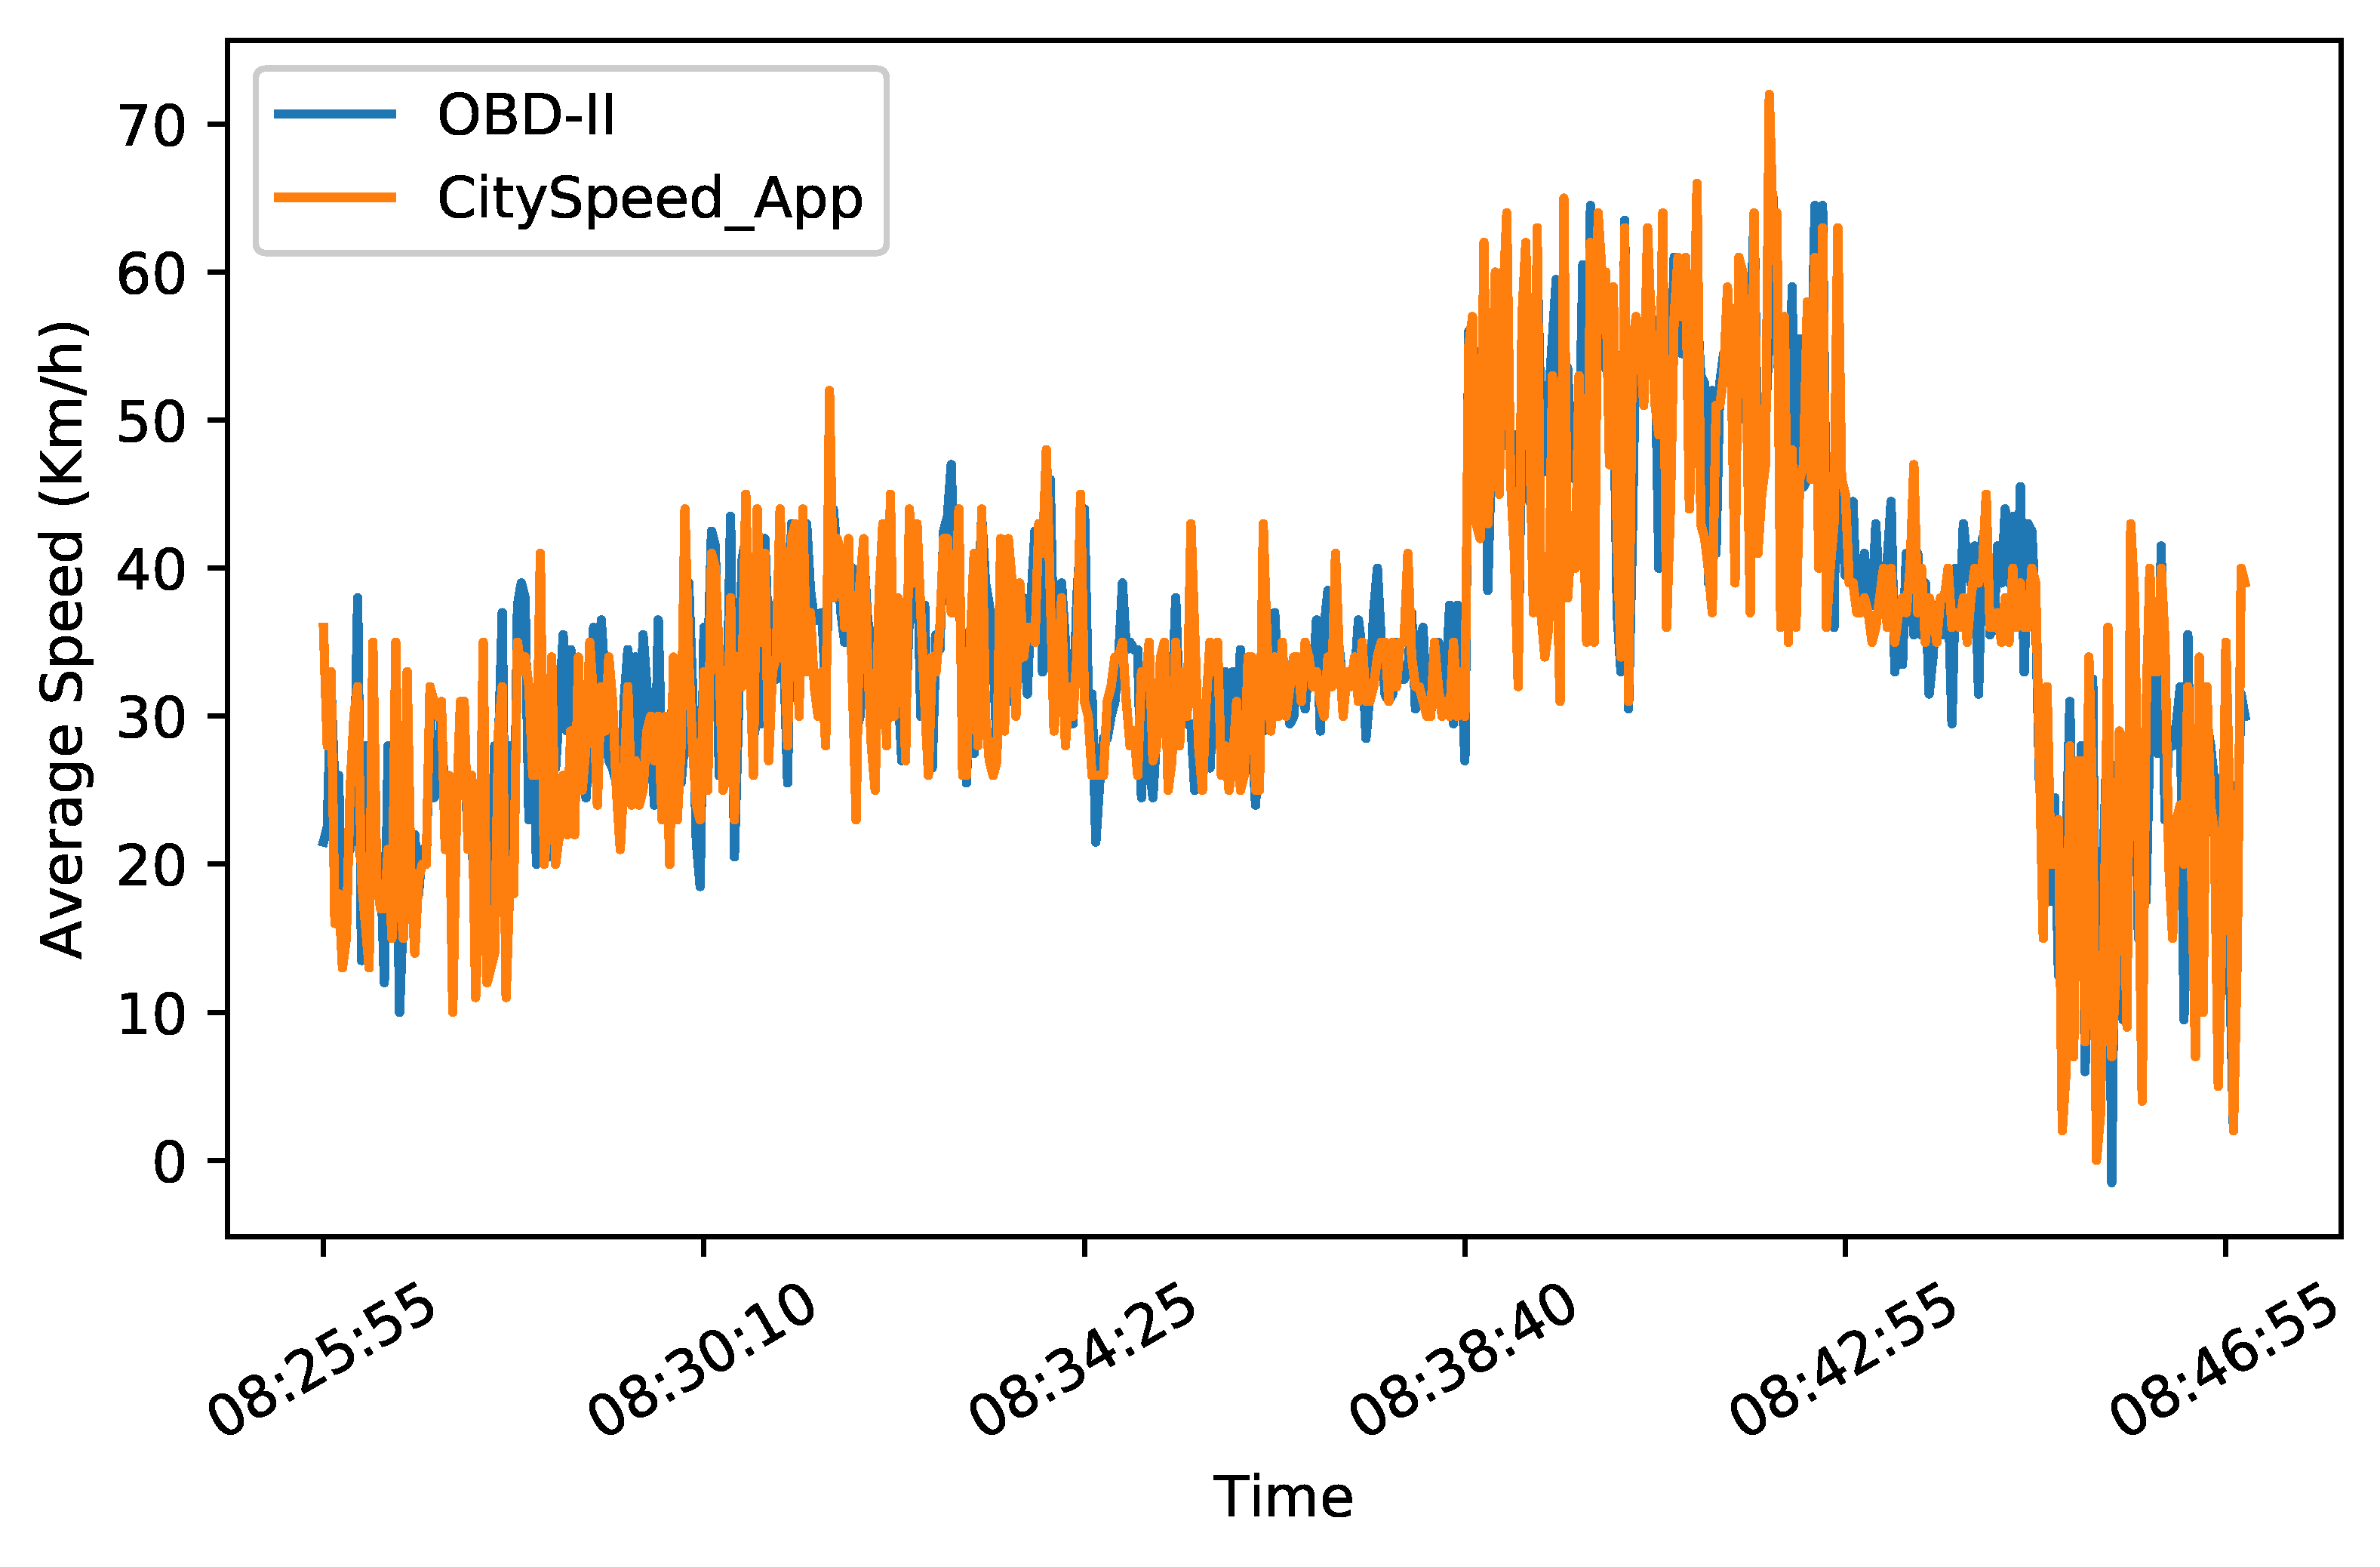
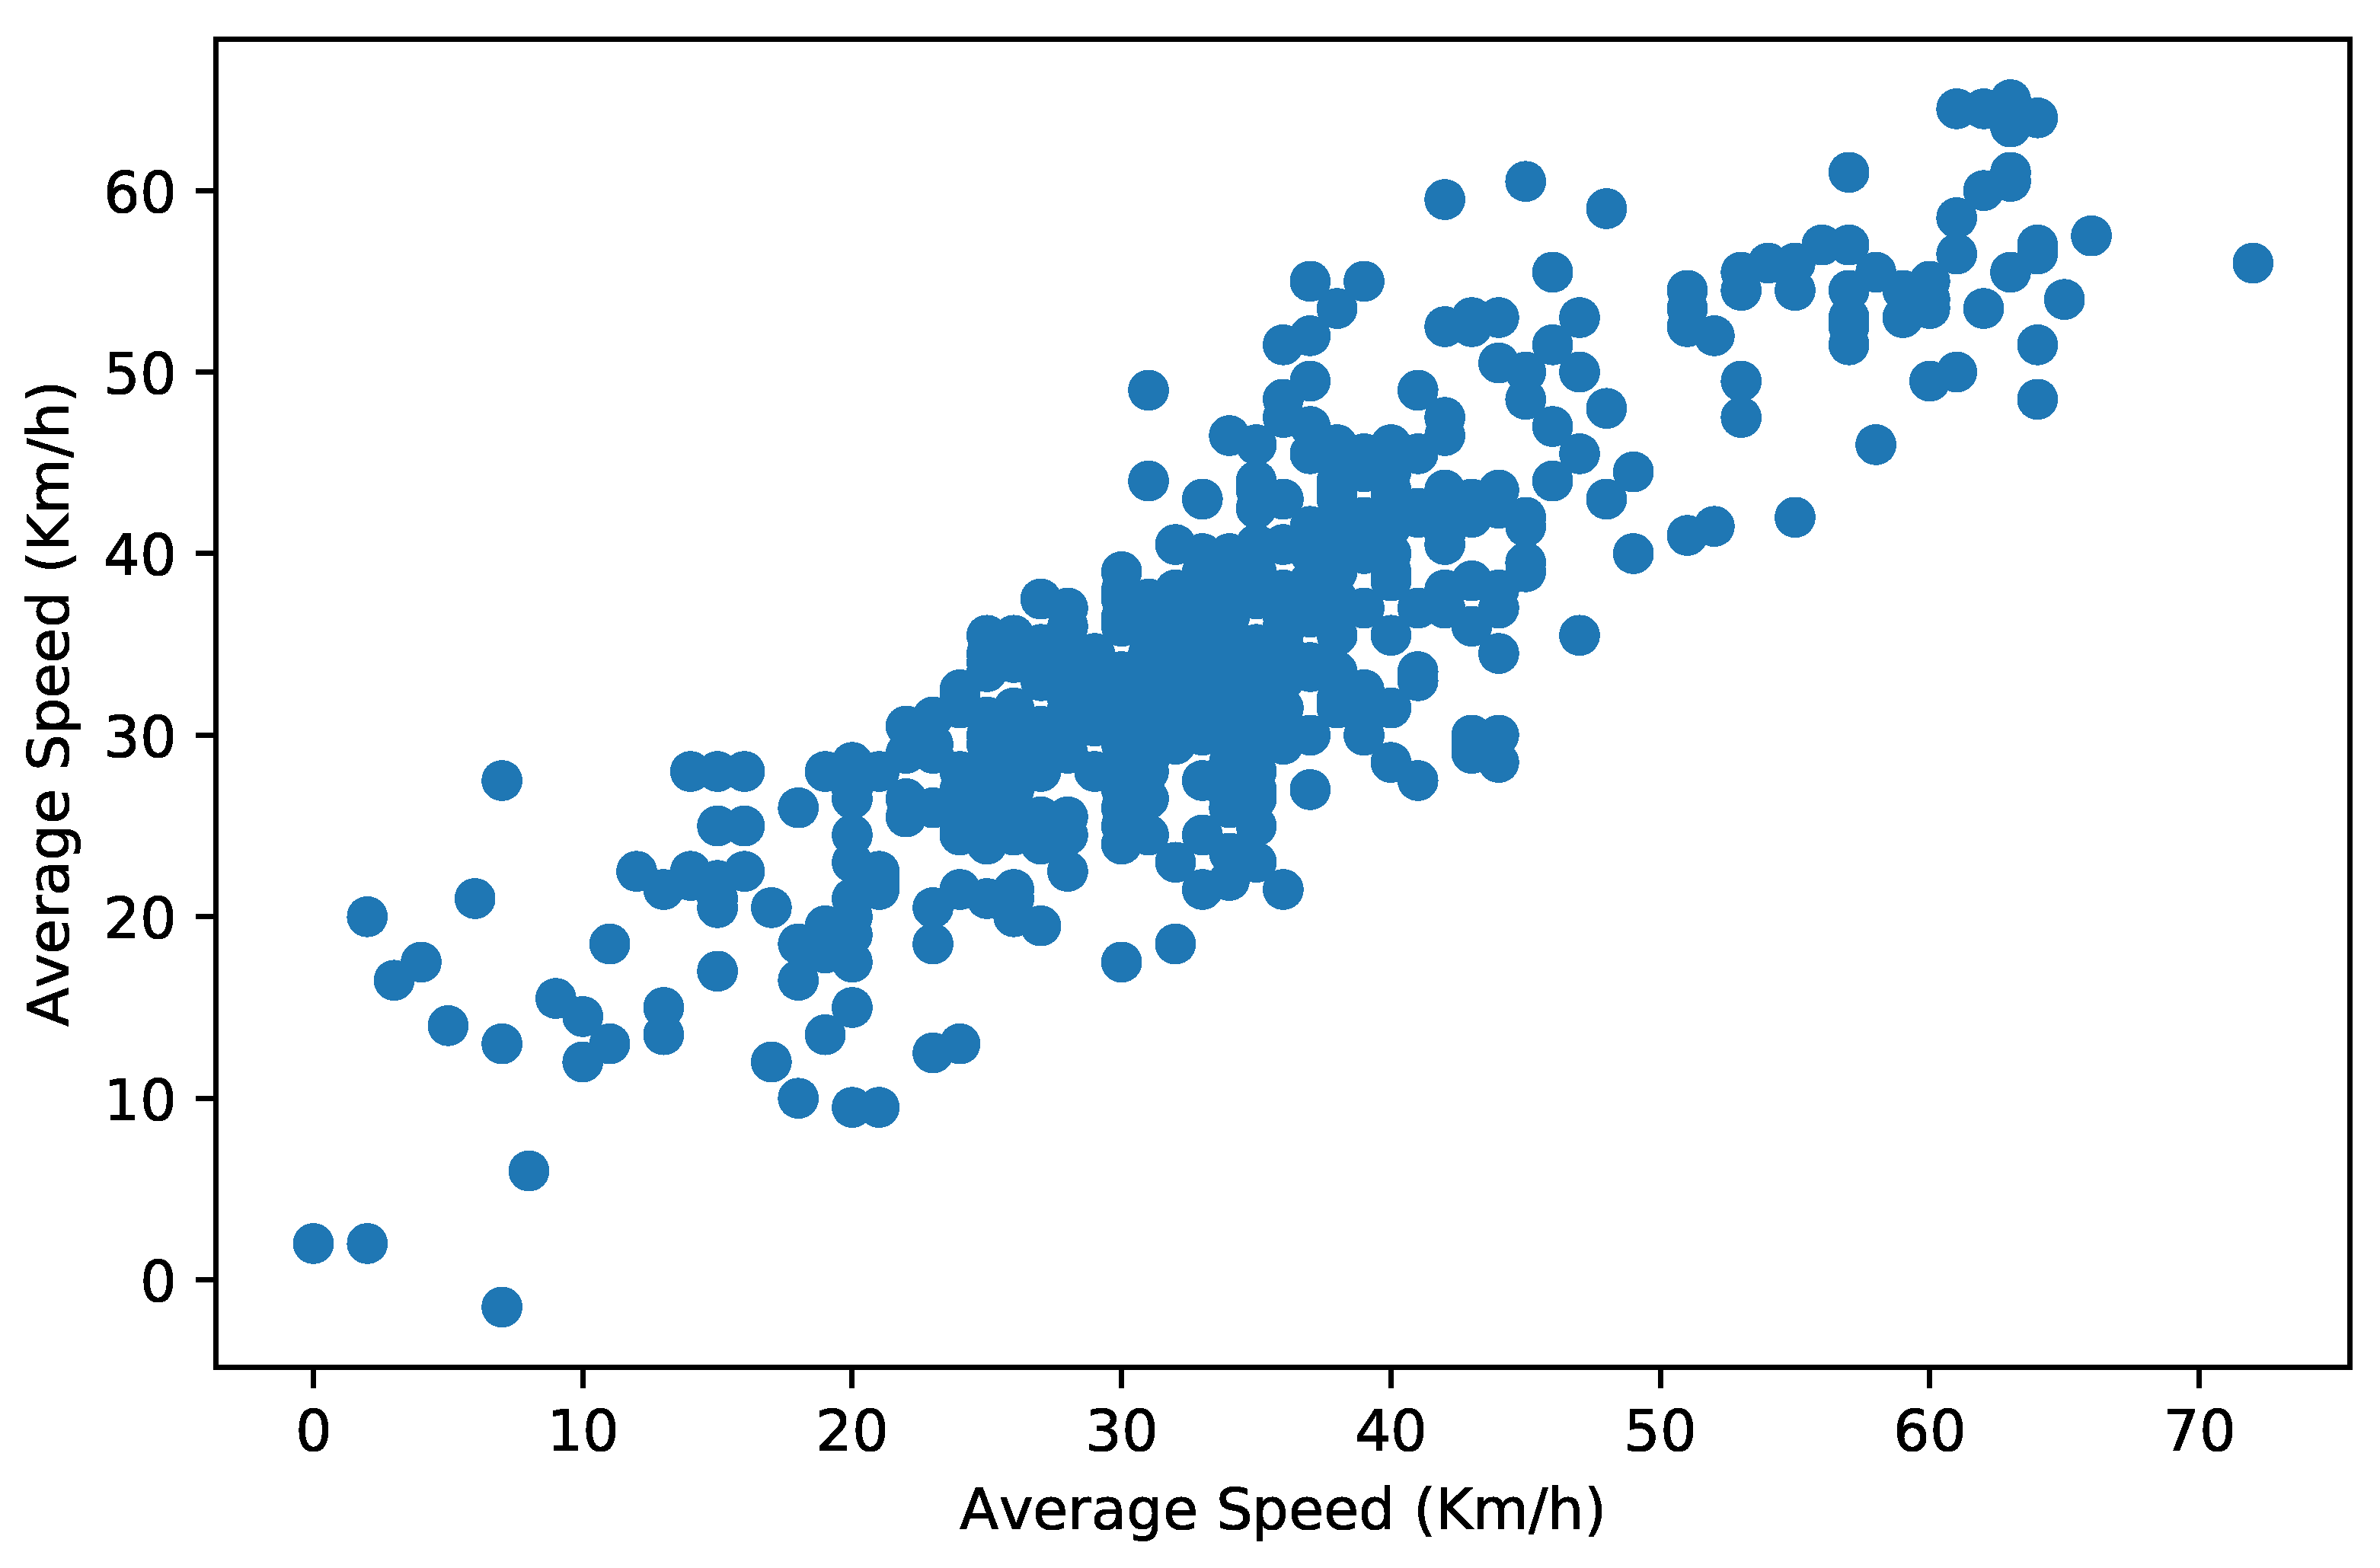
  • Speed computing confidence: The speeds are sampled and stored based on global positioning service (GPS) reading, which is a cheap and acceptable mechanism for this purpose. Measurements through the OBD-II interface were also performed and the results were compared to the chosen method, validating it (discussed in Section 4);
  • Data visualization: Although the platform is mostly aimed at providing public data, some reference visualization methods were also implemented, allowing different forms of graphical presentation of the data.
In general, the vehicle speeds, and their proper and historical visualization, can contribute to the improvement of traffic flows and urban mobility. The CitySpeed platform is a valuable resource in this sense, potentially supporting many projects for improved traffic planning and management in smart cities.
The remainder of this article is organized as follows. Section 2 presents some related works that influenced this article. The fundamentals of the developed platform are described in Section 3. The results are presented in Section 4. A brief discussion about the use of the platform in real smart city scenarios is conducted in Section 5, followed by conclusions and references.

2. Related Works

The growing maturation of smart city initiatives has resulted in a number of promising projects aimed at the mitigation of some recurrent problems in urban areas. This has been enabled by the development of different technologies, making it a fertile research area. Although there are still many challenges to be solved, some work in this area have paved the way for new developments, influencing this article in different ways.
Smart-city applications are becoming common, as communication and sensing technologies get cheaper and more available [17,18], creating a propitious atmosphere for new developments in this area. In recent years, many promising studies have been performed [2,19,20], indicating the desired research directions and actions to be considered when creating real applications. For some important examples in this area, the work in [21] presented and discussed different contributions for traffic prediction in smart cities; the work in [22] discussed important security issues for smart-city applications, covering key subjects such as attack resilience and privacy; the challenging issues of health assistance in smart cities were discussed in [23], relating different aspects associated to this environment; and the work in [24] investigated different problems of smart mobility in modern cities. All these works addressed some relevant challenges and presented recent developments in the construction of smart cities.
Among the technological approaches which have enabled the construction of smart cities, the crowdsensing paradigm comes as one of the most important mechanisms to allow massive and distributed data acquisition. Exploiting the fact that smartphones are largely disseminated and that they have sufficient computational power and communication resources, crowdsensing has become an important tool for different applications, boosting smart city projects. Crowdsensing is based on the “citizen sensing” idea, assigning an important role to the people living in the considered (smart) city [11,25]. Recent smart city projects have largely exploited this concept: In [26], smartphone sensors (GPS and accelerometer) were used to map road surfaces, indicating their quality. The smartphones acquired the information and transmitted it, which was then used to identify the quality of the roads for vehicular purposes. The work in [27] employed crowdsensing techniques to monitor driving behaviors, identifying sudden braking and aggressive driving actions. Noise pollution can also be distributively monitored using crowdsensing techniques, as proposed in [27]. Finally, even parking systems can be designed to exploit this data acquisition paradigm [28]. In short, the possibilities are tremendous, but the required cost and time to implement crowdsensing-based applications may be a development barrier for many projects.
The crowdsensing paradigm, along with other data acquisition techniques, such as data mining and distributed sensing, will provide data for uncountable applications. In the smart city scope, the crowdsensing paradigm may be exploited to provide different types of data for diverse applications, but recent developments have indicated a few areas that are more suitable for this kind of data acquisition. Among those areas, mobility and traffic management inherently benefit from the adoption of crowdsensing techniques. For example, the work in [29] proposed the use of smartphone-based crowdsensing to monitor traffic conditions, while the work in [30] exploited crowdsensed data to define traffic routes. From a similar perspective, the work in [31] also employed drivers’ smartphones to collect data; however, its focus was on buses, indirectly measuring the traffic conditions of roads covered by bus routes.
Although the use of the crowdsensing paradigm for traffic monitoring is not a novelty, new applications may have to develop their own data acquisition system, which may be a costly and time-demanding task. One solution is in the development of open and generic crowdsensing platforms to support any application, and the literature has presented some interesting examples in this sense [32,33,34].
A crowdsensing platform for data acquisition will use smartphones to distribute data, providing information to different users or applications. There are different ways to perform this service, with different focuses and objectives. Table 1 details some smartphone-based open-source crowdsensing platforms.
The presented platforms are some valuable examples of how crowdsensing may be useful in different scenarios, but they also indicate some technological challenges when acquiring and distributing data from smartphones. These platforms have different objectives and methodologies, benefiting different applications, but also following different principles. The works in [32,33] are based on the idea of “tasks”, each one proposing a generic crowdsensing platform that can be used virtually to retrieve any kind of data, for any application. The proposed platforms manage the tasks, defining “crowdsensing campaigns” that may have a varying number of users, who may accept (or not) a particular task. Such an approach is valuable for many situations, especially in a broader context of management and data acquisition, but it may become too complex and costly for specific applications that will always require a single type of data. Therefore, some platforms are only focused the acquisition of a particular type of data, since they may be more easily customized for a set of applications. The works in [36,37] employed embedded sensors in smartphones to provide a particular type of data. On the order hand, the works in [13,35] considered additional hardware to provide a (single type of) data, which is then transmitted using smartphones, delivering them to the crowdsensing infrastructure.
Whatever the choice, the existence of platforms to acquire data is of paramount importance, and recent works have indicated promising developments in this area. The CitySpeed platform was developed as another crowdsensing platform to acquire, distribute, and process a single type of data (vehicular speeds), but making it a supportive tool for any other application. Thus, it was designed as an open-source platform for acquisition, formatting, visualization, and distribution of data about vehicular speeds, allowing any type of customization, since all of the code is freely available in its entirety. This article comes, then, as an important contribution toward smart-city applications, potentially supporting different developments in this area.

3. The CitySpeed Platform

The developed platform is a supportive tool that exploits speed data in different ways—acquiring, formatting, processing, and exporting such data to any other application. Actually, knowing the average vehicular speeds in different regions is valuable in many scenarios, directly benefiting a group of applications for smart cities and intelligent transportation systems. The CitySpeed platform was designed to provide this type of data for any application.
Generally speaking, being an open platform is not only beneficial as a tool itself, but it also describes many important steps and development tips that are also relevant when constructing other crowdsensing supportive tools. In this last case, this article is also a guideline for the construction of data acquisition platforms, based on the crowdsensing paradigm.
The CitySpeed platform has the following characteristics:
  • The source code of all parts of the platform is public and can be freely used and/or altered. The code is available on the Github platform, and can be downloaded from “https://github.com/lablara/cityspeed.git”;
  • The CitySpeed platform was developed to be ubiquitous, to consume low amounts of energy, and to require low storage space on smartphones;
  • In order to reduce communication costs, all collected data are only transmitted to the proper server when a smartphone is connected to a Wi-Fi network. This standard behavior can be changed by the user, allowing smartphones to transmit data through 3G/4G connections;
  • The platform was developed to be smoothly executed on Android and IOS smartphone systems; and
  • Web-based graphical tools were developed, allowing different types of visualization of the retrieved data.
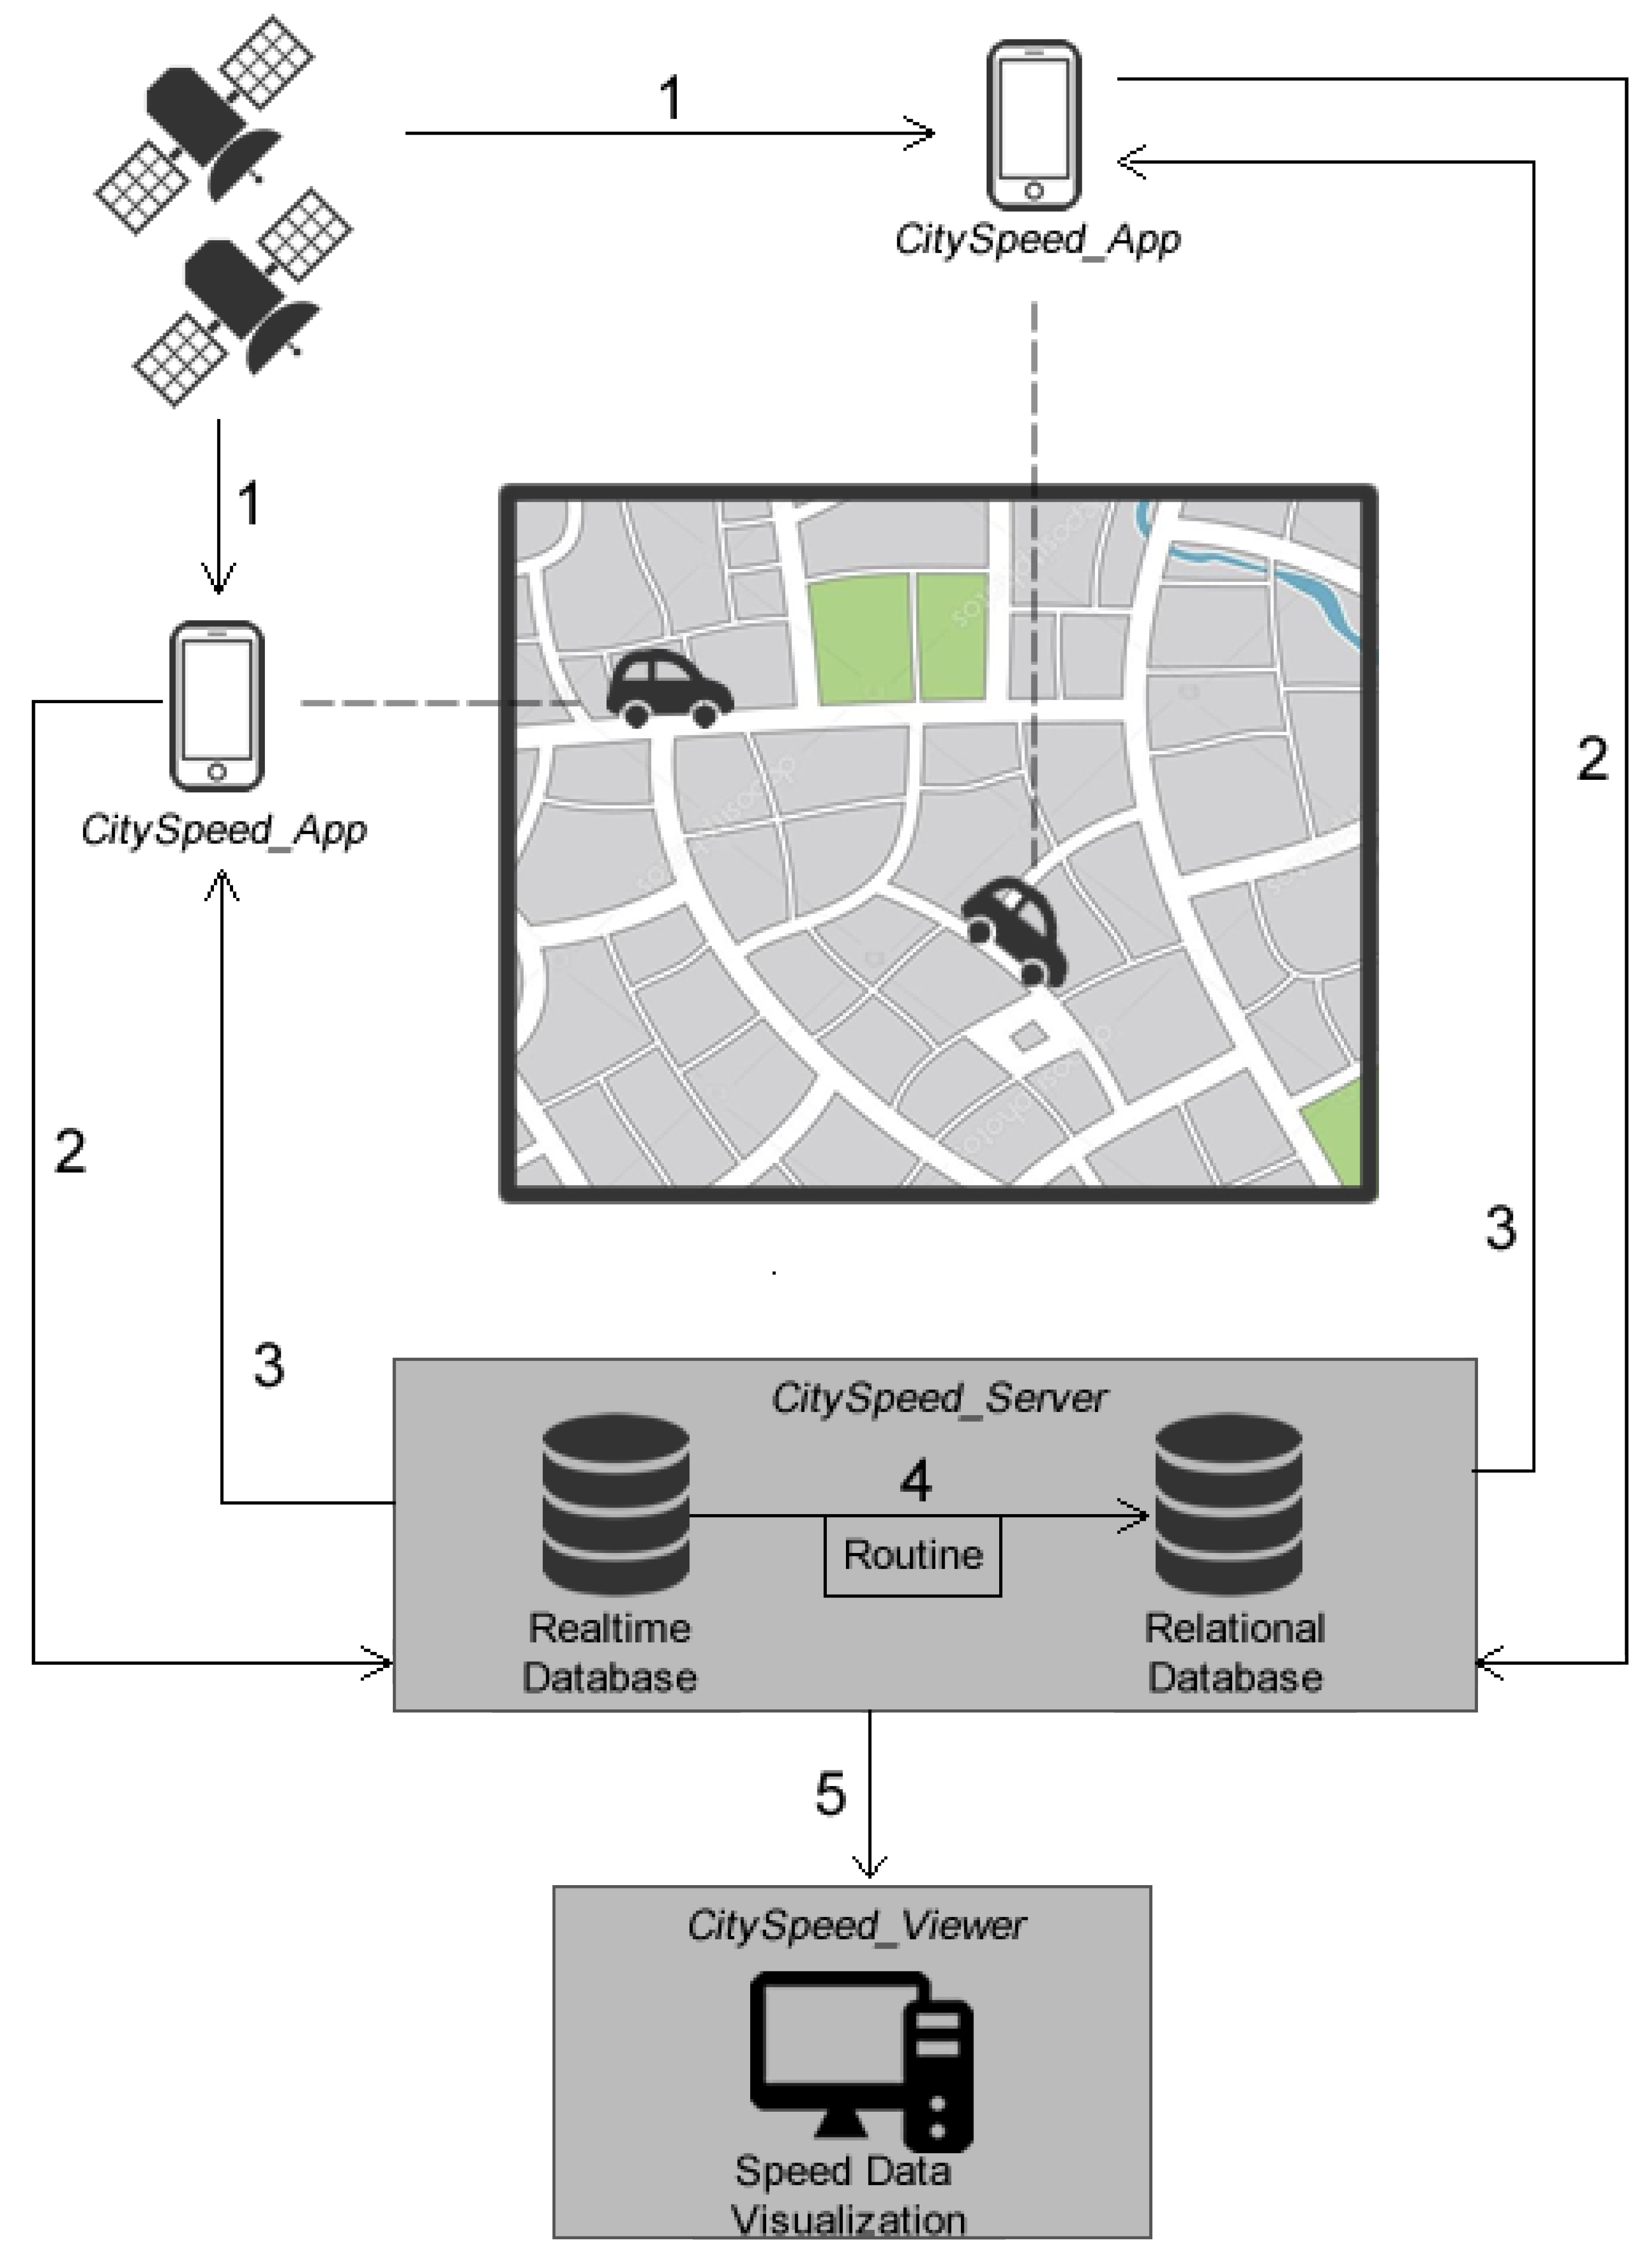
The next section presents details about the development of the CitySpeed platform.

3.1. Logical Blocks

The information obtained by the CitySpeed platform allows the viewing of average vehicular speeds on city streets, providing historical analyses of the perceived speeds in defined regions. As data are the most important asset for many smart-city applications, a reliable and distributed dataset is usually desired. In order to accomplish that goal, and to be a reference for the development of any other crowdsensing-based platform, the CitySpeed platform was divided into three different conceptual blocks: CitySpeed_App, CitySpeed_Server and CitySpeed_Viewer. Each of these blocks has well-defined functions, as depicted in Figure 1.
In Figure 1, the conceptual operation and communication flow among the blocks is shown, indicating the expected steps to be followed. Those steps are briefly described, as follows (the presented numbers are the same of Figure 1):
  • GPS-based speed monitoring: Instantaneous speeds are continuously acquired and stored locally in a smartphone (CitySpeed_App);
  • Speed data are transmitted and permanently stored in the system’s database: The designed app transmits the previously stored data to the configured server (CitySpeed_Server);
  • Transmission confirmation: This allows a smartphone app to safely remove the temporarily stored data (CitySpeed_App);
  • Data are transformed and stored in a second database: Speed data can now be publicly accessed (CitySpeed_Server);
  • Data are retrieved to be processed and displayed: Different visualization pages are available, but any extensions can be developed (CitySpeed_Viewer).
These logical blocks are described in the following subsections.

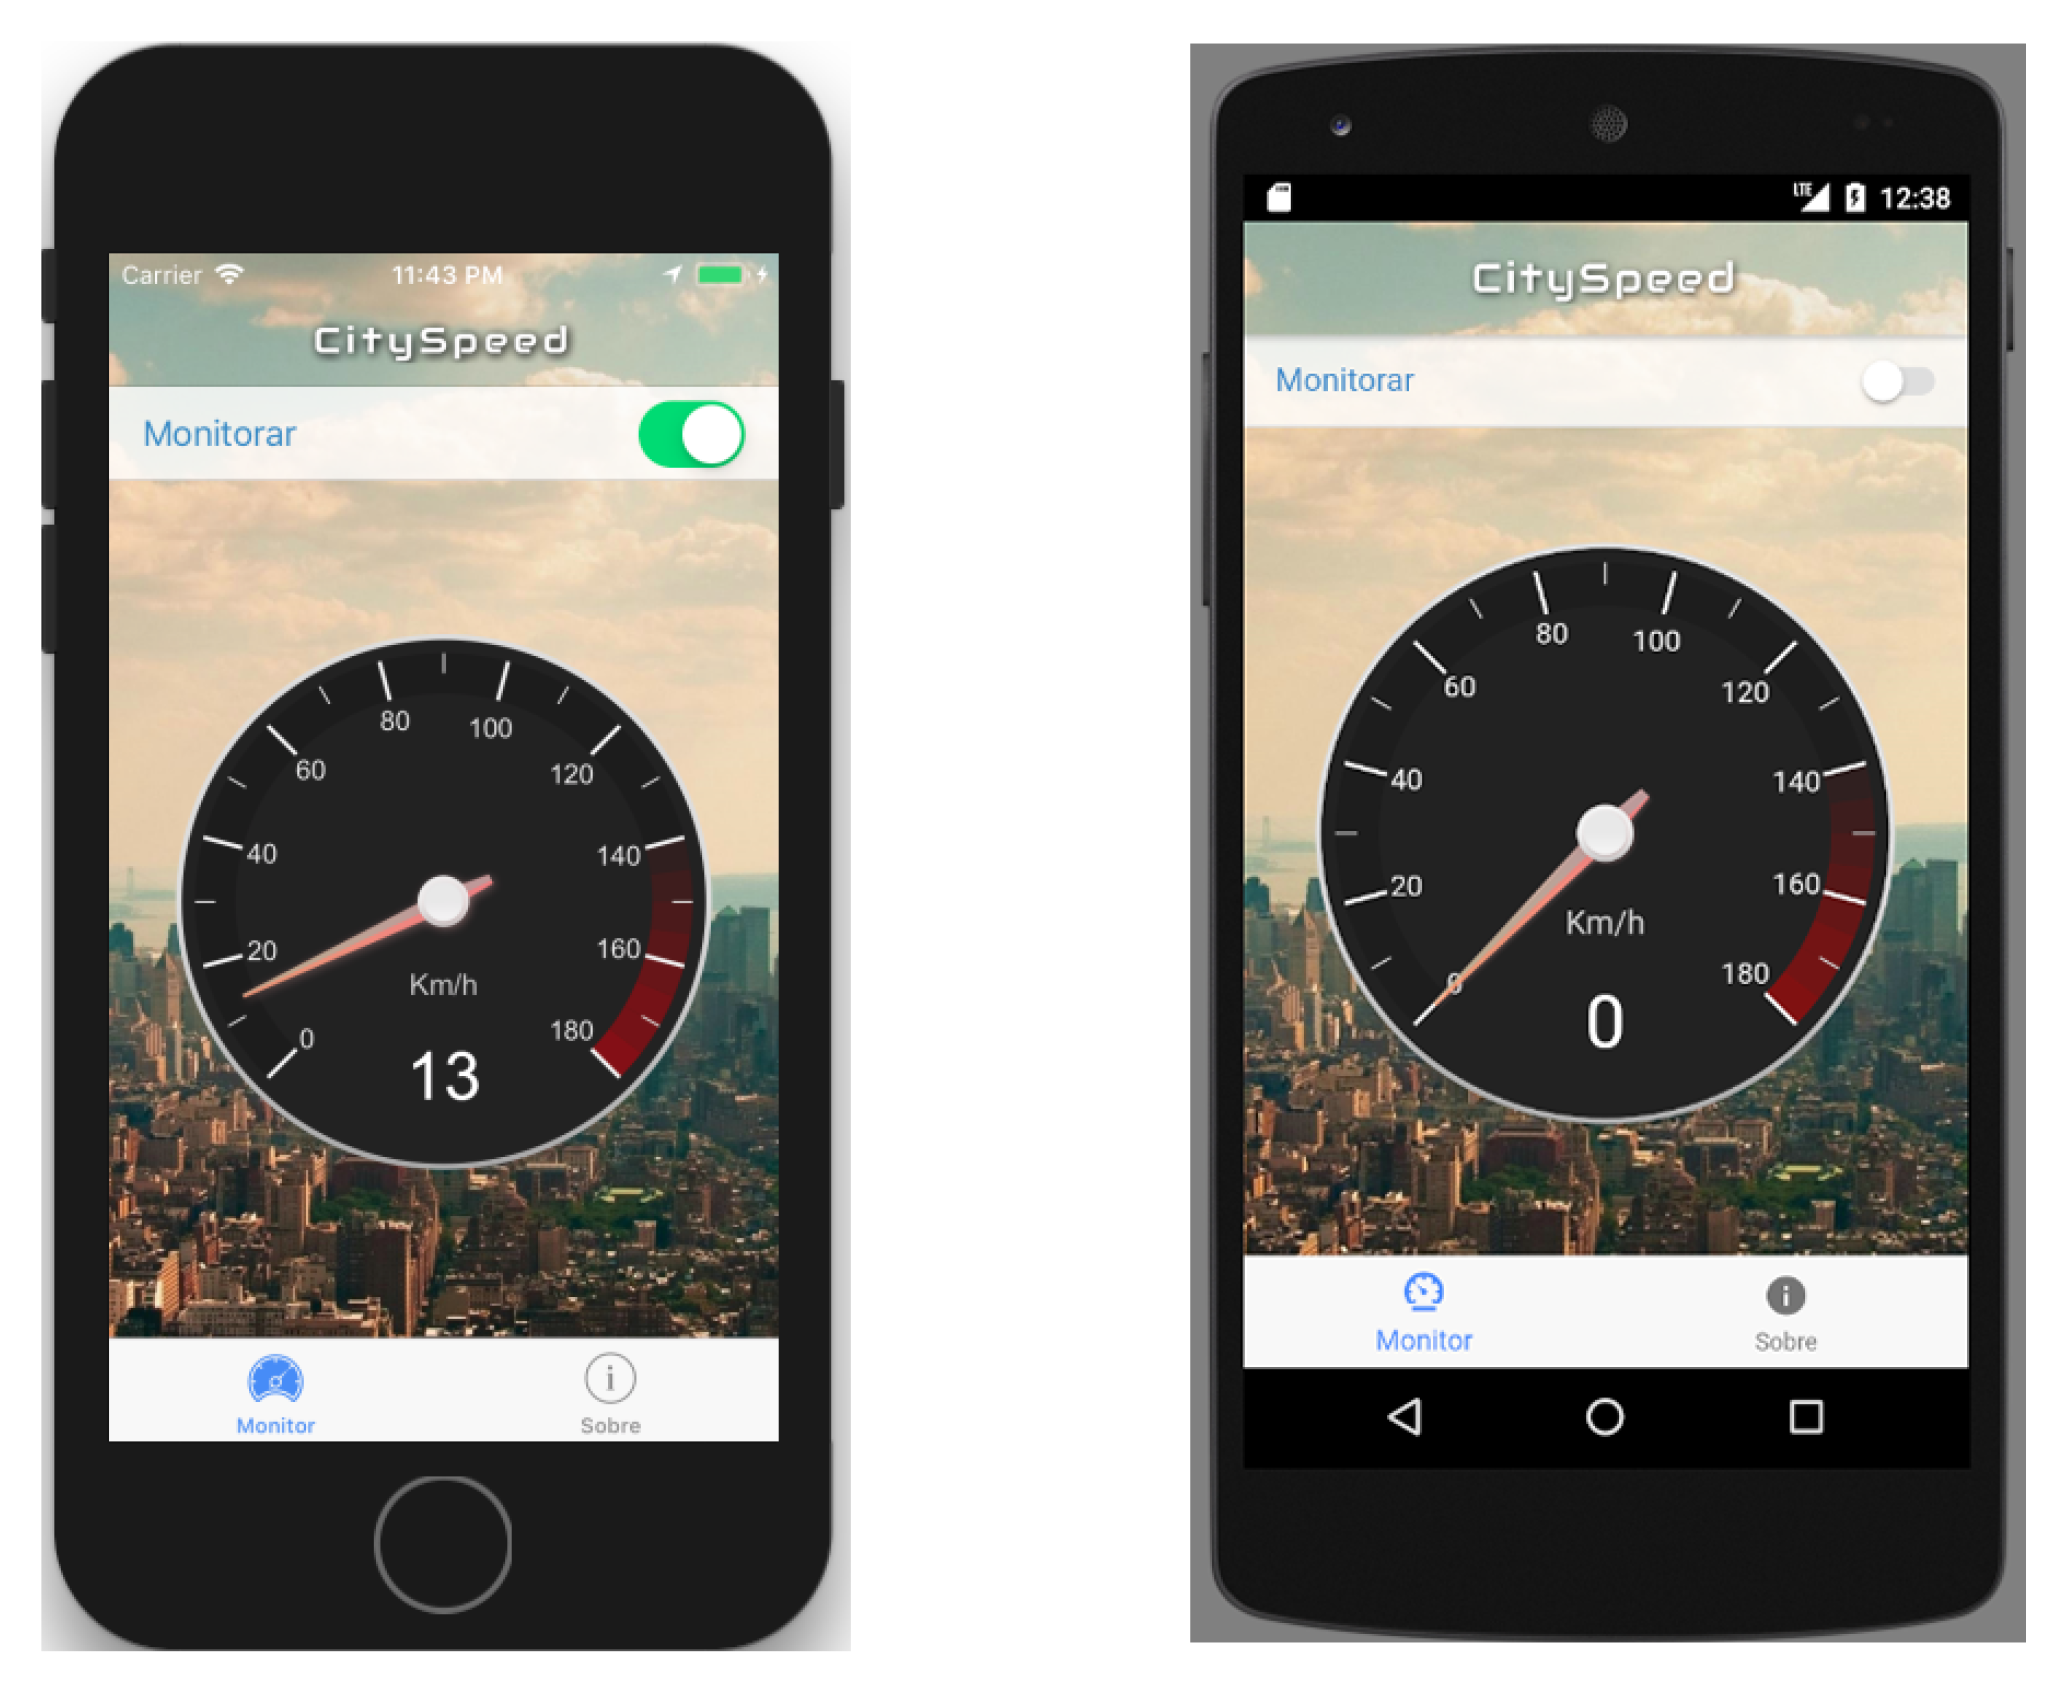
3.1.1. CitySpeed_App

Vehicular speeds are expected to be monitored and transmitted using the smartphones of drivers (or passengers) and, thus, some specific program must be executing on those smartphones. Such expected functionality is provided by a single program, which must be installed by the participants before delivering speed data. Actually, the logical block CitySpeed_App is composed only of this app, which aggregates all of the expected tasks to be executed on smartphones into a single program that can be easily installed and executed by users, and maintained by the project.
In short, the developed app will continuously estimate the current instantaneous speed of a smartphone, which is indirectly measured by considering its movement over time. Such computed speeds can be reliably considered as the speeds of vehicles, since the smartphones are “moving” while they are being carried by a driver or passenger.
The adopted mechanism for speed estimation is based on the GPS (Global Positioning System). In general, GPS receivers continually monitor numerous satellites and apply methods to decide the “precise” position of a device. Then, based on the computed geographical coordinates and considering a time reference, the current speed may be inferred with a reasonable precision (further discussed in Section 4). With the engagement of users to have sufficient and relevant information about the speed in a given roadway, it is possible to obtain relevant traffic data for city areas.
Actually, the GPS receiver in smartphones and the common available API (Application Programming Interface) for GPS readings will usually provide two different methods for computing speed. The first method is considering the change in position over time, provided by the GPS, requiring an additional equation to indirectly compute the speeds. The second method is based on the speed property directly provided by the GPS receivers. Concerning these methods, we have verified through experiments that the speeds obtained through the “device speed” property have greater reliability, when compared to the speeds calculated from the differences of geographic coordinates. This reliability was assessed experimentally in this work, when compared to vehicle speed displayed by a speedometer.
For the developed platform, both methods for speed acquisition are employed, but in different cases. The standard method is based on the device speed property, but the speed calculated through the distance obtained by the “Haversine” equation was also used as an auxiliary method, in the case where the GPS sensor could not obtain the speed for some reason, such as a system failure or incompatibility of the operating system and available APIs. This decision aims to assure a higher robustness of the platform.
The app was designed using the Cordova Background Geolocation API. This is an API designed for tracking and location purposes in smartphones, exploiting the available resources of the system. Besides easing the acquisition of the desired information for the CitySpeed platform, this API is intended for low energy consumption and background execution, being an ideal solution for the construction of the CitySpeed_App block, although any other API could be used since the expected information is also provided. The Cordova Background Geolocation API is available for IOS and Android systems, and can be downloaded from [38]. Just as reference, the developed app also employed the following technologies and programs: Ionic2, HTML5, the SQLite database system, and the Canvas Gauges plugin.
Using the aforementioned API to acquire speed data, the developed app operates by storing “speed samples”, each one associated to a unique time stamp and a speed value. Speed samples are generated continuously and according to the operation of the GPS receivers, the operating system, and the employed API. Although the sample frequency is not constant, we note that the average frequency for the generation of speed samples was 4350 ms in the experiments. This is reasonable and effective for the expected functions of the CitySpeed platform.
Every speed sample is stored locally in a SQLite database [39]. SQLite is an open-source, free database management system that is used to store speed samples until they are transmitted to the CitySpeed_Server block, when the user’s smartphone has a Wi-Fi connection. When the transmission is successfully confirmed, the speed samples are removed from this local database, saving space in the considered smartphones. This transmission is completely managed by the developed app, and all data is formatted in the JSON (JavaScript Object Notation) format to be transmitted.
There should be a minimum free storage space in the users’ smartphones, so speed samples can be temporarily stored until they are transmitted to the CitySpeed_Server. However, as each speed sample is just a line in a table, the required space is “low”. Actually, we estimated that roughly 0.5 MB is required for every hour of continuous monitoring, and thus 1 day of “offline” monitoring will require roughly 12 MB of free storage, which is typically available in a modern smartphone.
Any speed sample is composed of the following data:
  • Timestamp: The time in which the speed sample was generated;
  • Speed: Directly acquired from the GPS receiver. The API does not compute it, since it is provided by the GPS module on modern smartphones;
  • Latitude: The latitude information provided by the GPS receiver and associated to the computed speed; and
  • Longitude: The longitude information provided by the GPS receiver and associated to the computed speed.
It is interesting to note that, although a speed value is transmitted in every speed sample, so are the latitude and longitude. This is due to the fact that, sometimes, a speed value may be wrongly zero (as discussed before). In this case, the differences between consecutive latitude and longitude values, along with the time stamps, can still be used to estimate the required speed. Actually, this is implemented as a function in the database and is only considered as a secondary method to provide speed data, assuring robustness of the platform.
In order to provide anonymity to the users of the platform, names or any other textual identification of the users are not employed. The only identification is a numerical index created by the app, used to differentiate the speed samples in the databases.
Figure 2 presents the main screen of the app for both IOS and Android platforms.
Finally, the developed app can be freely downloaded from “https://play.google.com/store/apps/details?id=com.cityspeed.app” (Android, 12 MB of required space) or “https://itunes.apple.com/br/app/cityspeed/id1378966756” (IOS, 16.3 MB of required space). The app was successfully tested in IOS versions 8, 9, 10, 11, and 12, while Android version 8 was used as a reference, and, thus, we can guarantee that the app will work as expected, at least in these versions.

3.1.2. CitySpeed_Server

All participating smartphones will generate speed samples, storing them locally and then transmitting the samples to the configured database when appropriate. For that, two distinct databases were created to compose the CitySpeed_Server block, providing scalability and flexibility to the CitySpeed platform.
Initially, every smartphone transmits the locally stored speed samples to the standard configured database, which was implemented using the Google Firebase platform [40] in the Cloud. This choice was based on the flexibility, high performance, and resources provided for mobile development, which makes the Google Firebase one of the most adopted databases for smartphone-based mobile applications.
The adopted Firebase solution provides the required services for distributed vehicular speeds acquisition, but it is not suitable for the desired functions of the CitySpeed platform. In order to address this problem, a secondary database was implemented, based on the popular PostgreSQL database platform. PostgreSQL is an open-source object-relational database system which allows different types of searches [41]. Moreover, in order to allow the execution of geographic objects queries, the PostGIS extension was also employed [42]. This combined PostgreSQL/PostGIS was implemented on a dedicated server, and a routine was created to transmit data from Firebase to PostgreSQL. This database will store the actual data that will be displayed and analyzed.

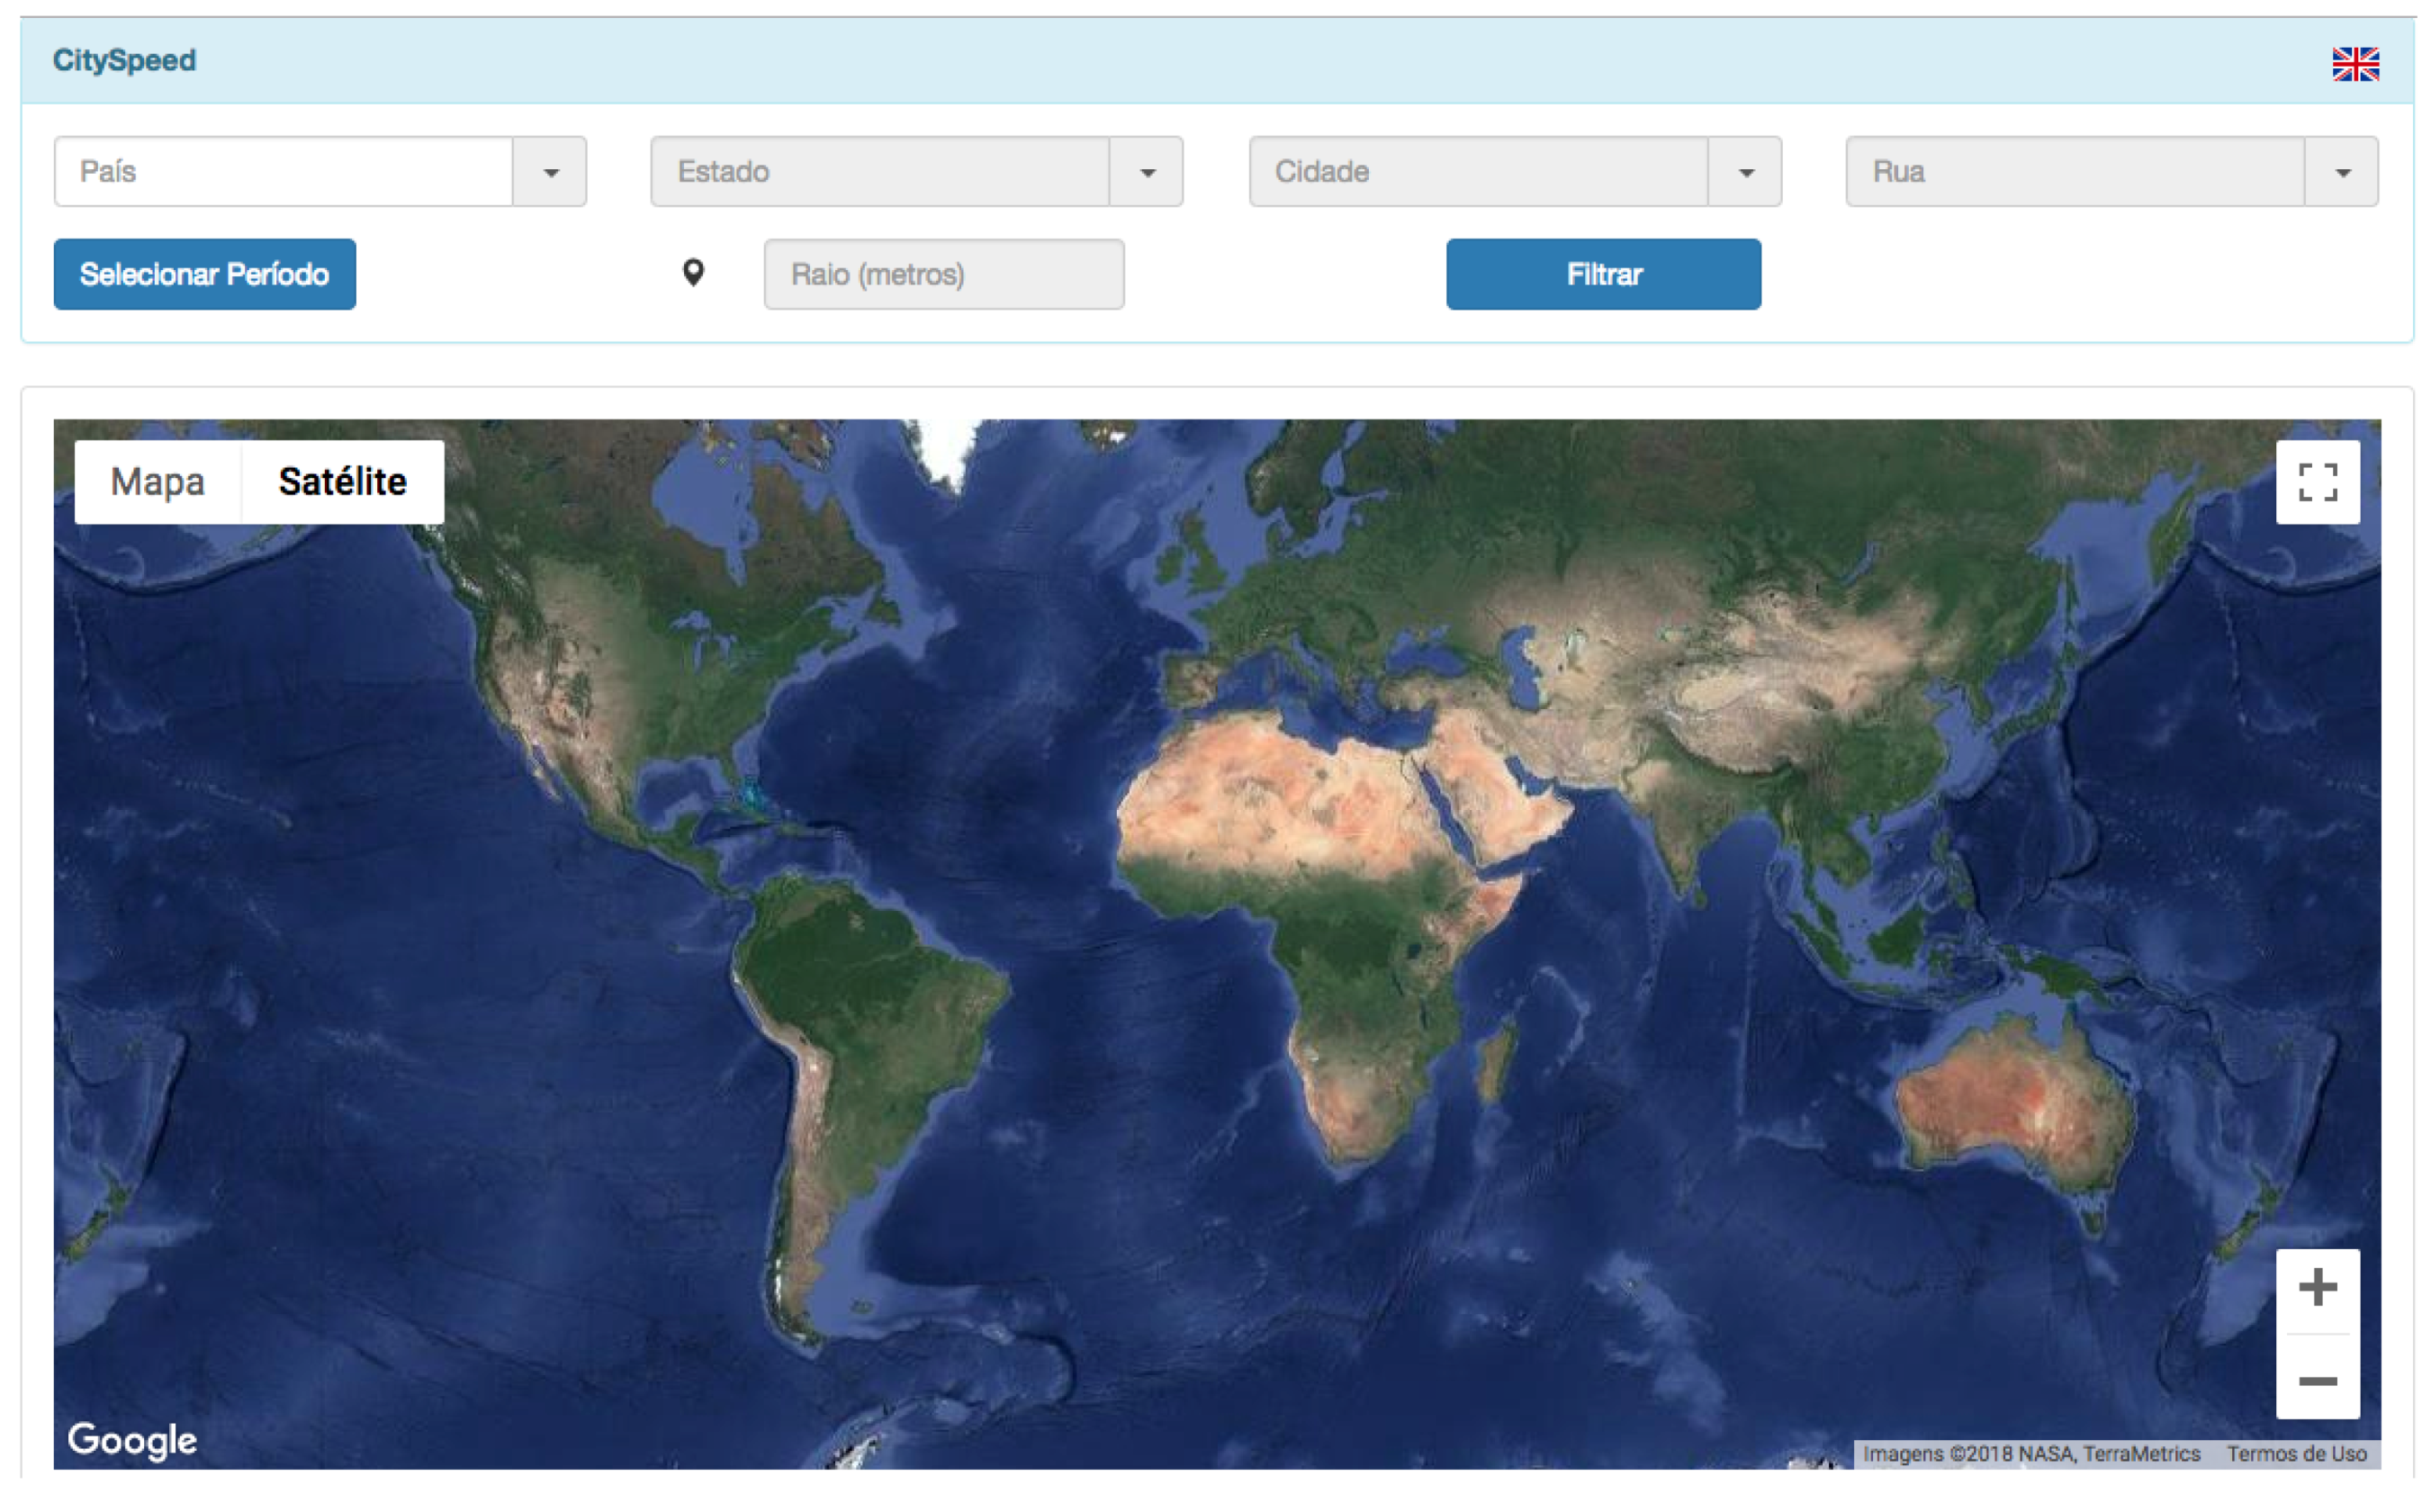
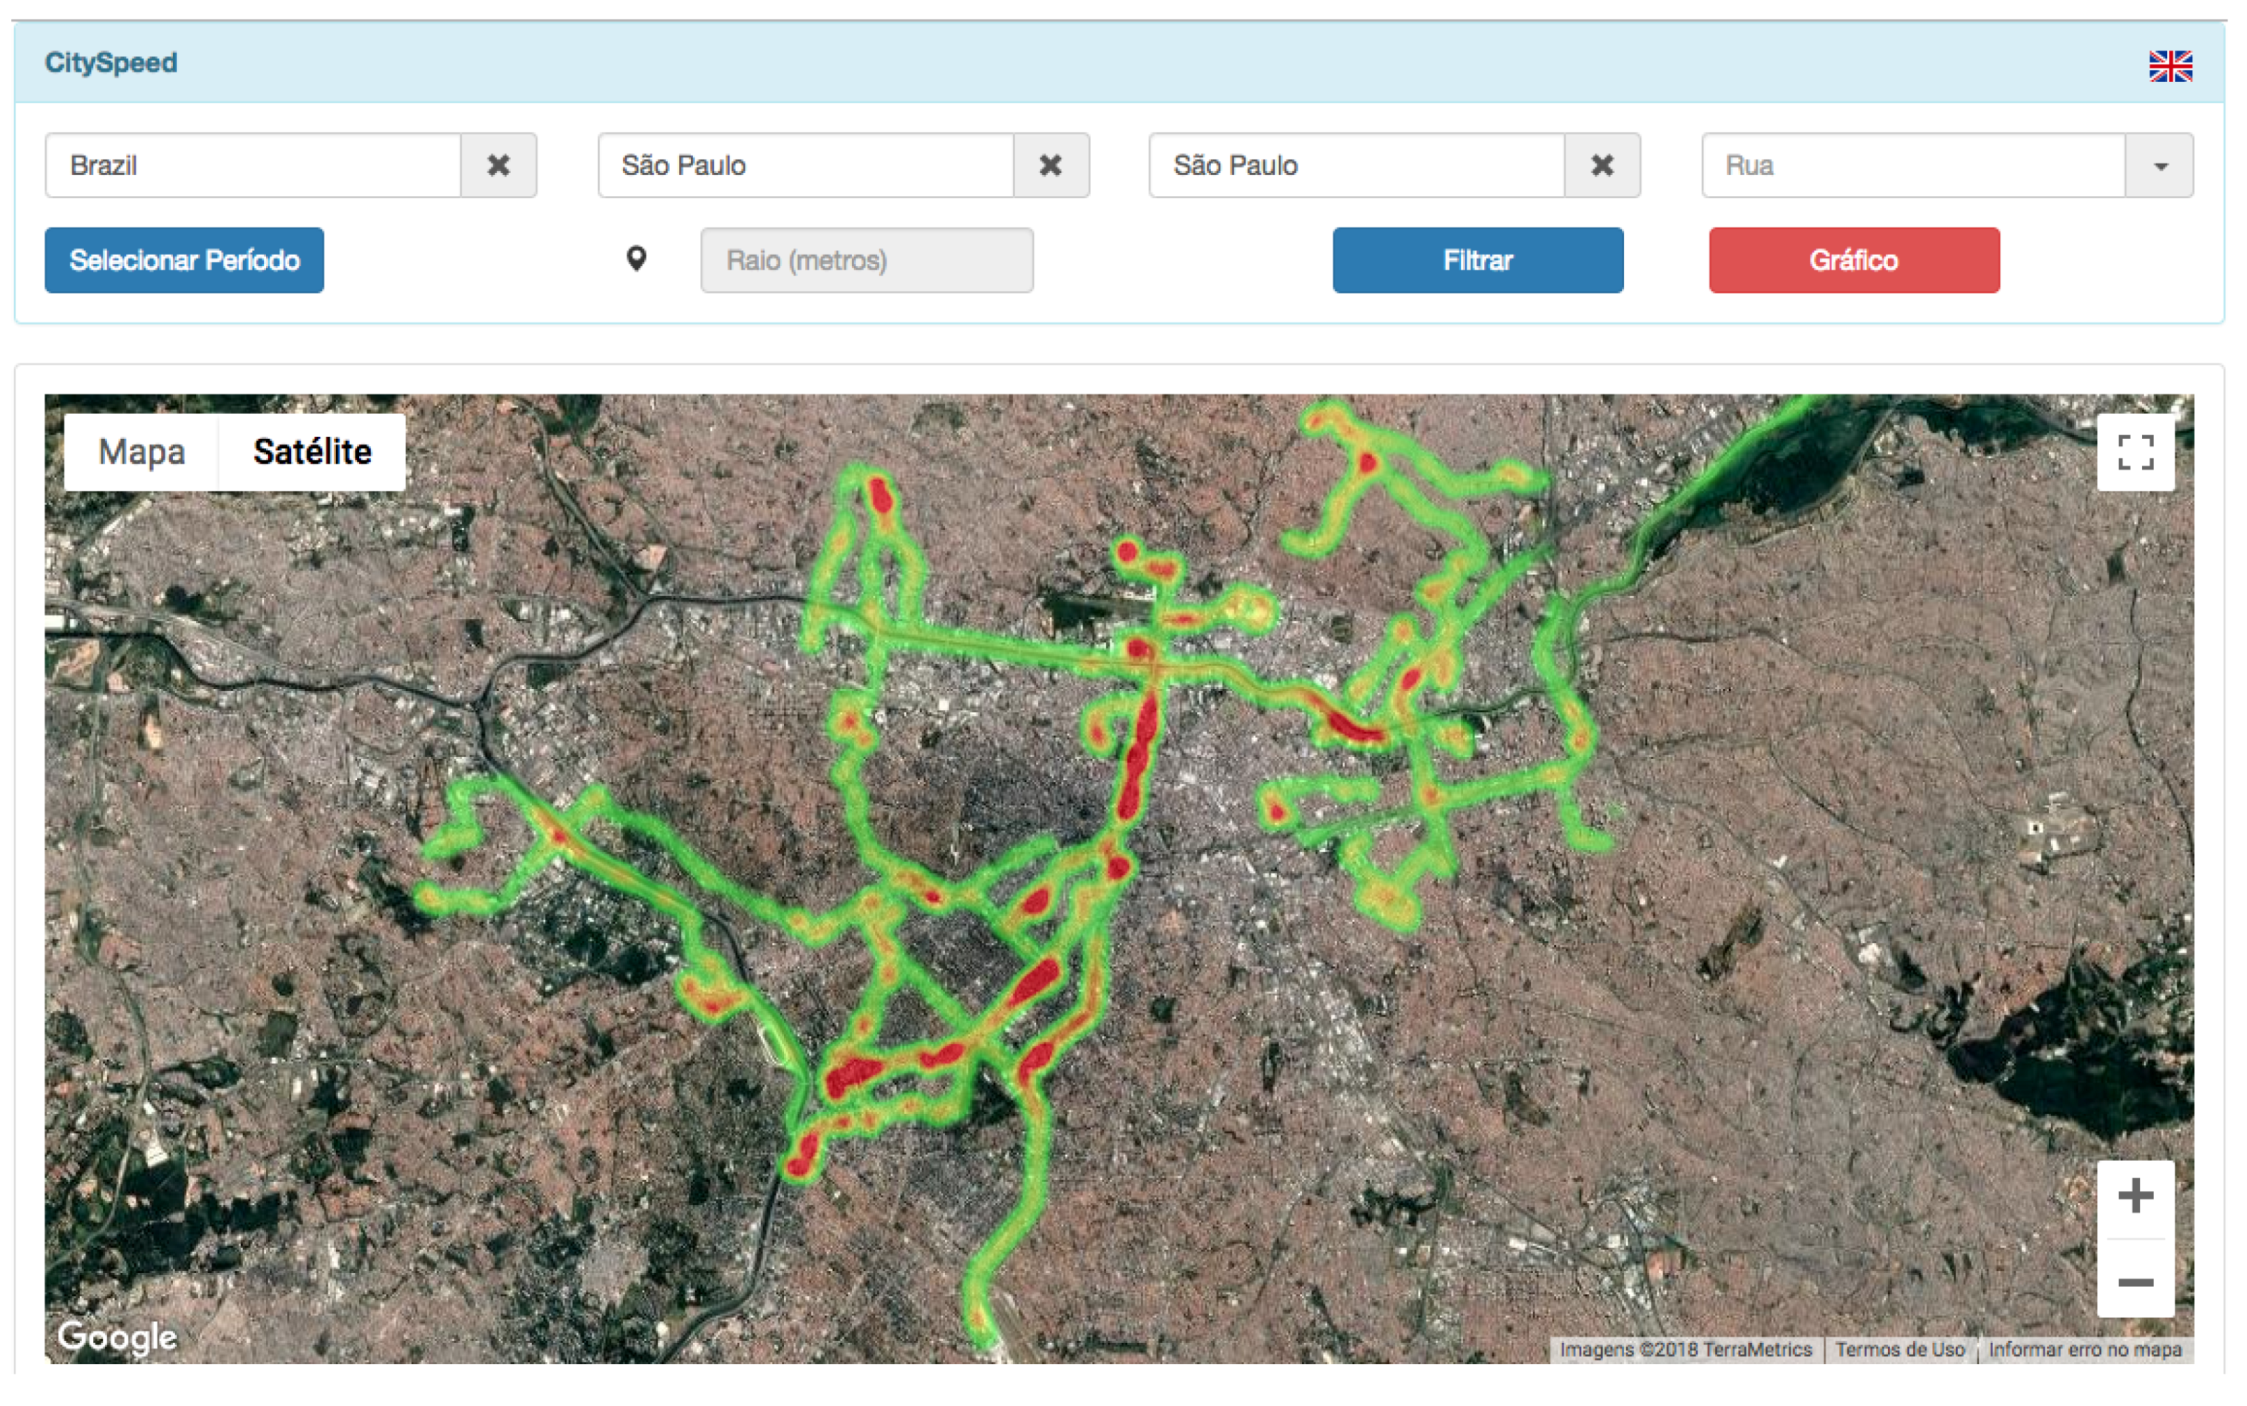
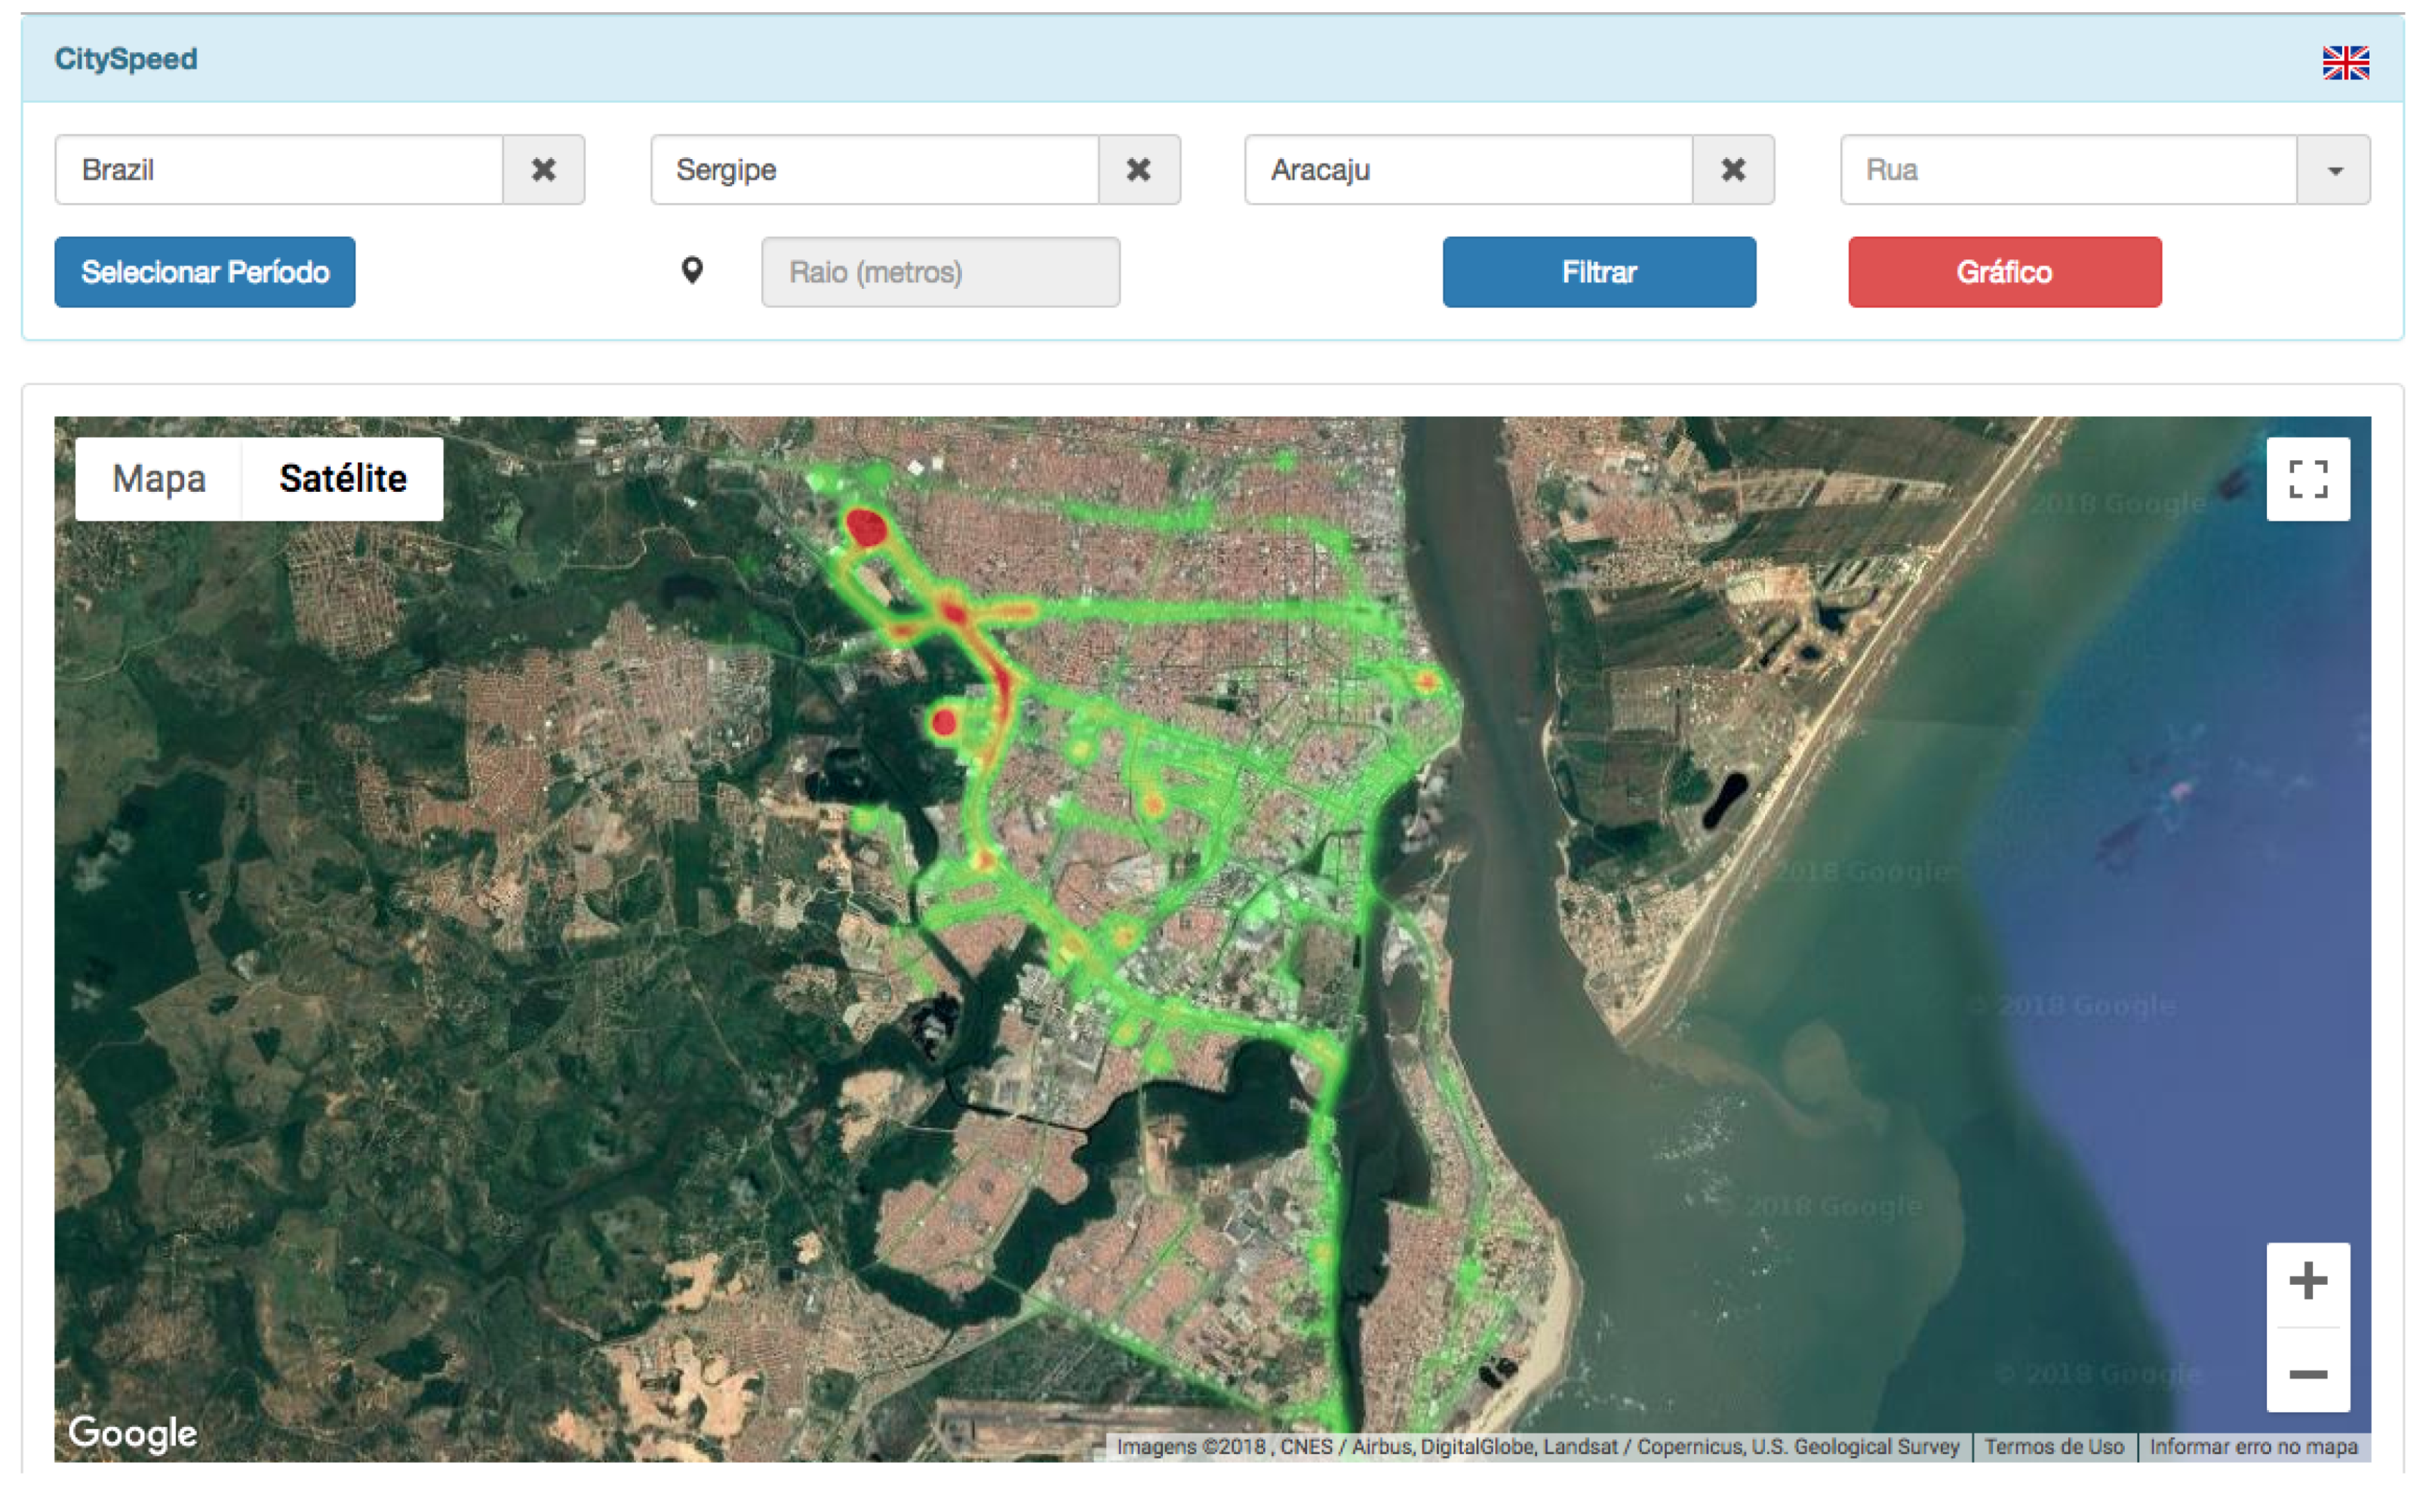
3.1.3. CitySpeed_Viewer

The data samples stored in the CitySpeed_Server main database (PostgreSQL/PostGIS) can be freely accessed and then processed and displayed. As the proposed platform is intended to be generic and for any application, the provided data may be processed in different ways. However, we defined a standard interface to present the desired information, which can be used or altered to change the current functionality or to add new methods. Such an interface is implemented in the CitySpeed_Viewer logical block.
Figure 3 presents the initial page of the CitySpeed_Viewer, allowing users to perform different types of search queries. This is, in fact, the interface that common users will have access to, since they do not need to have knowledge about the CitySpeed_App and CitySpeed_Server blocks.
The CitySpeed_Viewer was implemented as a web-based interface with some well-defined search functions. The idea is to provide different methods to visualize the information about the available speeds in the platform. For that, different search parameters were implemented, allowing more specialized searches over the dataset. Those parameters are described as follows:
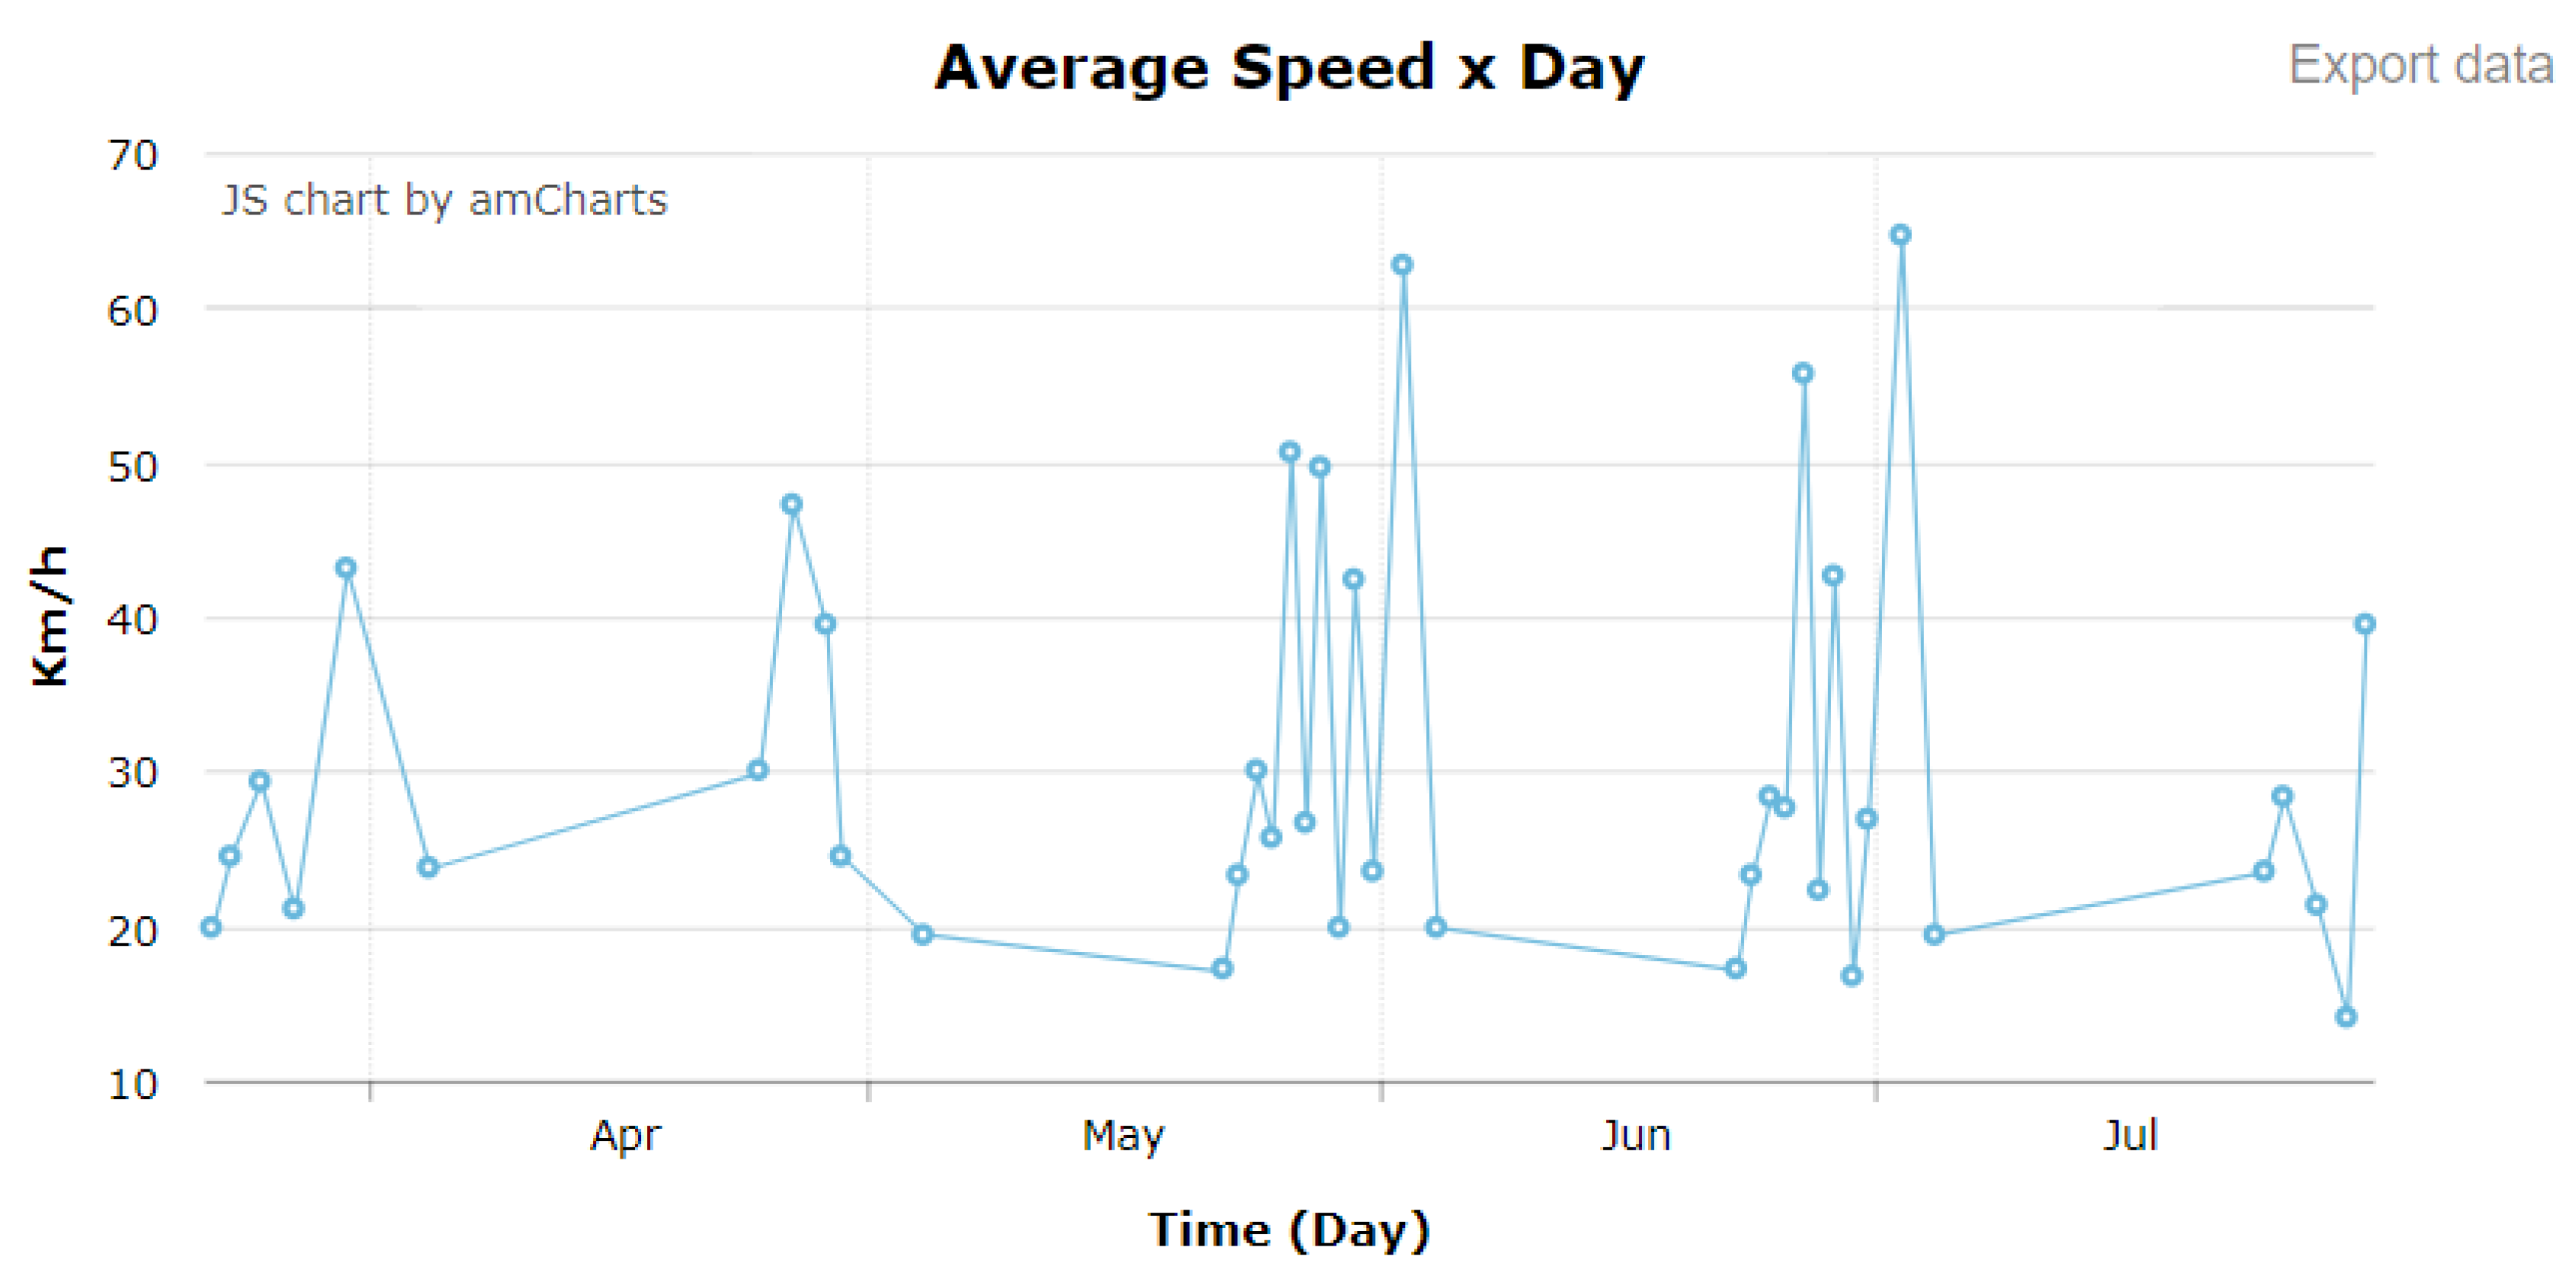
  • Time queries: A date range, or even a time frequency, may be specified, showing speed information for that time, every day in a period;
  • Address queries: A country, city, and street may be used as search parameters, allowing different levels of specifications of the search set;
  • Radius queries: A spot is selected on the displayed map and a radius may be defined in meters, retrieving data for the defined area.
After specifying the search parameters, the requested data will be displayed (if any). The main displaying mechanism is a heatmap over a real map provided by a Google Maps plugin, where areas with lower average speeds will tend to be closer to the red color, while areas with higher average speeds will be closer to green, for the considered searched set.
As an additional service, the retrieved data may also be displayed as a line graph, highlighting the average speed for every day. For a search query considering a large date range, the CitySpeed_Viewer automatically re-computes the graph (e.g., presenting data for every week). Finally, the displayed data, in the format of a graph, can be easily exported in the JSON format, just by pressing a button.
As reference, the employed technologies and programming libraries for the development of the CitySpeed_Viewer are: HTML5, jQuery, CSS, Google Maps API, and the AmCharts plugin. The CitySpeed_Viewer can be freely accessed at “http://lara.uefs.br/cityspeed.html”.

3.2. Development Issues

There are some important development issues that influenced the way the three logical blocks of the platform were developed. Such issues may also influence the development of extensions of the current version of CitySpeed. The most important development issues are discussed in this subsection.
An initial concern for the development of CitySpeed was the variety of operating systems for smartphones. Actually, portability was an initial requirement for the platform and, thus, speed data has to be acquired from any type, model, and version of smartphone and operating system. Due to the different models and resolutions of devices available on the market, it was necessary to employ an interface framework to reduce presentation failures. In this case, the Ionic framework was used in the developed app [43].
Another concern was about the variety of hardware, since this fact could also impact the accuracy and reliability of the data provided by GPS receivers. However, this issue is hard to control and the standard behavior is to assume that the acquired data are reliable. Nevertheless, the adopted solution for increased robustness was to acquire and to store longitude and latitude data in every speed sample (as mentioned above), in the case that a GPS receiver could not provide a valid device speed information.
When acquiring speed data, a relevant issue is to know if the data provided by a smartphone are representing a moving vehicle or not. Actually, obtaining speed through smartphones also enables the collection of data that do not include strict vehicular speeds; for example, a user leaving a moving bus and continuing to walk on a sidewalk. Although some motion type detection methods are available, it may be necessary to apply some filters to reduce some inconsistencies. For the CitySpeed_App, the employed Cordova Background Geolocation API already implements such detection methods and only provides speed data when the smartphone is “assumed” to be in a vehicle (embedded sensors on smartphones are used for this purpose). For the CitySpeed platform, it was the only employed mechanism.
The presentation of speeds at the geographical points where they were collected revealed identification problems in double-lane routes or crossings of overpasses, once data are shown on a plane. The accuracy of data obtained by GPS receivers does not allow (in some cases) identification of the movement direction, according to the precision of the collected geographical coordinates. Similarly, crossing paths in a space of two dimensions may cause similar problems. Although it may be confusing sometimes, visualization using the “road name” as a query parameter allows the exclusion of other roads, and this was the adopted method to avoid confusions.

3.3. Privacy and Security Concerns

Smartphones are devices that have become quite popular. These devices have accelerometer sensors, gravity sensors, and geo-positioning resources, generating relevant data that can be easily distributed. With proper software, mobile crowdsensing has allowed people to publish and share data in real time, which has not only opened new possibilities, but also raised important privacy and security concerns.
Due to anonymity concerns, speed samples have only geo-positioning and instantaneous speed data. Users are reported of the need for “data sharing” at the time of the app installation or at first execution, depending on the operating system characteristics. This way, the data are only stored when there is a user permission. Moreover, there is no identification of the user who is sending the information. The only “association” that exists is a data relationship, in the form of a randomly generated identification code.
Executing the developed app in the background to acquire and to transmit data is performed as a usual process of the system, without additional permissions, aimed at higher security. Moreover, the CitySpeed_Server databases are protected by user/password accesses and configured with the recommended parameters. An up-to-date version of PostgreSQL/PostGIS was installed and was operational at the time that this article was published, and it will always be upgraded when new versions are released, for security purposes.
As a final remark, all transmissions between the app and the Firebase database, between that database and the PostgreSQL/PostGIS database, and between this database and the CitySpeed_Viewer were encrypted using standard HTTPS. In this case, the communications and computation costs for encryption do not prejudice the platform operation. Therefore, the databases can only be accessed by elements of the CitySpeed platform, since authentication is performed.
Future works could further consider these issues, if they present potential security risks after the execution of more tests.

4. Results and Experiments

The developed platform was validated in two different ways. First, we wanted to know if the employed GPS-based API was trustworthy and if the acquired data could be reliably used to reflect reality. The second validation was performed by executing the platform in different cities for a long period of time, acquiring data that could be visualized. These validation phases are described in this section.

4.1. Validation of Speed Computing

The CitySpeed platform was developed around the concept of vehicular speed, as it is one of the most important pieces of information concerning traffic and mobility in modern cities. The required speed data acquisition was performed by exploiting the GPS satellites and signal receivers. GPS receivers convert the time difference between the satellite signal and the reception of the signal at a distance known as a “pseudo-range”, which can be used to calculate the position of the user based on a multi-lateralization technique (distance is measured based on the known time of transmissions) [44]. The employed API reads the speed data provided by the embedded GPS receiver in smartphones, and delivers this information to the main CitySpeed_App code.
As this is the most important asset of the platform, it had to validated somehow. For that, an empirical approach could be employed, comparing the speed displayed on the application screen with the speed reported by the vehicle, which have their speedometers already validated (according to the manufacturers) if the original conditions of the vehicles have been maintained. This type of validation presented similar results, with some small variations (it may vary from the quality of the GPS device chipset present in the smartphone, to the geographic location error of a point where an instantaneous speed was obtained). However, it is not practical for a large-scale validation, and thus a different approach was also adopted.
In order to have a more confident validation, the speed information provided by the Electronic Control Unit (ECU) of selected vehicles could be used as a reference. Some modern cars have an electronic central unit that controls the engine and other functions of the vehicle, also providing some important information for maintenance and performance monitoring. Among that information, the ECU provides data about the current speed of the vehicle.
The ECU can be accessed through the On-Board Diagnostic-II (OBD-II) standard, which provides a common access interface implemented in many vehicles of different models and brands. Since 1996, all cars manufactured and sold in the United States are required to have the OBD-II system. The European Union adopted a similar measure in 2003, while Brazil, Russia, and China followed this trend in 2010 [45]. Therefore, using the OBD-II interface, speeds from the ECU and from the CitySpeed_App could be compared.
In order to allow the desired verification, the ELM327 device was used to access the vehicle’s ECU, by attaching it to the OBD-II interface and transmitting data through the Bluetooth wireless protocol to a smartphone. The ScanMaster-ELM free software was used to perform the speed readings [46].
The ELM327 is a cheap and small device, which is connected to an OBD-II interface. Figure 4 shows one possible connection for this verification.
The tests were performed on a single vehicle, a Fiat Toro Diesel 2.0 2017/2018, with original characteristics and tires calibrated according to the vehicle manual. Using the same sample interval for both cases, speed data from the CitySpeed_App, and from the OBD-II, were obtained at the same time, allowing trustworthy comparisons. The experiments in the selected vehicle were executed in the city of Feira de Santana (Brazil) on 23 September 2018, and in the city of Aracaju (Brazil) on 4 October 2018, with a maximum speed of 80 km/h, and resulting in thousands of speed samples. Figure 5 presents some of the results for different time periods, for both speed acquisitions from the OBD-II interface and from the CitySpeed_App.
As can be seen in the presented graphics, the retrieved speed values are similar, empirically indicating that the employed GPS-based speed acquisition mechanism can be used as a trustworthy approach. However, a more consistent evaluation could be obtained by computing the dispersion among the acquired values. Figure 6 presents the correlation between the considered variables.
We used the Pearson correlation coefficient to determine the linear correlation among the acquired speed data. Equation (1) defines the Pearson correlation coefficient (r) among n values of two samples x and y, with x ¯ and y ¯ as the average values of the samples.
r = i = 1 n ( x i x ¯ ) ( y i y ¯ ) i = 1 n ( x i x ¯ ) 2 ( y i y ¯ ) 2 .
In the performed experiments, the correlation of the samples obtained from the OBD-II interface and from the CitySpeed_APP were 0.879562 (IOS system) and 0.851335 (Android system). This indicates a “strong” correlation between the compared pairs of speed samples. Therefore, this evaluation step concluded that the CitySpeed_App provided speeds that were highly realistic.

4.2. Monitoring in Urban Areas

A different evaluation phase was performed largely testing the CitySpeed_App for different users and for different cities. The idea was to obtain sufficient data to test the consistency of the databases, and also to provide data to be visualized by the CitySpeed_Viewer module.
Figure 7 presents the spatial distribution of the acquisition of speed samples. All participants in this evaluation step were volunteers that received invitations through public email lists and social networks. The CitySpeed_App was used for this intent for almost six months, which is the considered period for this evaluation.
With data being stored in the CitySpeed_Server databases, different tests were performed. Overall, the platform performed as expected, and some examples of results are presented in this section.
One of the main results of the platform is the exhibition of heatmaps. Figure 8 and Figure 9 present different heatmaps for some of the cities where vehicular speed data were acquired.
Besides the heatmaps, a useful tool is the exhibition of average speed graphics. This function was implemented in the CitySpeed_Viewer, and can be very valuable for different analyses. Figure 10 shows a printscreen of a graphic, showing different average measures for certain days in 2018, in the city of São Paulo.
At the end of this evaluation phase, we concluded that the platform was ready to be used, potentially supporting any number of smart-city applications.

5. Perspectives of the CitySpeed Platform for Smart Cities

With the growth of cities and the increasing in the number of vehicles on urban roads, it may be necessary to employ a tool to allow detailed views of the speeds of such vehicles. The use of physical sensors, video monitoring, and other physical devices may be unfeasible for some cities, due to the high infrastructure costs involved. This article proposes, then, a generic platform to collect road speeds using mobile sensing in an efficient manner, with a reduction in infrastructure costs through the use of crowdsensing.
The CitySpeed platform, as described in this article, is fully operational and ready to be used. For the broad scenario of smart cities, there are a lot of potential applications which can exploit it. This section discusses some important issues when employing the CitySpeed platform in real applications.

5.1. Crowdsensing and People Engagement

The way people interact with the world around them is constantly changing, due to the emergence of computer-driven applications. In this ubiquitous world, people want to be connected to anyone, anytime, anywhere. In this sense, we are experiencing a large and heterogeneous set of devices and sensors, interconnected in a world-wide sense.
Taking advantage of the sensing capabilities provided by computationally powerful mobile devices is an essential task for any large-scale information collection process. In this context, the collected information can be used to enhance viewings of public services, in order to assist different types of data analysis. The crowdsensing paradigm is an effective, highly distributed, and low-cost solution for data acquisition, benefiting different scenarios (such as smart cities).
A relevant challenge when employing crowdsensing-based systems is user engagement. In general, the expected outcome of systems like CitySpeed should (re)direct users to something they consider to be of interest, or to promote some kind of benefit [47]. Monitoring of mobility and traffic conditions using devices capable of obtaining real-time geographic localization has brought to the transport engineering community a new perspective for gathering information about vehicles while saving time for drivers, popularizing services such as Waze and Google Maps. This is, in fact, the main incentive for users to install and execute such applications. In the case of the CitySpeed platform, as it is implemented, the benefit is indirect in the form of better planning of roads and traffic, which may only be felt in future. Knowing that, what the platform does is simply ease the burden, providing an app that has low energy consumption, reduced storage usage, and low background processing demand, with the promise of helping better city planning. Actually, it is important not to overload users with duties over the limit of what they can contribute [32].
Finally, for a large-scale use of the platform, some more direct benefits could be employed; for example, assuring for the users of some discounts on taxes or free parking in some regions of a city. The idea is to promote the use of the developed app in the largest number of smartphones, potentially resulting in a more confident and complete dataset of vehicular speeds.

5.2. Potential Applications

Information is highly important for efficient planning in urban areas, and governments and companies are becoming more and more committed to exploit different sources of data to provide meaningful information. There are many challenges to face when deploying smart cities, and the developed platform can serve as an important tool to support a large number of applications.
Knowing the average vehicular speed in a determined region, for a defined period of time, can be useful in many cases. New roads, bridges, and accesses may be planned, or the traffic flow can be changed, if some regions are continuously experiencing a low average speed. Indirect information about accidents and heavy rain can also be inferred, according to the perceived speeds. In fact, vehicular speeds tell much about cities.
Another promising application for the CitySpeed platform is the integration of different systems. As an example, the work in [13] proposed a crowdsensing-based platform to monitor vehicular emissions in urban areas, seen as vehicles are big sources of pollution in modern cities. In that work, the OBD-II interface is read and data are transmitted to the cloud through smartphones. A potential use of the CitySpeed platform is to cross information, providing more detailed views over a city. The same could be performed for other relevant data, for example in employing data mining and machine learning techniques [9,48,49].

6. Conclusions

The construction of smart cities is an already-initiated process, with many large cities around the globe becoming more and more “smart” when data from cyber and physical spaces are integrated [50]. Besides being a growing and already significant market, smart cities are believed to be one of the main initiatives in improving the quality of life in urban areas. The development of new technologies and paradigms to better support the construction of such cities is, consequently, of paramount importance.
Vehicular speeds are important for many applications in the smart city environment. Although this issue is important and requires solutions, there are some obstacles that require effective approaches. To maintain vehicle monitoring in order to obtain relevant information about roads, streets, avenues, and so on, may require the use of sensors, video cameras, and other devices, which are costly and time-consuming to implement. However, in the view of ubiquitous computing, there is the possibility of acquiring such data through crowdsensing techniques. The use of the smartphones of ordinary drivers in a city is indeed an effective and cheap solution, bringing many benefits.
The CitySpeed platform contributes to the development of smart-city applications in two different ways: First, it provides a generic, effective, and distributed solution to acquire vehicular speeds through crowdsensing; and second, it presents development details that can be helpful in the development of other crowdsensing-based tools. After the performed evaluations, it could be seen that the platform works as expected, and it is freely and openly available for anyone.
As for future works, the developed platform will be extended to include new functions in the CitySpeed_Viewer logical block, allowing users to make different types of search queries and enhancing the way results are presented. Moreover, the promotion of the use of the CitySpeed_App is also expected, for the acquisition of more speed data. Finally, partnerships with the government will be sought, in order to employ the CitySpeed platform on a larger scale, for better traffic planning in municipalities.

Author Contributions

The authors all contributed equally to the development of this work, in different perspectives. All authors participated in the performed reviews of the literature, providing feedback for the brainstorm phases. The development of the CitySpeed modules was mostly conducted by A.D. and D.G.C.; D.G.C. and A.D. managed the discussions, the project development, and the manuscript writing. The original manuscript was written by all authors, who also contributed to the revisions of the article.

Funding

This research received no external funding.

Conflicts of Interest

The authors declare no conflict of interest.

References

  1. Egger, S. Determining a sustainable city model. Environ. Model. Softw. 2006, 21, 1235–1246. [Google Scholar] [CrossRef]
  2. Silva, B.N.; Khan, M.; Han, K. Towards sustainable smart cities: A review of trends, architectures, components, and open challenges in smart cities. Sustain. Cities Soc. 2018, 38, 697–713. [Google Scholar] [CrossRef]
  3. Talari, S.; Shafie-khah, M.; Siano, P.; Loia, V.; Tommasetti, A.; Catalão, J.P.S. A Review of Smart Cities Based on the Internet of Things Concept. Energies 2017, 10, 421. [Google Scholar] [CrossRef]
  4. Allam, Z.; Newman, P. Redefining the Smart City: Culture, Metabolism and Governance. Smart Cities 2018, 1, 4–25. [Google Scholar] [CrossRef]
  5. Alvear, O.; Calafate, C.T.; Cano, J.C.; Manzoni, P. Crowdsensing in Smart Cities: Overview, Platforms, and Environment Sensing Issues. Sensors 2018, 18, 460. [Google Scholar] [CrossRef] [PubMed]
  6. Zanella, A.; Bui, N.; Castellani, A.; Vangelista, L.; Zorzi, M. Internet of Things for Smart Cities. IEEE Internet Things J. 2014, 1, 22–32. [Google Scholar] [CrossRef]
  7. Costa, D.G.; Collotta, M.; Pau, G.; Duran-Faundez, C. A Fuzzy-Based Approach for Sensing, Coding and Transmission Configuration of Visual Sensors in Smart City Applications. Sensors 2017, 17, 93. [Google Scholar] [CrossRef] [PubMed]
  8. Lin, J.; Yu, W.; Zhang, N.; Yang, X.; Zhang, H.; Zhao, W. A Survey on Internet of Things: Architecture, Enabling Technologies, Security and Privacy, and Applications. IEEE Internet Things J. 2017, 4, 1125–1142. [Google Scholar] [CrossRef]
  9. Costa, D.G.; Duran-Faundez, C.; Andrade, D.C.; Rocha-Junior, J.B.; Just Peixoto, J.P. TwitterSensing: An Event-Based Approach for Wireless Sensor Networks Optimization Exploiting Social Media in Smart City Applications. Sensors 2018, 18, 1080. [Google Scholar] [CrossRef] [PubMed]
  10. Mota, V.F.; Silva, T.H.; Macedo, D.F.; Ghamri-Doudane, Y.; Nogueira, J.M. Towards scalable mobile crowdsensing through device-to-device communication. J. Netw. Comput. Appl. 2018, 122, 99–106. [Google Scholar] [CrossRef]
  11. Liu, J.; Shen, H.; Narman, H.S.; Chung, W.; Lin, Z. A Survey of Mobile Crowdsensing Techniques: A Critical Component for The Internet of Things. ACM Trans. Cyber-Phys. Syst. 2018, 2, 18:1–18:26. [Google Scholar] [CrossRef]
  12. Johansson, C.; Lövenheim, B.; Schantz, P.; Wahlgren, L.; Almström, P.; Markstedt, A.; Strömgren, M.; Forsberg, B.; Sommar, J.N. Impacts on air pollution and health by changing commuting from car to bicycle. Sci. Total Environ. 2017, 584–585, 55–63. [Google Scholar] [CrossRef] [PubMed]
  13. Silva, M.; Signoretti, G.; Oliveira, J.; Silva, I.; Costa, D.G. A Crowdsensing Platform for Monitoring of Vehicular Emissions: A Smart City Perspective. Future Internet 2019, 11, 13. [Google Scholar] [CrossRef]
  14. Wu, X.; Wu, Y.; Zhang, S.; Liu, H.; Fu, L.; Hao, J. Assessment of vehicle emission programs in China during 1998–2013: Achievement, challenges and implications. Environ. Pollut. 2016, 214, 556–567. [Google Scholar] [CrossRef] [PubMed]
  15. Google. Google Maps. Available online: https://maps.google.com/ (accessed on 2 January 2019).
  16. Mobile, G. Waze. Available online: https://www.waze.com (accessed on 2 January 2019).
  17. Costa, D.G.; Duran-Faundez, C. Open-Source Electronics Platforms as Enabling Technologies for Smart Cities: Recent Developments and Perspectives. Electronics 2018, 7, 404. [Google Scholar] [CrossRef]
  18. Habibzadeh, H.; Soyata, T.; Kantarci, B.; Boukerche, A.; Kaptan, C. Sensing, communication and security planes: A new challenge for a smart city system design. Comput. Netw. 2018, 144, 163–200. [Google Scholar] [CrossRef]
  19. Anand, P.; NavÃ-o-Marco, J. Governance and economics of smart cities: opportunities and challenges. Telecommun. Policy 2018, 42, 795–799. [Google Scholar] [CrossRef]
  20. Alavi, A.H.; Jiao, P.; Buttlar, W.G.; Lajnef, N. Internet of Things-enabled smart cities: State-of-the-art and future trends. Measurement 2018, 129, 589–606. [Google Scholar] [CrossRef]
  21. Nagy, A.M.; Simon, V. Survey on traffic prediction in smart cities. Pervasive Mob. Comput. 2018, 50, 148–163. [Google Scholar] [CrossRef]
  22. Braun, T.; Fung, B.C.; Iqbal, F.; Shah, B. Security and privacy challenges in smart cities. Sustain. Cities Soc. 2018, 39, 499–507. [Google Scholar] [CrossRef]
  23. Pramanik, M.I.; Lau, R.Y.; Demirkan, H.; Azad, M.A.K. Smart health: Big data enabled health paradigm within smart cities. Expert Syst. Appl. 2017, 87, 370–383. [Google Scholar] [CrossRef]
  24. Lyons, G. Getting smart about urban mobility—Aligning the paradigms of smart and sustainable. Transp. Res. Part A Policy Pract. 2018, 115, 4–14. [Google Scholar] [CrossRef]
  25. Petkovics, A.; Simon, V.; Gódor, I.; Böröcz, B. Crowdsensing Solutions in Smart Cities: Introducing a Horizontal Architecture. In Proceedings of the 13th International Conference on Advances in Mobile Computing and Multimedia, MoMM, Brussels, Belgium, 11–13 December 2015; pp. 33–37. [Google Scholar]
  26. Li, X.; Goldberg, D.W. Toward a mobile crowdsensing system for road surface assessment. Comput. Environ. Urban Syst. 2018, 69, 51–62. [Google Scholar] [CrossRef]
  27. Singh, G.; Bansal, D.; Sofat, S. A smartphone based technique to monitor driving behavior using DTW and crowdsensing. Pervasive Mob. Comput. 2017, 40, 56–70. [Google Scholar] [CrossRef]
  28. Villanueva, F.J.; Villa, D.; Santofimia, M.J.; Barba, J.; López, J.C. Crowdsensing smart city parking monitoring. In Proceedings of the 2015 IEEE 2nd World Forum on Internet of Things (WF-IoT), Milan, Italy, 14–16 December 2015; pp. 751–756. [Google Scholar]
  29. Rahman, S.A.; Mourad, A.; Barachi, M.E.; Orabi, W.A. A novel on-demand vehicular sensing framework for traffic condition monitoring. Veh. Commun. 2018, 12, 165–178. [Google Scholar]
  30. Bajaj, G.; Bouloukakis, G.; Pathak, A.; Singh, P.; Georgantas, N.; Issarny, V. Toward Enabling Convenient Urban Transit through Mobile Crowdsensing. In Proceedings of the 2015 IEEE 18th International Conference on Intelligent Transportation Systems, Las Palmas, Spain, 15–18 September 2015; pp. 290–295. [Google Scholar]
  31. Liu, Z.; Jiang, S.; Zhou, P.; Li, M. A Participatory Urban Traffic Monitoring System: The Power of Bus Riders. IEEE Trans. Intell. Transp. Syst. 2017, 18, 2851–2864. [Google Scholar] [CrossRef]
  32. Cardone, G.; Corradi, A.; Foschini, L.; Ianniello, R. ParticipAct: A Large-Scale Crowdsensing Platform. IEEE Trans. Emerg. Top. Comput. 2016, 4, 21–32. [Google Scholar] [CrossRef]
  33. Hu, X.; Chu, T.H.S.; Chan, H.C.B.; Leung, V.C.M. Vita: A Crowdsensing-Oriented Mobile Cyber-Physical System. IEEE Trans. Emerg. Top. Comput. 2013, 1, 148–165. [Google Scholar] [CrossRef]
  34. Messaoud, R.B.; Rejiba, Z.; Ghamri-Doudane, Y. An energy-aware end-to-end Crowdsensing platform: Sensarena. In Proceedings of the 2016 13th IEEE Annual Consumer Communications Networking Conference (CCNC), Las Vegas, NV, USA, 9–12 January 2016; pp. 284–285. [Google Scholar]
  35. Dutta, J.; Gazi, F.; Roy, S.; Chowdhury, C. AirSense: Opportunistic crowd-sensing based air quality monitoring system for smart city. In Proceedings of the 2016 IEEE SENSORS, Orlando, FL, USA, 30 October–3 November 2016; pp. 1–3. [Google Scholar]
  36. Zappatore, M.; Longo, A.; Bochicchio, M.A. Using mobile crowd sensing for noise monitoring in smart cities. In Proceedings of the 2016 International Multidisciplinary Conference on Computer and Energy Science (SpliTech), Split, Croatia, 13–15 July 2016; pp. 1–6. [Google Scholar]
  37. Wang, C.; Zhang, Z.; Shao, L.; Zhou, M. Estimating travel speed via sparse vehicular crowdsensing data. In Proceedings of the 2016 IEEE 3rd World Forum on Internet of Things (WF-IoT), Reston, VA, USA, 12–14 December 2016; pp. 643–648. [Google Scholar]
  38. TransistorSoftware. Cordova Background Geolocation API. Available online: https://www.transistorsoft.com/shop/products/cordova-background-geolocation (accessed on 2 January 2019).
  39. SQLite. SQLite Database System. Available online: https://www.sqlite.org (accessed on 2 January 2019).
  40. Firebase. Google Firebase Database System. Available online: https://firebase.google.com (accessed on 2 January 2019).
  41. PostgreSQL. PostgreSQL Database System. Available online: https://www.postgresql.org (accessed on 2 January 2019).
  42. PostGIS. PostGIS Database System. Available online: https://postgis.net/= (accessed on 2 January 2019).
  43. Framework, I. Ionic. Available online: https://ionicframework.com (accessed on 2 January 2019).
  44. Kaplan, E.; Hegarty, C. Understanding GPS: Principles and Applications; Artech House: Norwood, MA, USA, 2005. [Google Scholar]
  45. Ferris, D.H. Global OBD Legislation Update (Worldwide Requirements). Available online: http://www.sae.org/events/training/symposia/obd/presentations/2009/d1daveferris.pdf (accessed on 4 August 2017).
  46. WGSoft. ScanMaster-ELM. Available online: https://www.wgsoft.de/shop/obd-software/4/scanmaster-elm-f.-elm327 (accessed on 2 January 2019).
  47. Zhang, X.; Yang, Z.; Sun, W.; Liu, Y.; Tang, S.; Xing, K.; Mao, X. Incentives for Mobile Crowd Sensing: A Survey. IEEE Commun. Surv. Tutor. 2016, 18, 54–67. [Google Scholar] [CrossRef]
  48. Firmanuddin, G.; Supangkat, S.H. City analytic development for modeling population using data analysis prediction. In Proceedings of the 2016 International Conference on ICT For Smart Society (ICISS), Surabaya, Indonesia, 20–21 July 2016; pp. 12–15. [Google Scholar]
  49. Jin, J.; Gubbi, J.; Marusic, S.; Palaniswami, M. An Information Framework for Creating a Smart City through Internet of Things. IEEE Internet Things J. 2014, 1, 112–121. [Google Scholar] [CrossRef]
  50. Ishida, T. Digital City, Smart City and Beyond. In Proceedings of the 26th International Conference on World Wide Web Companion, Perth, Australia, 3–7 April 2017; International World Wide Web Conferences Steering Committee: Geneva, Switzerland, 2017; pp. 1151–1152. [Google Scholar]
Figure 1. The CitySpeed platform and its conceptual operation.
Smartcities 02 00004 g001
Figure 2. Main screen of the developed app for speed monitoring, for IOS (left) and Android (right) systems.
Smartcities 02 00004 g002
Figure 3. Initial page provided by the CitySpeed_Viewer block. It can be accessed in Portuguese or English.
Smartcities 02 00004 g003
Figure 4. ELM327 connected to a OBD-II interface.
Smartcities 02 00004 g004
Figure 5. Some of the speed values for the OBD-II and CitySpeed_App, for the same instants of time.
Smartcities 02 00004 g005
Figure 6. Dispersion correlation for all acquired speed samples.
Smartcities 02 00004 g006
Figure 7. Global distribution of the acquired speed samples.
Smartcities 02 00004 g007
Figure 8. Example of a heatmap for the city of Aracaju, Brazil.
Smartcities 02 00004 g008
Figure 9. Example of a heatmap for the city of São Paulo, Brazil.
Smartcities 02 00004 g009
Figure 10. Average speeds for the city of São Paulo, Brazil (the samples were not acquired daily).
Smartcities 02 00004 g010
Table 1. Some smartphone-based crowdsensing platforms.
WorkYearAcquired DataDescription
Hu et al. [33]2013Generic tasksA generic task-centric platform with additional reliability guarantees.
Cardone et al. [32]2016Generic tasksA platform for crowdsensing performed by students. It may define “tasks” for the users.
Dutta et al. [35]2016Air pollutionAn additional device is attached to smartphones, which participates by providing information about air quality.
Zappatore et al. [36]2016SoundEmbedded microphones in smartphones are used to provide information about noises.
Wang et al. [37]2016Vehicular speedsAcquires vehicular speeds and employs correlation methods to provide perceptions of average speeds over roads.
Silva et al. [13]2019Vehicular emissionsThis crowdsensing platform acquires pollution data from OBD-II interfaces and distributes them through smartphones.

