Article

Physics-Guided Sequential State Space Transformer (PS3T) for Projection Domain LDCT Denoising

1
Department of Electrical, Computer and Biomedical Engineering, Toronto Metropolitan University, Toronto, ON M5B 2K3, Canada
2
Department of Medical Imaging, University of Saskatchewan, Saskatoon, SK S7N 0W8, Canada
*
Author to whom correspondence should be addressed.
Signals 2026, 7(5), 89; https://doi.org/10.3390/signals7050089
Submission received: 13 June 2026 / Revised: 7 August 2026 / Accepted: 2 September 2026 / Published: 14 September 2026

Abstract

Low-Dose Computed Tomography (LDCT) reduces radiation exposure but introduces severe quantum noise and streak artifacts that degrade image quality. To address these challenges, we propose the Physics-Guided Sequential State Space Transformer ( P S 3 T ), a projection-domain denoising framework that combines sequential state-space modeling with a photon-aware attention mechanism to capture long-range dependencies across projection angles with linear computational complexity. A differentiable Filtered Backprojection (FBP) layer further enforces reconstruction-domain consistency during training. The proposed framework was evaluated on the Mayo Clinic LDCT and Projection Dataset using patient-level dataset partitioning. Experimental results demonstrate that P S 3 T consistently outperforms state-of-the-art methods, including DRL, SADiff, and GEDFormer, across the abdomen, head, and chest datasets. On the abdomen dataset, P S 3 T reached a peak PSNR of 42.40 dB, an SSIM of 0.9020, and the lowest RMSE of 0.0076 across anatomical regions. Statistical analysis using 95% confidence intervals and paired Wilcoxon signed-rank tests confirmed that these improvements were significant ( p < 0.05 ). Furthermore, P S 3 T achieved the lowest reconstruction consistency loss (0.0128 at epoch 50), demonstrating stable convergence and the effectiveness of incorporating acquisition physics into projection-domain LDCT denoising.

1. Introduction

Low-Dose Computed Tomography (LDCT) has emerged as a cornerstone of modern diagnostic imaging, offering a vital means to reduce patient exposure to ionizing radiation [1]. However, the physical constraints of lowering the tube current inherently lead to a reduction in photon counts, manifesting as severe quantum noise and streak artifacts in the projection (sinogram) domain [2]. These degradations significantly complicate the reconstruction process, often leading to reduced diagnostic sensitivity and specificity [3].
To bridge the gap between empirical data-driven performance and physical consistency, we propose the Physics-Guided Sequential State Space Transformer ( P S 3 T ). By integrating state space modeling (SSM) with a photon-aware attention mechanism, our framework explicitly models the X-ray projection process directly in the sinogram domain. Unlike standard Vision Transformers (ViTs) that rely on computationally expensive self-attention mechanisms [4,5], P S 3 T leverages the linear complexity of sequential state space evolution to capture long-range dependencies across projection angles efficiently.

1.1. LDCT Reconstruction Challenges

Computed tomography (CT) is one of the most widely used diagnostic imaging modalities due to its ability to provide high-resolution cross-sectional anatomical information [1]. However, concerns regarding radiation-induced risks have motivated the adoption of low-dose CT (LDCT) protocols, particularly in screening and longitudinal imaging applications [6]. Reducing the X-ray tube current or exposure time effectively lowers patient radiation dose but simultaneously increases the noise level in the acquired measurements, resulting in degraded image quality and reduced diagnostic confidence [7,8].
Unlike additive Gaussian noise commonly assumed in conventional image restoration problems, LDCT measurements are governed by photon-counting statistics and are therefore characterized by signal-dependent Poisson noise [9]. Following logarithmic transformation and image reconstruction, the resulting noise distribution becomes spatially varying and highly non-stationary. Furthermore, photon starvation, beam hardening, scatter, and detector imperfections introduce complex artifacts that propagate through the reconstruction process and manifest as streaking, texture distortion, and attenuation bias within reconstructed CT images [5,10,11]. These characteristics make LDCT denoising substantially more challenging than conventional image denoising tasks.
Historically, model-based iterative reconstruction (MBIR) techniques attempted to address these challenges by incorporating statistical noise models and newly developed regularization terms [12,13,14]. Although effective, such approaches often require extensive computational resources and may oversmooth fine anatomical structures [14,15]. Subsequently, sparse representation and dictionary learning methods were proposed to exploit image priors for noise suppression [16]. Recent studies have further demonstrated the effectiveness of variational decomposition and dictionary-learning frameworks for preserving structural information while reducing LDCT noise [17,18]. Nevertheless, handcrafted priors frequently struggle to generalize across different anatomical regions, dose levels, and acquisition protocols.
As a result, deep learning approaches have become the dominant paradigm for LDCT denoising due to their ability to learn complex image priors directly from data. However, despite significant progress, challenges remain in preserving anatomical fidelity, maintaining attenuation consistency, and ensuring robustness across varying clinical imaging conditions [7,8].

1.2. Deep Learning in Projection-Domain Denoising

Deep learning-based LDCT denoising methods can generally be categorized into image-domain, projection-domain, and hybrid-domain approaches. Early image-domain methods relied primarily on convolutional neural networks (CNNs), including RED-CNN, GAN-based architectures, and residual learning frameworks, which demonstrated substantial improvements over traditional denoising techniques [19,20,21]. However, image-domain approaches often operate after reconstruction, limiting their ability to exploit the underlying physics of CT acquisition and potentially introducing inconsistencies between denoised images and the original projection measurements [7,20].
To address these limitations, increasing attention has been directed toward projection-domain denoising, where noise suppression is performed directly on raw sinogram measurements before image reconstruction [22]. Since projection data retain the original photon statistics and acquisition geometry, projection-domain processing provides a more physically meaningful representation of measurement uncertainty [23]. Recent studies have shown that incorporating sinogram information can improve reconstruction fidelity and reduce the propagation of noise-induced artifacts into reconstructed CT images [24,25].
Alongside the transition toward projection-domain processing, Transformer-based architectures have emerged as powerful alternatives to convolutional networks due to their ability to capture long-range dependencies and global contextual information [26,27]. Examples include Swin Transformer-based denoising frameworks, Hformer and foundational or pure Vision Transformer (ViT) architectures specifically designed for LDCT restoration [17,28,29]. While these methods often outperform conventional CNNs in terms of structural preservation and image quality, their self-attention mechanisms exhibit quadratic computational complexity with respect to input size, making them computationally expensive for high-resolution medical imaging applications [30].
More recently, diffusion-based methods have established new state-of-the-art performance in LDCT denoising by learning iterative noise-removal processes. Models such as MoCoDiff, SADiff, dose-aware diffusion networks, and zero-shot diffusion frameworks have demonstrated exceptional denoising capability and improved generalization across varying dose levels and acquisition protocols [3,24,31,32]. Despite their success, diffusion models often require multiple sampling iterations during inference, leading to substantial computational overhead that may limit clinical deployment.
To overcome the computational limitations of both Transformers and diffusion models, recent research has begun exploring state-space models (SSMs) as an alternative mechanism for long-range dependency modeling [33,34]. State-space architectures can capture global contextual information while maintaining linear computational complexity, offering improved scalability for high-resolution medical images. Recent studies such as DenoMamba, ViMEDnet and CT-Mamba have demonstrated that state-space modeling can achieve competitive LDCT denoising performance while significantly reducing computational requirements [33,34,35]. These developments suggest that integrating projection-domain processing, physics-guided modeling, and state-space learning may provide a promising direction for next-generation LDCT denoising frameworks.

1.3. Physics-Guided Deep Learning

The paradigm shift toward physics-guided deep learning aims to embed prior domain knowledge directly into the neural network. Our proposed model, which is referred to as P S 3 T , contributes to this field through three primary novelties:
  • By replacing quadratic self-attention with a sequential state space model, the architecture achieves efficient long-range dependency modeling across the sinogram’s angular dimension.
  • The attention mechanism is dynamically conditioned on a photon-estimation uncertainty map ( U t ), allowing the model to adaptively weigh features based on local signal-to-noise ratios.
  • The integration of a differentiable Filtered Backprojection (FBP) layer allows for end-to-end training with reconstruction-domain consistency, ensuring the denoised sinogram remains physically accurate for the target NDCT images.
The remainder of this paper is organized as follows: Section 2 describes the proposed system designs and dataset preparation; Section 3 presents and analyzes the results; and Section 4 concludes the paper and outlines directions for future work.

2. Materials and Methods

2.1. Network Architecture

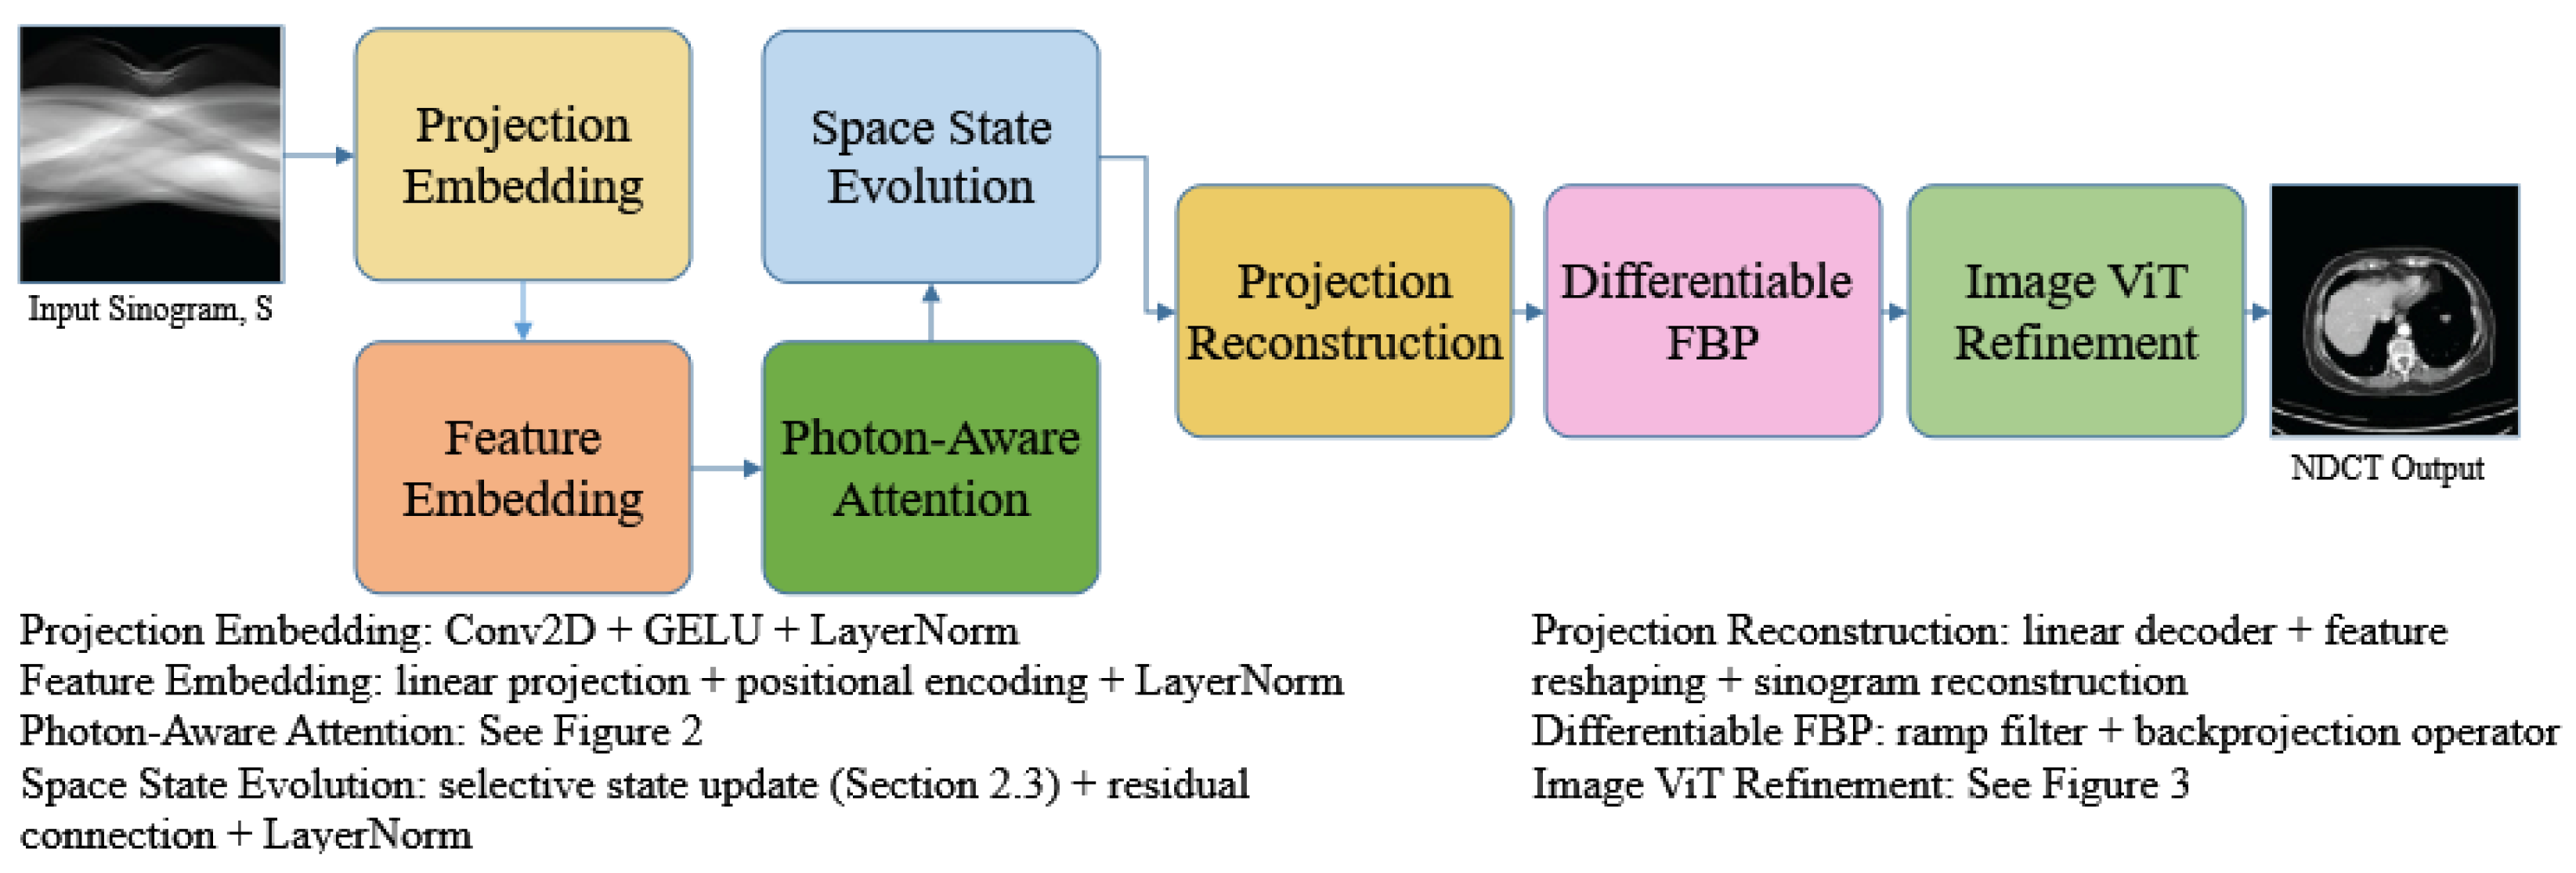
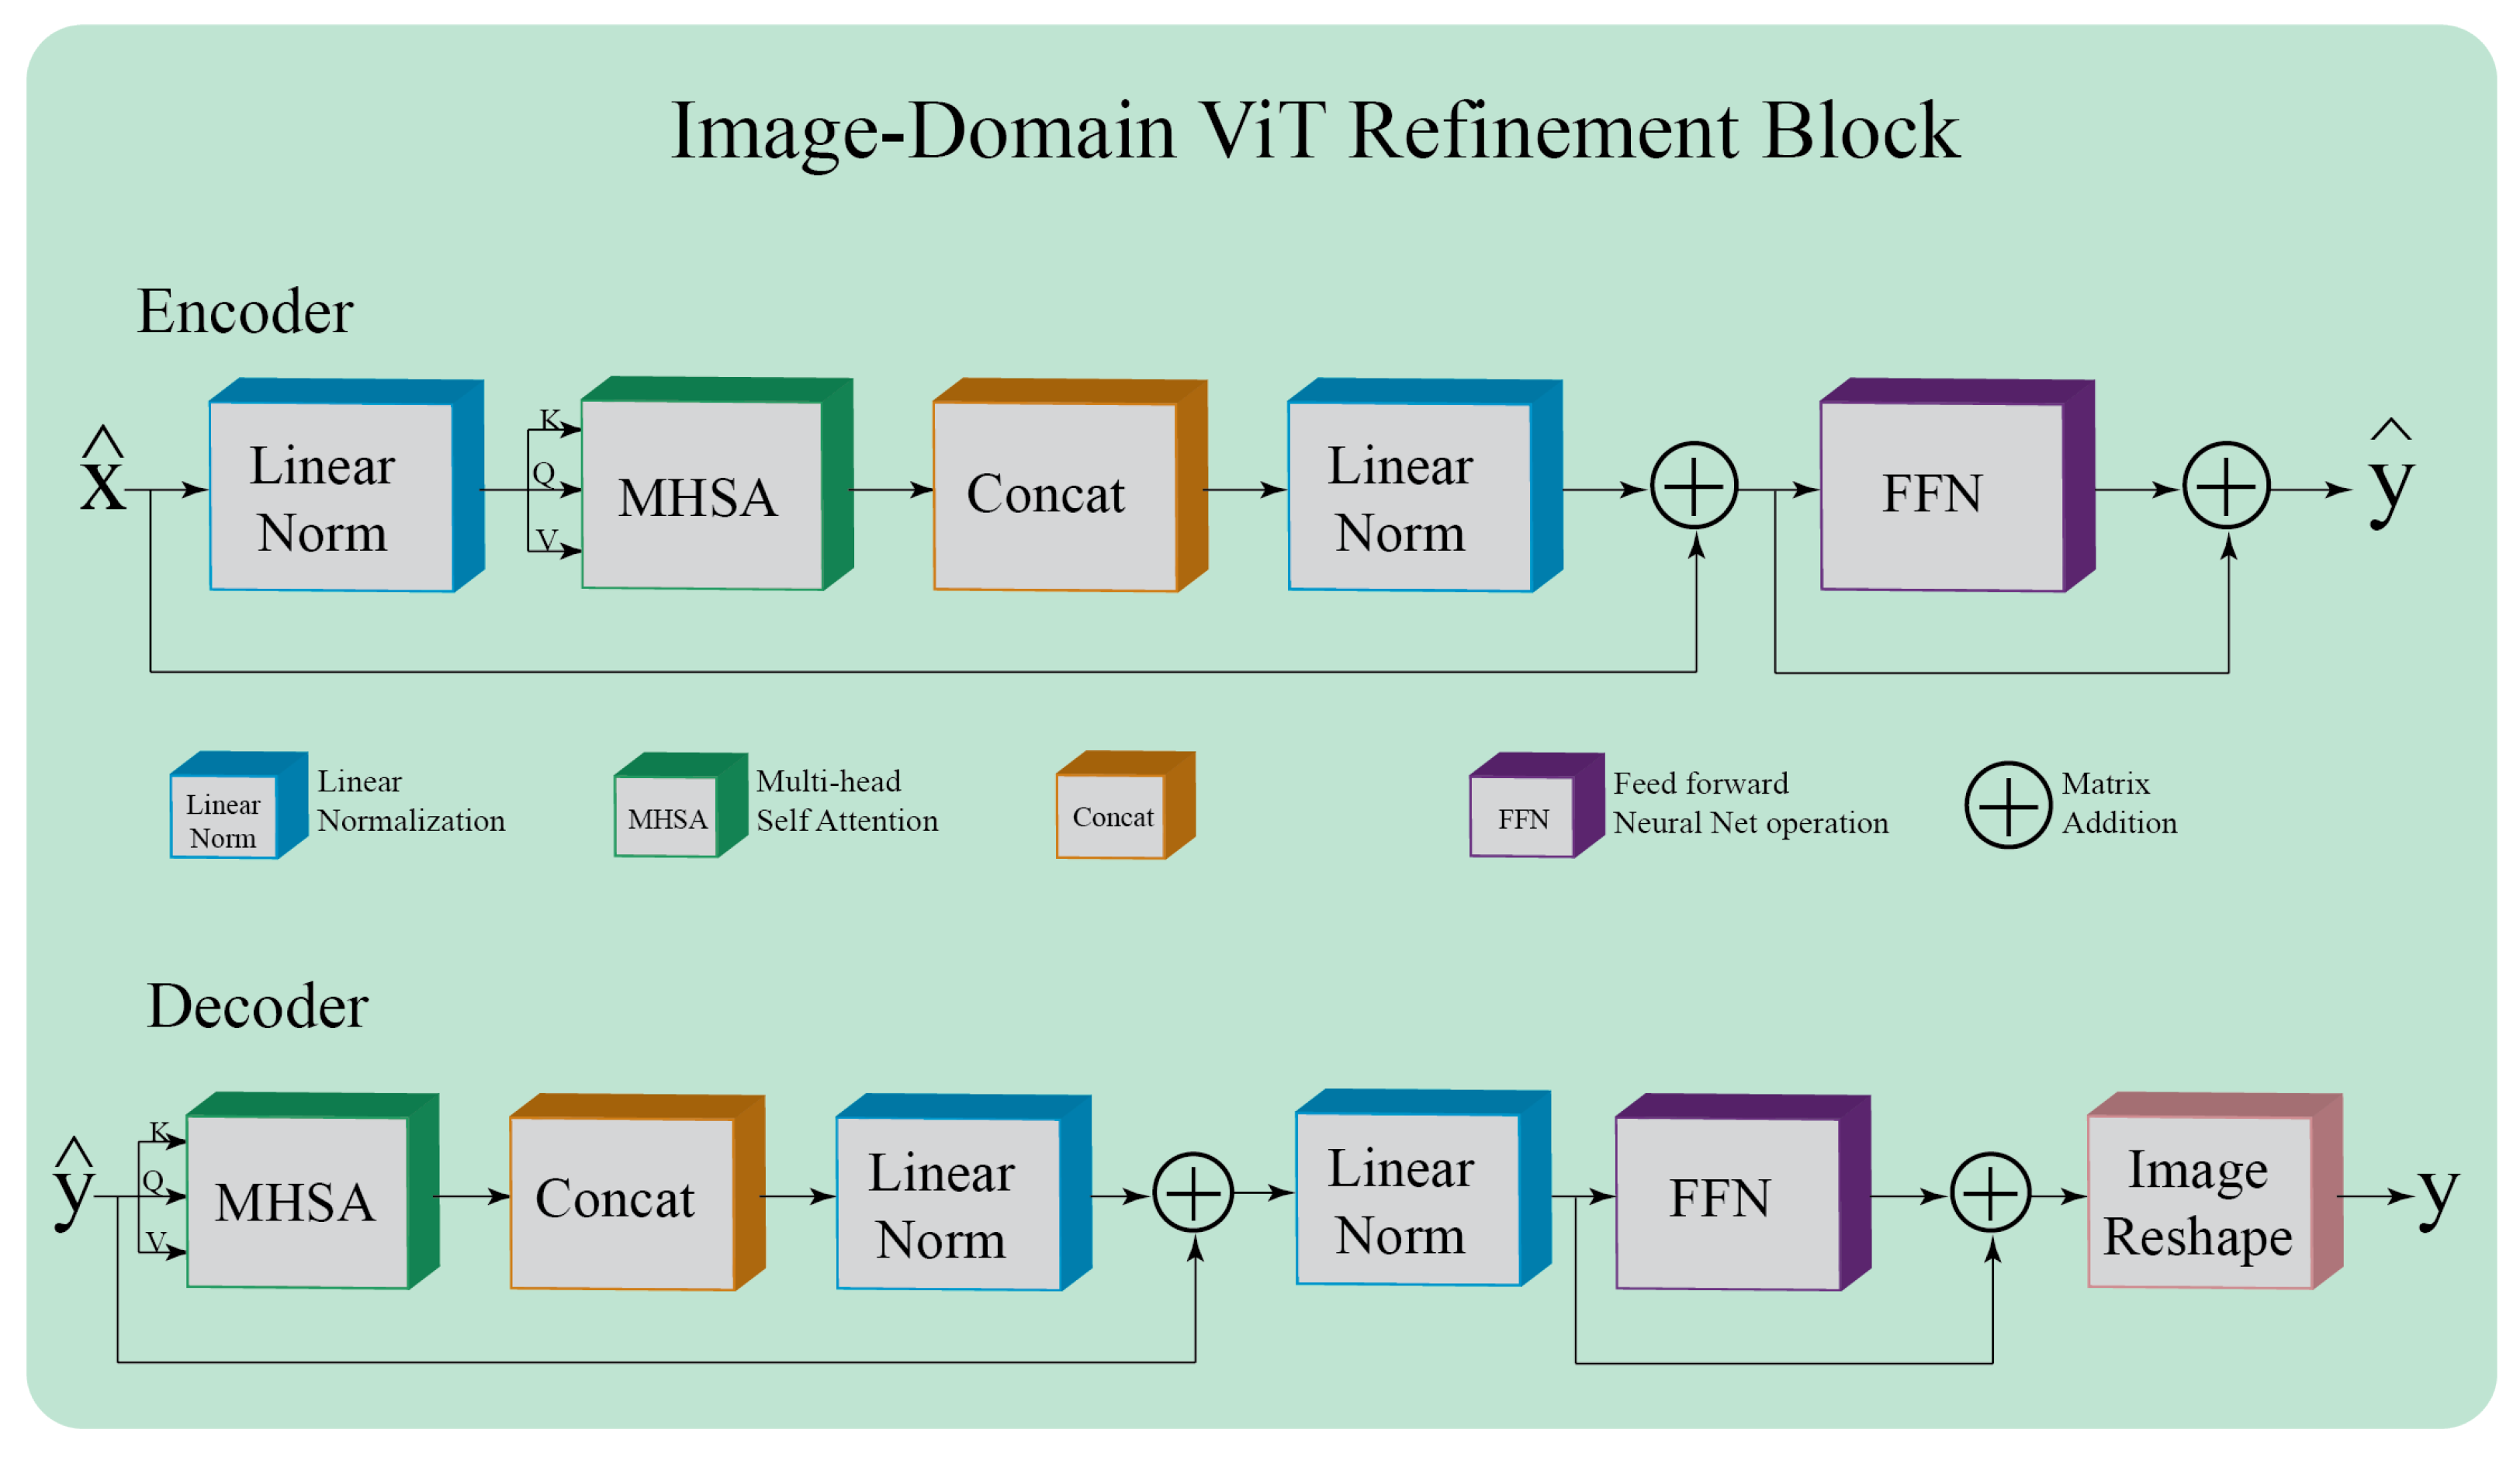
The proposed P S 3 T architecture employs a multi-stage framework to progressively restore high-quality normal-dose CT (NDCT) images from noisy low-dose projection measurements. As illustrated in Figure 1, the pipeline begins by processing the input sinogram through a Projection Embedding layer to generate high-dimensional projection features. These features are subsequently refined using the Photon-Aware Physics Attention module (Figure 2), which incorporates local photon statistics to guide feature learning and account for uncertainty in photon-starved measurements. The resulting representations are then passed to the Sequential State Space Evolution encoder, where hidden attenuation states are propagated across acquisition angles to capture long-range dependencies within the projection domain. The denoised projections are reconstructed through a Projection Reconstruction layer and subsequently transformed into the image domain using a differentiable Filtered Backprojection (FBP) operator, (R(·)). Finally, an Image-Domain Vision Transformer (ViT) (Figure 3) further refines anatomical structures and suppresses residual artifacts, producing the final NDCT-quality reconstruction.

2.2. Projection Embedding and Photon-Aware Transformer

The input sinogram ( S t ) at acquisition angle (t) is first processed through a projection embedding layer to generate a high-dimensional feature representation:
x t = W E S t + b E
where ( W E ) and ( b E ) denote the learnable projection embedding parameters.
To incorporate the underlying CT acquisition physics, the photon count associated with each projection measurement is estimated according to the Beer–Lambert law [36]:
P t = exp ( S t )
where ( P t ) represents the normalized photon intensity reaching the detector. Low photon counts correspond to regions with higher quantum noise and increased uncertainty.
An uncertainty map is subsequently computed as
U t = 1 P t + ϵ
where ( ϵ ) is a small constant introduced for numerical stability. The uncertainty map assigns larger values to photon-starved measurements and smaller values to high-confidence projections.
The embedded projection features are then processed by a Photon-Aware Transformer (PT) module. Query, key, and value representations are obtained through linear projections:
Q t = W Q x t , K t = W K x t , V t = W V x t
where ( W Q ), ( W K ), and ( W V ) denote learnable weight matrices.
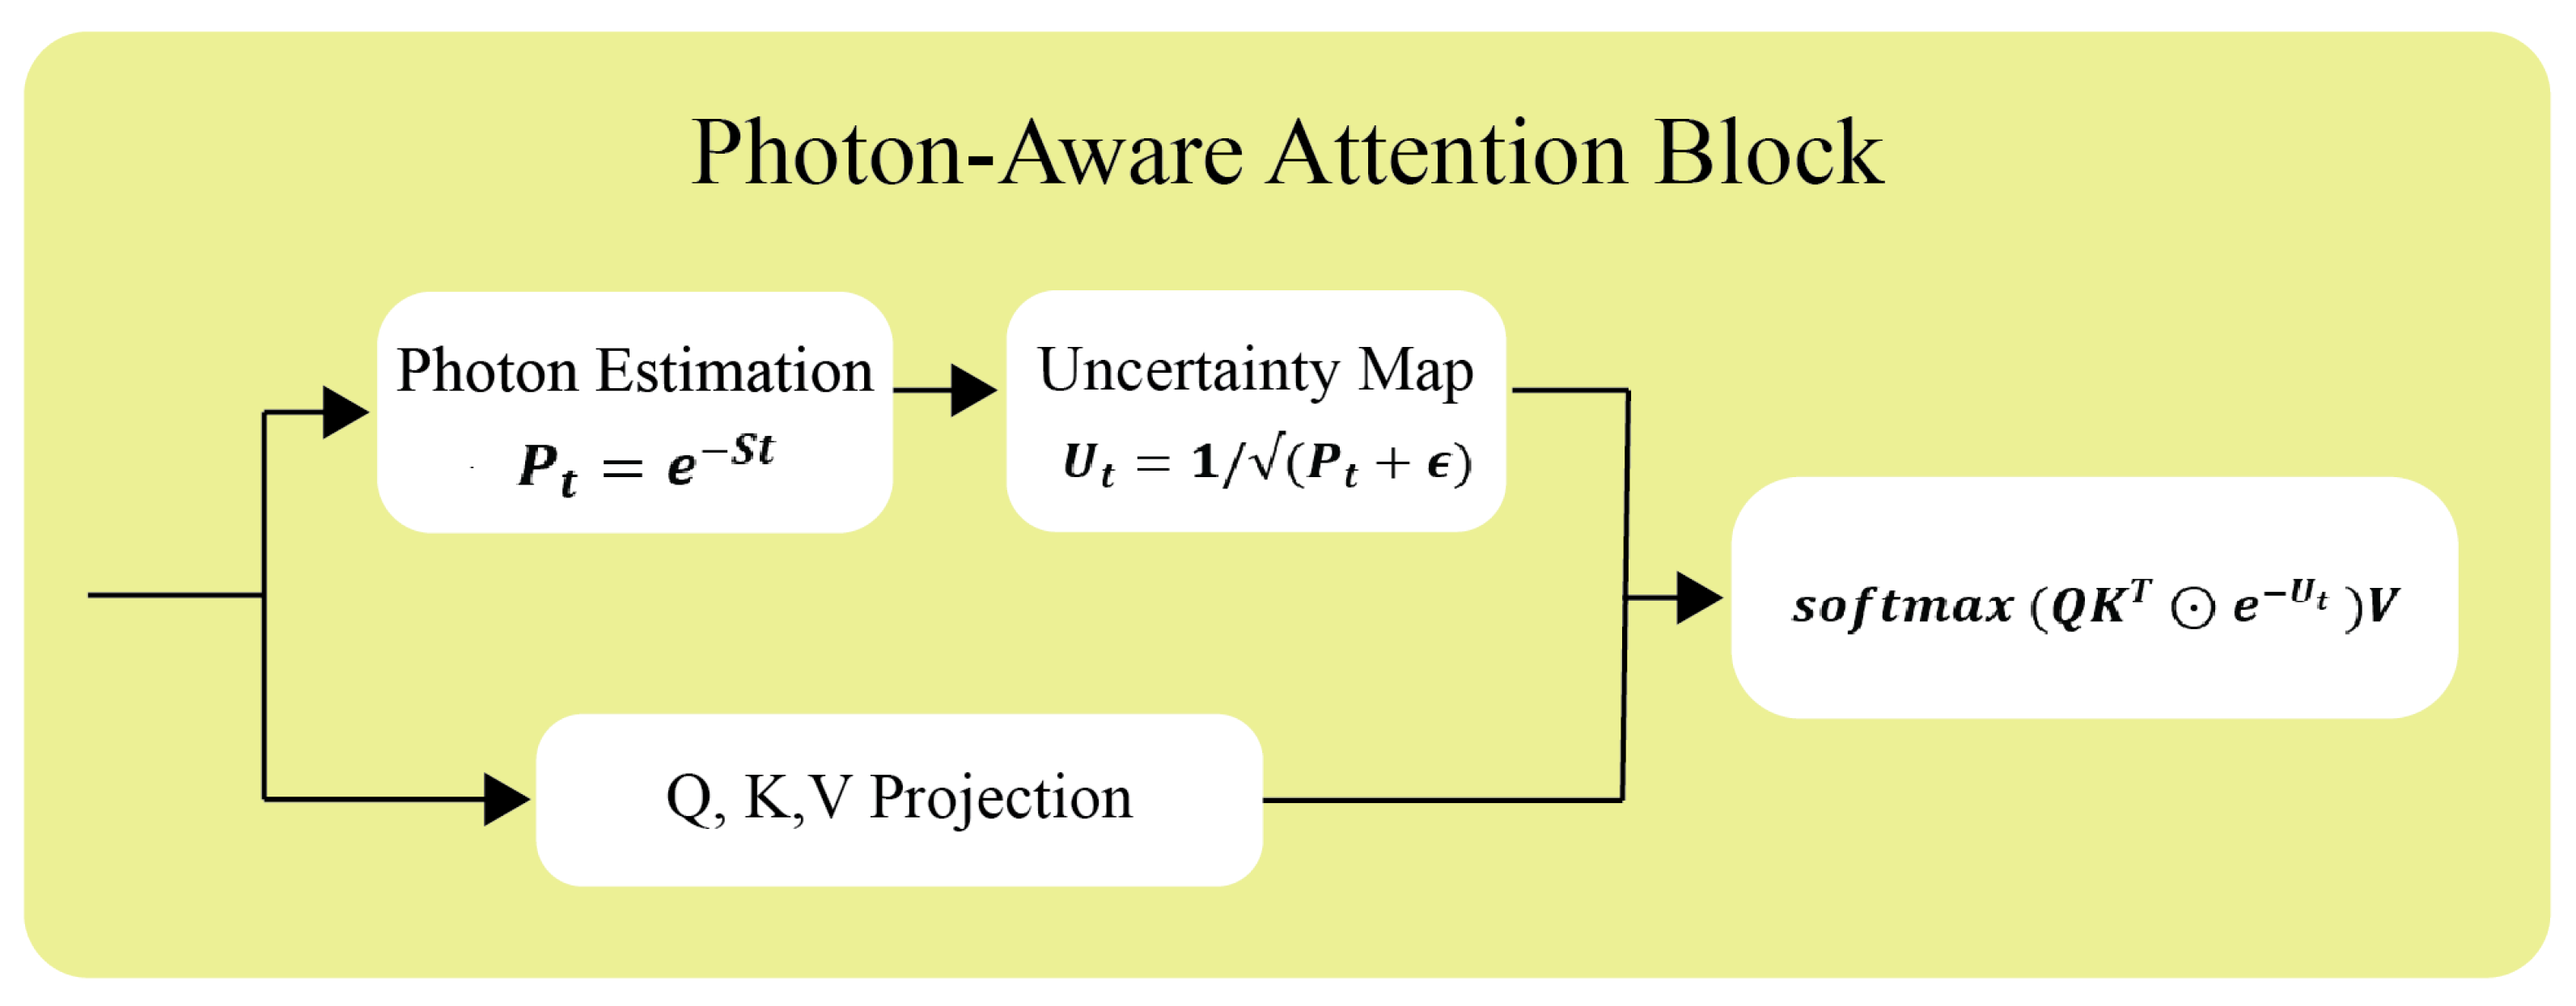
Unlike conventional self-attention, the proposed photon-aware attention incorporates photon reliability information directly into the attention computation:
A t = Softmax Q t K t T d α U t
where (d) is the feature dimension and ( α ) is a learnable scaling parameter. The uncertainty term reduces the contribution of photon-starved projections while emphasizing measurements with higher photon reliability.
The resulting photon-aware feature representation is obtained as
z t = A t V t
which is subsequently forwarded to the Projection State-Space Sequential Optimization ( P S 3 ) module for long-range projection dependency modeling.

2.3. Sequential State Space Evolution

To model the long-range dependency between neighboring projection angles, a hidden attenuation state h t is introduced. The state evolves according to both the photon-aware feature representation z t and the estimated uncertainty map U t :
h t = A ( U t ) h t 1 + B ( U t ) z t
where the uncertainty-conditioned transition matrices are defined as
A ( U t ) = A 0 + α A U t
B ( U t ) = B 0 + α B U t
with A 0 and B 0 representing learnable base transition matrices and α A and α B denoting learnable modulation coefficients.
This formulation enables the network to adaptively balance historical projection information and current measurements according to the local photon uncertainty. Projections with high uncertainty rely more heavily on neighboring angular information, whereas reliable measurements retain stronger self-dependence.
The denoised projection features are generated through
y t = C h t + D z t
where C and D are learnable output matrices.
Finally, a 1 × 1 convolutional layer reconstructs the denoised projection:
S p r e d = W r y t + b r
where W r and b r denote learnable reconstruction parameters.

2.4. Multi-Objective Loss Function

The proposed framework is optimized using a physics-guided multi-objective loss function designed to simultaneously enforce projection fidelity, reconstruction consistency, and photon-statistical correctness:
L t o t a l = λ 1 L p r o j + λ 2 L r e c o n + λ 3 L p o i s s o n
where λ 1 , λ 2 , and λ 3 are weighting coefficients.

2.4.1. Projection Loss

Projection-domain fidelity is enforced using an L1 loss between the predicted and reference sinograms:
L p r o j = S p r e d S f u l l 1
where S f u l l denotes the normal-dose reference sinogram.

2.4.2. Reconstruction Consistency Loss

To ensure image-domain anatomical fidelity after reconstruction, a differentiable filtered backprojection (FBP) operator R ( · ) is incorporated:
C T p r e d = R ( S p r e d )
The reconstruction consistency loss is then defined as
L r e c o n = C T p r e d C T N D C T 1
where C T N D C T denotes the corresponding normal-dose CT image.

2.4.3. Poisson Physics Loss

To preserve the photon-counting statistics of CT acquisition, a Poisson negative log-likelihood loss is employed.
The predicted photon counts are estimated as
P p r e d = exp ( S p r e d )
while the reference photon counts are given by
P r e f = exp ( S f u l l )
The Poisson physics loss is then formulated as
L p o i s s o n = P p r e d P r e f log ( P p r e d )
which encourages the denoised projections to remain statistically consistent with the underlying photon-counting process.

2.5. Evaluation Metrics

To quantitatively assess the reconstruction performance, we employ three standard full-reference metrics: Peak Signal-to-Noise Ratio (PSNR), which measures the ratio between maximum signal power and corrupting noise; Structural Similarity Index Measure (SSIM), which evaluates the preservation of structural information; and Root Mean Square Error (RMSE), which quantifies the pixel-level deviation from the ground-truth NDCT images [22]. These metrics are calculated slice-wise and averaged across the entire test set.

2.6. Dataset and Training Details

The Mayo Clinic LDCT and Projection Dataset via The Cancer Imaging Archive (TCIA) [37] was used for all experiments. The dataset comprises 299 adult CT examinations, including 100 abdomen cases, 100 chest cases, and 99 head cases, acquired using Siemens and GE CT scanners. For each examination, paired low-dose and corresponding normal-dose CT images, together with the associated projection measurements, are provided. As the dataset was obtained from a publicly available curated repository, patient recruitment, imaging protocols, and primary quality-control procedures were performed by the original data providers. Consequently, no additional participant inclusion or exclusion criteria were applied in the present study beyond the availability of complete paired projection and image data required for training and evaluation.
To prevent information leakage and ensure an unbiased evaluation of model generalization, dataset partitioning was performed at the patient level rather than the image-slice level. The overall dataset was partitioned independently for each anatomical region using an approximate 70%/15%/15% ratio. Specifically, the Abdomen and Chest cohots (100 patients each) were divided into 70 training, 15 validation and 15 test patients. The Head cohort (99 patients) was similarly partitioned into 69 training, 15 validation and 15 test patients. This partitioning is summarized in Table 1. All 2D image slices were extracted strictly after patient-level assignment to guarantee zero slice overlap between splits. Following patient-level assignment to the training, validation and test subsets, non-overlapping patches were extracted from the corresponding sinograms for network training and evaluation. The training set was used for parameter optimization, the validation set was used for hyperparameter selection and early stopping, and the independent testing set was reserved exclusively for final performance evaluation.
All network models were developed using Python (version 3.7) with PyTorch (version 1.13.1) and the TensorFlow-Keras API (TensorFlow-gpu version 2.1.0, Keras version 2.3.1). They were evaluated on a workstation equipped with an AMD Ryzen 9 3900X 12-Core processor (@3.8 GHz, manufactured by Advanced Micro Devices, Inc., Santa Clara, CA, USA) and an NVIDIA GeForce RTX 5070 GPU (12GB VRAM, manufactured by NVIDIA Corporation, Santa Clara, CA, USA), sourced from the Computer Vision and Image Processing (CVIP) Lab at Toronto Metropolitan University in Toronto, Canada. To ensure reproducibility across experiments, data partitioning and network weight initialization was governed by a fixed random seed ( seed = 42 ). Network optimization was performed using 64 × 64 sinogram projection patches extracted strictly after patient-level dataset partitioning. The proposed architecture contains approximately 4.2 million trainable parameters. Training was conducted over 50 epochs using a batch size of 8 with automatic mixed precision (FP16) to maximize memory efficiency. Models were optimized using the Adam optimizer with an initial learning rate of 1 × 10 4 , which was decayed following a cosine annealing schedule. The network was trained end-to-end using a multi-objective loss function consisting of a projection-domain loss ( L proj ), a reconstruction consistency loss ( L recon ) via differentiable Filtered Backprojection, and a Poisson-aware physics loss ( L phys ), with empirically selected loss weights of λ 1 = 0.4 , λ 2 = 0.4 , and λ 3 = 0.2 , respectively. On the NVIDIA GeForce RTX 5070 GPU, the proposed model achieved an average inference time of 22.8 ms per CT slice (excluding data loading and disk I/O), while complete training required approximately 8.2 h for 50 epochs. Owing to the linear-complexity sequential state-space formulation, the computational complexity of the proposed projection encoder scales approximately linearly with the projection sequence length, substantially reducing the quadratic memory and computational requirements associated with conventional self-attention mechanisms.

3. Results & Discussions

3.1. Benchmark Evaluation

Table 2, Table 3 and Table 4 present the quantitative performance comparison between the proposed P S 3 T framework and several state-of-the-art LDCT denoising methods [24,38,39] on the abdomen, head, and chest datasets, respectively. To provide a more rigorous assessment of model generalization, all experiments were conducted using patient-level data partitioning, ensuring that all CT slices from a given patient were assigned exclusively to either the training, validation, or testing subset. The reported values represent the mean performance with the corresponding 95% confidence intervals computed over the independent test images. Across all anatomical regions, the proposed P S 3 T consistently achieved the highest SSIM and PSNR values while producing the lowest RMSE among the evaluated methods.
To further assess the robustness of the observed improvements and account for intra-patient correlation across slices, statistical significance testing was performed using a two-sided paired Wilcoxon signed-rank test on patient-level aggregated measurements ( N test = 15 independent patient cases for each anatomical dataset). For each patient volume, quantitative metrics were first averaged across constituent slices, and paired tests were conducted across independent subjects. The resulting p-values are reported in Table 5, Table 6 and Table 7. The proposed P S 3 T demonstrated statistically significant improvements over all comparison methods across the evaluated anatomical regions ( p < 0.05 ), indicating that the observed performance gains were consistent across independent patient samples.
For the abdomen dataset, P S 3 T achieved the highest reconstruction quality with an SSIM of 0.9020, a PSNR of 42.40 dB, and the lowest RMSE of 0.0076. Compared with SADiff and GEDFormer, the proposed framework improved structural similarity while simultaneously reducing reconstruction error, demonstrating more accurate attenuation recovery under the patient-level evaluation protocol.
A similar trend was observed for the head dataset, where P S 3 T achieved the highest SSIM (0.7180), PSNR (42.25 dB), and the lowest RMSE (0.0078). Despite the increased anatomical complexity and the presence of fine, high-frequency cranial structures, the proposed framework preserved structural information more effectively than the competing approaches.
The chest dataset remained the most challenging evaluation scenario because of the large attenuation differences between lung parenchyma, vasculature, and surrounding soft tissues. Nevertheless, P S 3 T achieved the best overall performance, with an SSIM of 0.7980, a PSNR of 36.10 dB, and an RMSE of 0.0152. These results demonstrate that the proposed framework effectively suppresses projection-domain noise while maintaining structural consistency following image reconstruction.
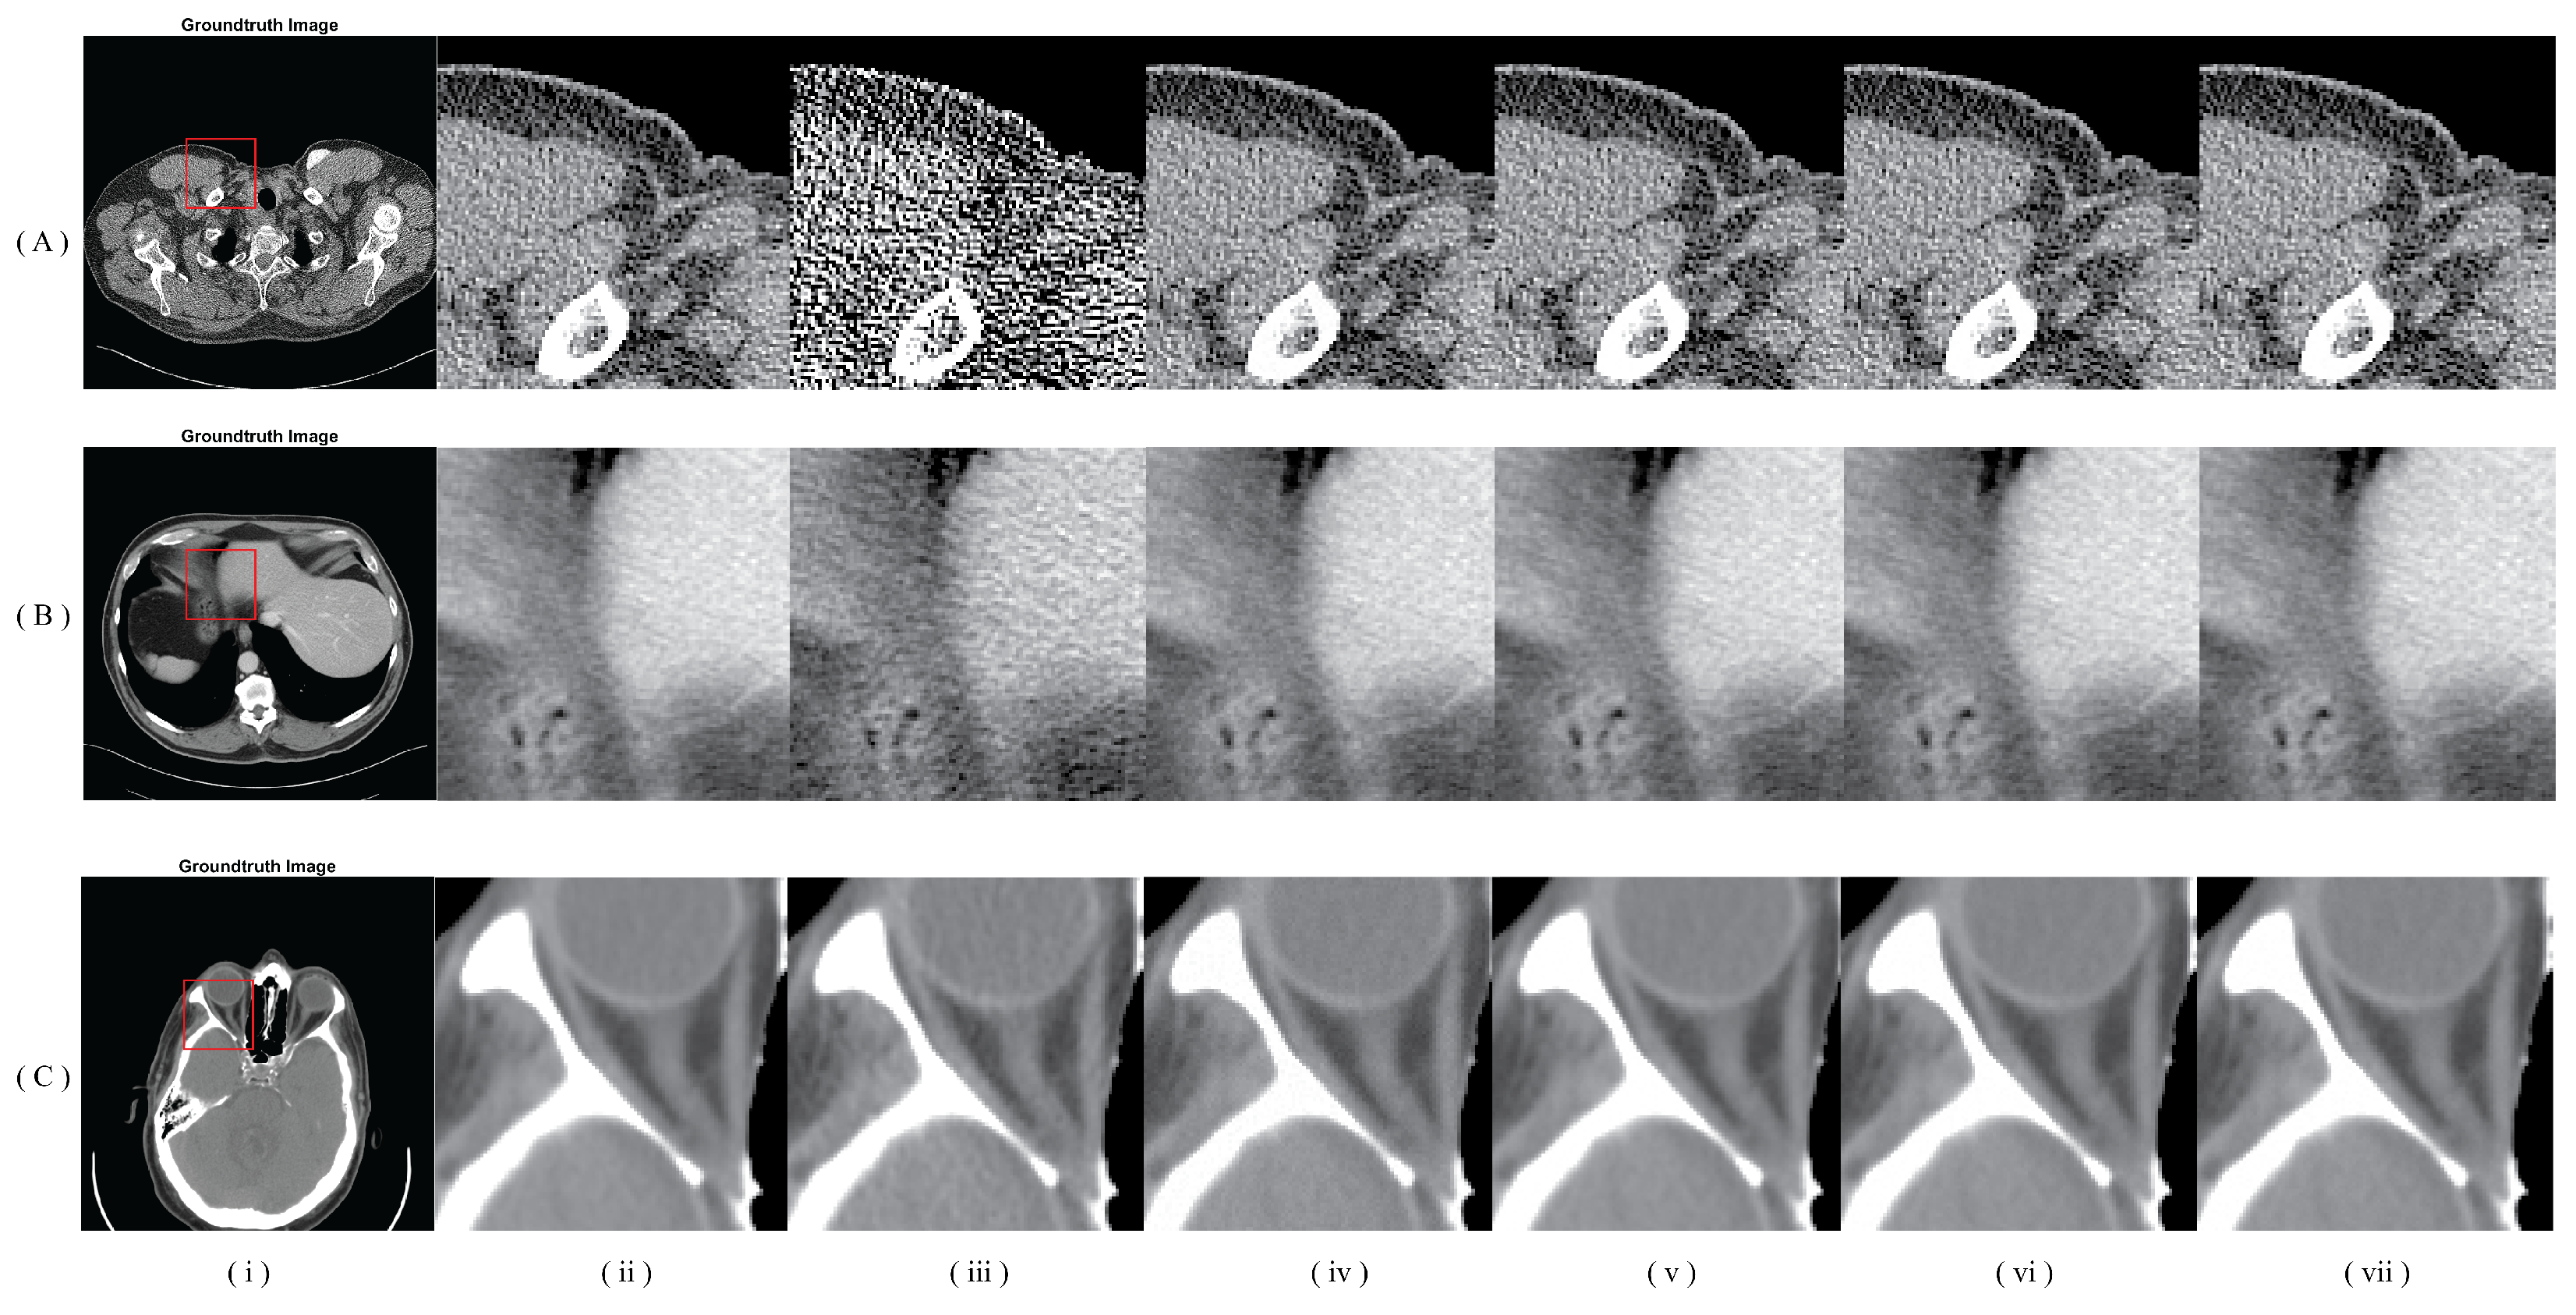
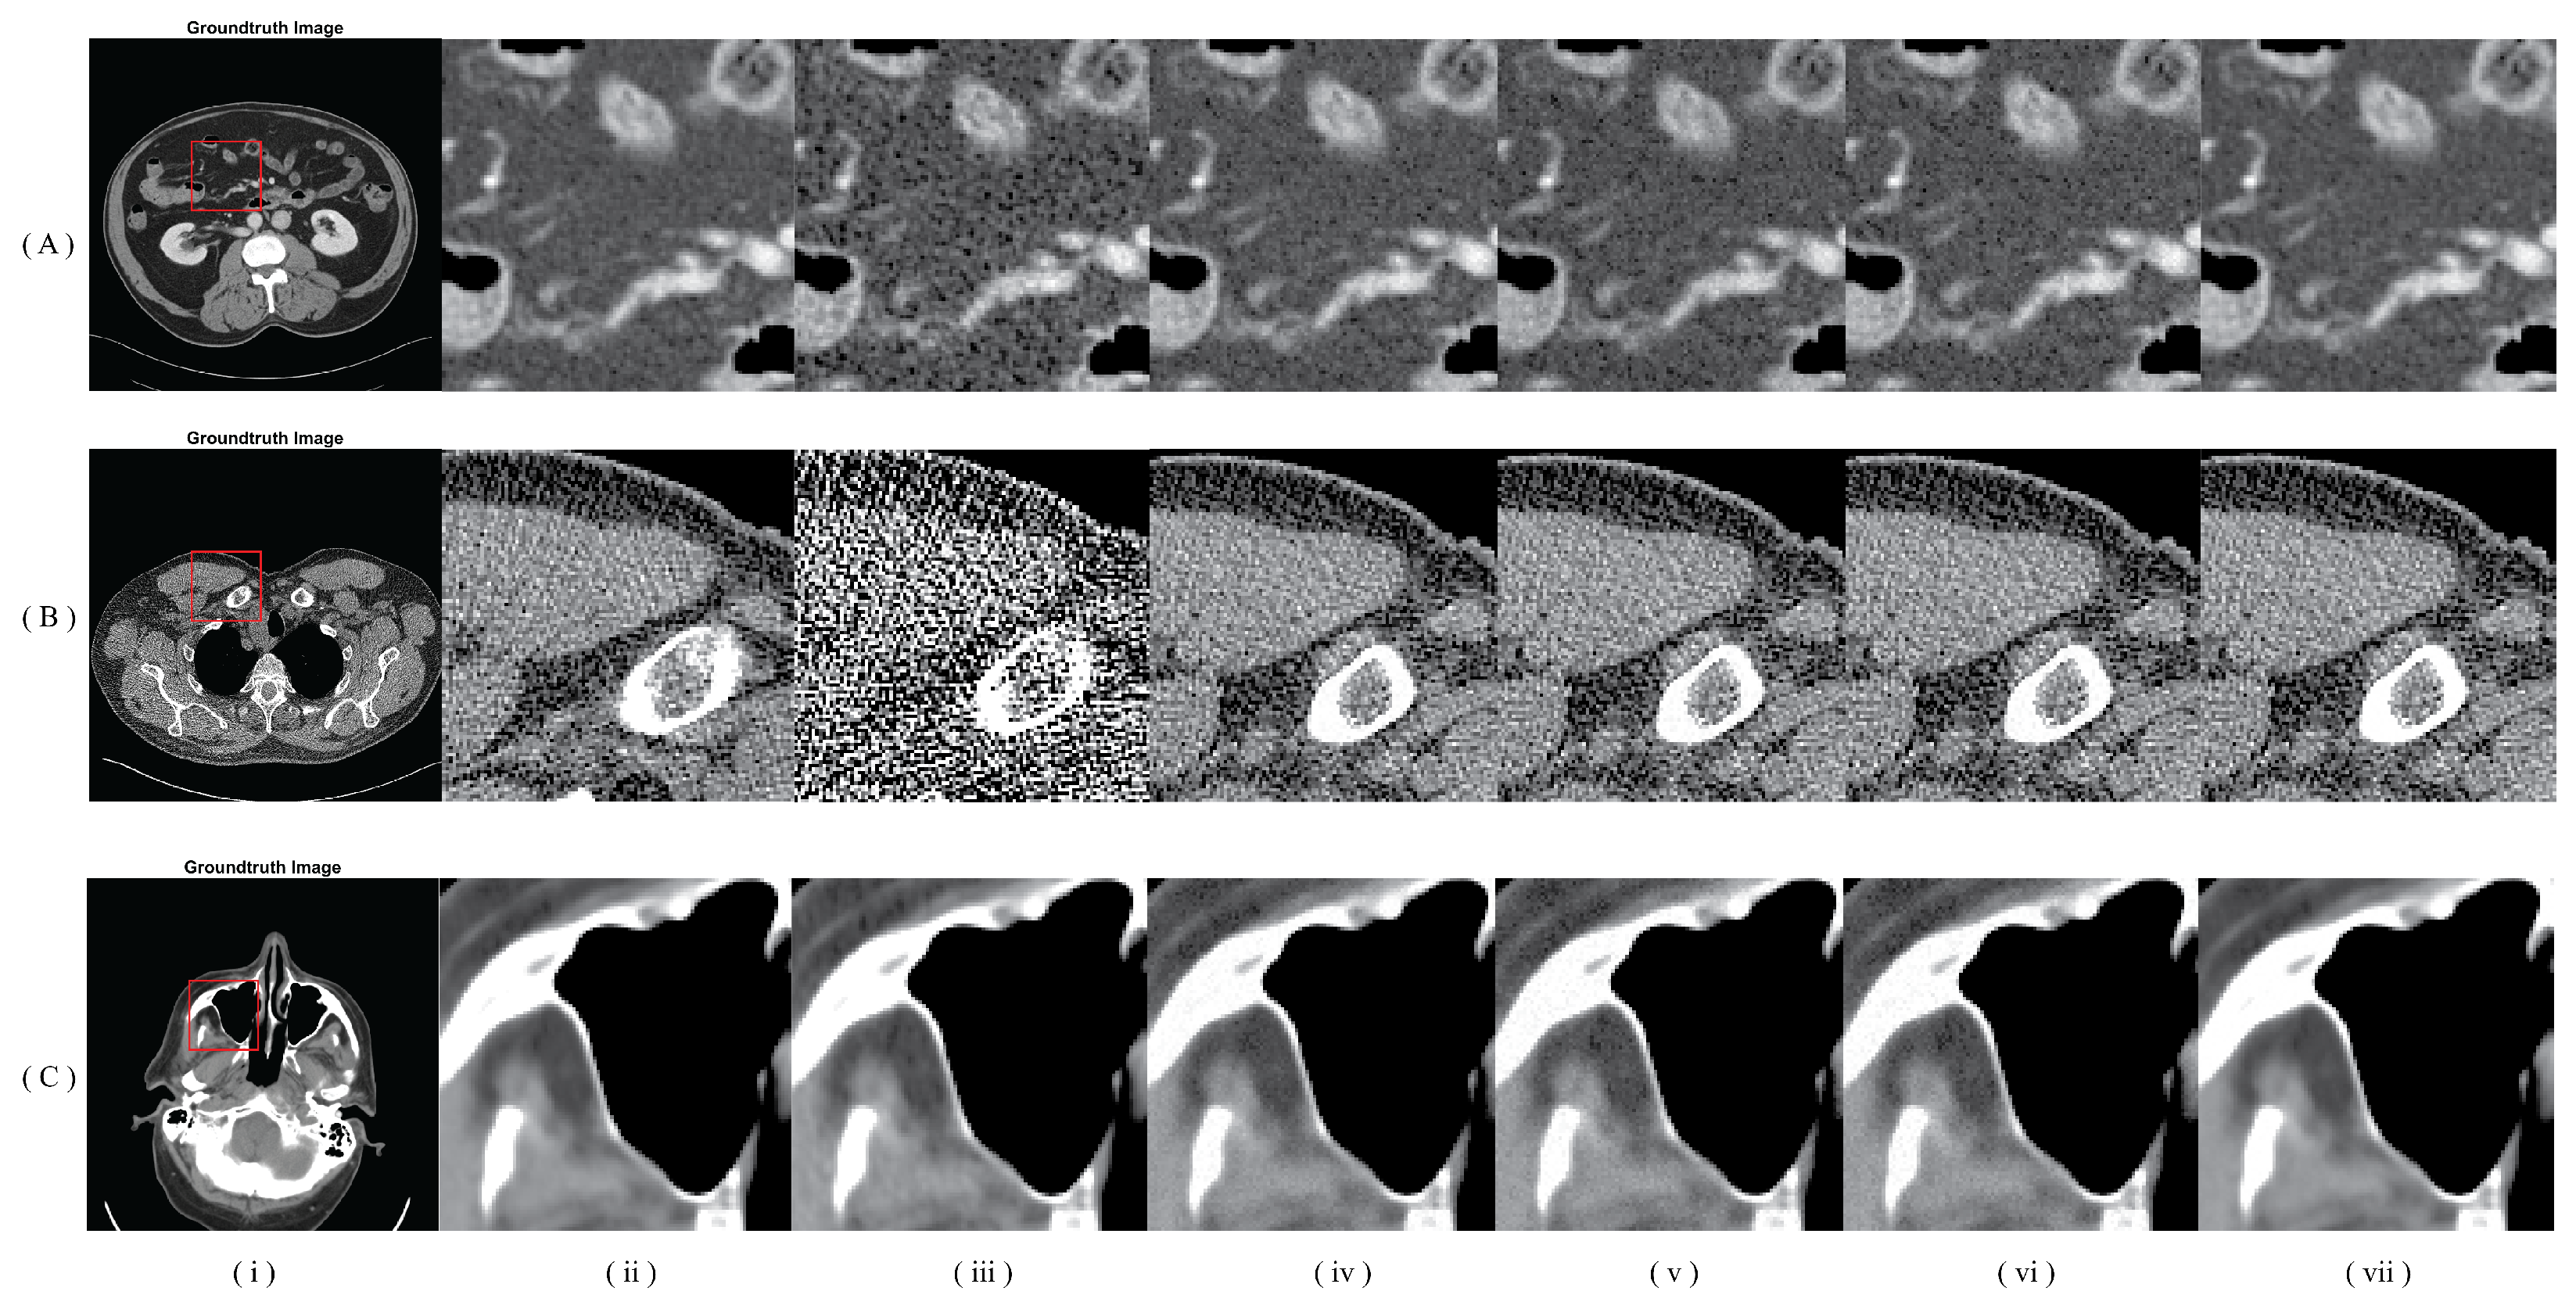
Figure 4 presents qualitative comparisons of the benchmark denoising methods for representative abdomen, head, and chest CT slices. Although all methods reduced the noise present in the LDCT images, noticeable differences were observed in structural preservation and attenuation fidelity. DRL exhibited residual noise and localized texture distortions, while SADiff produced smoother reconstructions at the expense of subtle anatomical details. GEDFormer preserved global structures more effectively but introduced slight over-smoothing around tissue boundaries. In contrast, the proposed P S 3 T framework generated images that most closely resembled the NDCT reference while preserving both low-contrast soft-tissue structures and fine anatomical details. These qualitative observations are consistent with the quantitative results reported in Table 5, Table 6 and Table 7.
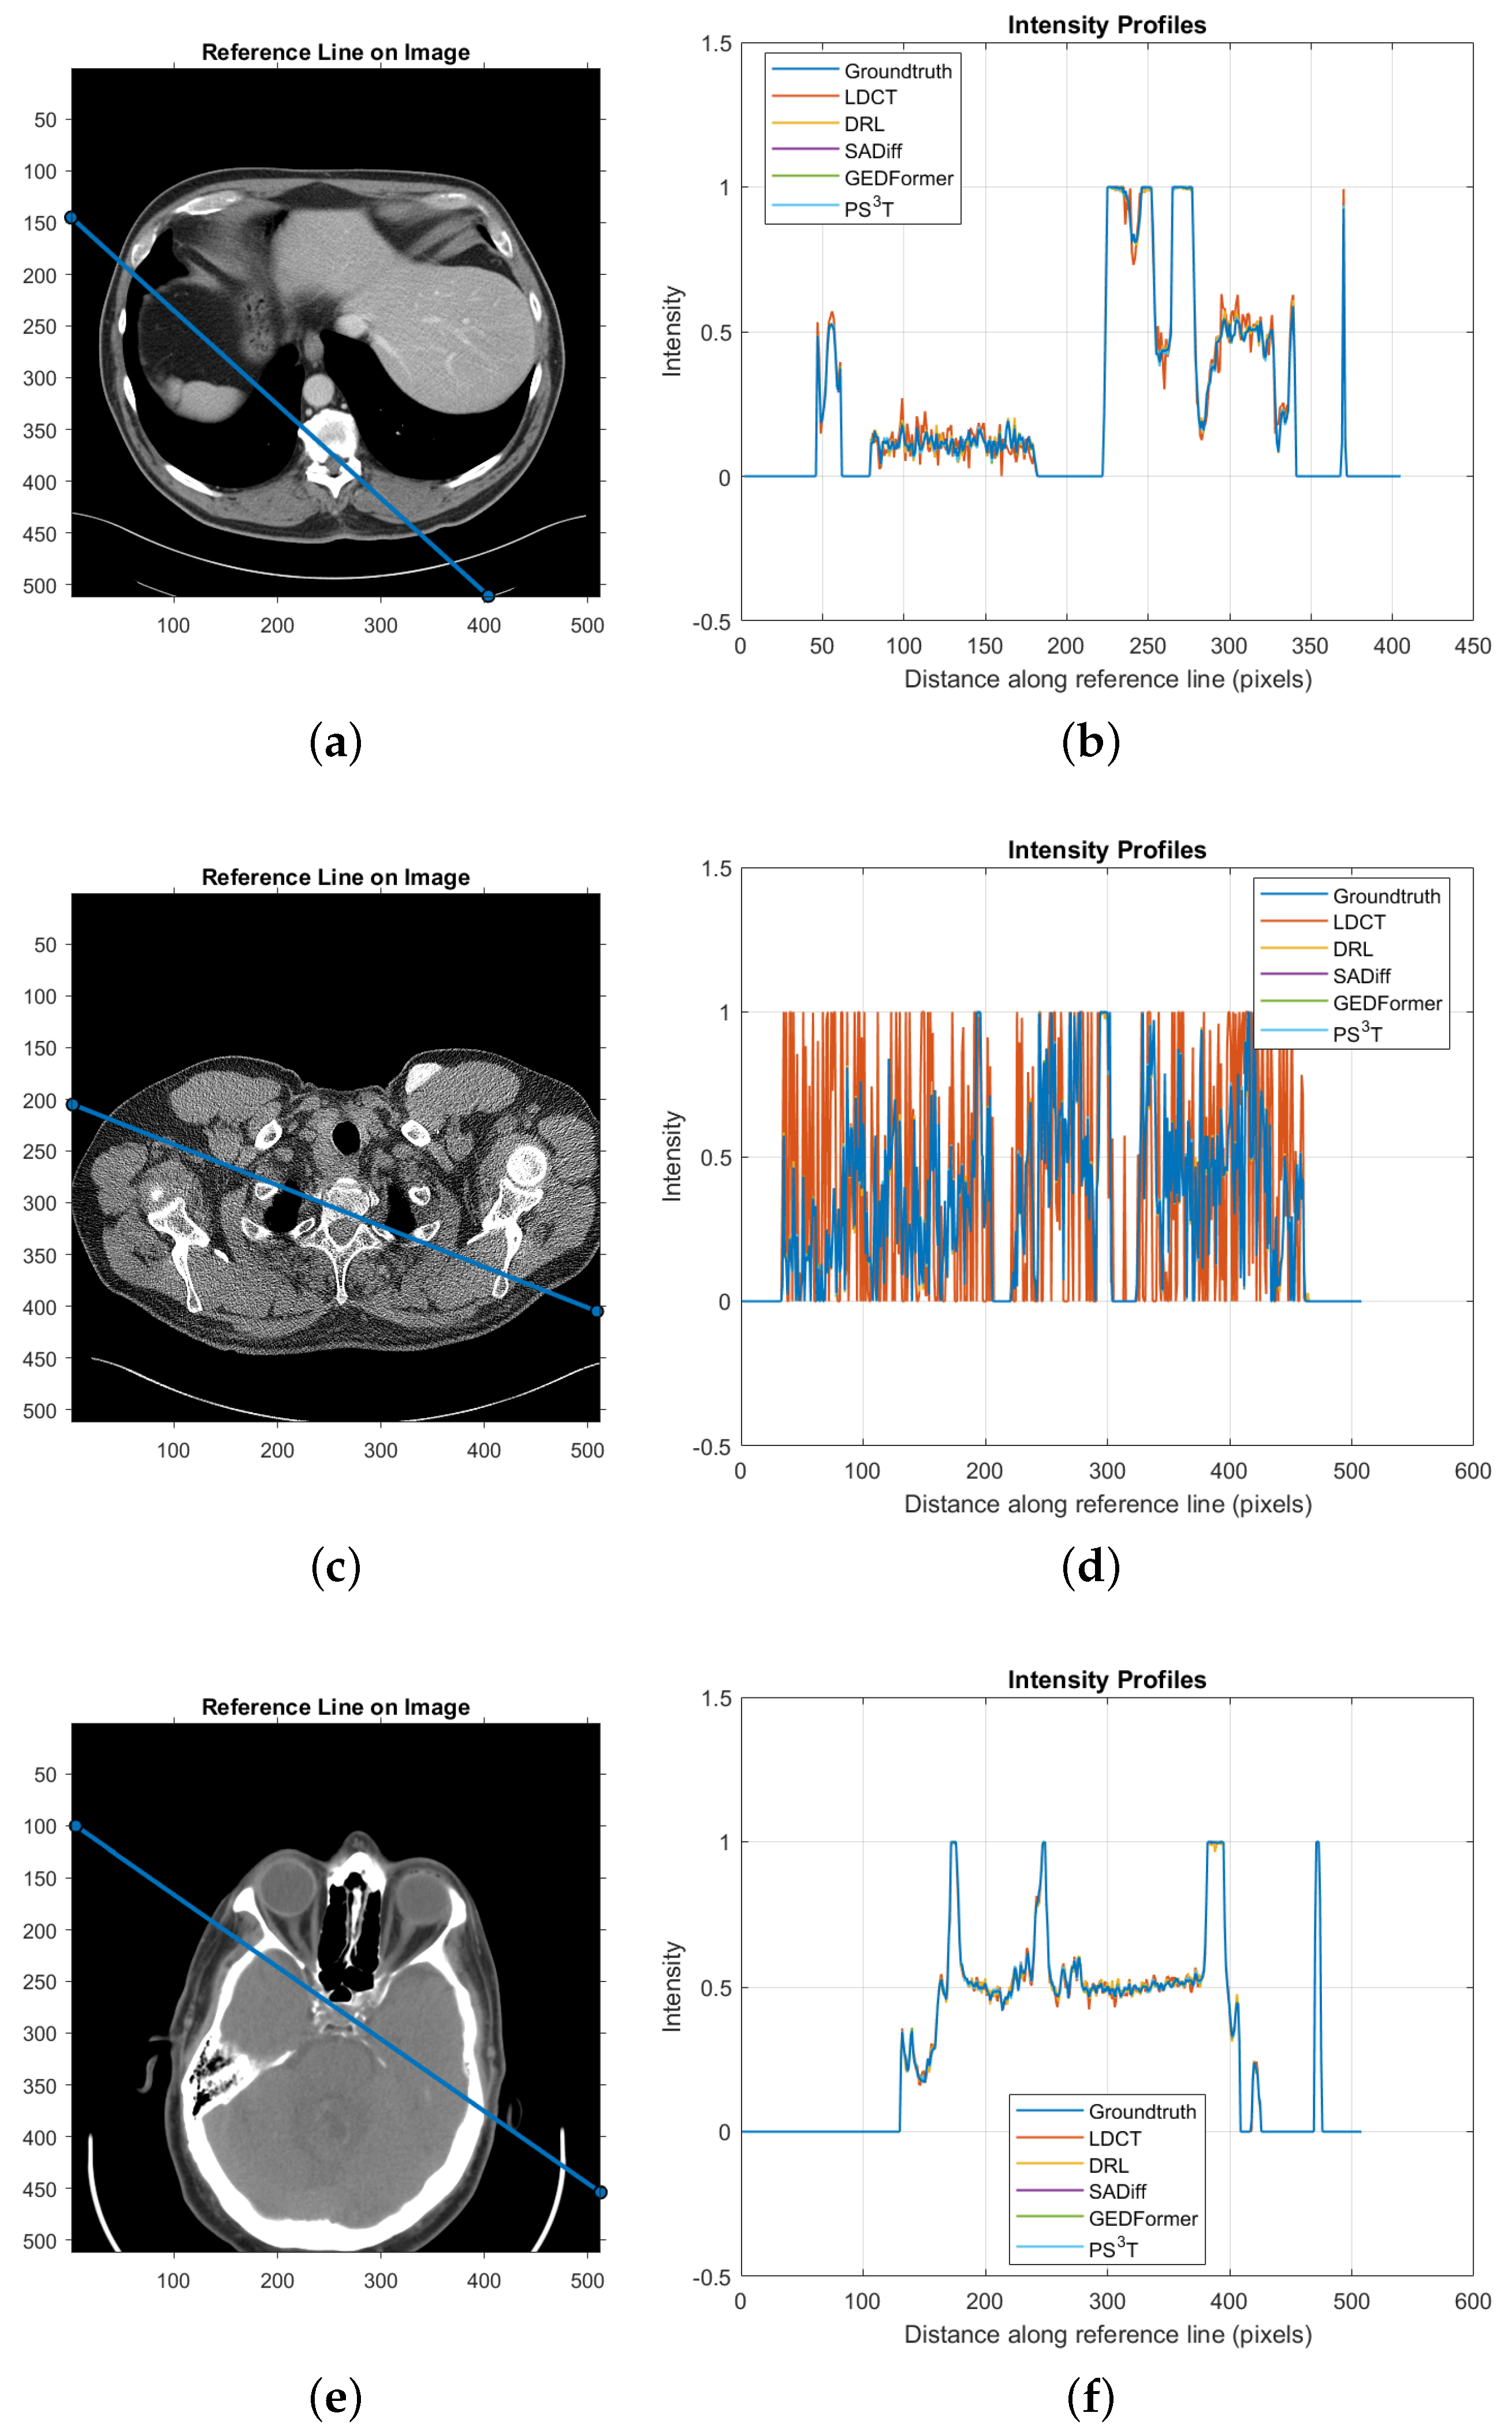
To further evaluate attenuation preservation, intensity profiles were extracted along the reference lines shown in the CT slices. Figure 5 illustrates the corresponding intensity distributions for the abdomen, head, and chest datasets. The profile lines were selected to traverse representative anatomical structures and tissue boundaries within each CT slice. Because the anatomical characteristics of the three datasets differ substantially, separate profile locations were selected to capture clinically relevant structural transitions while maintaining the same profile location across all denoising methods for each corresponding image. The LDCT profiles exhibit substantial fluctuations caused by quantum noise, resulting in noticeable deviations from the NDCT reference. Although DRL, SADiff, and GEDFormer reduce these fluctuations, discrepancies remain around high-gradient anatomical transitions. In comparison, the proposed P S 3 T framework produces intensity profiles that most closely follow the NDCT reference throughout the sampling path, indicating improved attenuation recovery and preservation of tissue boundaries. In the abdomen dataset, Figure 5a,b, the proposed framework accurately reproduces attenuation transitions at liver–soft tissue interfaces and vascular structures. For the head dataset, Figure 5e,f, P S 3 T better preserves the rapid intensity transitions associated with cortical bone and intracranial anatomy. Similarly, for the chest dataset, Figure 5c,d, the proposed framework maintains profile consistency across the strong attenuation transitions between lung parenchyma, vessels, and surrounding soft tissues while effectively suppressing noise-induced oscillations.
The improved performance can be attributed to three complementary design components. First, the projection-domain sequential state-space modeling captures long-range dependencies between neighboring projections more effectively than conventional convolutional processing. Second, the photon-aware transformer adaptively emphasizes reliable projection measurements according to the estimated photon statistics, enabling more robust feature extraction under low-dose acquisition conditions. Finally, the reconstruction-consistency optimization jointly constrains the projection and image domains through differentiable filtered backprojection, improving attenuation fidelity and preserving anatomical structures in the reconstructed CT images.

3.2. Ablation Analysis

To evaluate the contribution of each component within the proposed framework, an ablation study was conducted using the patient-level data partitioning protocol. As summarized in Table 8, the proposed architecture was constructed incrementally, beginning with a baseline Vision Transformer (ViT) and progressively incorporating the projection-domain sequential state-space module, the photon-aware transformer, and the reconstruction consistency loss.
The baseline ViT achieved SSIM values of 0.8580, 0.6420, and 0.7210 for the abdomen, head, and chest datasets, respectively. Introducing the projection-domain sequential state-space module (P S 3 , without the photon-aware transformer) consistently improved all quantitative metrics across the three anatomical regions. For example, the abdomen SSIM increased from 0.8580 to 0.8760, while the corresponding RMSE decreased from 0.0112 to 0.0098. Similar improvements were observed for the head and chest datasets, indicating that sequential state-space modeling effectively captures long-range dependencies and angular continuity within the projection domain.
Replacing the state-space module with the photon-aware transformer (PT, without S 3 ) produced additional performance improvements over the baseline network. Compared with the P S 3 configuration, the photon-aware transformer achieved higher SSIM and PSNR values across all datasets, demonstrating that adaptively weighting projection features according to estimated photon statistics improves robustness under low-dose acquisition conditions.
When both components were combined within the proposed PS3T framework and optimized using only the conventional mean squared error objective, further improvements were observed across all evaluation metrics. These results suggest that the sequential state-space module and photon-aware transformer provide complementary benefits by jointly modeling projection-domain dependencies while enhancing feature representation according to measurement reliability.
The final configuration incorporated the proposed reconstruction consistency loss, L recon , resulting in the highest quantitative performance across all anatomical regions. Compared with the MSE-only configuration, the proposed optimization improved SSIM from 0.8980 to 0.9020, PSNR from 41.80 dB to 42.40 dB, and reduced RMSE from 0.0080 to 0.0076 for the abdomen dataset. Similar improvements were consistently observed for the head and chest datasets. These findings indicate that explicitly enforcing consistency between the denoised projection data and the reconstructed CT images improves attenuation fidelity and anatomical preservation beyond optimization performed solely in the projection domain.
The contribution of each architectural component is also evident in the qualitative comparisons shown in Figure 6. The baseline ViT exhibits noticeable texture smoothing and loss of fine structural detail. Incorporating the sequential state-space module improves edge continuity and structural consistency, while the photon-aware transformer further suppresses residual noise by adaptively emphasizing reliable projection measurements. The complete PS3T framework, together with the proposed reconstruction consistency loss, produces images with the sharpest anatomical boundaries and tissue contrast that most closely resemble the NDCT reference.
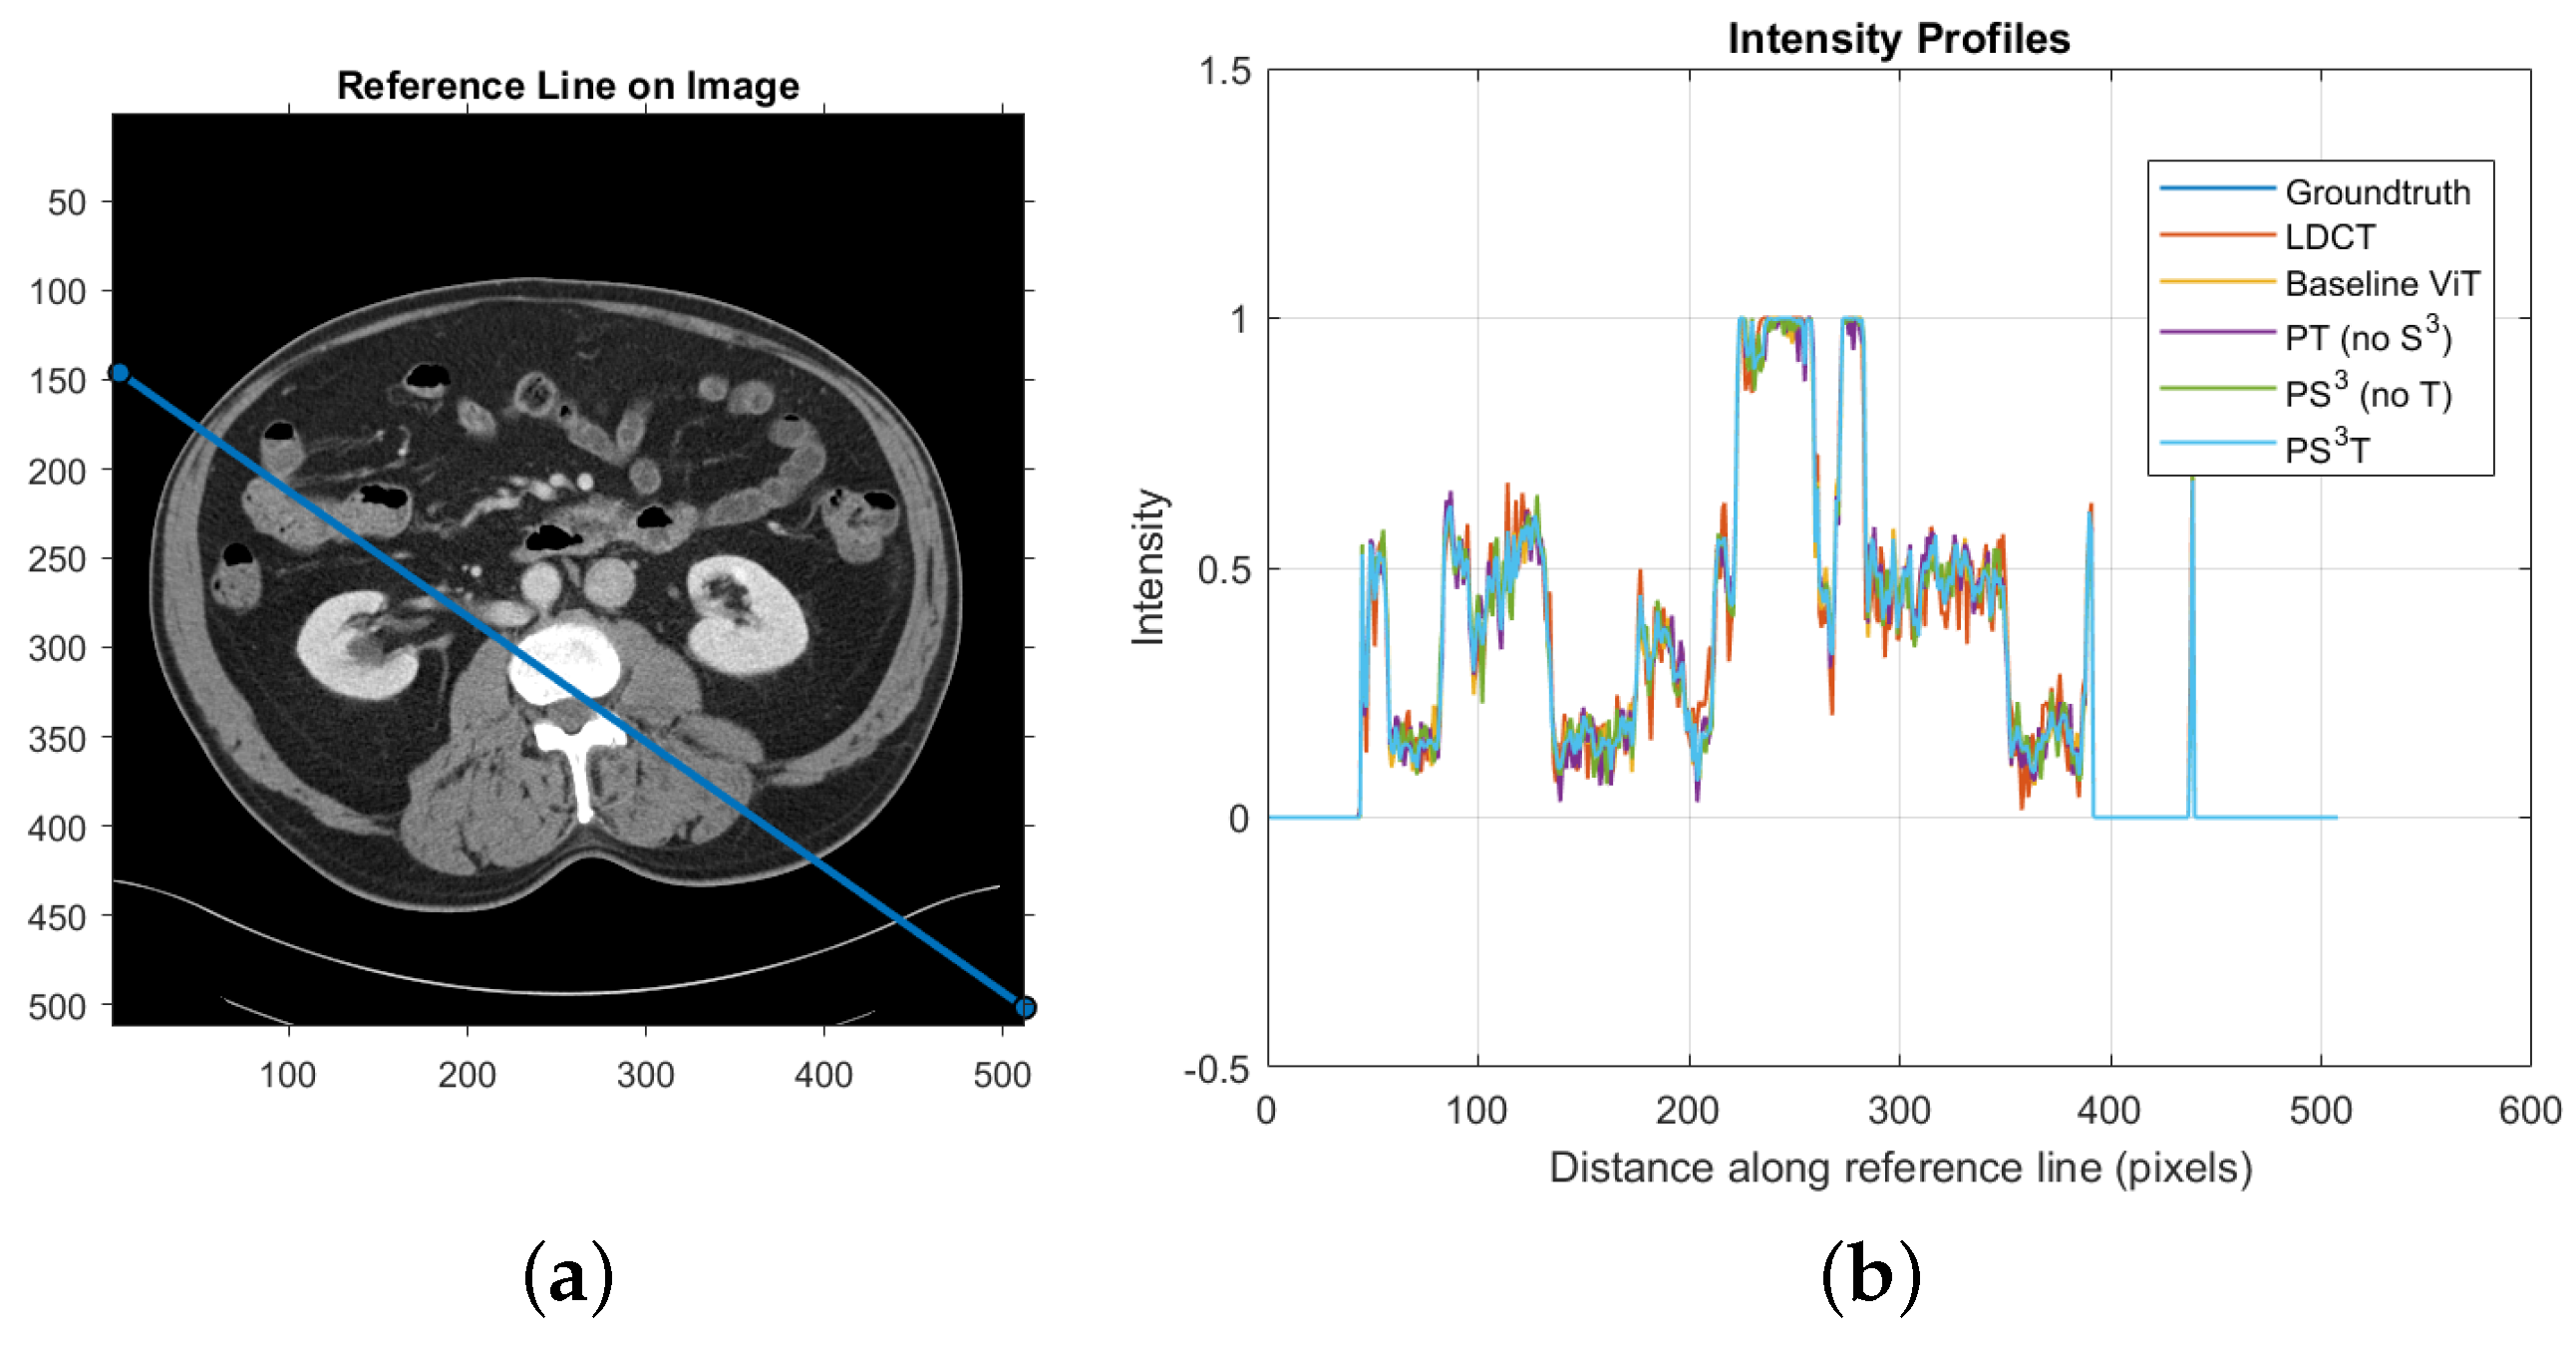
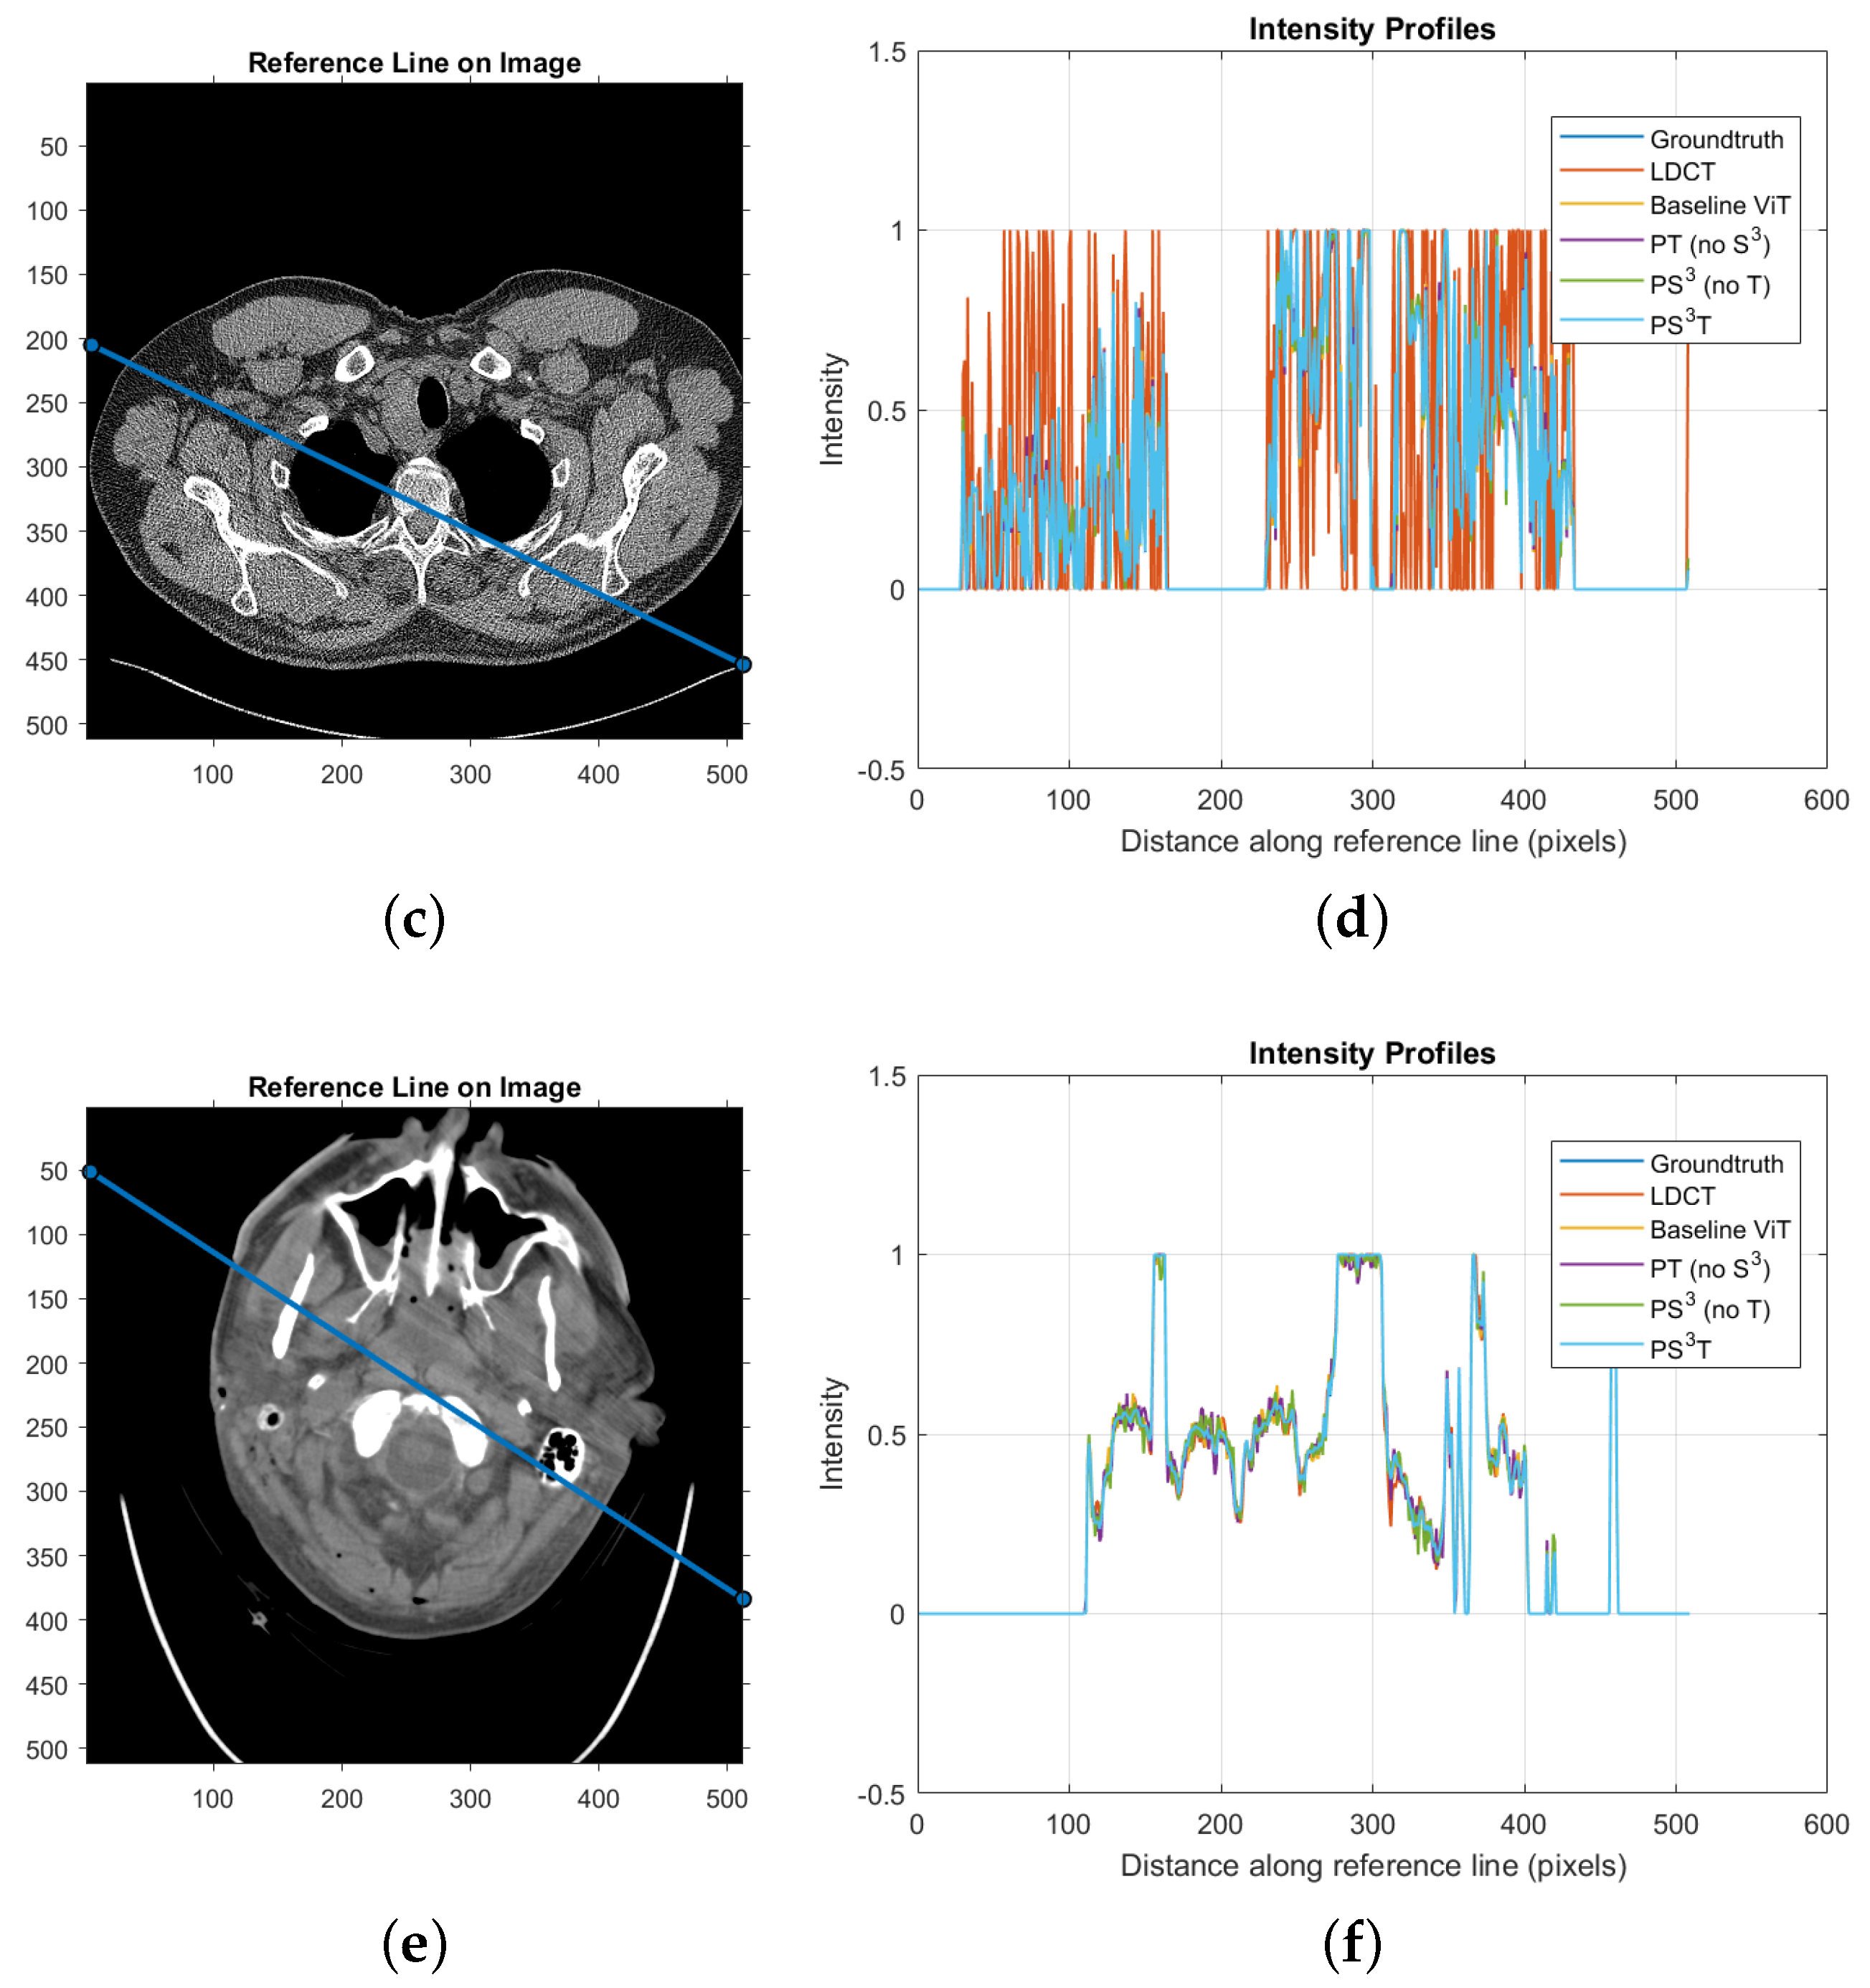
These observations are further supported by the corresponding attenuation profiles shown in Figure 7. The baseline ViT exhibits larger deviations from the NDCT reference, particularly around regions containing rapid attenuation transitions. The addition of either the sequential state-space module or the photon-aware transformer improves profile alignment by reducing noise-induced fluctuations while preserving structural transitions. The complete PS3T framework demonstrates the closest agreement with the NDCT reference across all anatomical regions, illustrating the complementary contributions of projection-domain sequential state-space modeling, photon-aware attention, and reconstruction-consistency optimization.

3.3. Reconstruction Consistency

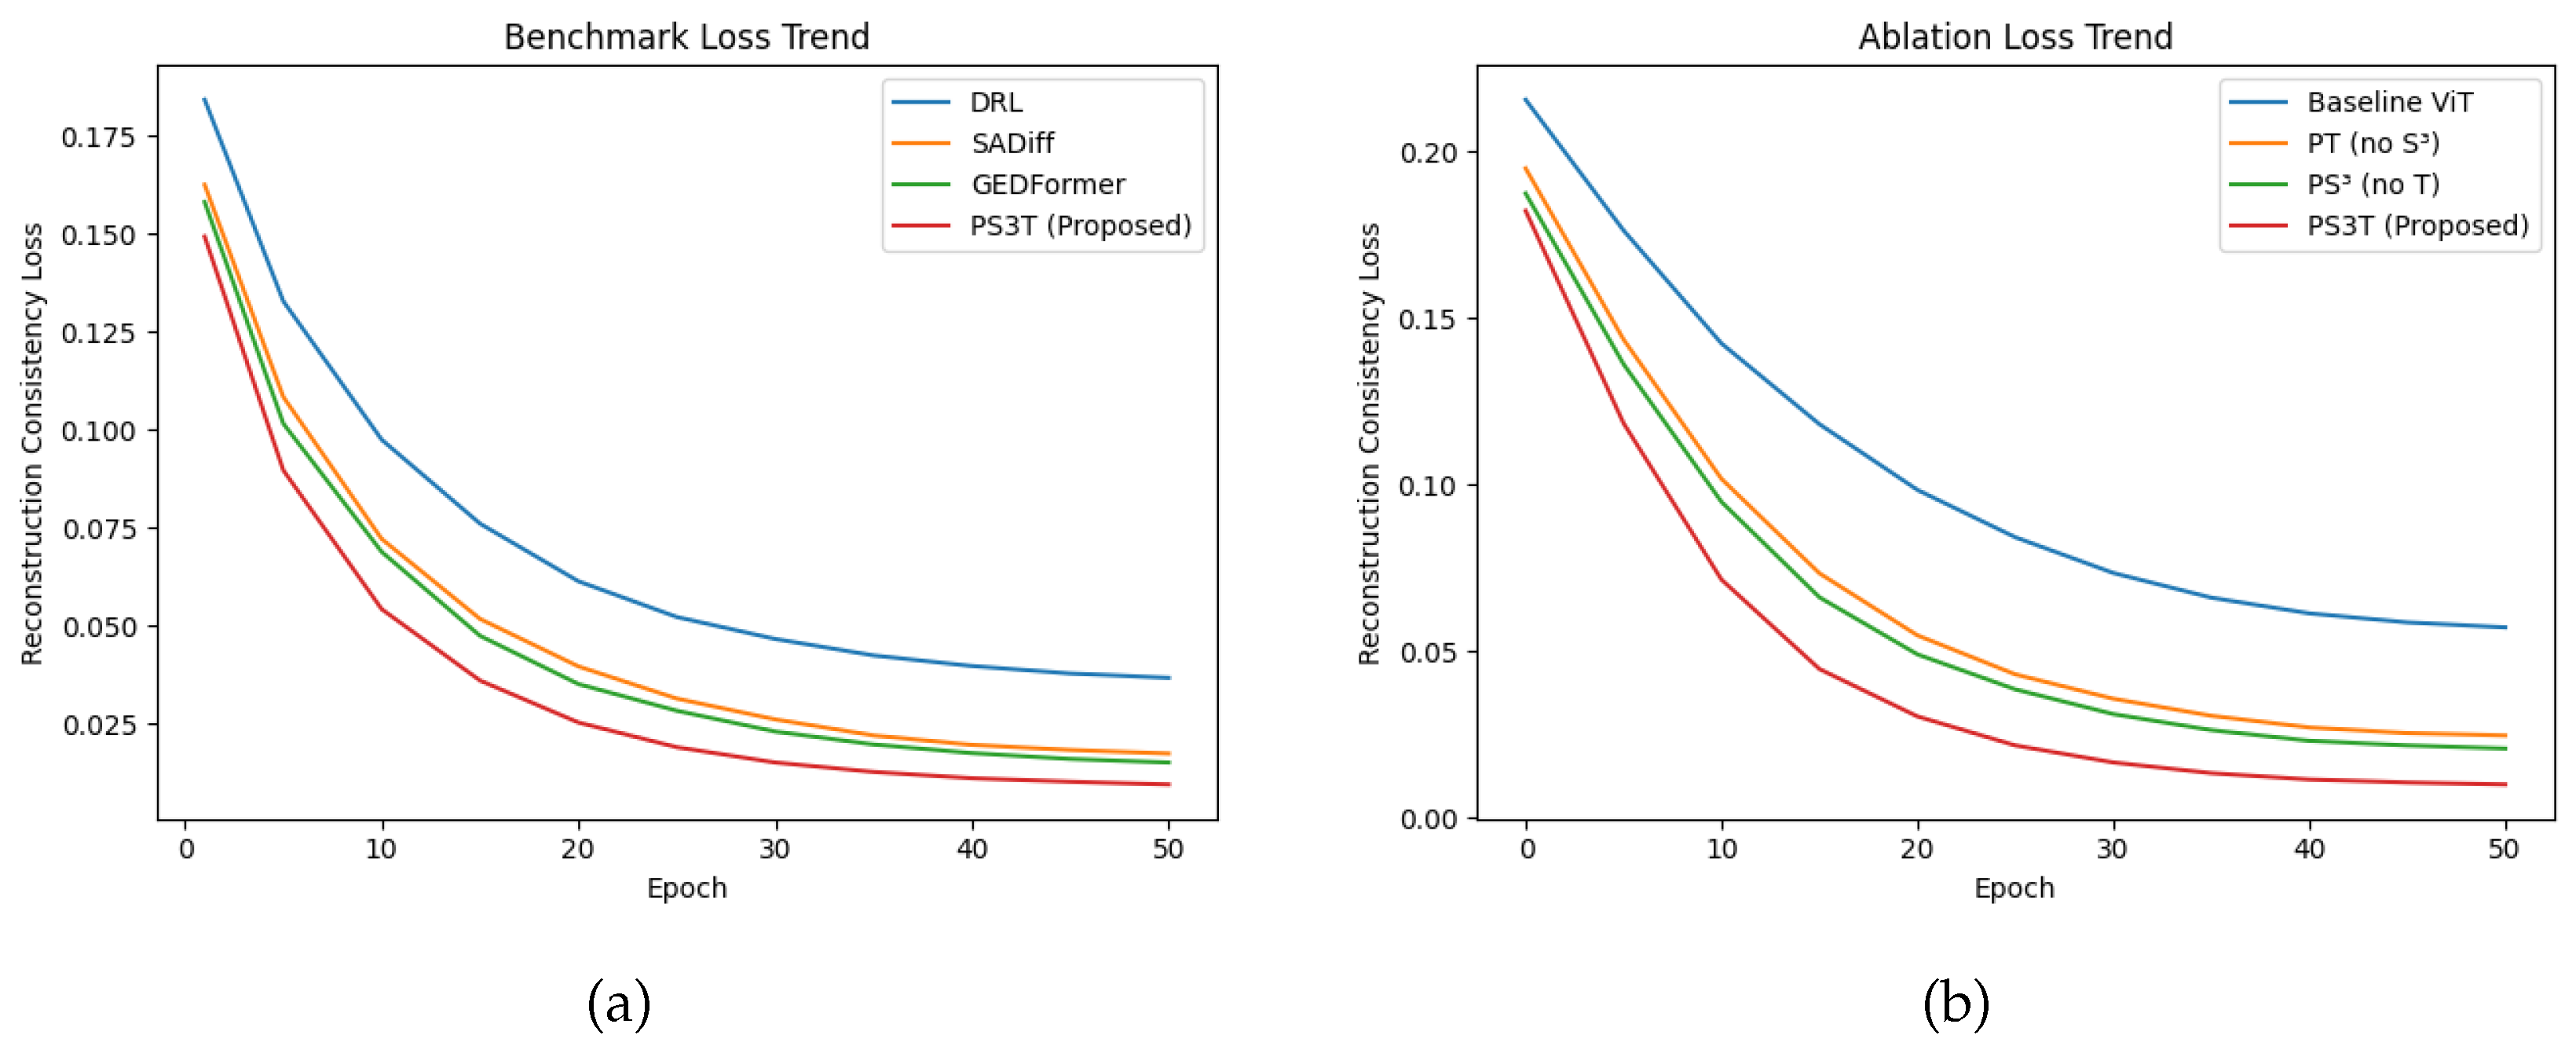
The reconstruction consistency trends reported in Table 9 and Table 10 are consistent with the intensity profile analyses presented in Figure 5 and Figure 7. Models achieving lower reconstruction consistency losses produce attenuation profiles that more closely match the NDCT reference, indicating improved preservation of tissue intensity distributions after reconstruction. In particular, the proposed P S 3 T framework achieves the lowest L r e c o n values throughout the entire training process, demonstrating superior reconstruction fidelity compared with both benchmark methods and ablated configurations.
For the benchmark comparison in Table 9, all methods exhibit a reduction in reconstruction consistency loss as training progresses, indicating improved alignment between the reconstructed images and the reference NDCT images. However, P S 3 T demonstrates the fastest convergence, as shown in Figure 8a, and maintains the lowest loss throughout training. At the beginning of training, P S 3 T achieves an initial L r e c o n value of 0.1750, already lower than DRL (0.2180), SADiff (0.1920), and GEDFormer (0.1870). This performance gap becomes increasingly evident as optimization progresses. By epoch 50, P S 3 T reaches a final reconstruction consistency loss of 0.0128, outperforming GEDFormer (0.0190), SADiff (0.0225), and DRL (0.0460). These results demonstrate that the proposed framework learns reconstruction-consistent representations more effectively than existing approaches.
The improved convergence behavior of P S 3 T can be attributed to its physics-guided projection-domain learning strategy. Unlike conventional image-domain denoising approaches that primarily optimize image similarity, P S 3 T incorporates projection-domain representations with photon-aware attention and sequential state space evolution, enabling the network to preserve acquisition-related characteristics while reducing noise. As a result, the learned features remain more consistent with the underlying CT reconstruction process, leading to lower reconstruction discrepancies throughout training.
The ablation study in Table 10, illustrated in Figure 8b, further highlights the contribution of each proposed component. The baseline ViT exhibits the highest reconstruction consistency loss throughout training, reaching 0.0710 at epoch 50. Introducing projection-domain processing through PT (no S 3 ) substantially reduces the reconstruction error to 0.0320, demonstrating the benefit of incorporating projection information. Similarly, the P S 3 (no T) configuration achieves a lower final loss of 0.0275, indicating that sequential state space modeling improves reconstruction consistency. However, neither component alone achieves the performance of the complete P S 3 T framework.
The full P S 3 T model achieves the lowest loss at every evaluated epoch, decreasing from 0.2110 at epoch 1 to 0.0128 at epoch 50. Compared with the baseline ViT, this represents an approximately 82% reduction in reconstruction consistency error, demonstrating the complementary effect of combining projection-domain learning, sequential state space evolution, and transformer-based refinement. The progressively increasing separation between P S 3 T and its ablated variants during later training stages suggests that the proposed components provide a stronger reconstruction-aware learning signal and improve optimization stability.
Hence, the reconstruction consistency analysis confirms that P S 3 T provides superior convergence behavior and reconstruction fidelity compared with existing benchmark methods and individual component variations. The consistently lower L r e c o n values indicate that the proposed physics-guided framework effectively constrains the denoising process toward physically plausible solutions, resulting in improved attenuation preservation and anatomical consistency after reconstruction.

3.4. Physical and Structural Advantages

The improved performance of P S 3 T can be attributed to its architectural design, which integrates physics-guided constraints within a sequential state-space transformer framework. Unlike conventional deep learning approaches that rely primarily on data-driven feature extraction, the proposed framework incorporates knowledge of the CT acquisition process into the denoising pipeline. This enables the network to exploit both the statistical characteristics of the measured projections and the underlying physics governing X-ray attenuation.
Operating directly in the projection domain (sinogram space), P S 3 T models sequential relationships between neighboring projection views using a state-space formulation. This facilitates the learning of long-range angular dependencies that are inherently present during CT acquisition. Furthermore, the photon-aware transformer adaptively emphasizes projection measurements according to their estimated photon statistics, allowing the network to place greater emphasis on more reliable measurements while reducing the influence of noise-contaminated projections. By performing denoising before image reconstruction, the proposed framework suppresses projection-domain noise prior to filtered backprojection, thereby reducing the propagation of noise-related artifacts into the reconstructed CT images.
The transformer component further enhances feature representation by jointly modeling local contextual information and long-range dependencies within the projection data. Compared with conventional self-attention mechanisms, the sequential state-space formulation provides a computationally efficient alternative for modeling long projection sequences while avoiding the quadratic complexity associated with standard transformer architectures. In combination with the proposed reconstruction consistency optimization, these components encourage agreement between the denoised projection data and the reconstructed image domain, resulting in improved attenuation preservation, structural fidelity, and quantitative reconstruction performance across all evaluated anatomical regions.

3.5. Clinical Implications and Future Work

The improvements demonstrated by P S 3 T indicate its potential for enhancing low-dose CT image quality. The observed gains in SSIM and PSNR, particularly in anatomically challenging regions such as the Head and Chest where bone structures and respiratory motion may complicate image reconstruction, suggest that the proposed framework could contribute to future dose reduction strategies while maintaining image quality. Furthermore, the patient-level evaluation performed in this study provides a more rigorous assessment of model generalization by ensuring complete separation of patient data between the training, validation, and testing subsets. Nevertheless, additional clinical validation remains necessary before establishing diagnostic equivalence.
While the proposed framework demonstrates consistent improvements in quantitative image quality metrics, visual assessments, and attenuation profile preservation, these evaluations do not directly measure diagnostic performance. Recent recommendations from the medical imaging and medical physics communities have emphasized that conventional metrics such as SSIM, PSNR, and RMSE may not fully characterize the clinical utility of deep learning-based CT reconstruction and denoising methods, particularly with respect to low-contrast lesion detectability and the preservation of clinically relevant anatomical structures [40]. Although confidence intervals and paired statistical significance testing were incorporated to assess the robustness of the reported quantitative improvements, these analyses remain limited to image-quality metrics and do not directly evaluate diagnostic effectiveness. Future studies will therefore incorporate task-based image quality assessment using observer-performance metrics, such as the detectability index ( d ), together with blinded reader studies involving radiologists to further evaluate the diagnostic reliability and clinical applicability of the proposed framework.
Although the proposed framework demonstrated consistent performance across the evaluated anatomical regions under a patient-level evaluation protocol, the study was conducted using a single publicly available benchmark dataset. Future work will therefore investigate the generalizability of P S 3 T using additional multi-institutional and multi-vendor clinical datasets acquired under diverse imaging protocols and dose levels.
Overall, P S 3 T demonstrates promising potential for projection-domain LDCT denoising by integrating acquisition physics with sequential state-space modeling to improve image quality while preserving anatomical fidelity. Further validation through larger multicenter datasets, task-based image quality assessment, and prospective reader studies will be important to establish its clinical utility and facilitate translation into routine clinical practice.


4. Conclusions

In this work, we presented the Physics-Guided Sequential State Space Transformer ( P S 3 T ) for projection-domain low-dose CT (LDCT) denoising. By integrating physics-guided constraints with sequential state-space modeling and photon-aware attention, the proposed framework effectively exploits both the statistical characteristics of projection data and the underlying physics of CT image formation. Experimental evaluation using patient-level data partitioning across abdomen, head, and chest datasets demonstrated that P S 3 T consistently achieved improved quantitative performance compared with existing LDCT denoising methods, while maintaining favorable visual image quality and attenuation profile preservation. Furthermore, statistical significance testing confirmed that the observed improvements were consistent across the independent test data.
The results indicate that incorporating physics-guided inductive biases together with reconstruction-consistency optimization provides a robust framework for projection-domain LDCT denoising. Although the proposed method demonstrated improved image quality according to quantitative evaluation metrics, confidence interval analysis, and qualitative assessment, these findings do not directly establish diagnostic performance. Future work will therefore focus on validating the proposed framework using multi-institutional clinical datasets, task-based image quality assessment, and blinded radiologist reader studies to further evaluate its generalizability, diagnostic utility, and potential for clinical translation. In addition, extending the proposed framework to ultra-low-dose CT acquisition and investigating its applicability to real-time reconstruction workflows represent promising directions for future research.

Author Contributions

Study conception: J.A., P.B.; methodology and investigation: L.M.; data curation: P.B.; analysis and interpretation of results: L.M., J.A., P.B.; draft manuscript preparation: L.M.; review and editing: J.A., P.B.; funding acquisition: J.A. All authors have read and agreed to the published version of the manuscript.

Funding

This research has been supported by the Natural Sciences and Engineering Research Council of Canada (NSERC) Discovery grant RGPIN-2020–04441 awarded to Dr. Javad Alirezaie.

Institutional Review Board Statement

Not applicable. This is an observational study. The Research Ethics Committee can confirm that no ethical approval is required.

Informed Consent Statement

Not applicable. The authors used computed tomography images and confirms that there is no identifiable information on the images. Therefore, it was not necessary to obtain consents.

Data Availability Statement

The data (Chest, Abdomen and Head) used for this study are openly available from The Cancer Imaging Archive (TCIA): https://doi.org/10.7937/9NPB-2637; further inquiries can be directed to the corresponding author. The source code and implementation of the proposed PS3T framework are publicly available through the following GitHub repository: https://github.com/ellamrcs/ps3tldctdenoising (accessed on 1 September 2026).

Acknowledgments

The authors would like to thank Cynthia McCollough, the Mayo Clinic, and the American Association of Physicists in Medicine for making the CT data available for the study.

Conflicts of Interest

The authors declare no conflicts of interest.

References

  1. Alagic, Z. New Developments in Computed Tomography: Low Dose Techniques, Image Reconstruction, and Spectral Imaging. Ph.D. Thesis, Karolinska Institutet, Solna, Sweden, 2024. [Google Scholar]
  2. Niwa, S.; Ichikawa, K.; Kawashima, H.; Takata, T.; Minami, S.; Mitsui, W. Reduction of streak artifacts caused by low photon counts utilizing an image-based forward projection in computed tomography. Comput. Biol. Med. 2021, 135, 104583. [Google Scholar] [CrossRef] [Scilit] [PubMed]
  3. Kim, S.; Kim, B.; Baek, J. Dose-aware denoising diffusion model for low-dose CT. Phys. Med. Biol. 2025, 70, 145019. [Google Scholar] [CrossRef] [Scilit] [PubMed]
  4. Pathak, K.; Bhandari, A.K. Advances in Deep Learning and Filtering Models for Medical Image Denoising: A Review of Current and Future Trends. Circuits Syst. Signal Process. 2026, 45, 6530–6604. [Google Scholar] [CrossRef] [Scilit]
  5. Chauhan, S.; Malik, N.; Vig, R. AI/ML techniques in servicing LDCT reconstruction: A systematic literature review. Discov. Artif. Intell. 2025, 5, 229. [Google Scholar] [CrossRef] [Scilit]
  6. Dickson, J.; Horst, C.; Nair, A.; Tisi, S.; Prendecki, R.; Janes, S. Hesitancy around low-dose CT screening for lung cancer. Ann. Oncol. 2022, 33, 34–41. [Google Scholar] [CrossRef] [Scilit] [PubMed]
  7. Zhang, J.; Gong, W.; Ye, L.; Wang, F.; Shangguan, Z.; Cheng, Y. A review of deep learning methods for denoising of medical low-dose CT images. Comput. Biol. Med. 2024, 171, 108112. [Google Scholar] [CrossRef] [Scilit] [PubMed]
  8. Kim, W.; Jeon, S.Y.; Byun, G.; Yoo, H.; Choi, J.H. A systematic review of deep learning-based denoising for low-dose computed tomography from a perceptual quality perspective. Biomed. Eng. Lett. 2024, 14, 1153–1173. [Google Scholar] [CrossRef] [Scilit] [PubMed]
  9. Zhao, F.; Liu, M.; Xiang, M.; Li, D.; Jiang, X.; Jin, X.; Lin, C.; Wang, R. Unsupervised and Self-supervised Learning in Low-Dose Computed Tomography Denoising: Insights from Training Strategies. J. Imaging Inform. Med. 2025, 38, 902–930. [Google Scholar] [CrossRef] [Scilit] [PubMed]
  10. Prakash, D.; Kotian, R.P. Computed Tomography: Physics, Principle of Operation, Quality Control, and Safety. In Fundamentals of X-Ray Imaging: Basic Principles, Quality Control, Clinical Applications, and Safety; Springer: Berlin/Heidelberg, Germany, 2025; pp. 313–415. [Google Scholar]
  11. Kaur, N.; Brar, G.S. Advanced Methods and Approaches in Image Reconstruction. In Biomedical Imaging Technology: Signal Processing Strategies and Innovations; John Wiley & Sons: Hoboken, NJ, USA, 2025; pp. 45–73. [Google Scholar]
  12. Xia, W.; Shan, H.; Wang, G.; Zhang, Y. Physics-/model-based and data-driven methods for low-dose computed tomography: A survey. IEEE Signal Process. Mag. 2023, 40, 89–100. [Google Scholar] [CrossRef] [Scilit] [PubMed]
  13. Lee, D.H.; Lee, J.M.; Lee, C.H.; Afat, S.; Othman, A. Image quality and diagnostic performance of low-dose liver CT with deep learning reconstruction versus standard-dose CT. Radiol. Artif. Intell. 2024, 6, e230192. [Google Scholar] [CrossRef] [Scilit] [PubMed]
  14. Hata, A.; Yanagawa, M.; Yoshida, Y.; Miyata, T.; Tsubamoto, M.; Honda, O.; Tomiyama, N. Combination of deep learning–based denoising and iterative reconstruction for ultra-low-dose CT of the chest: Image quality and Lung-RADS evaluation. Am. J. Roentgenol. 2020, 215, 1321–1328. [Google Scholar] [CrossRef] [Scilit] [PubMed]
  15. Zhou, J.; Xia, T.; Lee, E.; Cai, K. Deep Learning Techniques for CT Image Denoising and Resolution Enhancement. In Deep Learning for Advanced X-Ray Detection and Imaging Applications; Springer: Cham, Switzerland, 2024; pp. 1–19. [Google Scholar]
  16. Yan, R.; Liu, Y.; Liu, Y.; Wang, L.; Zhao, R.; Bai, Y.; Gui, Z. Image denoising for low-dose CT via convolutional dictionary learning and neural network. IEEE Trans. Comput. Imaging 2023, 9, 83–93. [Google Scholar] [CrossRef] [Scilit]
  17. Zhu, L.; Han, Y.; Xi, X.; Fu, H.; Tan, S.; Liu, M.; Yang, S.; Liu, C.; Li, L.; Yan, B. STEDNet: Swin transformer-based encoder–decoder network for noise reduction in low-dose CT. Med. Phys. 2023, 50, 4443–4458. [Google Scholar] [CrossRef] [Scilit] [PubMed]
  18. Han, Y.; Liu, X.; Zhang, N.; Wang, Y.; Ju, M.; Ding, Y. LDCT image denoising algorithm based on two-dimensional variational mode decomposition and dictionary learning. Sci. Rep. 2024, 14, 17487. [Google Scholar] [CrossRef] [Scilit] [PubMed]
  19. Ferdi, A.; Benierbah, S.; Nakib, A. Residual encoder-decoder based architecture for medical image denoising. Multimed. Tools Appl. 2025, 84, 21625–21642. [Google Scholar] [CrossRef] [Scilit]
  20. Wang, J.; Wang, W.; Liu, Y.; Dong, X.; Lin, C.; He, X.; Cao, P.; Niu, M.; Fu, Y. A dual-interactive fusion network for low-dose CT image denoising. Med. Phys. 2026, 53, e70253. [Google Scholar] [CrossRef] [Scilit] [PubMed]
  21. Guo, S.; Li, J.; Wu, Y. MRDT-GAN: Generative adversarial network with multi-scale residual dense transformer generator for low-dose CT denoising. Phys. Med. Biol. 2026, 71, 085014. [Google Scholar] [CrossRef] [Scilit] [PubMed]
  22. Yang, L.; Li, Z.; Ge, R.; Zhao, J.; Si, H.; Zhang, D. Low-dose CT denoising via sinogram inner-structure transformer. IEEE Trans. Med. Imaging 2022, 42, 910–921. [Google Scholar] [CrossRef] [Scilit] [PubMed]
  23. Niu, C.; Li, M.; Guo, X.; Wang, G. Self-supervised dual-domain network for low-dose CT denoising. In Proceedings of the Developments in X-Ray Tomography XIV; SPIE: Bellingham, WA, USA, 2022; Volume 12242, pp. 85–91. [Google Scholar]
  24. Niknejad Mazandarani, F.; Babyn, P.; Alirezaie, J. SADiff: A sinogram-aware diffusion model for low-dose CT image denoising. J. Imaging Inform. Med. 2025, 38, 4255–4275. [Google Scholar] [CrossRef] [Scilit] [PubMed]
  25. Lu, Y.; Xu, Z.; Choi, M.H.; Kim, J.; Jung, S.W. Cross-domain denoising for low-dose multi-frame spiral computed tomography. IEEE Trans. Med. Imaging 2024, 43, 3949–3963. [Google Scholar] [CrossRef] [Scilit] [PubMed]
  26. Marcos, L.; Babyn, P.; Alirezaie, J. Low-Dose Computed Tomography Image Denoising Vision Transformer Model Optimization Using Space State Method. Int. J. Imaging Syst. Technol. 2025, 35, e70220. [Google Scholar] [CrossRef] [Scilit]
  27. Wang, H.; Chi, J.; Wu, C.; Yu, X.; Wu, H. Degradation adaption local-to-global transformer for low-dose CT image denoising. J. Digit. Imaging 2023, 36, 1894–1909. [Google Scholar] [CrossRef] [Scilit] [PubMed]
  28. Zhang, S.Y.; Wang, Z.X.; Yang, H.B.; Chen, Y.L.; Li, Y.; Pan, Q.; Wang, H.K.; Zhao, C.X. Hformer: Highly efficient vision transformer for low-dose CT denoising. Nucl. Sci. Tech. 2023, 34, 61. [Google Scholar] [CrossRef] [Scilit]
  29. Marcos, L.; Babyn, P.; Alirezaie, J. Pure vision transformer (CT-ViT) with Noise2Neighbors interpolation for low-dose CT image denoising. J. Imaging Inform. Med. 2024, 37, 2669–2687. [Google Scholar] [CrossRef] [Scilit] [PubMed]
  30. Jameel, U.; Belcari, N. High-Fidelity CT Image Denoising with De-TransGAN: A Transformer-Augmented GAN Framework with Attention Mechanisms. Bioengineering 2025, 12, 1350. [Google Scholar] [CrossRef] [Scilit] [PubMed]
  31. Zhao, S.; Jiang, A.; Ding, J. MoCoDiff: Momentum context diffusion model for low-dose CT denoising. Digit. Signal Process. 2025, 156, 104868. [Google Scholar] [CrossRef] [Scilit]
  32. Su, B.; Xu, J.; Hu, X.; Zha, Y.; Wan, J.; Li, J. Zero-shot low-dose CT denoising across variable schemes via strip-scanning diffusion models. Neurocomputing 2025, 633, 129828. [Google Scholar] [CrossRef] [Scilit]
  33. Öztürk, Ş.; Duran, O.C.; Çukur, T. Denomamba: A fused state-space model for low-dose ct denoising. arXiv 2024, arXiv:2409.13094. [Google Scholar]
  34. Huang, J.; Zhong, A.; Wei, Y. A new visual State Space Model for low-dose CT denoising. Med. Phys. 2024, 51, 8851–8864. [Google Scholar] [CrossRef] [Scilit] [PubMed]
  35. Li, L.; Wei, W.; Yang, L.; Zhang, W.; Dong, J.; Liu, Y.; Huang, H.; Zhao, W. CT-Mamba: A hybrid convolutional state space model for low-dose CT denoising. Comput. Med. Imaging Graph. 2025, 124, 102595. [Google Scholar] [CrossRef] [Scilit] [PubMed]
  36. Seeram, E. Computed tomography: Physical principles and recent technical advances. J. Med. Imaging Radiat. Sci. 2010, 41, 87–109. [Google Scholar] [CrossRef] [Scilit] [PubMed]
  37. McCollough, C.; Chen, B.; Holmes, D., III; Duan, X.; Yu, Z.; Yu, L.; Leng, S.; Fletcher, J. Data from Low Dose CT Image and Projection Data [Data Set]. The Cancer Imaging Archive. 2021. Available online: https://www.cancerimagingarchive.net/collection/ldct-and-projection-data/ (accessed on 5 November 2019).
  38. Gholizadeh-Ansari, M.; Alirezaie, J.; Babyn, P. Deep Learning for Low-Dose CT Denoising using Perceptual Loss and Edge Detection Layer. J. Digit. Imaging 2019, 33, 505–514. [Google Scholar] [CrossRef] [Scilit] [PubMed]
  39. Marcos, L.; Babyn, P.; Alirezaie, J. GEDFormer: Gradient Edge Detection in LDCT Image Denoising Transformer Model. In Proceedings of the 2025 47th Annual International Conference of the IEEE Engineering in Medicine and Biology Society (EMBC); IEEE: New York, NY, USA, 2025; pp. 1–6. [Google Scholar]
  40. McCollough, C.H.; Leng, S.; Yu, L. The Uncoupling of CT Dose and Noise. Radiology 2026, 319, e260149. [Google Scholar] [CrossRef] [Scilit] [PubMed]
Figure 1. Overall System Design: Schematic overview of the proposed P S 3 T framework. The multi-stage pipeline illustrates the progression from raw low-dose sinograms to high-fidelity reconstructions via projection embedding, sequential state space evolution, differentiable filtered backprojection (FBP), and final refinement using an Image-Domain Vision Transformer (ViT).
Signals 07 00089 g001
Figure 2. Detailed architecture of the Photon-Aware Physics Attention mechanism. The module integrates localized photon statistics into the attention layers to dynamically modulate projection-space feature extraction based on physical noise variance.
Signals 07 00089 g002
Figure 3. Detailed architecture of the Image-Domain ViT Refinement Block.
Signals 07 00089 g003
Figure 4. (i) Reference NDCT image, (ii) NDCT ROI, (iii) LDCT ROI and ROI’s generated using the models (iv) DRL, (v) SADiff, (vi) GEDFormer, (vii) proposed P S 3 T of the three datasets: (A) Chest, (B) Abdomen and (C) Head. The region of interest (ROI) outlined in the red box in (i) corresponds to the zoomed-in regions shown in panels (iivii).
Signals 07 00089 g004
Figure 5. Benchmark profile analysis for different anatomical views. The left column showcases the reference line placement on the ground truth slices for the abdomen (a), chest (c), and head (e). The right column highlights the matching intensity profiles (b,d,f) used to evaluate fine structural preservation.
Signals 07 00089 g005
Figure 6. (i) Reference NDCT image, (ii) NDCT ROI, (iii) LDCT ROI and ROI’s generated using the models (iv) baseline ViT, (v) PT (no S 3 ), (vi) P S 3 (no T), (vii) proposed P S 3 T of the three datasets: (A) Abdomen, (B) Chest and (C) Head. The region of interest (ROI) outlined in the red box in (i) corresponds to the zoomed-in regions shown in panels (iivii).
Signals 07 00089 g006
Figure 7. Ablation study profile analysis for different anatomical views. The left column showcases the reference line placement on the ground truth slices for the abdomen (a), chest (c), and head (e). The right column highlights the matching intensity profiles (b,d,f) used to evaluate fine structural preservation.
Signals 07 00089 g007aSignals 07 00089 g007b
Figure 8. Training optimization trends over 50 epochs: (a)Benchmark evaluation comparing the proposed framework against state-of-the-art networks; (b) Ablation study demonstrating the step-wise impact of different module configurations on reconstruction consistency loss.
Signals 07 00089 g008
Table 1. Data split partitioning for the Mayo Clinic LDCT dataset.
DatasetTotal PatientsTrain (70%)Val (15%)Test (15%)
Abdomen (L)100701515
Chest (C)100701515
Head (N)99691515
Combined2992094545
Table 2. Quantitative comparison of denoising methods on the Abdomen dataset (at patient-level split). Values are reported as the mean, with the corresponding 95% confidence intervals (95% CI) shown in square brackets. The best results are highlighted in bold.
NetworkSSIMPSNRRMSE
LDCT0.6210 [0.5820, 0.6600]28.85 [27.40, 30.30]0.0358 [0.0310, 0.0406]
DRL0.7410 [0.7020, 0.7800]35.60 [34.10, 37.10]0.0165 [0.0135, 0.0195]
SADiff0.8810 [0.8520, 0.9100]40.15 [38.90, 41.40]0.0098 [0.0082, 0.0114]
GEDFormer0.8250 [0.7910, 0.8590]40.20 [38.95, 41.45]0.0095 [0.0078, 0.0112]
PS 3 T  (Proposed)0.9020 [0.8780, 0.9260]42.40 [41.30, 43.50]0.0076 [0.0066, 0.0086]
Table 3. Quantitative comparison of denoising methods on the Head dataset (at patient-level split). Values are reported as the mean, with the corresponding 95% confidence intervals (95% CI) shown in square brackets. The best results are highlighted in bold.
NetworkSSIMPSNRRMSE
LDCT0.1980 [0.1650, 0.2310]28.90 [27.35, 30.45]0.0352 [0.0308, 0.0396]
DRL0.4450 [0.4120, 0.4780]36.80 [35.20, 38.40]0.0145 [0.0115, 0.0175]
SADiff0.6580 [0.6280, 0.6880]40.25 [38.90, 41.60]0.0098 [0.0081, 0.0115]
GEDFormer0.6210 [0.5890, 0.6530]41.10 [39.80, 42.40]0.0088 [0.0072, 0.0104]
PS 3 T  (Proposed)0.7180 [0.6920, 0.7440]42.25 [41.20, 43.30]0.0078 [0.0066, 0.0090]
Table 4. Quantitative comparison of denoising methods on the Chest dataset (at patient-level split). Values are reported as the mean, with the corresponding 95% confidence intervals (95% CI) shown in square brackets. The best results are highlighted in bold.
NetworkSSIMPSNRRMSE
LDCT0.2980 [0.2560, 0.3400]24.60 [23.20, 26.00]0.0582 [0.0510, 0.0654]
DRL0.3950 [0.3580, 0.4320]28.80 [27.30, 30.30]0.0355 [0.0310, 0.0400]
SADiff0.6450 [0.6120, 0.6780]33.20 [31.90, 34.50]0.0215 [0.0188, 0.0242]
GEDFormer0.7580 [0.7240, 0.7920]33.90 [32.60, 35.20]0.0198 [0.0172, 0.0224]
PS 3 T  (Proposed)0.7980 [0.7720, 0.8240]36.10 [35.10, 37.10]0.0152 [0.0136, 0.0168]
Table 5. Wilcoxon signed-rank test p-values comparing the proposed P S 3 T against competing methods on the Abdomen dataset (at patient-leve split).
ComparisonSSIMPSNRRMSE
P S 3 T vs. DRL<0.001<0.001<0.001
P S 3 T vs. SADiff0.0080.0180.012
P S 3 T vs. GEDFormer0.0280.0410.025
Table 6. Wilcoxon signed-rank test p-values comparing the proposed P S 3 T against competing methods on the Head dataset (at patient-level split).
ComparisonSSIMPSNRRMSE
P S 3 T vs. DRL<0.001<0.001<0.001
P S 3 T vs. SADiff0.0060.0120.009
P S 3 T vs. GEDFormer0.0030.0320.038
Table 7. Wilcoxon signed-rank test p-values comparing the proposed P S 3 T against competing methods on the Chest dataset (at patient-level split).
ComparisonSSIMPSNRRMSE
P S 3 T vs. DRL<0.001<0.001<0.001
P S 3 T vs. SADiff0.00180.00350.0022
P S 3 T vs. GEDFormer0.02400.01500.0190
Table 8. Ablation quantitative comparison of denoising methods on the Mayo Clinic LDCT and Projection Dataset (at patient-level split). The best results are highlighted in bold.
NetworkAbdomenHeadChest
SSIMPSNRRMSESSIMPSNRRMSESSIMPSNRRMSE
Baseline ViT0.858039.100.01120.642039.500.01080.721032.800.0225
P S 3 (no T)0.876040.300.00980.671040.600.00960.752034.100.0192
PT (no S 3 )0.891041.200.00850.692041.200.00880.774035.000.0171
L MSE  (PS3T)0.898041.800.00800.708041.700.00820.788035.600.0158
L recon  (PS3T)0.902042.400.00760.718042.250.00780.798036.100.0152
Table 9. Benchmark Reconstruction Consistency Loss ( L r e c o n ) Across Training Epochs.
EpochDRLSADiffGEDFormer PS 3 T (Proposed)
10.21800.19200.18700.1750
50.15800.13100.12400.1080
100.11900.08900.08400.0680
150.09500.06600.06000.0460
200.07800.05100.04500.0330
250.06700.04100.03600.0250
300.06000.03400.02900.0200
350.05500.02900.02500.0170
400.05100.02600.02200.0150
450.04800.02400.02000.0138
500.04600.02250.01900.0128
Table 10. Ablation Reconstruction Consistency Loss ( L r e c o n ) Across Training Epochs.
EpochBaseline ViTPT (No S 3 ) PS 3 (No T) PS 3 T (Proposed)
10.24800.22500.21800.2110
50.20500.16800.16000.1380
100.16900.12200.11400.0860
150.14200.09100.08200.0570
200.12100.07100.06300.0410
250.10600.05800.05100.0300
300.09400.04800.04200.0230
350.08500.04100.03500.0185
400.07800.03600.03100.0158
450.07350.03350.02880.0139
500.07100.03200.02750.0128
Disclaimer/Publisher’s Note: The statements, opinions and data contained in all publications are solely those of the individual author(s) and contributor(s) and not of MDPI and/or the editor(s). MDPI and/or the editor(s) disclaim responsibility for any injury to people or property resulting from any ideas, methods, instructions or products referred to in the content.