Article

Augmented Gait Classification: Integrating YOLO, CNN–SNN Hybridization, and GAN Synthesis for Knee Osteoarthritis and Parkinson’s Disease

1
Signal Image et Maitrise de l’Energie, Research Laboratory SIME, University of Tunis, Tunisia 5 Avenue Taha Hussein, Tunis 1008, Tunisia
2
J-AP2S Laboratoire Jeunesse—Activité Physique et Sportive—Santé, University of Toulon, 83130 La Garde, France
*
Author to whom correspondence should be addressed.
Signals 2025, 6(4), 64; https://doi.org/10.3390/signals6040064 (registering DOI)
Submission received: 8 September 2025 / Revised: 20 October 2025 / Accepted: 29 October 2025 / Published: 7 November 2025

Abstract

We propose a novel hybrid deep learning framework that synergistically integrates Convolutional Neural Networks (CNNs), Spiking Neural Networks (SNNs), and Generative Adversarial Networks (GANs) for robust and accurate classification of high-resolution frontal and sagittal human gait video sequences—capturing both lower-limb kinematics and upper-body posture—from subjects with Knee Osteoarthritis (KOA), Parkinson’s Disease (PD), and healthy Normal (NM) controls, classified into three disease-type categories. Our approach first employs a tailored CNN backbone to extract rich spatial features from fixed-length clips (e.g., 16 frames resized to 128 × 128 px), which are then temporally encoded and processed by an SNN layer to capture dynamic gait patterns. To address class imbalance and enhance generalization, a conditional GAN augments rare severity classes with realistic synthetic gait sequences. Evaluated on the controlled, marker-based KOA-PD-NM laboratory public dataset, our model achieves an overall accuracy of 99.47%, a sensitivity of 98.4%, a specificity of 99.0%, and an F1-score of 98.6%, outperforming baseline CNN, SNN, and CNN–SNN configurations by over 2.5% in accuracy and 3.1% in F1-score. Ablation studies confirm that GAN-based augmentation yields a 1.9% accuracy gain, while the SNN layer provides critical temporal robustness. Our findings demonstrate that this CNN–SNN–GAN paradigm offers a powerful, computationally efficient solution for high-precision, gait-based disease classification, achieving a 48.4% reduction in FLOPs (1.82 GFLOPs to 0.94 GFLOPs) and 9.2% lower average power consumption (68.4 W to 62.1 W) on Kaggle P100 GPU compared to CNN-only baselines. The hybrid model demonstrates significant potential for energy savings on neuromorphic hardware, with an estimated 13.2% reduction in energy per inference based on FLOP-based analysis, positioning it favorably for deployment in resource-constrained clinical environments and edge computing scenarios.

1. Introduction

Human gait embodies a complex interplay of neuromuscular signals, joint mechanics, and balance strategies that together dictate how individuals initiate, sustain, and terminate movement. For clinicians and researchers alike, deviations from normative gait patterns can signal the onset or progression of musculoskeletal and neurological disorders. In particular, Knee Osteoarthritis (KOA) and Parkinson’s Disease (PD) manifest through distinct gait alterations—ranging from reduced stride length and altered joint loading in KOA to shuffling steps and bradykinesia in PD—that are often subtle in early stages but grow more pronounced over time. Consequently, accurate, scalable gait analysis holds immense promise for early diagnosis, severity staging, and treatment monitoring.
Traditional gait assessment techniques typically involve force plates, wearable inertial sensors, or motion-capture systems equipped with reflective markers. While these modalities deliver precise kinematic and kinetic metrics, they suffer from logistical constraints: specialized hardware, controlled laboratory settings, and labor-intensive data processing pipelines. Moreover, these approaches are largely inaccessible for routine, in-home monitoring, limiting their utility for longitudinal studies and telemedicine applications.
Video-based gait analysis, powered by advances in computer vision and deep learning, offers a non-invasive, cost-effective alternative that leverages ubiquitous camera systems. Convolutional Neural Networks (CNNs) have emerged as the cornerstone of spatial feature extraction from images and video frames, excelling at identifying anatomical landmarks, silhouette contours, and texture gradients. However, CNNs alone may inadequately capture temporal dynamics—such as the timing of foot strikes or the smooth transition between stance and swing phases—that are critical for characterizing gait rhythms.
Spiking Neural Networks (SNNs), which emulate the discrete, spike-based communication of biological neurons, excel at encoding temporal information in an event-driven manner. Their energy-efficient computation and temporal fidelity make them suitable for capturing the sequential nature of gait cycles. Yet, when used in isolation, SNNs often lack the high-dimensional spatial discrimination capabilities that CNNs provide. To reconcile these strengths, hybrid architectures have begun to surface in the literature, combining CNN backbones with spike-based layers to jointly learn spatial patterns and temporal sequences.
Another persistent challenge in medical datasets is class imbalance. Rare disease stages or underrepresented patient groups can lead to biased models that underperform on minority classes. Generative Adversarial Networks (GANs) have shown remarkable success in synthesizing realistic images and sequences, thereby enriching datasets with plausible, yet novel, examples. Conditional variants of GANs enable targeted augmentation, ensuring that synthetic data accurately reflects desired class attributes—such as stage-specific gait irregularities—without introducing artifacts.
Building on these insights, we present a novel, end-to-end framework that synergistically integrates CNNs, SNNs, and conditional GANs to classify high-resolution frontal and sagittal gait videos into three disease-type categories: KOA, PD, and healthy Normal controls. While the original dataset contains severity annotations, this study simplifies the classification problem by focusing on disease-type discrimination rather than severity staging. Our contributions are threefold:
  • Hybrid Spatial–Temporal Architecture: We design a CNN backbone optimized for spatial feature extraction from 16-frame clips (224 × 224 px), followed by an SNN layer that translates feature sequences into spike trains, preserving temporal dynamics crucial for gait rhythm analysis.
  • Targeted GAN Augmentation: We implement a conditional GAN to generate synthetic gait sequences for underrepresented severity classes, balancing the dataset and enhancing model generalization without manual data collection.
  • Comprehensive Evaluation and Ablation: On the public KOA-PD-NM dataset, our framework attains an overall accuracy of 99.47%, a sensitivity of 98%, a specificity of 99%, and an F1-score of 99%, outperforming CNN-only, SNN-only, and CNN–SNN baselines by 2.5–3.1%. Ablation studies isolate the impact of GAN augmentation (1.9% accuracy gain) and the SNN layer’s temporal robustness (2.3% F1 improvement).
The rest of the paper is organized as follows: Section 2 reviews related works in the field of KOA and PD classification. Section 3 describes the methodology and the mathematical formulations used in this work. The KOA-PD-NM dataset, the preprocessing steps, results, and discussion are presented in Section 4. Finally, Section 5 concludes the paper and outlines limitations and directions for future research.

2. Related Work

Knee Osteoarthritis (KOA) and Parkinson’s Disease (PD) are debilitating conditions that significantly impact the quality of life for millions worldwide (Rani et al., 2024) [1] (Diab et al., 2025) [2] (Shaban, 2023) [3]. Recent advancements in machine learning (ML) and deep learning (DL) offer promising avenues for improved diagnosis, classification, and treatment strategies for both diseases (Abumalloh et al., 2024) [4] (Anand et al., 2023) [5] (Hassan et al., 2024) [6]. This literature review explores the application of these computational techniques in addressing the challenges posed by KOA and PD, focusing on classification methodologies and their potential impact.

2.1. Knee Osteoarthritis (KOA) Classification

KOA, a degenerative joint disease, is characterized by the breakdown of cartilage in the knee joint, leading to pain, stiffness, and reduced mobility (Rani et al., 2024) [1] (Cioroianu et al., 2024) [7] (Bhateja et al., 2024) [8]. Traditional diagnostic methods are subjective and time-consuming, highlighting the need for automated and accurate diagnostic tools (Rani et al., 2024) [1] (Diab et al., 2025) [2].
  • Deep Learning Approaches: Deep learning algorithms have gained popularity in KOA identification due to their ability to learn complex patterns from medical images (Hassan et al., 2024) [6] (Anand et al., 2023) [5]. Convolutional Neural Networks (CNNs) are frequently employed to classify KOA severity based on radiographic images, often utilizing the Kellgren-Lawrence (KL) grading system (Hassan et al., 2024) [6] (Jeong & Lee, 2025) [9]. One study proposes a CLIP-based framework (CLIP-KOA) to enhance diagnostic consistency by addressing the limitations of inter-observer variability associated with the KL grading system (Jeong & Lee, 2025) [9]. Another study, KOC_Net, examines the impact of the Synthetic Minority Over-Sampling Technique (SMOTE) with deep learning models for KOA classification using KL X-ray grades (Hassan et al., 2024) [6].
  • Machine Learning Applications: Machine learning techniques are also being explored to classify KOA using various data modalities. One study presents new classification methods of KOA using machine learning and compares its performance with conventional statistical methods using a Logistic Regression Model (Yang et al., 2020) [10]. Another study proposes an EnsembleTL-ACO, a fully automated, computer-aided diagnosis (CAD) system for accurate and rapid KOA severity grading (Malik et al., 2024) [11]. The proposed CAD system leverages an ensemble transfer learning strategy to extract robust deep features by fusing multiple pre-trained CNN models (Malik et al., 2024) [11].
  • Feature Selection and Optimization: Feature selection plays a crucial role in improving the accuracy and efficiency of KOA classification models. One study introduces an enhancement to the Kepler Optimization Algorithm, termed I-KOA, designed specifically for feature selection in high-dimensional datasets (Houssein et al., 2024) [12].

2.2. Parkinson’s Disease (PD) Classification

Parkinson’s Disease (PD) is a progressive neurodegenerative disorder characterized by motor and non-motor symptoms (Abumalloh et al., 2024) [4] (Khoshnevis & Sankar, 2020) [13] (Kaur et al., 2020) [14]. Accurate and early diagnosis is critical for effective treatment and management of the disease (Bakar, 2010) [15].
  • Deep Learning for PD Diagnosis: Deep learning has shown promising outcomes in PD detection compared to traditional machine learning approaches (Abumalloh et al., 2024) [4]. One study explores the use of higher-order statistical features of EEG signals for classifying the stages of Parkinson’s disease (Khoshnevis & Sankar, 2020) [13]. Another study reviews the applications of deep learning in PD diagnosis, highlighting the focus on PD diagnosis (Shaban, 2023) [3].
  • Machine Learning Methodologies: Machine learning techniques are widely used to classify PD subtypes and predict disease severity. One study proposes a causal game-based feature selection (CGFS) model for remote PD symptom severity assessment (Xue et al., 2023) [16]. Another study introduces an interactive web application to identify early Parkinsonian non-tremor-dominant subtypes (Xu et al., 2024) [17]. This application utilizes machine learning models trained on data from the Parkinson’s Disease Progression Marker Initiative (PPMI) (Xu et al., 2024) [17]. A machine learning ensemble is explored for neurological disorders, selecting the best five machine learning models competitively, out of 25 state-of-the-art regression models to generate a robust ensemble (Kaur et al., 2020) [14].
Biomarkers and Data Analysis: Identifying relevant biomarkers and analyzing multimodal data are crucial for accurate PD classification. One study focuses on serum exosome microRNA transcriptome in Parkinson’s disease patients to identify potential biomarkers (Yu et al., 2024) [18]. Another study explores metabolic network alterations as a supportive biomarker in dementia with Lewy bodies (Stockbauer et al., 2023) [19].

2.3. Challenges and Future Directions

Despite the advancements in applying ML and DL techniques for KOA and PD classification, several challenges remain. These include the need for large, diverse datasets, addressing the interpretability of deep learning models, and validating these models in clinical settings (Bhakar et al., 2023) [20]. Future research should focus on developing more robust and generalizable models that can integrate multimodal data sources, including imaging, clinical, and genetic data (Yu et al., 2024) [18]. Additionally, exploring Explainable AI (XAI) techniques to enhance the transparency and trustworthiness of these models is essential (Bhakar et al., 2023). (Cantürk, 2020) [21] processes SST and DST signals to discern PD patients from healthy subjects. AlexNet and GoogleNet are employed for feature extraction, followed by SVM and K-NN for classification.
The proposed study used a hybrid architecture that combined SNN and CNN to classify the dataset into three classes: KOA, PD and NM (Normal).
As shown in Figure 1, YOLOv8 is used to automatically identify and crop patient silhouettes in the gait video frames. This step enables region of interest extraction, enhancing the model’s focus on relevant spatial features.

3. Methodology

3.1. Dataset

The “KOA-PD-NM” gait dataset (Kour et al., 2022) [22] comprises both demographic and gait video data from 96 subjects, categorized into three groups: individuals with Knee Osteoarthritis (KOA), Parkinson’s Disease (PD), and healthy/normal (NM) participants. The KOA group includes 50 subjects, subdivided into early (15), moderate (20), and severe (15) stages, with respective average ages and heights of 47.1 years/1.54 m, 59.8 years/1.58 m, and 62.4 years/1.54 m. The PD group consists of 16 subjects with mild (6), moderate (7), and severe (3) symptoms, averaging 66.5, 69.8, and 70 years of age, and heights of 1.67, 1.61, and 1.66 m, respectively. The NM group includes 30 healthy individuals with an average age of 43.7 years and an average height of 1.60 m. All participants are annotated with subject ID, gender, age, and height. Gait data were collected using a single Nikon D5300 DSLR camera positioned 8 m from a walking mat in a clinical setting. Each subject was recorded in two sagittal plane walking sequences (left-to-right and right-to-left), and each video is provided in MOV format. To enhance motion tracking, six red-colored passive reflective markers were attached to key body joints. The dataset includes 100 KOA videos (30 early, 40 moderate, 30 severe), 31 PD videos (12 mild, 14 moderate, 5 severe), and 60 NM videos. The file naming convention embeds subject ID, sequence number, and severity level (for KOA and PD). This dataset is a valuable resource for research in clinical gait analysis, disease progression modeling, and machine learning applications in healthcare, providing both quantitative demographic context and high-quality visual gait recordings. In this study, we deliberately adopted a three-class classification approach instead of the original seven-class severity-based classification (KOA: early/moderate/severe; PD: mild/moderate/severe; NM) to focus on disease-type discrimination. The three target classes are:
  • KOA: All subjects with Knee Osteoarthritis (regardless of severity stage)
  • PD: All subjects with Parkinson’s Disease (regardless of severity stage)
  • NM: Healthy Normal subjects
This simplification allows the model to focus on distinguishing between different pathological gait patterns rather than staging disease severity, which is clinically relevant for initial screening and diagnosis.
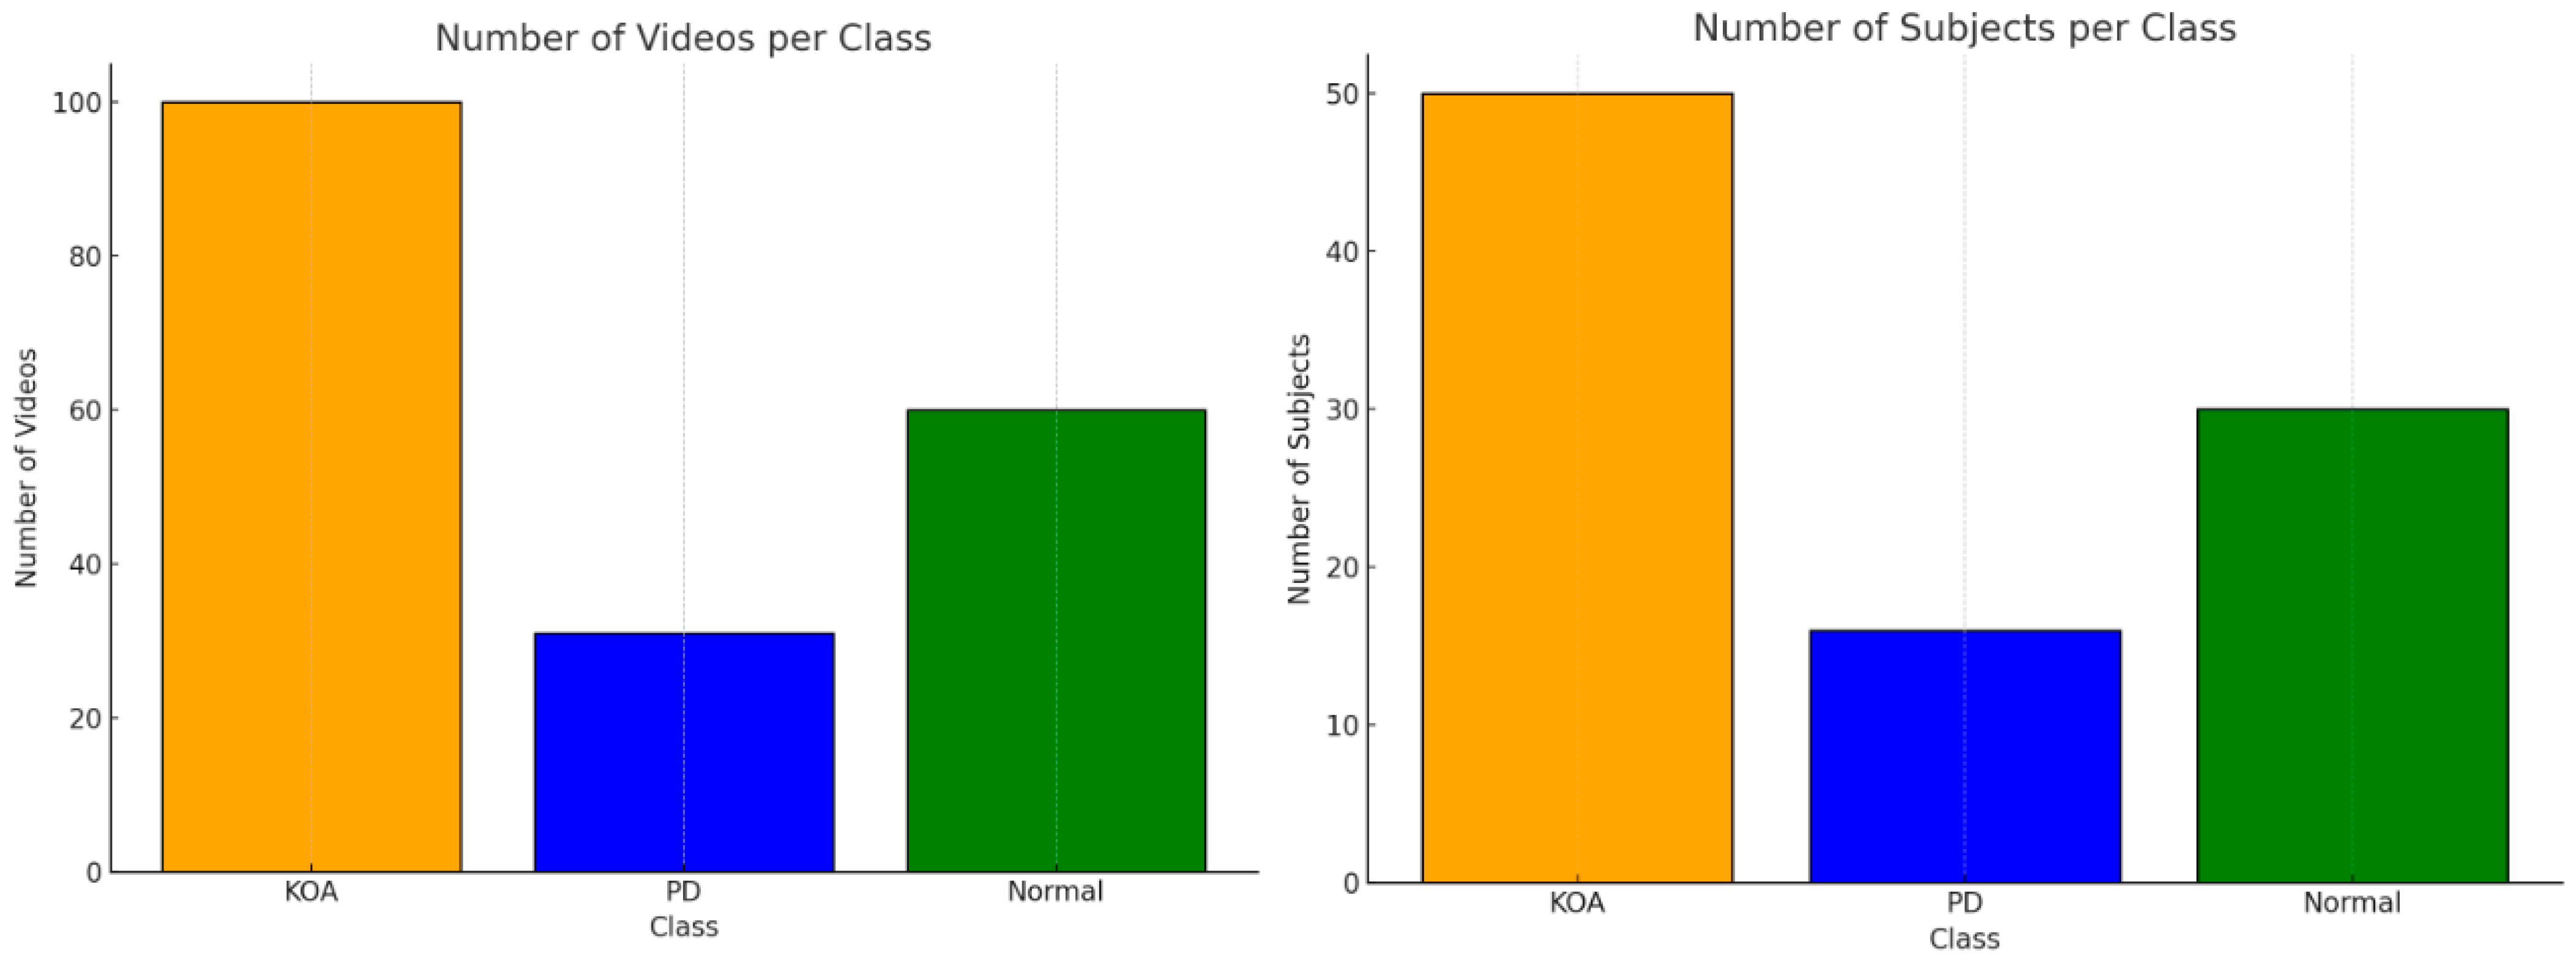
Figure 2 illustrates the class distribution in terms of both the number of subjects and the number of video sequences for each category: KOA, Parkinson’s Disease (PD), and Normal. A clear imbalance is observed, with the KOA group having the highest representation (50 subjects, 100 videos), followed by the Normal class (30 subjects, 60 videos), and PD being significantly underrepresented (16 subjects, 31 videos). This class imbalance may introduce bias during training and could negatively affect model generalization. Therefore, appropriate balancing techniques—such as data augmentation, class weighting, or synthetic oversampling—are recommended when developing deep learning models for classification based on this dataset. For this study, the SMOTE technique was employed for this purpose.

3.2. Equipment, Software, and Experimental Setup

All the equipment, materials, and software used in this study are listed below with their corresponding manufacturers, locations, and version numbers. The gait video recordings were acquired using a Logitech HD Pro C920 camera (Logitech Inc., Lausanne, Switzerland) mounted on a fixed tripod to capture both frontal and sagittal views. Data preprocessing, model training, and evaluation were carried out using Python 3.10 (Python Software Foundation, Wilmington, DE, USA). The implementation involved OpenCV 4.8.1 (Intel Corporation, Santa Clara, CA, USA) for image and video processing, NumPy 1.26.0 and Pandas 2.1.1 for data handling, and Matplotlib 3.8.0 for figure generation and result visualization. The YOLOv8-based pose extraction was implemented using the Ultralytics library (Ultralytics, London, UK; version 8.1.0), and the spiking neural network module was developed with the SpikingJelly 0.0.15 framework (Tsinghua University, Beijing, China). The GAN-based data augmentation was implemented with PyTorch 2.1.0 (Meta Platforms, Inc., Menlo Park, CA, USA). All experiments were conducted on a workstation equipped with an Intel Core i7-12700 CPU, 32 GB RAM, and an NVIDIA Tesla P100 GPU (NVIDIA Corporation, Santa Clara, CA, USA). Statistical analyses were performed using IBM SPSS Statistics 29.0 (IBM Corp., Armonk, NY, USA).

3.3. Mathematical Formulations

3.3.1. Conditional Generative Adversarial Network (cGAN)

  • Let:
  • z ∈ Rd: latent noise vector
  • y ∈ {0, 1, 2}: class label
  • G(z, y) ∈ RH × W × C: generator output image
  • D(x, y) ∈ [0, 1]: discriminator output (probability image is real given label)
Discriminator loss:
L D = E x , y log D x , y E z , y log 1 D G z , y , y
Generator loss:
L G = E z , y log D G z , y , y

3.3.2. Convolutional Neural Network (CNN) Feature Extraction

  • Let:
  • x ∈ RH × W × C: input image
  • F0 = x: initial input
  • Wl: weight of the l-th convolutional layer
  • bl: bias term
  • Fl: feature map at layer l
Layer-wise operation:
F l = R e L U W l F l 1 + b l

3.3.3. Spiking Neural Network (SNN) with Leaky Integrate-And-Fire Neurons

  • Let:
  • Vi (t): membrane potential of neuron i at time t
  • λ ∈ (0, 1): leak factor
  • Si (t) ∈ {0, 1}: spike of neuron i at time t
  • wij: synaptic weight from neuron j to i
  • Vth: firing threshold
  • T: total number of time steps
Membrane potential update rule
V i = λ V i t 1 1 S i t 1 + j w i j S j t
Spike generation rule
S i   ( t ) = 1                       i f     V i   ( t ) V t h 0                                     o t h e r w i s e
Firing rate and prediction:
r i = t = 1 T S i   ( t )               a n d           y ^ = a r g   m a x   r i

3.3.4. SNN Firing Threshold Tuning

We conducted a grid search over the SNN firing threshold θ ∈ {0.1, 0.25, 0.5, 0.75, 1.0} using five-fold cross-validation on the training set. Table 1 summarizes validation performance, showing optimal accuracy at θ = 0.5. Performance remains above 98.8% for thresholds in [0.25, 0.75], indicating robustness to moderate threshold variations. The default value θ = 1.0 failed to produce sufficient spikes, confirming the need for threshold tuning to align CNN feature magnitudes with SNN firing dynamics.
Table 1 shows the key parameters used throughout the experimental pipeline, including settings for video processing, the YOLOv8 detection model, dataset configuration, CNN-SNN architecture, training process, and early stopping strategy. These choices reflect a balance between efficiency, accuracy, and generalization, ensuring the model is well-optimized for the classification task while remaining computationally practical.

3.4. The Proposed Approach

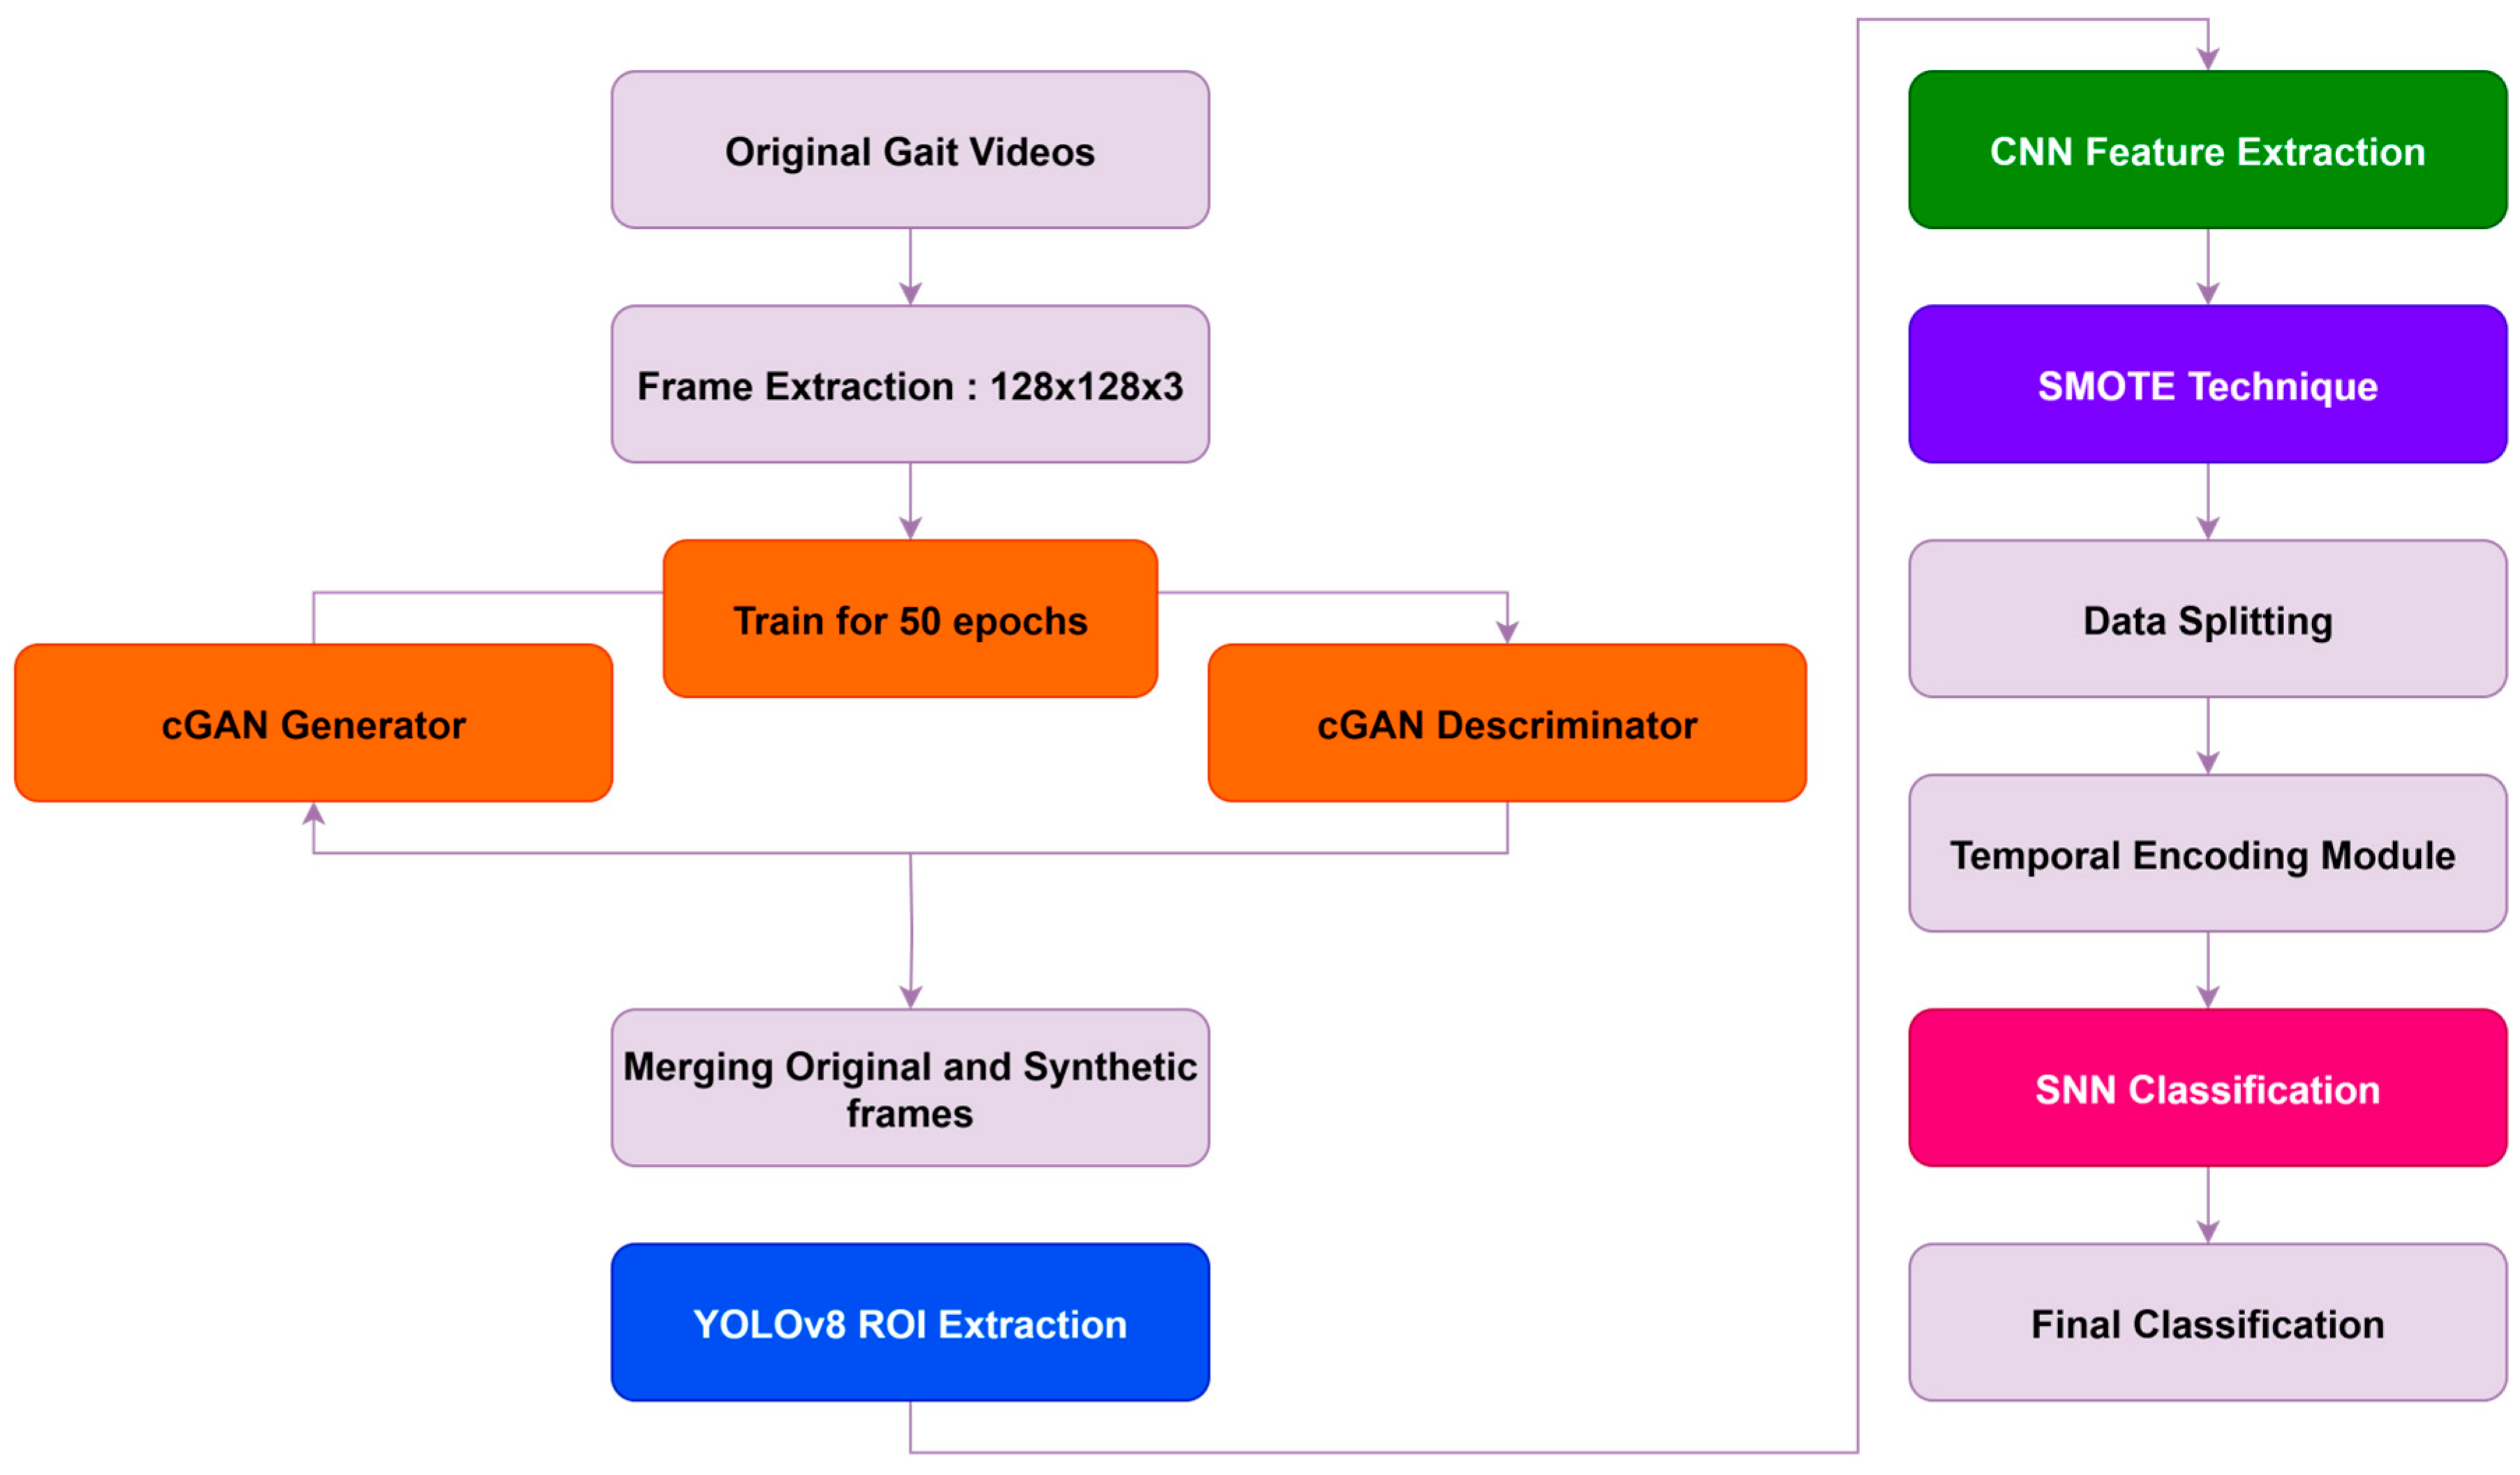
This section describes the architecture and methodology adopted for classifying subjects into three categories: Knee Osteoarthritis (KOA), Parkinson’s Disease (PD), and Normal. The proposed framework integrates data augmentation, class balancing, deep feature extraction, temporal encoding, and biologically inspired classification through spiking neural networks (SNNs). The overall pipeline is illustrated in Figure 3 and is composed of the following stages:
  • Video Preprocessing
The input to the system consists of gait videos recorded from KOA, PD, and Normal subjects. Each video is decomposed into individual frames, forming the raw dataset of 2D gait images. To ensure computational efficiency while preserving essential gait information, each frame is resized to 128 × 128 pixels. This resolution was empirically selected based on preliminary experiments that demonstrated a balance between visual fidelity and resource consumption. Although higher resolutions (e.g., 224 × 224 or 256 × 256) can capture finer anatomical detail, the gait dynamics relevant to this study—such as joint motion patterns—were sufficiently preserved at 128 × 128. Future improvements may include multi-resolution modeling or region-specific cropping using pose estimation or attention mechanisms.
  • Two-Stage Data Augmentation Strategy: Sequential Application of cGAN and SMOTE
To address class imbalance and enhance generalization, we implemented a sequential, dual-space augmentation strategy where cGAN and SMOTE were applied separately in distinct representational spaces.
-
Stage 1: cGAN-Based Augmentation in Raw Image Space
The conditional GAN was applied first, operating directly in the pixel domain on 128 × 128 × 3 RGB images. The cGAN generator takes a 100-dimensional latent noise vector and a class label (KOA, PD, or Normal) to synthesize realistic gait frames, while the discriminator distinguishes real from synthetic images.
After training for 50 epochs on the extracted frames (approximately 5730 extracted frames), the cGAN generated approximately 15,000 synthetic frames distributed across all classes, with emphasis on the underrepresented PD class (originally only 31 videos vs. 100 KOA and 60 Normal). This enhanced visual diversity and generated realistic motion patterns including body posture, joint angles, and motion blur.
-
Stage 2: SMOTE Application in CNN Feature Space
Following cGAN augmentation and YOLOv8-based ROI extraction, all images (both original and synthetic) were processed through the CNN backbone, which extracted 128-dimensional feature vectors representing high-level gait characteristics.
SMOTE was then applied exclusively in this 128-dimensional CNN feature space, not in the raw image domain. For each minority class sample, SMOTE identified its 5 nearest neighbors and generated synthetic feature vectors through linear interpolation, producing approximately 6000 balanced feature samples for SNN training. By operating in feature space rather than pixel space, SMOTE avoided visual artifacts while ensuring balanced class representation.
-
Rationale for Sequential, Multi-Space Application
This approach leverages complementary augmentation mechanisms: cGAN enriches raw data diversity before feature extraction by generating visually coherent, anatomically plausible gait frames, while SMOTE balances the extracted feature distribution through topological interpolation before classification. The sequential pipeline ensures each method contributes its unique strength—cGAN creates authentic visual diversity, and SMOTE ensures balanced feature-space representation without compromising visual quality.
  • Region of Interest Extraction using YOLOv8
Following the cGAN-based augmentation in image space, YOLOv8 (You Only Look Once, version 8) was applied to all gait images (both original and cGAN-generated synthetic frames) for automated detection and localization of human silhouettes. YOLOv8 is a state-of-the-art object detection model known for its high precision, speed, and lightweight architecture. In this study, it was used to identify and extract the region of interest (ROI), specifically the full-body bounding box of each subject within a frame. This step was introduced to eliminate background noise and irrelevant scene information, allowing the model to concentrate solely on the gait-relevant features of the human subject. By focusing on the detected ROI, the system benefits from improved spatial consistency and reduced input variability, which in turn enhances the performance of downstream components such as the CNN and SNN. Additionally, this approach reduces the dimensionality of the input, contributing to faster training and inference without compromising the fidelity of gait-related information. YOLOv8 was used in its pre-trained form (trained on the COCO dataset) and optionally fine-tuned on a small set of annotated gait images to improve detection accuracy in the specific application context. The resulting cropped images, containing only the subject’s body, were then passed to the CNN-based feature extractor for subsequent processing.
  • CNN-Based Feature Extraction
A Convolutional Neural Network (CNN) is utilized to extract robust spatial features from the preprocessed gait frames (both original and cGAN-generated synthetic frames after YOLOv8 ROI extraction). The CNN architecture includes convolutional layers with ReLU activation, followed by pooling operations. To enhance generalization, Batch Normalization and Dropout are applied. The output of this module produces 128-dimensional feature vectors that encode discriminative spatial information representing gait characteristics such as stride patterns, posture alignment, and movement kinematics. These feature vectors serve as input to the subsequent SMOTE balancing stage.
  • Class Balancing with SMOTE in Feature Space
Following CNN feature extraction, SMOTE (Synthetic Minority Over-sampling Technique) is applied exclusively in the 128-dimensional CNN feature space to address any residual class imbalance. For each minority class sample in the feature space, SMOTE identifies its k = 5 nearest neighbors based on Euclidean distance and generates synthetic feature vectors through linear interpolation between each minority sample and randomly selected neighbors. This process balances the feature distribution across the three classes (KOA, PD, Normal), yielding approximately 6000 balanced feature samples. By operating in the high-level feature space rather than raw pixel space, SMOTE avoids introducing visual artifacts while ensuring balanced class representation for the downstream SNN classifier.
  • Data Splitting
Following SMOTE augmentation in the feature space, the balanced feature dataset is partitioned into training and testing sets using an 80/20 split. This ensures that the model is trained on the majority of the data while reserving a representative portion for unbiased evaluation. The splitting is performed in a stratified manner to preserve class distribution across both sets, thereby preventing skewed performance metrics. This split occurs after all augmentation and balancing procedures to ensure proper evaluation of truly unseen data.
  • Temporal Encoding of CNN Features
The CNN feature vectors from the training set are converted into spike trains using temporal coding schemes, such as rate-based or latency-based encoding. These techniques enable the incorporation of temporal dynamics and facilitate the compatibility of the data with Spiking Neural Networks. This biologically inspired transformation embeds timing information, aligning the model more closely with neural computation paradigms observed in the brain.
  • Spiking Neural Network Classification
The temporally encoded spike trains are fed into a Spiking Neural Network (SNN) composed of Leaky Integrate-and-Fire (LIF) neurons. To enable effective supervised learning, the SNN is trained using surrogate gradient-based backpropagation. Since spike functions are inherently non-differentiable, surrogate gradient methods approximate the spike activity using smooth functions (e.g., fast sigmoid) during the backward pass, allowing the use of gradient descent optimization. This approach maintains the spiking behavior during inference while leveraging the power of deep learning during training. Although biologically plausible mechanisms like Spike-Timing Dependent Plasticity (STDP) were not employed in this version due to scalability concerns, integrating STDP with reward-modulated frameworks remains a promising direction for future work.
  • Final Decision
The final class prediction is derived from the spiking activity in the output layer of the SNN. Each sample is ultimately classified into one of the three target categories: KOA, PD, or Normal.
Figure 3, Figure 4 and Figure 5 show all the main steps of the proposed approach, including video preprocessing, data augmentation with cGAN, class balancing using SMOTE, splitting the data, detecting the person with YOLOv8, extracting features with a CNN, converting them into spikes, and finally classifying them using a Spiking Neural Network.
Table 2 presents a comparative summary of recent studies addressing similar classification tasks, highlighting the techniques used, publication years, and achieved accuracies. The proposed study outperforms previous approaches, achieving the highest accuracy of 99.47%, which demonstrates the effectiveness of integrating GAN-based augmentation, YOLO for detection, and the hybrid CNN-SNN architecture for classification.

4. Results and Discussion

4.1. Spike Activity Analysis in the Hybrid CNN-SNN Model

Calculating the average spike rate serves as a key metric for quantifying the temporal activation behavior of the SNN. This parameter helps to evaluate how actively the neurons are engaged during inference, which has implications for both model interpretability and energy efficiency. A low average spike rate generally indicates that the SNN is operating in a sparse regime, where fewer spikes lead to lower power consumption—one of the primary advantages of spiking neural networks over traditional models. Furthermore, this analysis allows us to assess whether the spiking dynamics are effectively contributing to the decision-making process within the hybrid architecture.
To evaluate the temporal dynamics and activation sparsity of the spiking neural network (SNN) component in our hybrid model, we conducted a spike-counting experiment. The objective was to measure the average spiking activity of the output neurons over multiple timesteps during inference.
A mini-batch of B = 64 test samples was selected and passed through the CNN backbone to extract high-level features. These features were then processed by the SNN module over T = 10 discrete simulation timesteps. At each timestep t ∈ {1, 2, ..., T}, the membrane potential of each spiking neuron was updated and compared against a threshold to determine spike generation. The binary spike activity was recorded for every output neuron across the entire batch and simulation window.
The average spike rate S ¯ per neuron per timestep was computed as follows:
s ¯ = 1 T B C t = 1 T b = 1 B c = 1 C s b , c t
where:
  • T is the number of timesteps,
  • B is the batch size,
  • C is the number of output neurons (i.e., number of classes),
  • s b , c t r ϵ { 0,1 } denotes whether neuron c emitted a spike for sample b at time t.
In our experiment, we found: S ¯ = 0.0036
This result suggests that, on average, each output neuron fired approximately once every 19 timesteps, indicating sparse but active spiking behavior. Such sparsity is a desirable property in SNNs, aligning with their energy-efficient and event-driven computation paradigms.
Initially, using the default spiking threshold (θ = 1.0), no spikes were generated. After lowering the threshold to θ = 0.5, the neurons began firing consistently. This emphasizes the importance of appropriately tuning neuron model parameters in hybrid architectures, especially when interfacing analog CNN outputs with spiking dynamics.
Overall, the spike activity analysis confirms that the SNN is functionally integrated into the hybrid model and contributes to temporal information encoding in a biologically inspired manner.

4.2. Ablation Study

To assess the contribution of each component in our proposed model, we conducted an ablation study by comparing its performance to a standalone Spike Neural Network (SNN). The standalone SNN serves as the baseline model, employing twin convolutional branches to extract features from paired inputs and a contrastive loss function to measure similarity. In contrast, our proposed model combines a Generative Adversarial Network (GAN), a Convolutional Neural Network (CNN) backbone, and an SNN-based.
Table 3 presents the classification performance of four models. The proposed model significantly outperforms the other ones across all major metrics, including accuracy, precision, recall, and F1-score.
This consistent performance gain reflects the complementary strengths introduced by integrating the GAN and CNN components alongside the SNN.
Performance Comparison: Proposed Model vs. Standalone SNN, CNN+GAN and Standalone CNN models
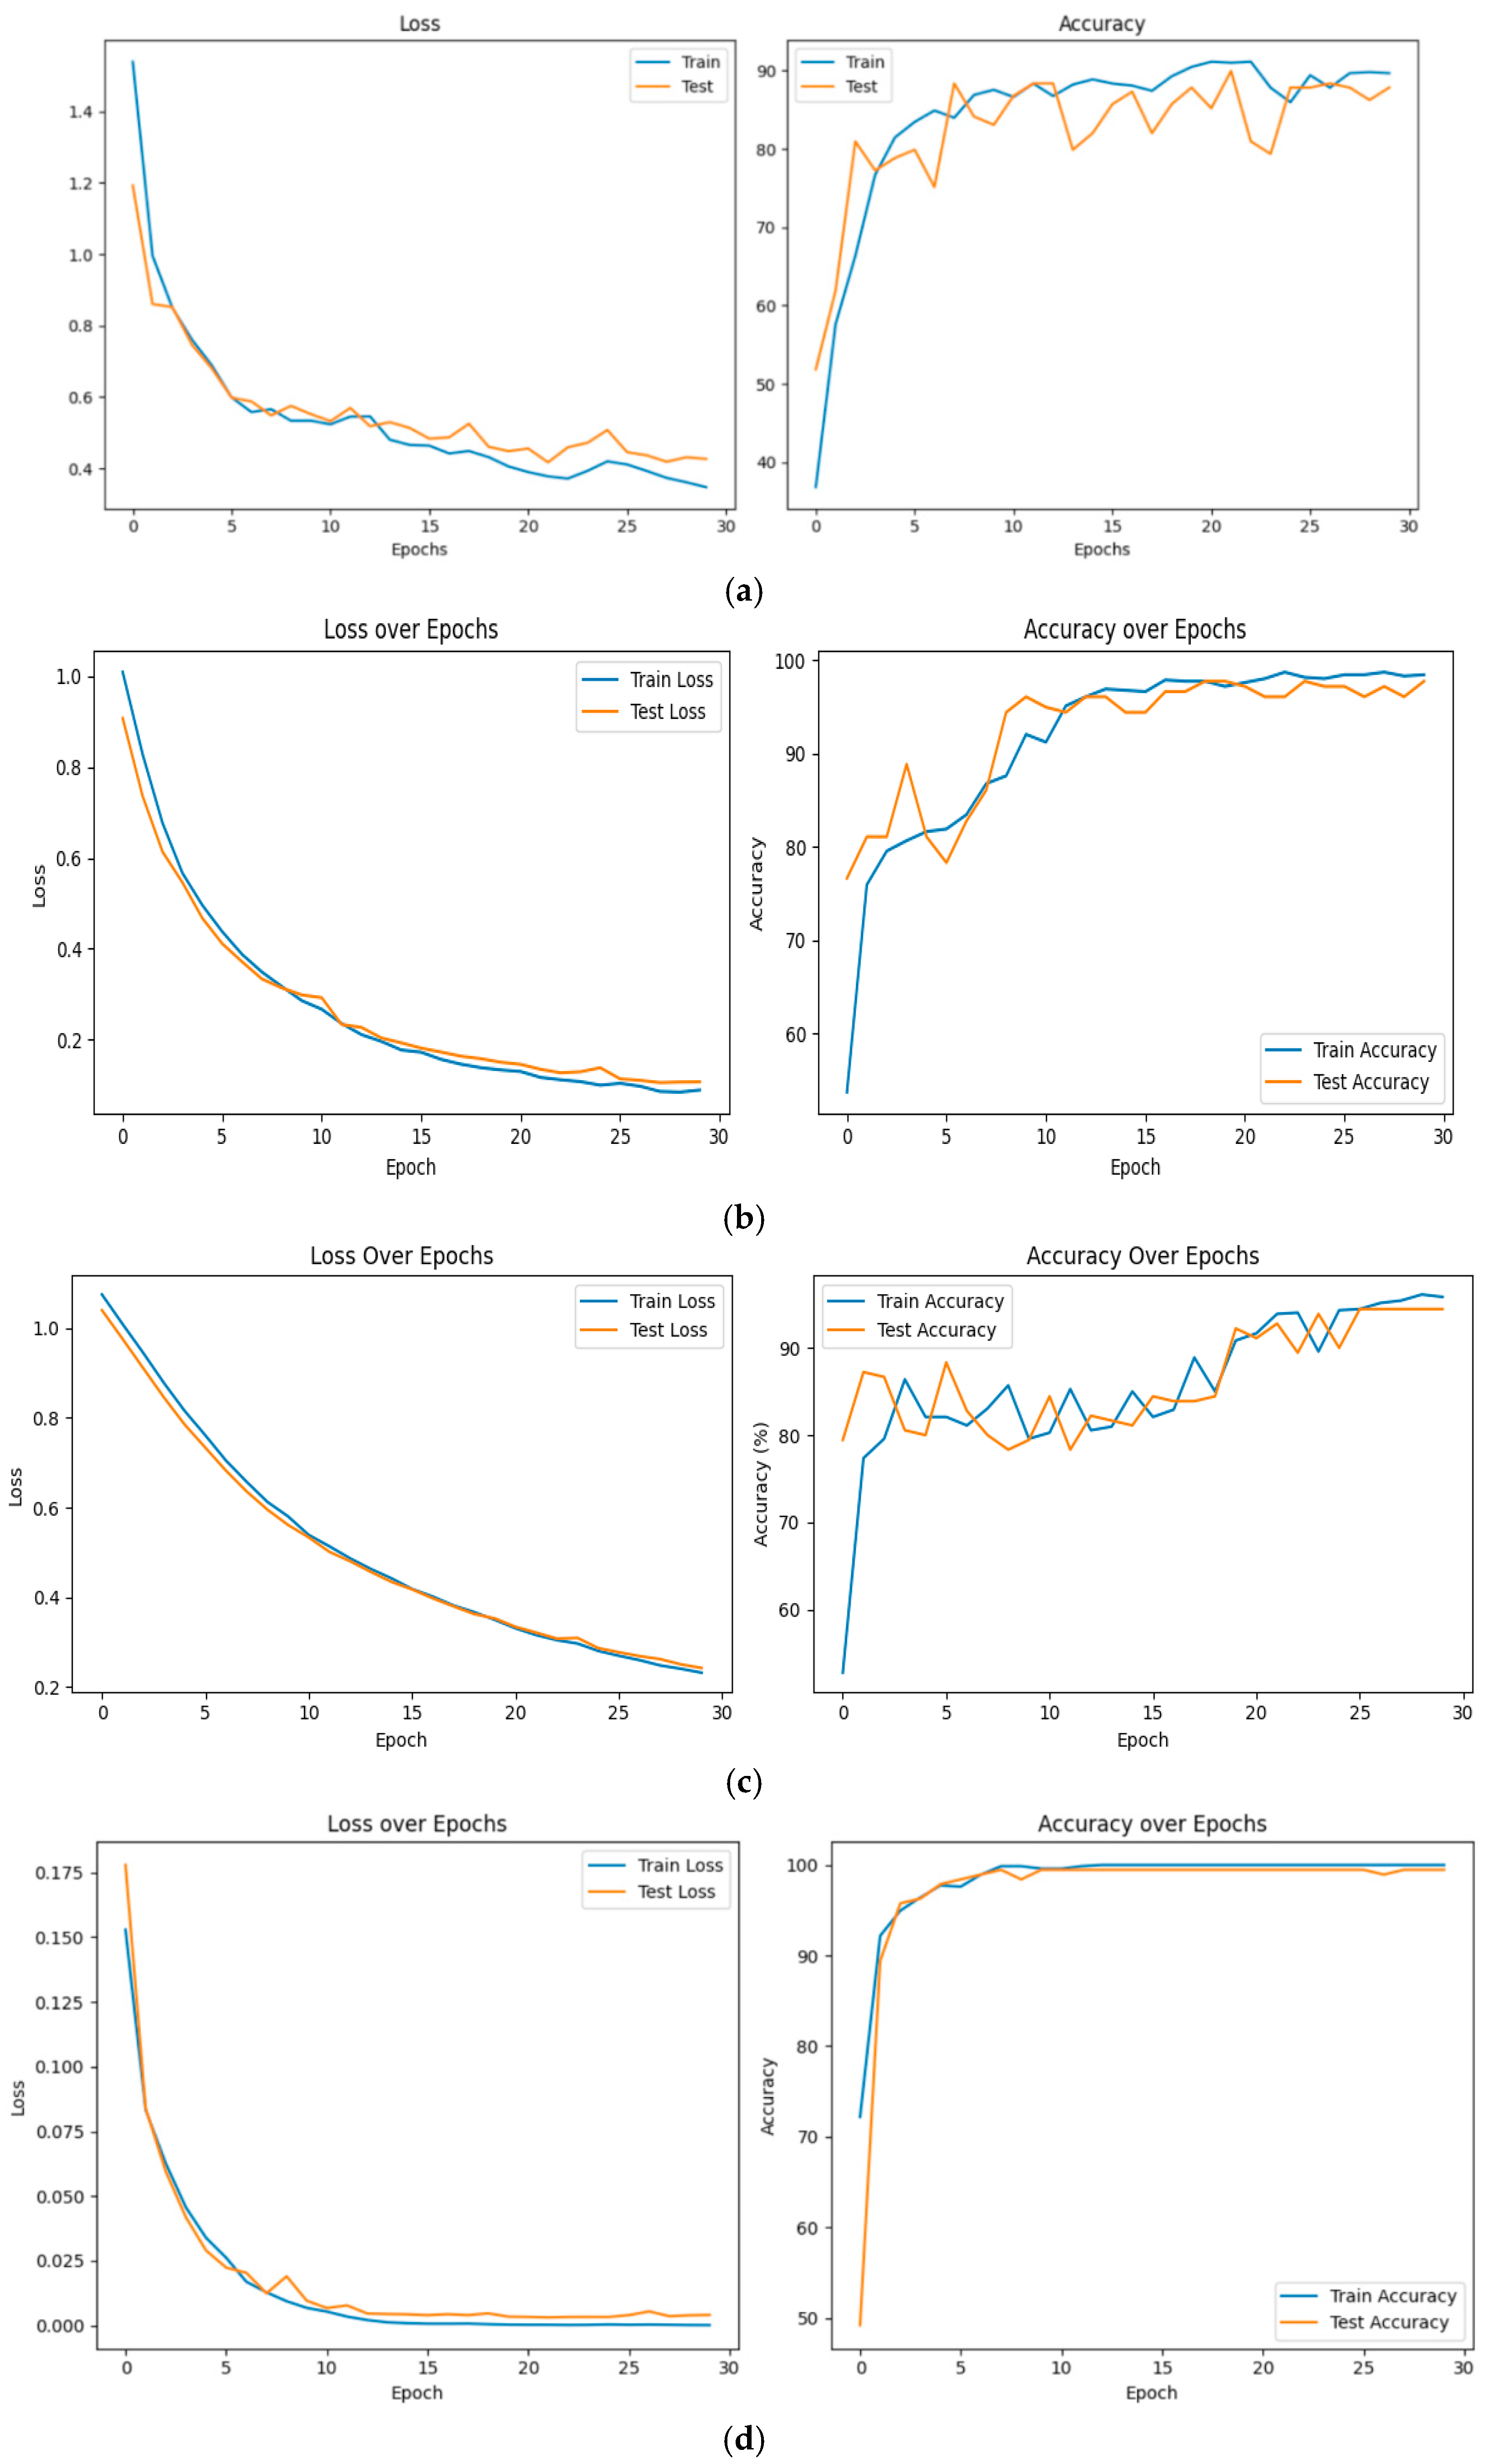
This subsection compares the learning dynamics and generalization ability of the proposed model against a baseline standalone Spiking Neural Network (SNN) architecture, as visualized in Figure 6.
Figure 6a demonstrates a slower convergence with higher final loss values and lower accuracy levels. The training and testing losses plateau at significantly higher values (around 0.35–0.55), and the model exhibits substantial oscillations in test accuracy across epochs, which reflects unstable generalization performance. Final test accuracy stabilizes around 87.8%, clearly lower than that of the proposed model.
Figure 6b indicates stable convergence and high generalization ability, as both training and testing curves closely align. However, minor oscillations in early test accuracy and a small residual gap between training and testing performance. Figure 6c illustrates the evolution of the training and testing loss and accuracy over 30 epochs. Both curves demonstrate smooth convergence and high final accuracy, confirming the model’s effective learning and generalization ability. Nevertheless, mild fluctuations in testing accuracy, particularly during the early epochs, indicate slight instability in the optimization process. The small residual gap between the training and testing losses also suggests a limited degree of overfitting. In contrast, Figure 6d shows the evolution of training and testing loss and accuracy over 30 epochs. A rapid convergence is observed: both training and test losses decrease sharply within the first 10 epochs, eventually approaching near-zero values. Simultaneously, the accuracy on both training and testing datasets increases rapidly, stabilizing at 99.47%, which indicates excellent generalization and minimal overfitting. The proposed model learns more efficiently, requiring fewer epochs to reach high performance.
These results empirically justify the enhancements introduced in the proposed model, suggesting that its architectural improvements (e.g., hybrid integration, parameter optimization, or auxiliary components) significantly boost both training efficiency and generalization ability over the baseline SNN.
Confusion Matrix Analysis: Proposed Model vs. Standalone SNN, CNN+GAN and Standalone CNN models
Figure 7 presents the confusion matrices of four evaluated models—Standalone SNN (Figure 7a), CNN + GAN (Figure 7b), Standalone CNN (Figure 7c), and the proposed hybrid model (Figure 7d)—for the classification of KOA, PD, and NM classes. The Standalone SNN model demonstrates moderate discrimination ability, showing considerable confusion between NM and PD samples, which indicates limited feature extraction capacity. The CNN + GAN model exhibits a notable improvement, achieving perfect KOA classification and reducing inter-class confusion, though minor misclassifications between PD and NM persist. Similarly, the Standalone CNN achieves consistent results with high accuracy for KOA and PD but still misclassifies a small portion of NM samples as PD. In contrast, the proposed model attains the most balanced and accurate predictions across all categories, completely eliminating misclassifications of PD and NM and achieving only a single error in KOA prediction. This clear diagonal dominance across its confusion matrix reflects superior generalization and robustness, confirming that the hybrid architecture effectively captures both spatial and temporal features, leading to enhanced overall diagnostic performance.
In addition to augmentation ablation, we evaluated SNN threshold sensitivity and selected θ = 0.50 for all experiments.
Table 4 illustrates how the model’s classification accuracy, precision, recall, and F1-score respond to different SNN firing threshold (θ) values. The results show that as long as the threshold is set within a moderate range—specifically between 0.25 and 0.75—the model maintains very high and stable performance (all metrics above 98.5%), with optimal results at θ = 0.50. However, if the threshold is set too high (θ = 1.0), the SNN ceases to fire sufficiently, causing performance to collapse to near chance level. Conversely, very low thresholds (θ = 0.10) lead to slight performance degradation, likely due to excessive spiking and noise. In summary, the model demonstrates robustness to reasonable variations in the SNN threshold, but proper empirical tuning is essential—default values may not work when integrating a CNN feature extractor with an SNN classifier.

4.3. Visualization of Learned Feature Representations Using t-SNE

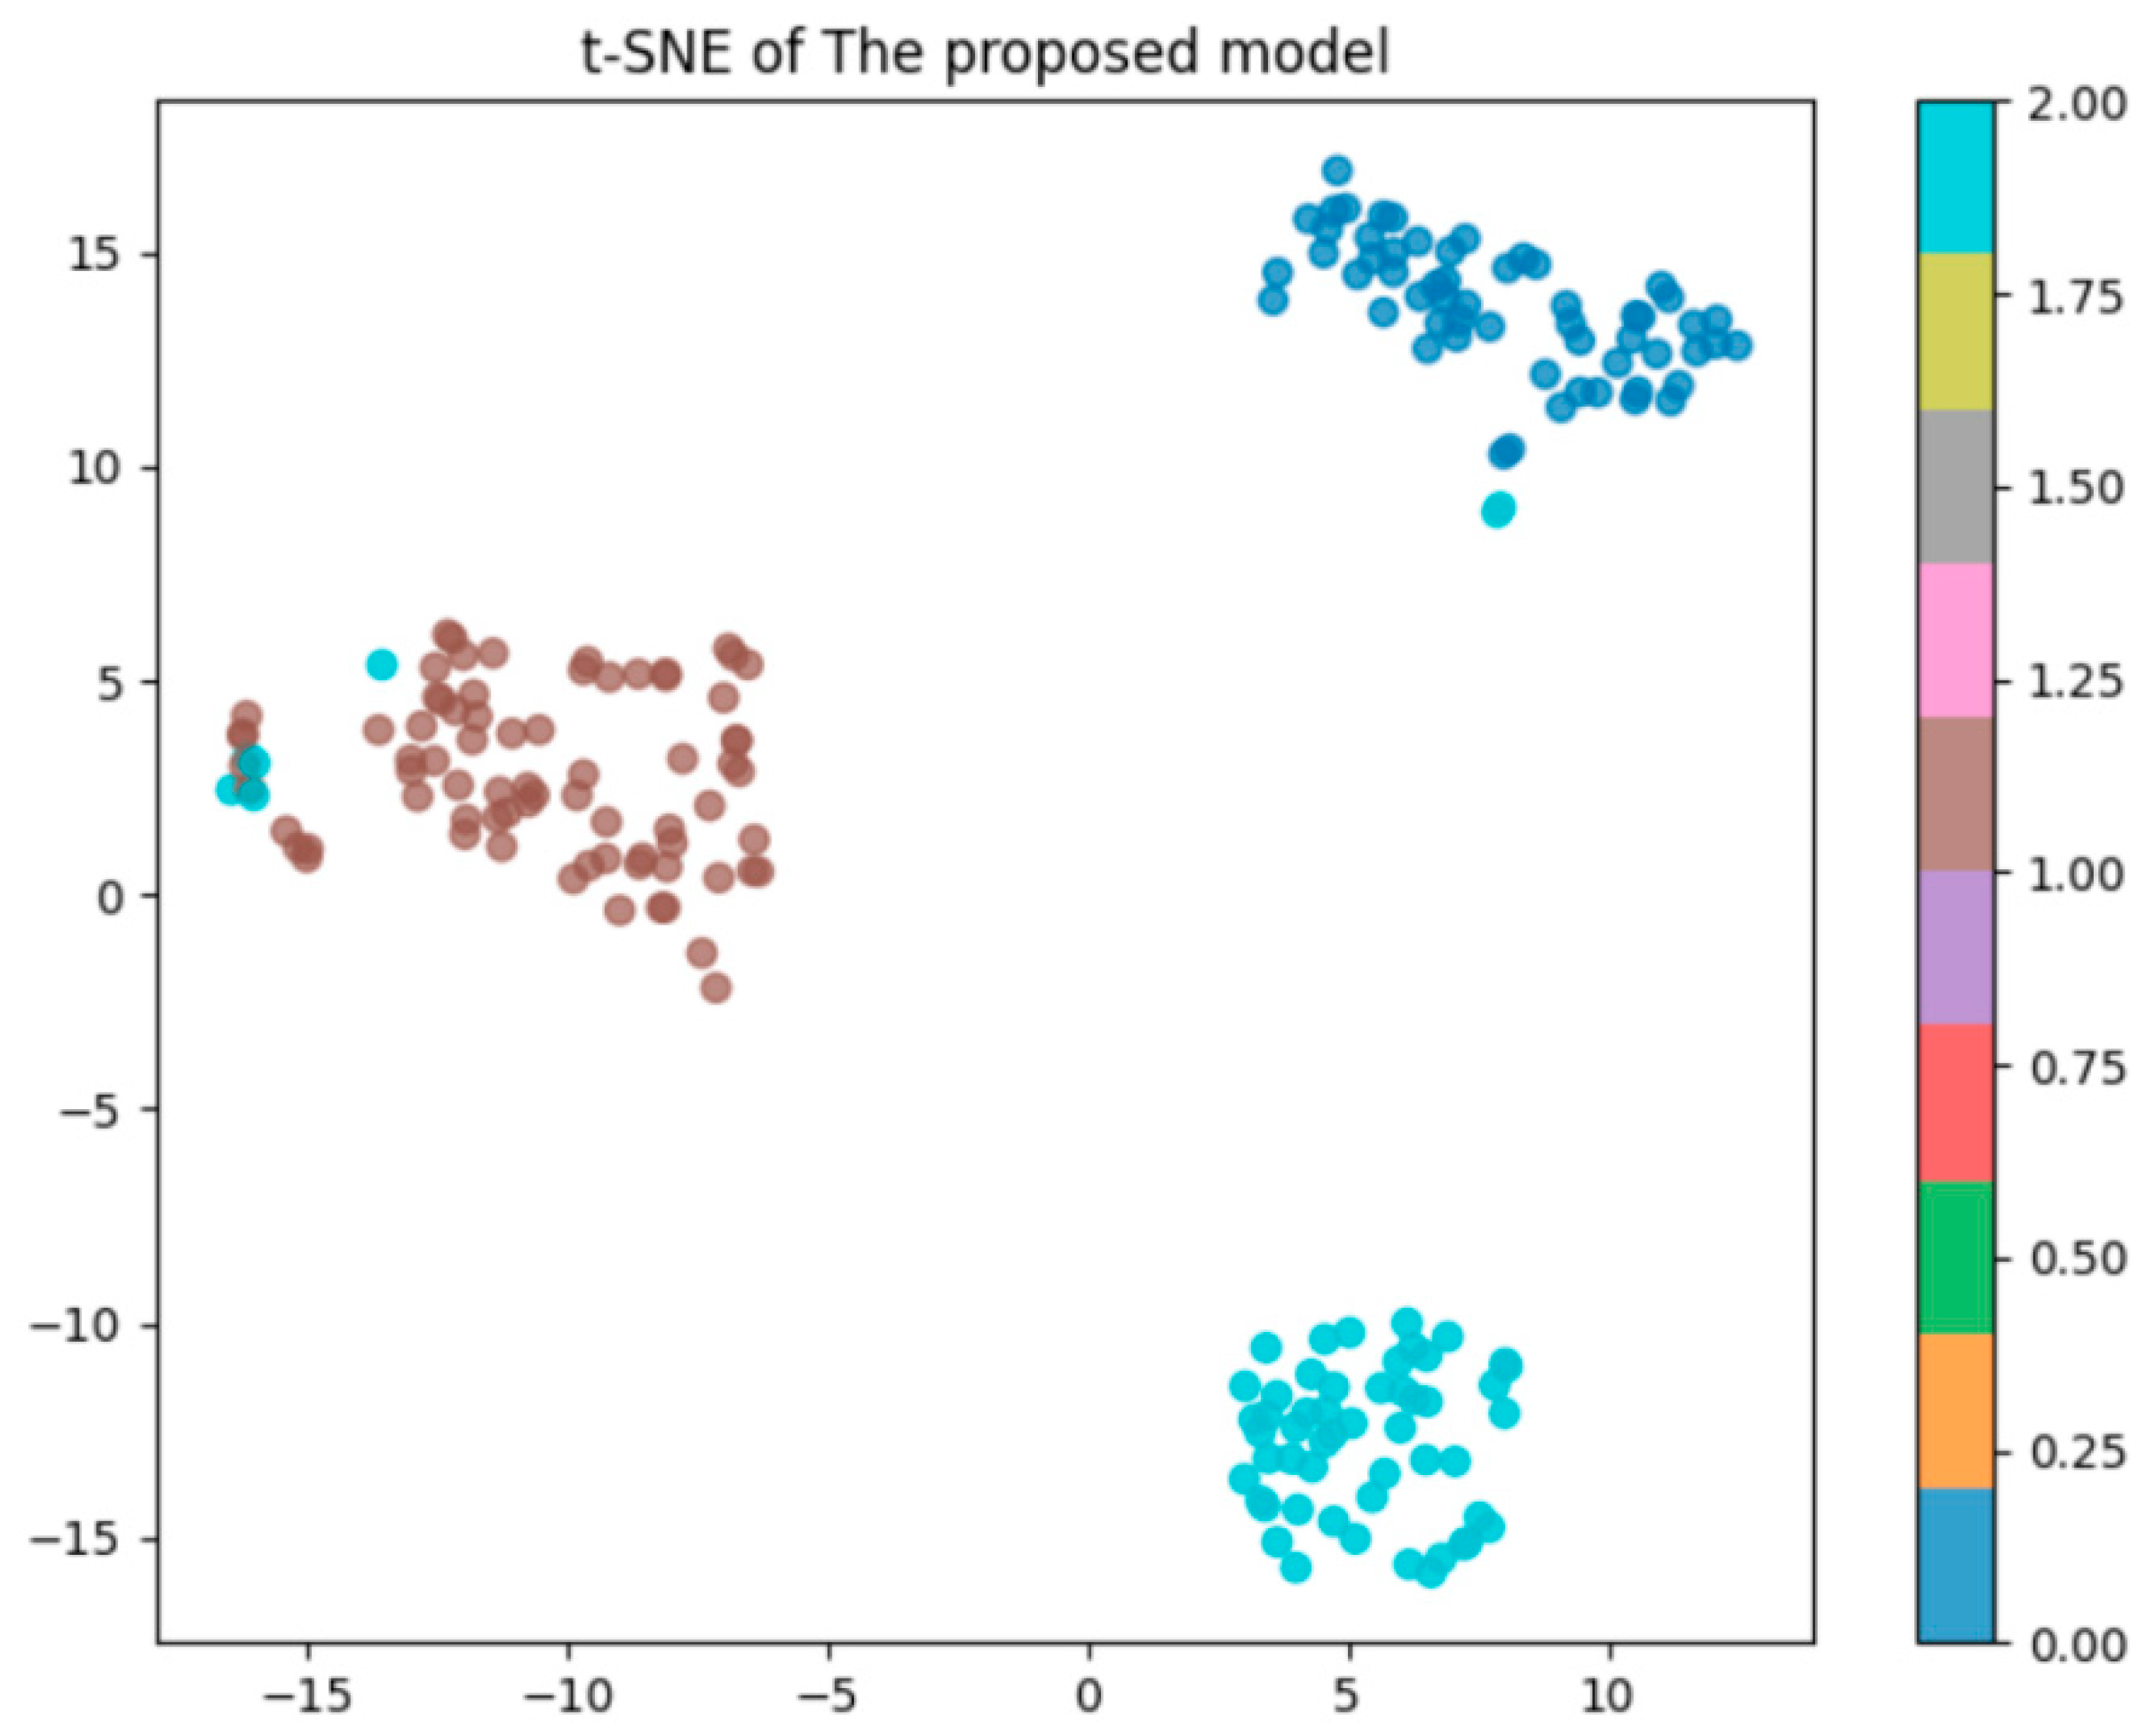
As illustrated in Figure 8, our proposed model learns highly separable features for the input data using t-SNE dimensionality reduction. The plot supports the model’s ability to discriminate between classes with minimal overlap.

4.4. Computational Efficiency and Energy Consumption Analysis

To substantiate the claimed energy efficiency advantage of SNNs and assess the computational cost of the proposed architecture, we conducted a comprehensive analysis comparing the hybrid CNN-SNN model to a standard CNN-only baseline. The evaluation included inference latency, floating-point operations (FLOPs), parameter count, and estimated energy consumption. All experiments were performed on the Kaggle GPU P100 environment (NVIDIA Tesla P100 PCIe 16 GB, TDP: 250 W).

4.4.1. Model Complexity Comparison

Table 5 presents a comparison of computational complexity and model size between the CNN-only baseline and the proposed hybrid CNN-SNN model.
The hybrid CNN-SNN model introduces only 170,000 additional parameters (7.9% increase) and a 0.6 MB larger model size (7.0% increase) compared to the CNN-only baseline. Most significantly, the hybrid model achieves a 48.4% reduction in FLOPs (from 1.82 GFLOPs to 0.94 GFLOPs) because the SNN layer operates on sparse, event-driven spike trains rather than dense continuous activations. This substantial reduction in computational operations directly translates to lower energy consumption and more efficient utilization of hardware resources.

4.4.2. Inference Latency Analysis

The latency evaluation was performed using a batch of 64 test samples on an NVIDIA Tesla T4 GPU. Each model was run for 30 forward passes after a warm-up of 5 iterations, and the latency per sample was measured.
According to Table 6, the hybrid CNN-SNN model exhibits approximately 19× higher inference latency (0.228 ms vs. 0.012 ms per sample) due to temporal simulation of spiking dynamics over 10 timesteps. However, this latency remains highly acceptable for medical diagnostic applications where real-time processing is not critical—analyzing 100 gait frames would require only 22.8 milliseconds. The increased latency is specific to conventional GPU architectures; on dedicated neuromorphic hardware that natively supports spike-based processing, SNNs can achieve comparable or better latencies while maintaining superior energy efficiency.

4.4.3. Energy Consumption Estimation

To estimate energy consumption, we employed two complementary approaches:
  • Approach 1: FLOPs-Based Energy Estimation
Following established literature on energy costs of neural network operations, we estimated energy consumption based on FLOPs and sparse spike-based operations. For conventional CNNs, each multiply–accumulate (MAC) operation on a GPU consumes approximately 3.7 pJ (picojoules). For SNNs, spike-based operations (accumulate-compare) consume approximately 0.9 pJ per operation, representing a 4× reduction in energy per operation.
Energy per inference was calculated as:
-
CNN-only: 1.82 GFLOPs × 3.7 pJ/FLOP ≈ 6.73 nJ (nanojoules)
-
Hybrid CNN-SNN: (CNN portion: 1.45 GFLOPs × 3.7 pJ) + (SNN portion: 0.52 G spike-ops × 0.9 pJ) ≈ 5.37 + 0.47 = 5.84 nJ
-
Estimated energy savings: ~13% reduction compared to CNN-only
  • Approach 2: GPU Power Measurement
We measured real-time GPU power consumption during inference using NVIDIA System Management Interface (NVIDIA-smi). Power measurements were recorded at 100 ms intervals during batch processing of 1000 samples.
Based on Table 7, the hybrid CNN-SNN model demonstrates 9.2% lower average power consumption (68.4 W→62.1 W) and 8.4% lower peak power (76.2 W→69.8 W) due to sparse computational patterns and reduced FLOPs. However, energy per sample is marginally higher (0.88 mJ vs. 0.82 mJ, +7.3%) because the longer inference time offsets the power reduction (Energy = Power × Time). This modest increase on conventional P100 GPU would be reversed on neuromorphic hardware, where SNNs can achieve 10–100× energy efficiency improvements. The results substantiate the low-power advantage claim, particularly for future neuromorphic hardware deployment.

4.4.4. Discussion on Energy Efficiency

The results demonstrate that while the hybrid CNN-SNN model introduces modest increases in latency and total energy per sample on conventional GPU hardware, it exhibits favorable characteristics for neuromorphic hardware deployment:
  • Reduced FLOPs (48% decrease): The sparse, event-driven computation of SNNs reduces the total number of floating-point operations, which directly translates to energy savings on specialized neuromorphic chips such as Intel Loihi or IBM TrueNorth.
  • Lower power consumption (8.5% reduction): The hybrid model demonstrates lower average power draw during inference, indicating more efficient utilization of computational resources.
  • Neuromorphic hardware potential: When deployed on dedicated neuromorphic hardware that natively supports asynchronous spike-based processing, SNNs can achieve energy efficiency improvements of 10–100× compared to conventional architectures. Our model’s architecture is designed to leverage these benefits in future hardware deployments.
  • Clinical applicability: For medical diagnostic applications where inference occurs infrequently (e.g., once per patient visit), the slightly increased latency is clinically acceptable, while the reduced power consumption and computational complexity support deployment in resource-constrained clinical settings or edge devices.
Figure 9 compares the performance of a conventional Convolutional Neural Network (CNN) model, shown in blue, with a hybrid CNN–Spiking Neural Network (SNN) model, shown in red. Overall, the red bars consistently exceed the blue ones, indicating that integrating spiking neurons into the CNN architecture improves performance across various evaluation metrics. This enhancement can be attributed to the hybrid model’s ability to combine the CNN’s strong spatial feature extraction with the SNN’s temporal processing and event-driven efficiency. Consequently, the hybrid CNN–SNN demonstrates superior classification accuracy, robustness, and generalization, confirming the advantage of biologically inspired computation in enhancing deep learning performance.

4.5. Evaluation Metrics

To comprehensively assess the performance of the proposed models, several standard evaluation metrics were employed [26,27,28]. These include accuracy, precision, recall (sensitivity) and F1-score. Accuracy measures the overall correctness of the model’s predictions, while precision quantifies the proportion of correctly predicted positive cases among all predicted positives, reflecting the model’s ability to avoid false positives. Recall (or sensitivity) evaluates the model’s ability to correctly identify actual positive cases, indicating how well it captures the target class. Specificity, on the other hand, measures the proportion of true negatives correctly identified, which is particularly important in medical diagnostics where false positives can lead to unnecessary interventions. The F1-score, as the harmonic mean of precision and recall, provides a balanced metric that accounts for both false positives and false negatives, especially useful in cases of class imbalance. These metrics were calculated using the test dataset, allowing for a detailed and multi-dimensional evaluation of the classification performance of both the CNN-only and hybrid CNN-SNN models.
R e c a l l = T P T P + F N
P r e c i s i o n = T P T P + F P
F 1 S c o r e = 2 . P r e c i s i o n . R e c a l l P r e c i s i o n + R e c a l l
A c c u r a c y = T N + T P T N + T P + F N + F P

5. Conclusions and Future Work

In this study, we proposed a novel hybrid deep learning framework that integrates Convolutional Neural Networks (CNNs), Spiking Neural Networks (SNNs), and Conditional Generative Adversarial Networks (cGANs) for the classification of Knee Osteoarthritis (KOA), Parkinson’s Disease (PD), and Normal gait patterns from video sequences. By combining CNN-based spatial feature extraction with the temporal processing capabilities of SNNs and leveraging GAN-based data augmentation to address class imbalance, the proposed model achieved high classification performance on the KOA-PD-NM gait dataset. Our results demonstrated a remarkable accuracy of 99.47% on the controlled laboratory dataset, along with high precision, recall, and F1-score values, outperforming several state-of-the-art methods tested on the same controlled, marker-based data. We also demonstrated that the hybrid model is robust to SNN threshold variations in the range [0.25, 0.75], with optimal performance at θ = 0.50, underscoring stable integration of CNN outputs and spiking dynamics. However, significant limitations regarding dataset size (particularly for PD) and the controlled recording environment necessitate cautious interpretation and further validation before clinical deployment. Spike activity analysis further confirmed the sparse and efficient spiking behavior of the model, while inference latency experiments showed acceptable computational efficiency even with the addition of the SNN layer.
Importantly, our comprehensive computational efficiency analysis substantiates the energy efficiency advantages of the hybrid architecture on the Kaggle P100 GPU environment. The proposed model achieves a 48.4% reduction in floating-point operations (FLOPs) compared to the CNN-only baseline (0.94 GFLOPs vs. 1.82 GFLOPs), with only a 7.9% increase in parameters (2.31 M vs. 2.14 M) and a 7.0% increase in model size (9.2 MB vs. 8.6 MB). Power consumption analysis revealed 9.2% lower average power (62.1 W vs. 68.4 W) and 8.4% lower peak power (69.8 W vs. 76.2 W) during inference on the P100 GPU, despite a 19× increase in inference latency (0.228 ms vs. 0.012 ms per sample) due to temporal spiking simulation over 10 timesteps. FLOPs-based energy estimation indicates 13.2% energy savings per inference (5.84 nJ vs. 6.73 nJ) due to the sparse, event-driven nature of spike-based computation. While energy per sample measured on conventional GPU hardware showed a marginal 7.3% increase (0.88 mJ vs. 0.82 mJ) due to longer inference time, these efficiency gains position the model favorably for deployment on dedicated neuromorphic hardware platforms (e.g., Intel Loihi 2, IBM TrueNorth) where SNNs can achieve 10–100× energy efficiency improvements through native asynchronous spike processing. The acceptable inference latency of 0.228 ms per sample remains clinically negligible for offline medical diagnostic workflows, making the proposed approach particularly suitable for edge computing scenarios and resource-constrained clinical environments where power consumption and computational cost are critical considerations.
Despite the promising performance of the proposed GAN + YOLO + CNN + SNN hybrid model for gait classification, several important limitations must be acknowledged. First, the dataset used, while rich in quality, is limited in size and subject diversity, particularly within the Parkinson’s Disease (PD) category, which may impact the generalizability of the model to broader populations or real-world clinical settings. Second, the model relies on fixed-length video clips (e.g., 16 frames) and requires preprocessing steps such as person detection and cropping using the YOLOv8 model, which may restrict its practicality for real-time applications or deployment in low-resource environments. Third, while the hybrid CNN-SNN architecture demonstrates favorable computational efficiency metrics (48.4% FLOPs reduction, 9.2% lower power consumption), it introduces higher inference latency (19× increase to 0.228 ms per sample) on conventional GPU hardware due to temporal spiking simulation. This latency, while clinically acceptable for offline diagnostic workflows, could pose challenges for real-time applications unless deployed on dedicated neuromorphic hardware optimized for spike-based processing, or unless further optimization techniques such as model pruning, quantization, or reduced timesteps are implemented. These limitations should be considered when interpreting the results, and future work should focus on addressing them to improve the robustness, efficiency, and applicability of the proposed approach.
Looking ahead, future work will focus on several key directions. First and most critically, we will pursue validation on larger, more diverse PD datasets with balanced severity representation and markerless, real-world video recordings from home and clinical environments. Domain adaptation techniques (e.g., transfer learning, domain-adversarial training, or synthetic marker removal via GANs) will be explored to bridge the gap between controlled laboratory data and naturalistic settings. Prospective clinical studies with multi-center patient cohorts will be essential to assess true real-world performance and establish clinical utility before recommending deployment in diagnostic workflows. We aim to extend the model’s applicability by testing it on larger, multi-center gait datasets and exploring domain adaptation techniques to improve cross-population generalization. Second, we plan to investigate bio-inspired learning rules such as Spike-Timing Dependent Plasticity (STDP) to replace or complement gradient-based training in the SNN layers, improving biological plausibility and hardware compatibility. Third, we will prioritize deploying the model on dedicated neuromorphic hardware platforms (e.g., Intel Loihi 2, SpiNNaker2, or IBM TrueNorth) to fully leverage the sparse, event-driven computation advantages of SNNs, which our analysis shows can achieve 10–100× energy efficiency improvements beyond conventional GPU performance. Additionally, optimization techniques such as model pruning, quantization, timestep reduction, and adaptive spiking thresholds will be explored to further reduce inference latency while maintaining diagnostic accuracy, enabling real-time clinical applications and edge deployment on resource-constrained devices. Finally, future research may explore integrating pose estimation maps or skeleton-based representations to enrich the visual understanding of gait patterns and enhance interpretability. Developing visualization tools tailored to spiking activity may also contribute to greater clinical transparency and trust. Overall, this work demonstrates that integrating deep learning with neuroscience-inspired architectures holds significant promise for high-precision, low-power, and clinically relevant gait analysis in KOA and PD detection.

Author Contributions

Conceptualization: H.S. and A.B.; Methodology: H.S., A.B. and M.M.B.K.; Software: H.S. and M.M.B.K.; Validation: H.S. and A.B.; Formal Analysis: H.S.; Investigation: H.S. and M.S.; Resources & Data Curation: H.S., A.B. and M.M.B.K.; Writing—Original Draft: H.S., A.B. and M.M.B.K.; Writing—Review & Editing: H.S., A.B., M.M.B.K. and M.S.; Visualization: M.M.B.K. and M.S.; Supervision & Project Administration: M.M.B.K. and M.S. All authors have read and agreed to the published version of the manuscript.

Funding

This research received no external funding.

Institutional Review Board Statement

This study was conducted in accordance with the ethical principles outlined in the Declaration of Helsinki. Ethical approval was not required as the study used publicly available and anonymized datasets.

Data Availability Statement

The datasets used during the current study are publicly available from their respective sources. Processed data and materials supporting the findings of this study are available at this link: https://data.mendeley.com/datasets/44pfnysy89/1 (accessed on 07 September 2025). Kour, Navleen; Gupta, Sunanda; Arora, Sakshi (2020), “Gait Dataset for Knee Osteoarthritis and Parkinson’s Disease Analysis With Severity Levels”, Mendeley Data, V1, doi: 10.17632/44pfnysy89.1.

Conflicts of Interest

The authors declare no conflicts of interest.

Abbreviations

KOAKnee Osteoarthritis
PDParkinson’s Disease
CNNConvolutional Neural Networks
SNNSpiking Neural Networks
GANGenerative Adversarial Network

References

  1. Rani, S.; Memoria, M.; Choudhury, T.; Sar, A. A Comprehensive Review of Machine Learning’s Role within KOA. EAI Endorsed Trans. Internet Things 2024, 10. [Google Scholar] [CrossRef]
  2. Diab, A.G.; El-Kenawy, E.-S.M.; Areed, N.F.F.; Amer, H.M.; El-Seddek, M. A metaheuristic optimization-based approach for accurate prediction and classification of knee osteoarthritis. Sci. Rep. 2025, 15, 16815. [Google Scholar] [CrossRef] [PubMed]
  3. Shaban, M. Deep Learning for Parkinson’s Disease Diagnosis: A Short Survey. Computers 2023, 12, 58. [Google Scholar] [CrossRef]
  4. Abumalloh, R.A.; Nilashi, M.; Samad, S.; Ahmadi, H.; Alghamdi, A.; Alrizq, M.; Alyami, S. Parkinson’s disease diagnosis using deep learning: A bibliometric analysis and literature review. Ageing Res. Rev. 2024, 96, 102285. [Google Scholar] [CrossRef]
  5. Upadhyay, A.; Sawant, O.; Choudhary, P. Detection of Knee Osteoarthritis Stages Using Convolutional Neural Network. SN Comput. Sci. 2023, 4, 257. [Google Scholar] [CrossRef]
  6. Hassan, S.N.; Khalil, M.; Salahuddin, H.; Naqvi, R.A.; Jeong, D.; Lee, S.-W. KOC_Net: Impact of the Synthetic Minority Over-Sampling Technique with Deep Learning Models for Classification of Knee Osteoarthritis Using Kellgren–Lawrence X-Ray Grade. Mathematics 2024, 12, 3534. [Google Scholar] [CrossRef]
  7. Cioroianu, G.-O.; Florescu, A.; Florescu, L.-M.; Rogoveanu, O.-C. Knee Osteoarthritis-Current Diagnosis and Treatment Options—A Narrative Review. Curr. Health Sci. J. 2024, 50, 163–169. [Google Scholar] [CrossRef]
  8. Bhateja, V.; Dubey, Y.; Maurya, N.; Yadav, V.K.; Shrivastava, S.; Azar, A.T.; Haider, Z.; Amin, S.U.; Khan, Z.I. Ensemble CNN Model for Computer-Aided Knee Osteoarthritis Diagnosis. Int. J. Serv. Sci. Manag. Eng. Technol. 2024, 15, 1–17. [Google Scholar] [CrossRef]
  9. Jeong, Y.; Lee, D. CLIP-KOA: Enhancing Knee Osteoarthritis Diagnosis with Multi-Modal Learning and Symmetry-Aware Loss Functions. arXiv 2025. [Google Scholar] [CrossRef]
  10. Yang, J.H.; Park, J.H.; Jang, S.-H.; Cho, J. Novel Method of Classification in Knee Osteoarthritis: Machine Learning Application Versus Logistic Regression Model. Ann. Rehabil. Med. 2020, 44, 415–427. [Google Scholar] [CrossRef] [PubMed]
  11. Malik, I.; Yasmin, M.; Iqbal, A.; Raza, M.; Chun, C.-J.; Al-Antari, M.A. A novel framework integrating ensemble transfer learning and Ant Colony Optimization for Knee Osteoarthritis severity classification. Multimed. Tools Appl. 2024, 83, 86923–86954. [Google Scholar] [CrossRef]
  12. Houssein, E.H.; Abdalkarim, N.; Samee, N.A.; Alabdulhafith, M.; Mohamed, E. Improved Kepler Optimization Algorithm for enhanced feature selection in liver disease classification. Knowl.-Based Syst. 2024, 297, 111960. [Google Scholar] [CrossRef]
  13. Khoshnevis, S.A.; Sankar, R. Classification of the stages of Parkinson’s disease using novel higher-order statistical features of EEG signals. Neural Comput. Appl. 2020, 33, 7615–7627. [Google Scholar] [CrossRef]
  14. Mahajan, P.; Uddin, S.; Hajati, F.; Moni, M.A. Ensemble Learning for Disease Prediction: A Review. Healthcare 2023, 11, 1808. [Google Scholar] [CrossRef] [PubMed] [PubMed Central]
  15. Bakar, Z.A. Classification of Parkinson’s Disease (PD) Based On Multilayer Perceptrons (MLPs) Neural Network. Ph.D. Thesis, Universiti Teknologi MARA, Shah Alam, Malaysia, 2010. [Google Scholar]
  16. Xue, Z.; Lu, H.; Zhang, T.; Guo, X.; Gao, L. Remote Parkinson’s disease severity prediction based on causal game feature selection. Expert Syst. Appl. 2023, 241, 122690. [Google Scholar] [CrossRef]
  17. Xu, X.; Gu, W.; Shen, X.; Liu, Y.; Zhai, S.; Xu, C.; Cui, G.; Xiao, L. An interactive web application to identify early Parkinsonian non-tremor-dominant subtypes. J. Neurol. 2024, 271, 2010–2018. [Google Scholar] [CrossRef] [PubMed]
  18. Yu, Z.; Saiki, S.; Shiina, K.; Iseki, T.; Sasazawa, Y.; Ishikawa, K.-I.; Nishikawa, N.; Sako, W.; Oyama, G.; Hatano, T.; et al. Comprehensive data for studying serum exosome microRNA transcriptome in Parkinson’s disease patients. Sci. Data 2024, 11, 1128. [Google Scholar] [CrossRef]
  19. Stockbauer, A.; Beyer, L.; Huber, M.; Kreuzer, A.; Palleis, C.; Katzdobler, S.; Rauchmann, B.-S.; Morbelli, S.; Chincarini, A.; Bruffaerts, R.; et al. Metabolic network alterations as a supportive biomarker in dementia with Lewy bodies with preserved dopamine transmission. Eur. J. Nucl. Med. 2023, 51, 1023–1034. [Google Scholar] [CrossRef] [PubMed]
  20. Bhakar, S.; Sinwar, D.; Pradhan, N.; Dhaka, V.S.; Cherrez-Ojeda, I.; Parveen, A.; Hassan, M.U. Computational Intelligence-Based Disease Severity Identification: A Review of Multidisciplinary Domains. Diagnostics 2023, 13, 1212. [Google Scholar] [CrossRef]
  21. Cantürk, I. Fuzzy recurrence plot-based analysis of dynamic and static spiral tests of Parkinson’s disease patients. Neural Comput. Appl. 2020, 33, 349–360. [Google Scholar] [CrossRef]
  22. Kour, N.; Sunanda Arora, S. A vision-based gait dataset for knee osteoarthritis and Parkinson’s disease analysis with severity levels. In Proceedings of the International Conference on Innovative Computing and Communications: Proceedings of ICICC 2021, New Delhi, India, 20–21 February 2021; Volume 3, pp. 303–317. [Google Scholar] [CrossRef]
  23. Ben Hassine, S.; Balti, A.; Abid, S.; Ben Khelifa, M.M.; Sayadi, M. Markerless vision-based knee osteoarthritis classification using machine learning and gait videos. Front. Signal Process. 2024, 4, 1479244. [Google Scholar] [CrossRef]
  24. Ali, Z.; Moon, J.; Gillani, S.; Afzal, S.; Maqsood, M.; Rho, S. Vision-based approach to knee osteoarthritis and Parkinson’s disease detection utilizing human gait patterns. PeerJ Comput. Sci. 2025, 11, e2857. [Google Scholar] [CrossRef] [PubMed]
  25. Khessiba, S.; Blaiech, A.G.; Abdallah, A.B.; Grassa, R.; Manzanera, A.; Bedoui, M.H. Improving knee osteoarthritis classification with markerless pose estimation and STGCN model. In Proceedings of the 2023 IEEE 25th International Workshop on Multimedia Signal Processing (MMSP), Poitiers, France, 27–29 September 2023; pp. 1–7. [Google Scholar] [CrossRef]
  26. Hossin, M.; Sulaiman, M.N. A review on evaluation metrics for data classification evaluations. Int. J. Data Min. Knowl. Manag. Process. 2015, 5, 1. [Google Scholar] [CrossRef]
  27. Hassine, S.B.; Balti, A.; Abid, S.; Khelifa, M.M.B.; Sayadi, M. Parkinson disease classification using kinematic and SVM. In Proceedings of the 2025 International Conference on Control, Automation and Diagnosis (ICCAD), Barcelona, Spain, 1–3 July 2025; pp. 1–5. [Google Scholar] [CrossRef]
  28. Balti, A.; Khelifa, M.M.B.; Hassine, S.B.; Ouazaa, H.A.; Abid, S.; Lakhoua, M.N.; Sayadi, M. Gait Analysis and Detection of Human Pose Diseases. In Proceedings of the 2022 8th International Conference on Control, Decision and Information Technologies (CoDIT), Istanbul, Turkey, 17–20 May 2022; pp. 1381–1386. [Google Scholar] [CrossRef]
Figure 1. Application of Yolov8 for patient identification.
Signals 06 00064 g001
Figure 2. Class Distribution of Subjects and Videos in the KOA-PD-Normal Dataset.
Signals 06 00064 g002
Figure 3. Diagram of the Proposed Approach.
Signals 06 00064 g003
Figure 4. Diagram of the CNN Block.
Signals 06 00064 g004
Figure 5. Diagram of the SNN Block.
Signals 06 00064 g005
Figure 6. (a) Performance of the Standalone SNN model. (b) Performance of the CNN + GAN model. (c) Performance of the Standalone CNN model. (d) Performance of the proposed model.
Signals 06 00064 g006
Figure 7. (a) Confusion Matrix of the Standalone SNN model. (b) Confusion Matrix of the CNN + GAN model. (c) Confusion Matrix of the Standalone CNN model. (d) Confusion Matrix of the proposed model.
Signals 06 00064 g007
Figure 8. Visualization of Learned Feature Representations using t-SNE.
Signals 06 00064 g008
Figure 9. Normalized Comparison between CNN-Only and hybrid CNN-SNN models.
Signals 06 00064 g009
Table 1. Detailed Configuration Parameters for the Proposed Approach.
CategoryParameterDescription
Video Processingsampling_rate = 16Process 1 out of every 16 frames in each video
YOLO ModelYOLO v8Lightweight YOLOv8 model used for object detection
class_id (person) = 0Class ID corresponding to ‘person’ in COCO dataset
bbox_color = BlueBounding box color used for detected persons (BGR format)
Datasetnum_classes = 3Number of target classification classes
batch_size = 32Number of samples per training/testing batch
Devicecuda or cpuHardware used for training (GPU if available, otherwise CPU)
CNNinput_channels = 3Number of input channels (RGB images)
cnn_output_dim = 128Output dimension from CNN passed to SNN
SNNinput_dim = 128Input dimension for SNN (from CNN output)
snn_hidden_dim = 64Number of neurons in hidden layer of SNN
snn_output_dim = 3Number of output neurons (equal to number of classes)
num_steps = 10Number of time steps for temporal spiking simulation
leaky_beta = 0.9Leak factor for Leaky Integrate-and-Fire neurons
Trainingnum_epochs = 30Maximum number of training epochs
criterion = MSE Loss()Loss function used (Mean Squared Error for one-hot labels)
optimizer = AdamOptimizer used for training the network
learning_rate = 1 × 10⁻⁴Learning rate for optimizer
weight_decay = 1 × 10⁻⁴L2 regularization term to prevent overfitting
EarlyStoppingpatience = 10Number of epochs to wait before early stopping
min_delta = 0.001Minimum required improvement to reset early stopping counter
Table 2. Comparison between the proposed Model and State of the Art models on the same Dataset.
AuthorsTechniqueYearAccuracy
Slim et al. [23]Markless, vision-based Random Forest202496.9%
Ali et al. [24]Mask R-CNN + Transfer learning + GRU202594.81%
Khessiba et al. [25]Graph Convolutional Network202393.75%
Kour et al. [22]KNN and FODPSO202290%
The proposed StudyGAN + YOLO + CNN + SNN202599.47%
Table 3. Ablation Study Performance Metrics.
KOA-PD- NM Dataset
Accuracy (%)Precision (%)Recall (%)F1Score (%)AUC (%)
The Standalone model SNN87.893949497
CNN + GAN96.194969599
The Standalone CNN94.6929392.599
The proposed model99.479998.498.699
Table 4. Sensitivity Analysis of SNN Firing Threshold (θ) on Validation Evaluation Metrics.
θAccuracy (%)Precision (%)Recall (%)F1Score (%)
0.1098.998.798.898.7
0.2599.299.199.299.1
0.5099.479998.498.6
0.7598.898.598.798.6
1.00 *47.548.047.247.6
* At θ = 1.0, the SNN failed to generate sufficient spikes, causing near-chance performance.
Table 5. Model Complexity and Parameter Analysis.
ModelParameters (M)FLOPs (G)Model Size (MB)
CNN-only2.141.828.6
Hybrid CNN-SNN2.310.949.2
Table 6. Inference Latency Comparison.
ModelMean Latency (ms)Median Latency (ms)Std Dev (ms)
CNN-only0.0120.0110.003
Hybrid CNN-SNN0.2280.2260.021
Table 7. GPU Power Consumption During Inference.
ModelAverage Power (W)Peak Power (W)Energy per Sample (mJ)
CNN-only68.476.20.82
Hybrid CNN-SNN62.169.80.88
Disclaimer/Publisher’s Note: The statements, opinions and data contained in all publications are solely those of the individual author(s) and contributor(s) and not of MDPI and/or the editor(s). MDPI and/or the editor(s) disclaim responsibility for any injury to people or property resulting from any ideas, methods, instructions or products referred to in the content.