1. Introduction
It is, without a doubt, that industrialization, mobility, and the concentration of people in large cities and metropolises have provided many opportunities in modern societies for economic growth through access to advanced services and goods. However, there are several conditions under which citizens’ lives could also be affected. One of the factors that certainly deteriorates a community’s wellbeing is noise pollution. The increased acoustic levels substantially impact various environments (e.g., workplaces, hospitals, geriatric services, family houses, learning units, etc.). Within this context, the World Health Organization (WHO) has regulated the maximum acceptable limits. Especially in the case of learning facilities (schools and kindergartens), where noise could potentially amplify stress to teaching staff and pupils. This could induce performance degradation, affecting youngsters to properly function [
1,
2]. Consequently, WHO has clearly designated that the noise levels inside classes should not exceed 35 dBA (even lower levels for children with hearing impairments), while in extra-gathering spaces, noise levels should be maintained below 55 dBA [
3]. Taking into account the aforementioned points, this work studies the effect of noise in learning environments, i.e., schools, based on the utilization and installation of wireless IoT sensor nodes and open-source IoT platforms.
During the last years, several attempts have been made to assess the noise levels and effects in educational buildings. To this end, IoT-based systems and devices have been installed in school units around the world. Specifically, researchers in [
4] used hand-held sound level meters and calibrators to acquire outdoor and indoor noise level measurements in 15 school buildings in Greece. They noted that roadsides and schoolyards are affected by noise produced during breaks and sports activities. This was even more noticeable in units that faced roads or schoolyards without facilitating double glazing. Similarly, authors in [
5] utilized sound level meters to conclude that schools residing in socioeconomically vulnerable areas in Greece are attributed with high levels of noise, which significantly exceeded the recommended WHO limits. These noise levels were introduced by both the internal and external environments of schools. The work, conducted in [
6], deployed an IoT infrastructure inside 5 school complexes to monitor the noise sources. They presented comparable results, however, focusing only on the performance of pupils during class activities.
Smart schools that integrated both AI technology and intelligent sensors have shown that these collaborations can capture human body movements, emotions, sounds, and other signals to value the performance of teachers and pupils during class lessons [
7]. In addition, teachers can be able to react accordingly, based on the noise level measurements from IoT frameworks, as has been demonstrated in [
8,
9]. Also, research approaches in [
10,
11,
12] resulted in similar outcomes regarding noise levels and how these potentially affect the performance in educational institutes. However, the adoption of IoT technologies in education raises several concerns about data privacy, especially concerning the monitoring of pupils or students, and therefore additional precautions should be considered [
13]. It is important to follow regular calibration and maintenance procedures to ensure the reliability and accuracy of the sensor measurements as dictated in [
14].
The time of daily operation in school units could be divided into two categories: (a)
in-class operation, which will be simply termed “
lesson time” and (b)
out-of-class period that is defined as “
break”. Usually when focusing on the functioning conditions of pupils and teachers in a school unit, we mainly consider lesson time. It is important to state that during that period, the operation is closely supervised and controlled by the classroom teacher. Despite the forming of a multifactorial and volatile environment during the lesson time which is shaped by many different aspects, such as the type of lesson, the action performed, and the interior design, it is noticeable that it is strictly controlled and supervised by the teacher. Breaks, on the other hand, which introduce an important part (about 20%) of a school day, are of no guided restrictions, and consequently, situations of intense mobility and high noise frequently develop. These noisy circumstances affect the working environment of teachers and some pupils, particularly when they exceed the tolerable limits, distressing their psychological and physical health, as well as their social behavior [
5,
15]. Moreover, the average age of teachers is about 50 years old, and burnout syndromes are very common.
Drawing from the aforementioned analysis, the aim of this work is to implement a sensor network, based on the Internet of Things technology, forming, in this way, a vehicle for measuring noise and other environmental conditions [
16] of school complexes. We have particularly focused on monitoring noise conditions during breaks, also taking into account the conditions of building infrastructure and how it can potentially isolate noise levels. In contrast to the works performed in [
4,
5,
6], where generally the chosen building facilities were in poor to moderate condition depending on their age, we have selected school complexes that have been recently renovated based on current standards to minimize the energy footprint and carbon emissions to the environment. Therefore, our target is to show that mitigation of high noise levels in urban areas and especially in school buildings should also be taken as a criterion during construction or renovations, apart from CO
2 friendliness.
To this end, the objectives/contributions of this study are synopsized below:
Design of IoT infrastructure for noise tracking in school buildings;
Explore whether energy upgrades and thermal isolation in school infrastructures mitigate the extensive noise levels in comparison to the work reported in the literature;
Further evaluate the noise behavior through statistical analysis of the stored sensor data;
Impact assessment of the noise and its effects during the course breaks;
Propose guidelines on supplementary improvements in renovated school buildings to further isolate noise and how the proposed IoT solution could be a useful tool to serve this purpose.
The rest of the paper is organized as follows.
Section 2 presents the methods used to conduct this research, the IoT architecture, and its building deployments.
Section 3 analyzes the generated results, while
Section 4 evaluates the performance of the IoT infrastructure installed and also assesses the measurements received from the low-cost sensors. Finally,
Section 5 concludes our work.
2. Methods
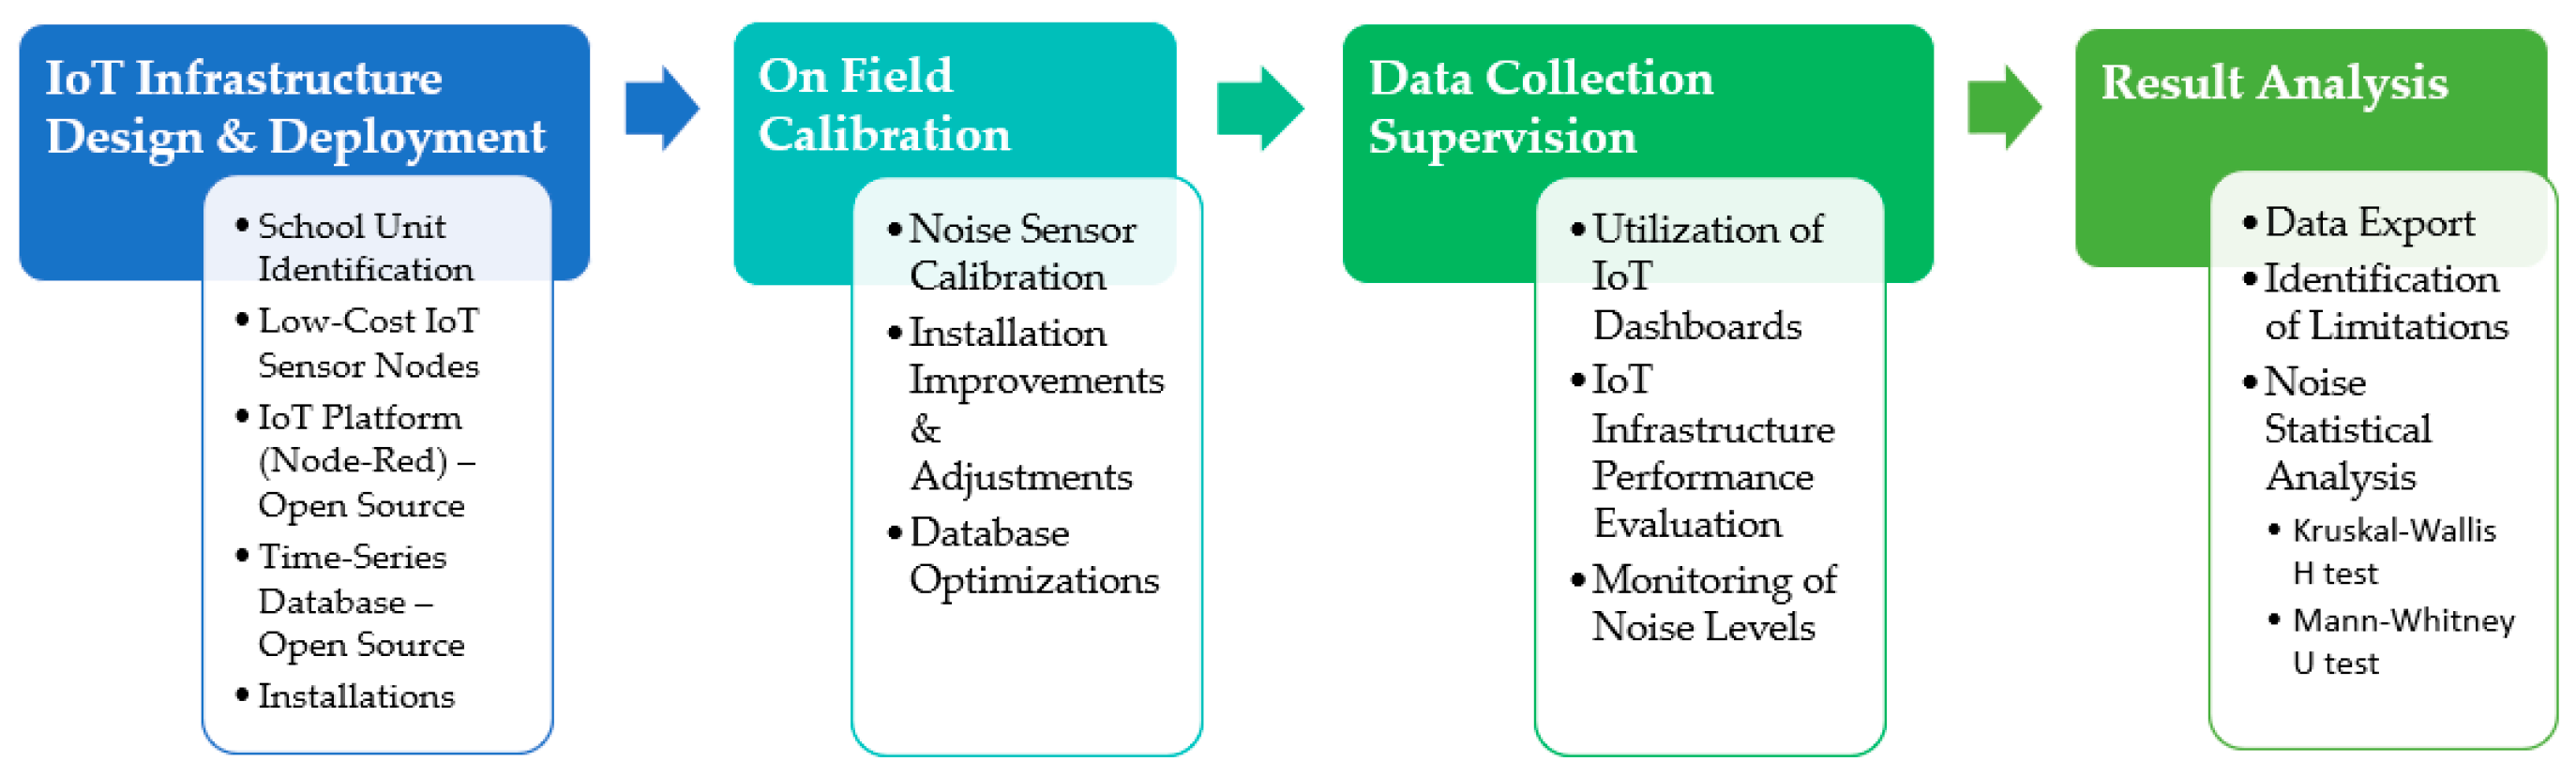
During the execution of this research, we followed the methodological steps depicted in
Figure 1. Specifically, as a first step, we identified the school units where recent renovation activities had been performed to isolate the buildings and transform them into constructions that are environmentally friendly. Although this is the main governmental guideline\regulation for old buildings built during the last 50 years, noise immunity is something that is not always considered throughout the renovations or reconstructions.
Within this scope, we have selected a high school and a senior high school complex that reside nearby and have been energy upgraded. Specifically, these buildings have been isolated with double-glass windows and shell thermal insulation of facades, which translates to higher noise immunity than relevant infrastructures of other schools. Therefore, the key point that requires further exploration is if these building improvements have considerably mitigated noise impacts. As a second step, we have selected the suitable acoustic sensors and constructed the IoT sensor nodes to transmit data to an IoT platform and store it in a time-series database. The next step was to perform tests and calibrations on the noise sensors and further adjustments on the selected locations where the IoT sensor nodes had been placed. The sensor outputs are collected and visualized in IoT dashboards that adequately monitor the sensor levels. Data export, limitation concerns, and statistical analysis are performed to evaluate the measurements and examine the sensor levels. The Kruskal–Wallis H test and the Mann–Whitney U test have been facilitated to analyze the received sensor data and assess the noise during the class breaks.
2.1. Architecture of the IoT Infrastructure
The IoT wireless network was installed in two school units in Larissa (a high school and a senior high school). The aim was to control, evaluate, and monitor real-time environmental variables relevant to the functioning of schools and the activity of pupils, teachers, and other employees. The deployed IoT infrastructure collects data for temperature in degrees Celsius (°C), relative humidity (%), noise–environment volume in decibels (dBs), and PM
10 and PM
2.5 microparticles in µg/m
3. The first three variables (temperature, humidity, and noise) are captured by the installed sensors. The PM
10 and PM
2.5 are retrieved via http REST API access from a Waqi International Network (World Air Quality Index Platform) from the IoT sensor located 1400 m away from the school complex and is the closest station [
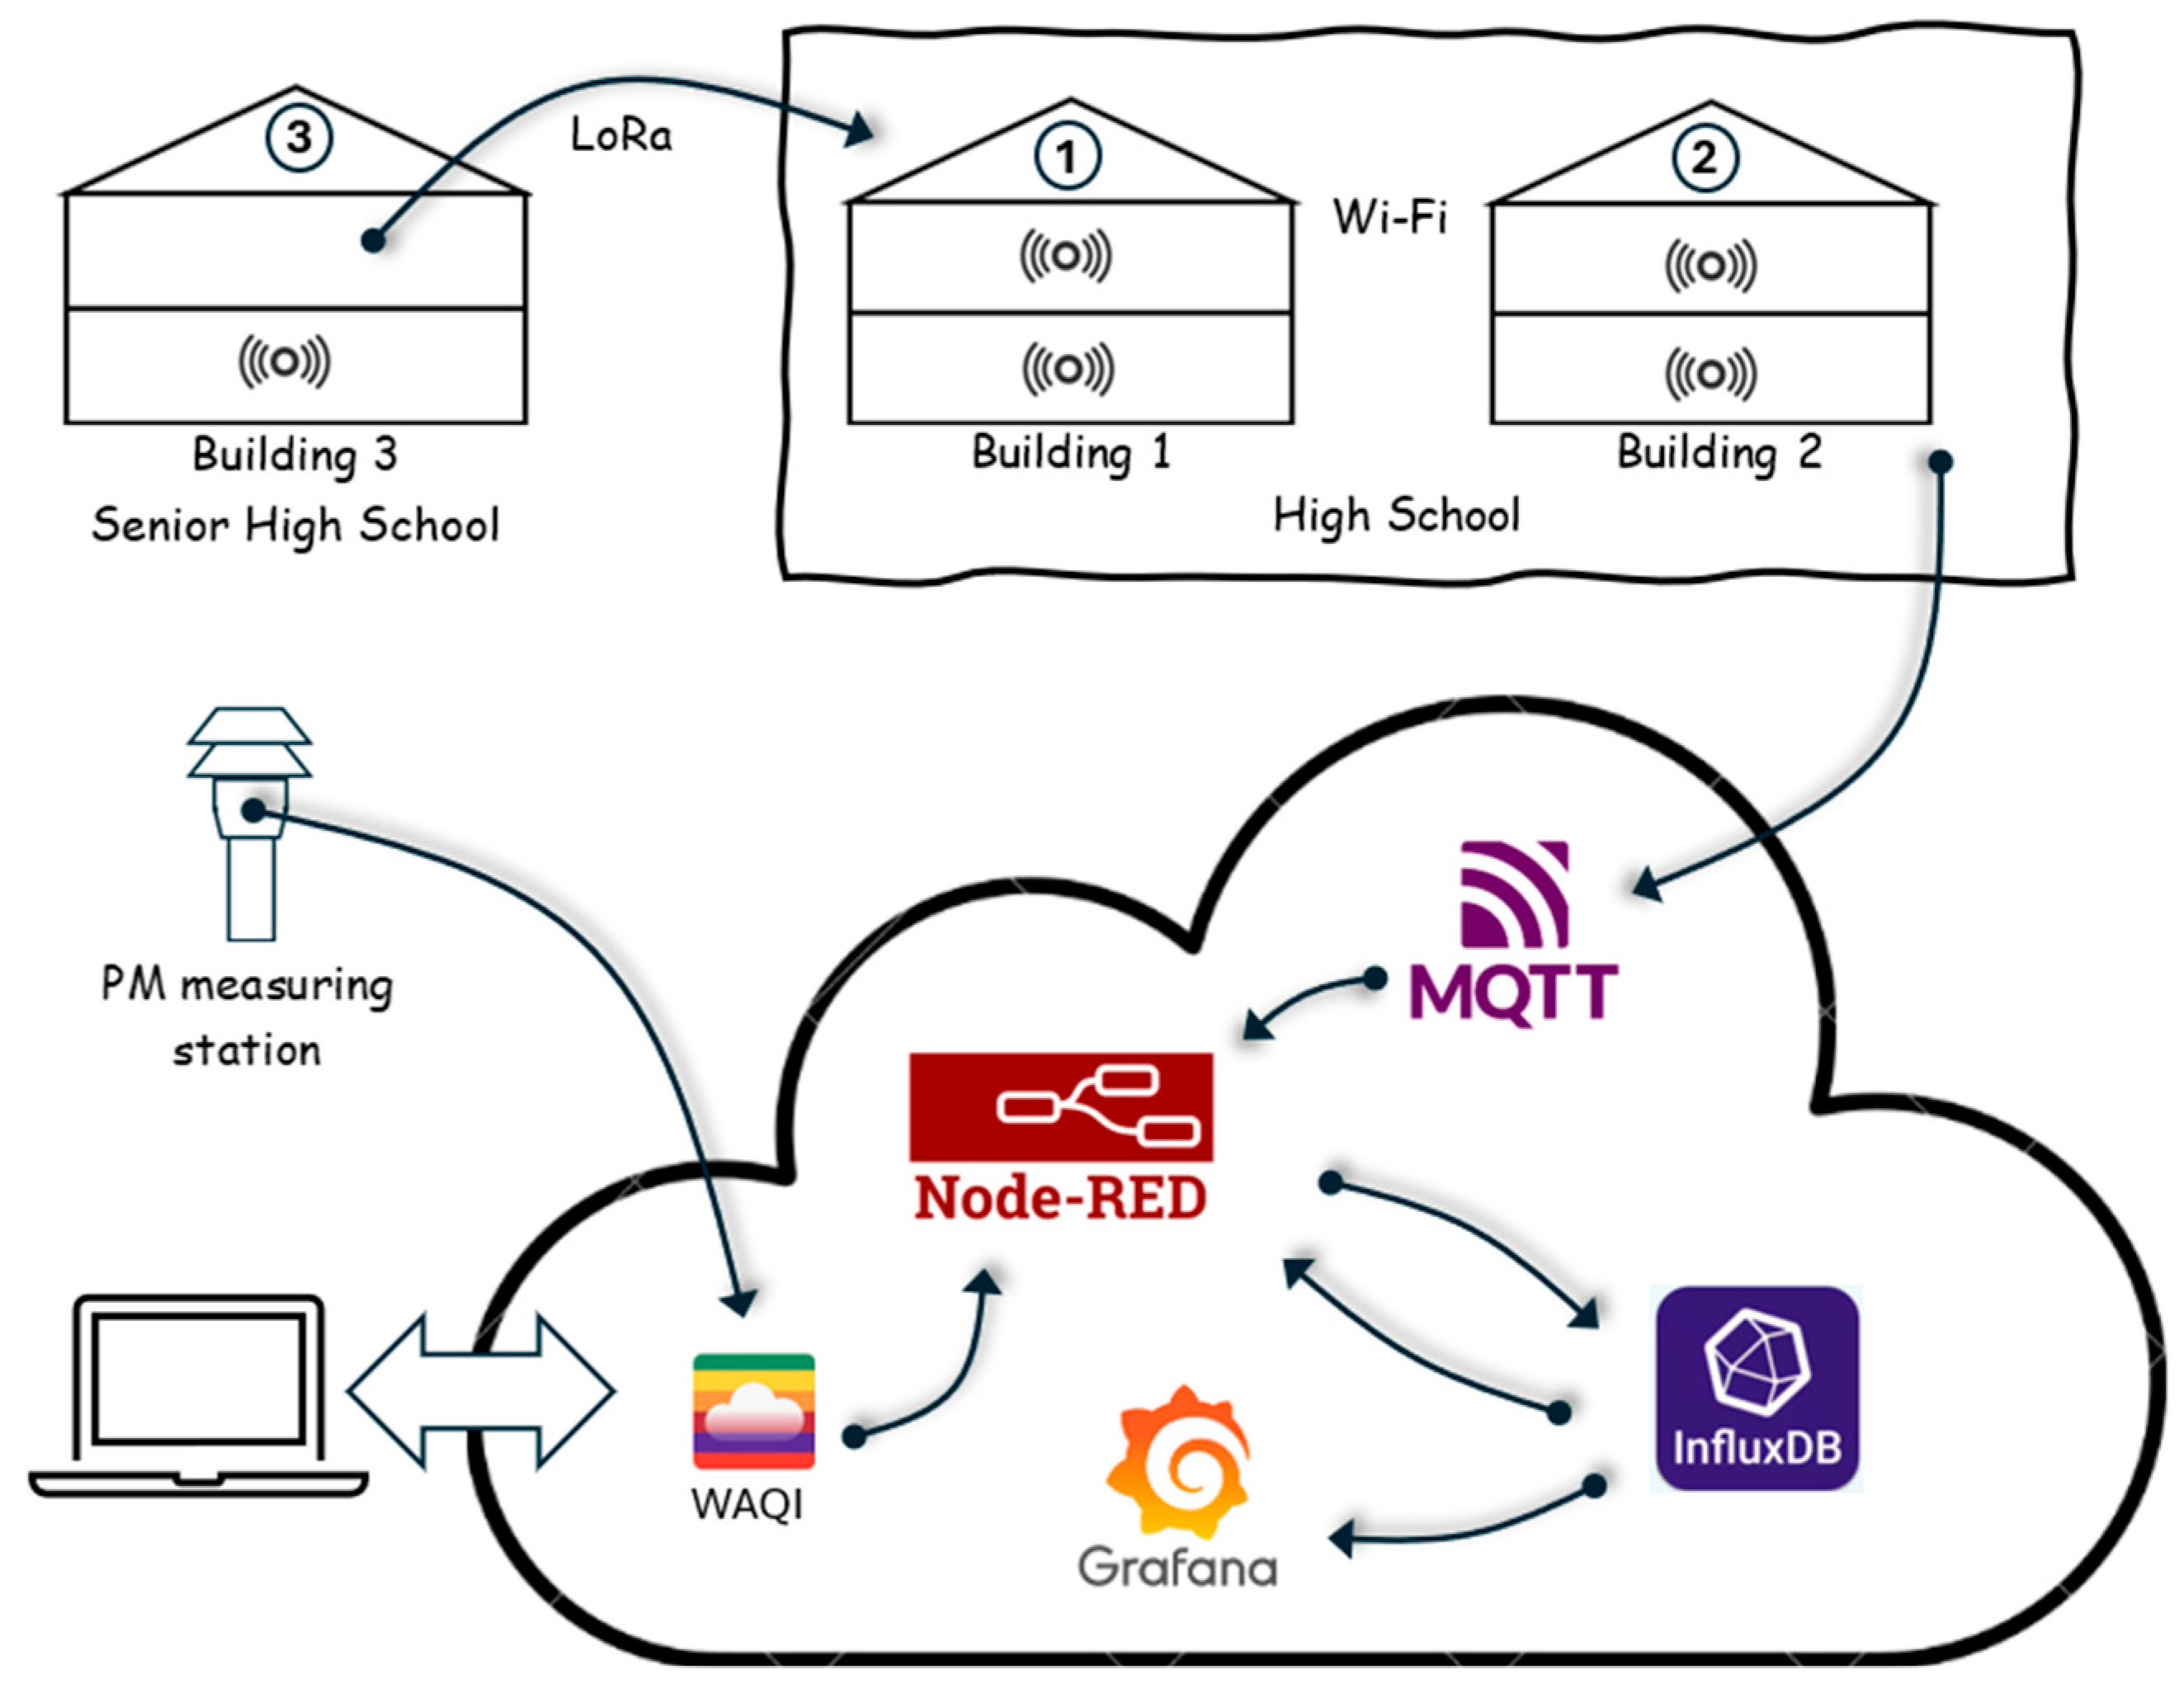
17]. The selected school buildings did not provide proper datacom infrastructure. Specifically, the high school had deployed a Wi-Fi network with Internet access, while the senior high school did not support any telecom utility. Therefore, in order to transmit the sensor data from both buildings to the cloud platform where the dashboards and the time-series database have been installed and configured via the Internet, we had to construct a low-cost telecom infrastructure. This resulted in the implementation of 3 different IoT sensor nodes. The first one has been used to both acquire sensor data and send it via the Wi-Fi IEEE802.11n network and the MQTT protocol to the cloud platform, which was deployed to the high school. The second IoT sensor node utilized a LoRaWAN protocol to collect sensor data and transmit it over a peer-to-peer LoRa link at a distance of 300 m to the third type of node, i.e., the IoT sensor node gateway. The second IoT node has been installed inside the senior high school, and since no obstacles in the direct link are present apart from the building’s walls, the SF7 spreading factor has been employed at the EU-RF frequency of 868 MHz configured at 125 KHz bandwidth with a coding rate equal to 4/5, a 55-byte-long buffer size, 5 dBm transmit output power, and a preamble length equal to 8 bytes. No reception discrepancies or data degradation were present. The third IoT sensor node was deployed to the high school and acted as a network gateway to receive data over the LoRa peer-to-peer link, processed\transform it accordingly, and send it over the Wi-Fi connection to the Internet (cloud platform) via the MQTT protocol. The sensor node, being attached to the sensors, could also acquire environmental data from the high school building and send it to the cloud platform.
Therefore, taking advantage of the fact that a Wi-Fi network was available in the high school, the core deployment of the Wi-Fi IoT sensor nodes took place there. Specifically, the measuring stations were installed on each floor (ground floor and 1st floor) of both school buildings (buildings 1 and 2), and through the MQTT TCP protocol, the collected data were transmitted to the IoT platform. On the other hand, we incorporated a LoRa-based IoT sensor node in the senior high school (building 3, ground floor). Therefore, a LoRa peer-to-peer network between high school and senior high school was implemented and established. This means that one of the Wi-Fi IoT sensor nodes utilized in the high school not only operated as a sensor node but also functioned as a gateway to translate the LoRa packets to MQTT data packets and eventually transmit them over Wi-Fi to the IoT platform. Consequently, all measurements from the sensors of the 5 total installed nodes were sent via MQTT protocol to the Node-Red platform [
18], which has been installed in cloud infrastructure. Furthermore, the InfluxDB time series database [
19] was used to store the sensor data, while dashboards created in the Grafana visualization platform [
20] were utilized to monitor and analyze the received data. The presentation and monitoring of sensor data were performed both in the Node-Red dashboard and Grafana platforms.
Figure 2 delineates the aforementioned described architecture and the telecommunication infrastructure of the buildings.
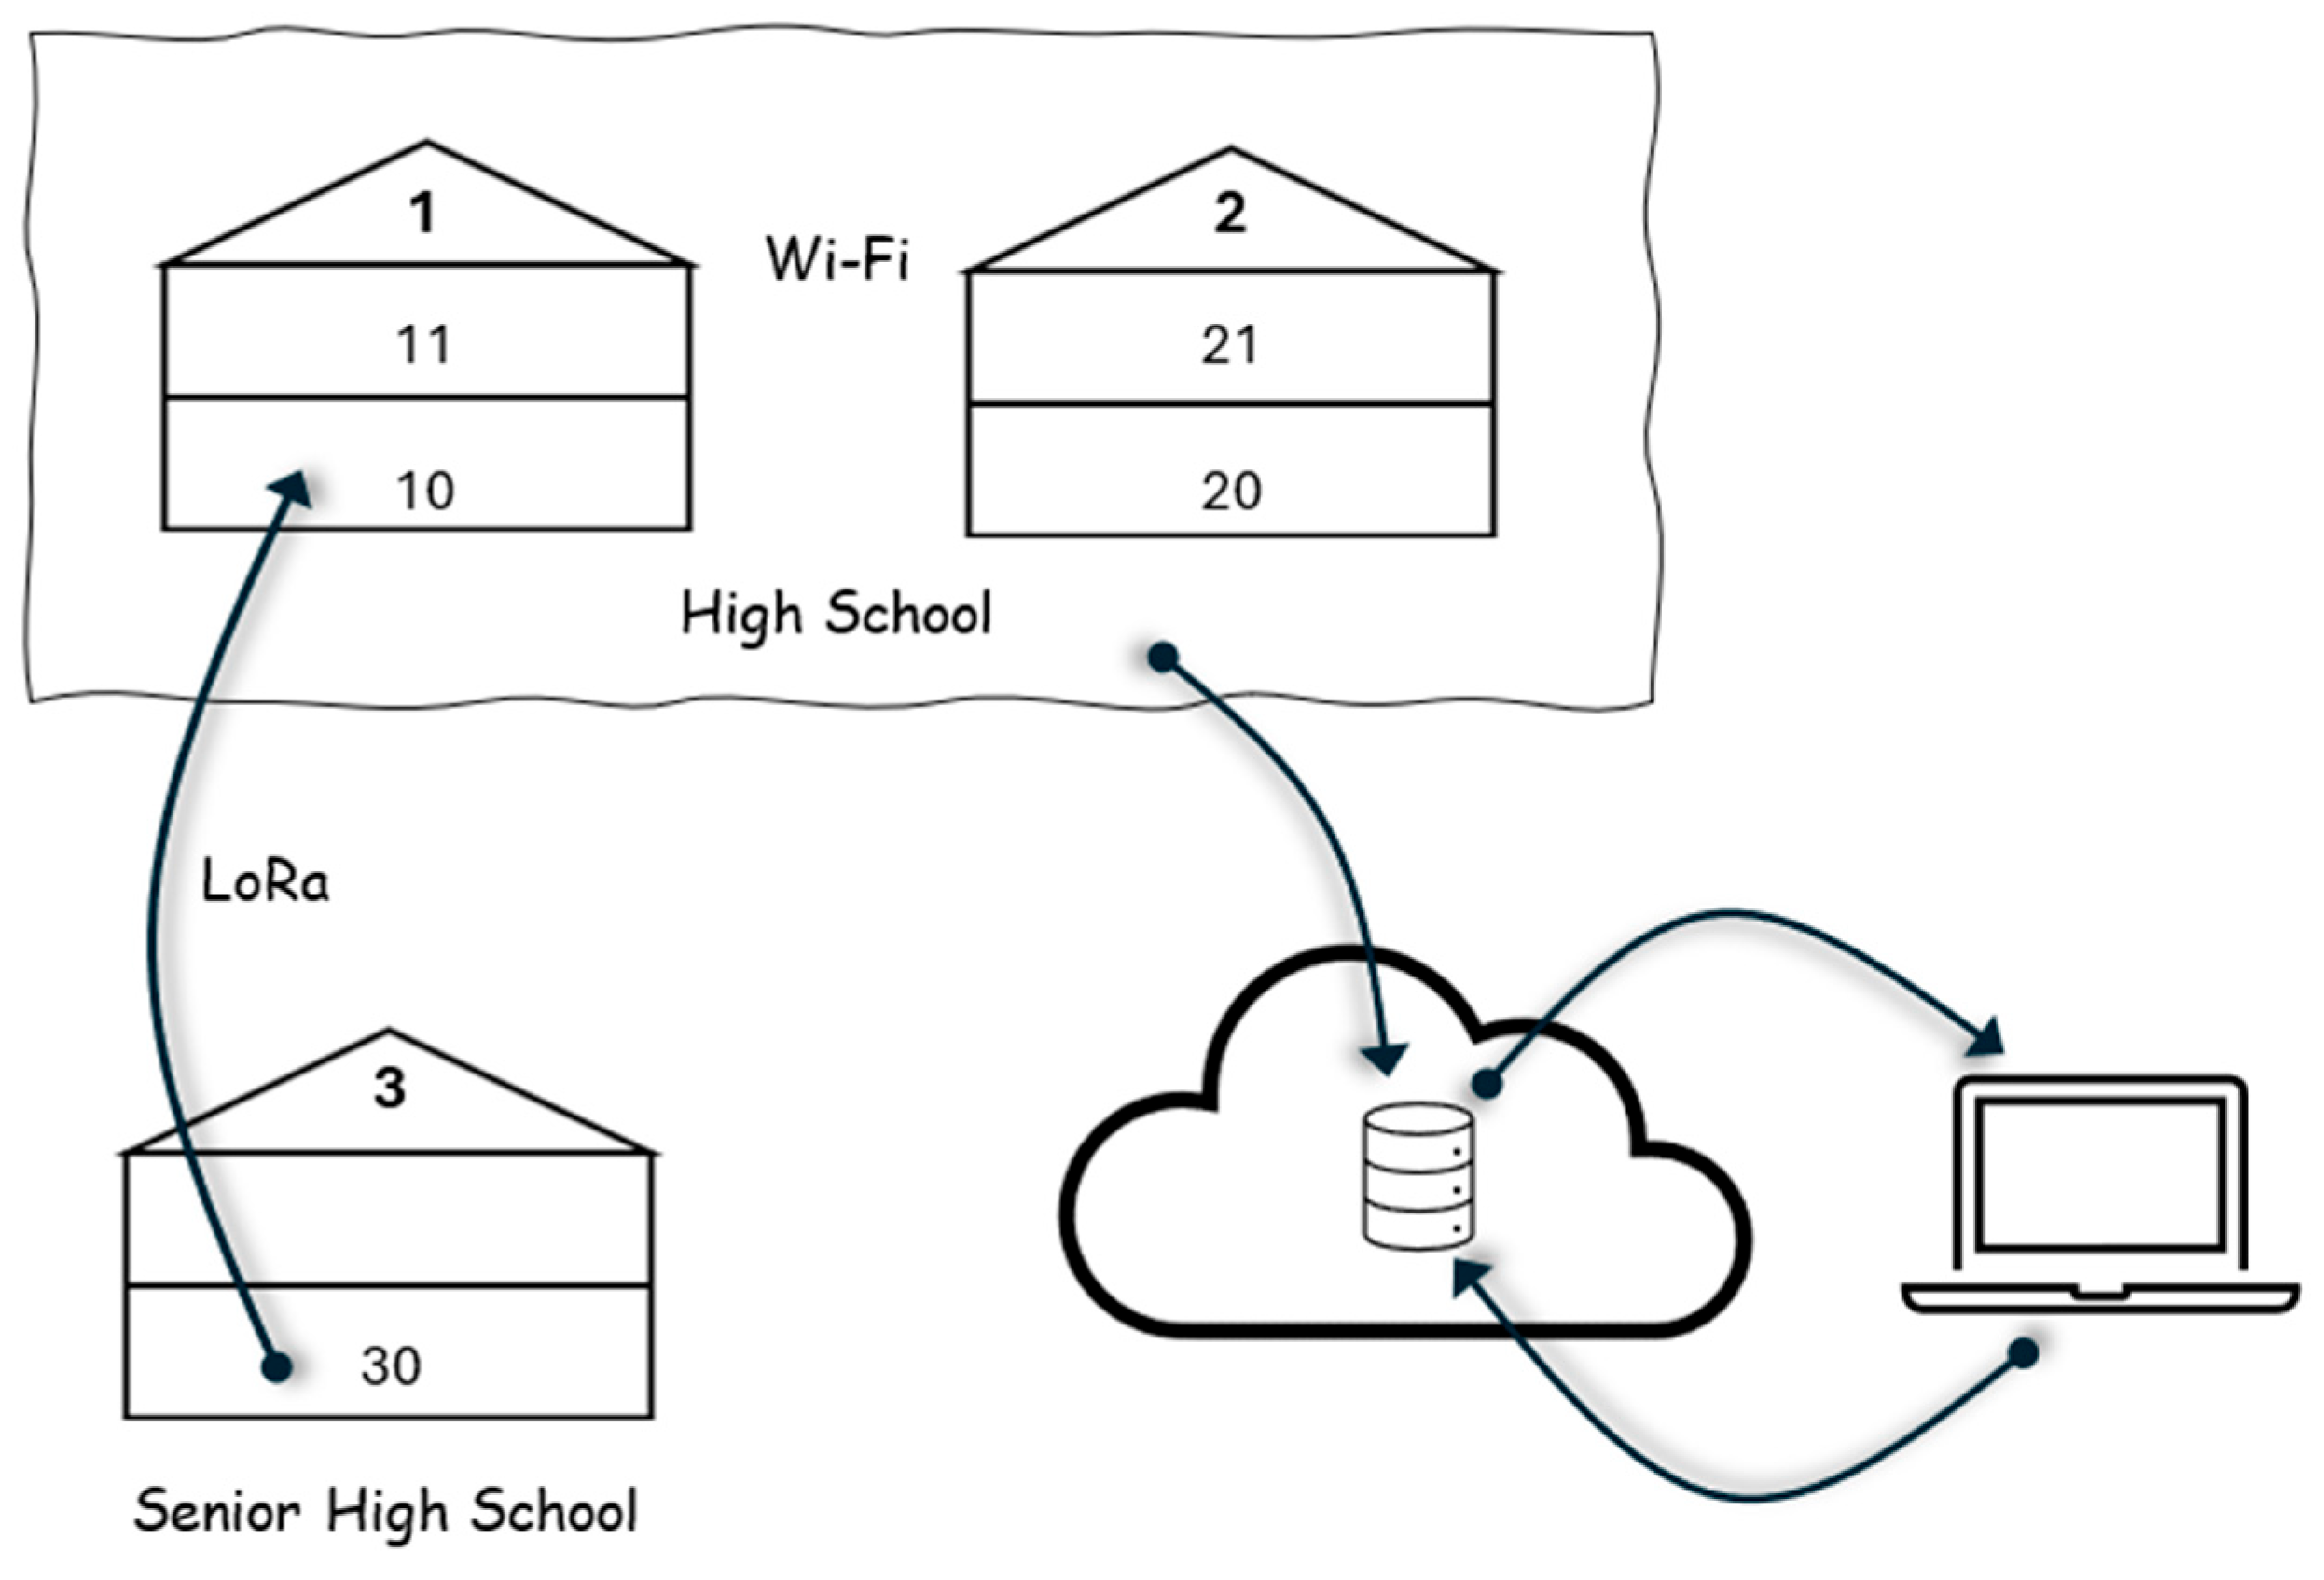
Figure 3 illustrates the location of the data collection stations in buildings 1, 2, and 3. In particular, Wi-Fi-based IoT sensor nodes (noise, humidity, and temperature measures) were installed in buildings 1 and 2 (one per floor). These nodes collect data and send it to the Node-Red platform (cloud-based) via the school’s Wi-Fi network. The LoRa-based IoT sensor node was installed in Building 3. The received measurements were transmitted via the LoRa network to building 1, where one of the Wi-Fi IoT with LoRa reception modules forwarded them to the cloud platform. The measuring stations were named according to their position. The number convention used consists of two digits (
Figure 4). The first number corresponds to the building (1, 2, 3), while the second one corresponds to the floor (0: ground floor, 1: 1st floor), as follows:
Station 10 (Wi-Fi): Building 1, floor 0;
Station 11 (Wi-Fi): Building 1, floor 1;
Station 20 (Wi-Fi): Building 2, floor 0;
Station 21 (Wi-Fi): Building 2, floor 1;
Station 30 (LoRa): Building 3, floor 0.
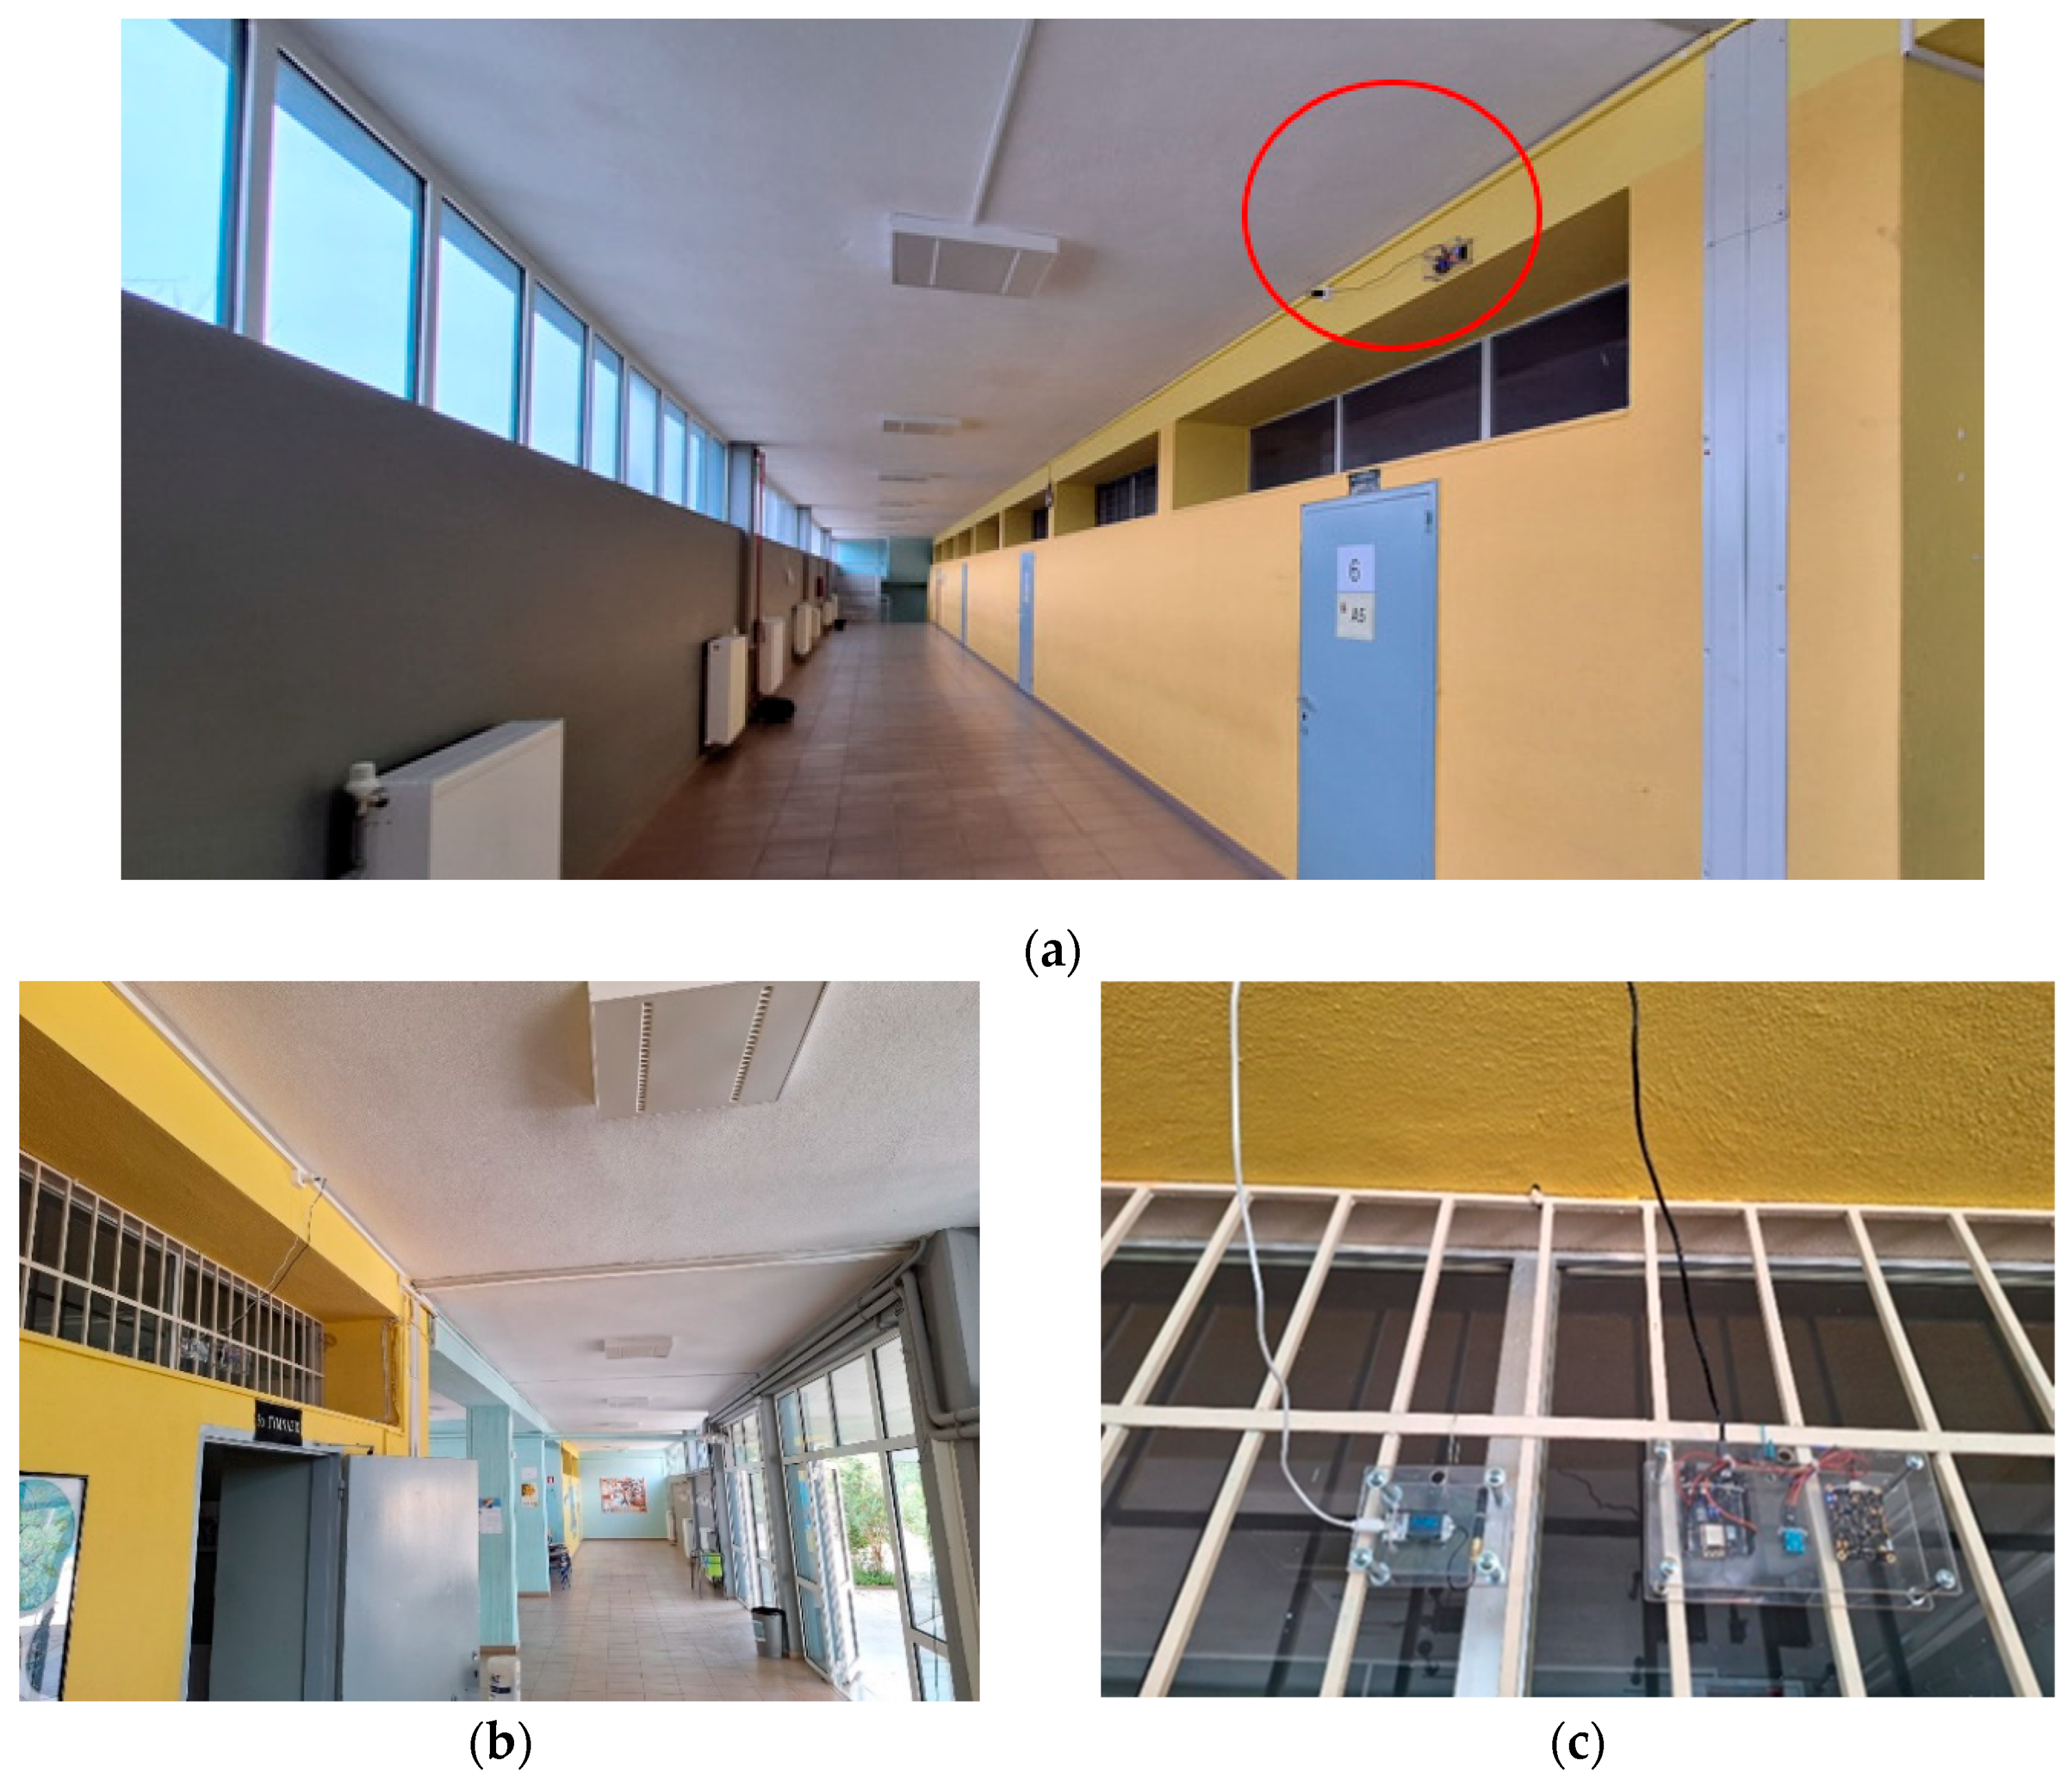
To this end, 5 IoT sensor nodes (stations) were installed in the 3 buildings. Additionally, there is a LoRa receiver (gateway LoRa to Wi-Fi) in the 1st building that receives the data sent by Station 30. Consequently, 6 stations have been incorporated in total. Moreover, the stations were placed in the corridors of the buildings about the middle of their length, which is 54 m in total. This was suggested by the teachers that have noticed an increased activity (entrance—office exit, dense passage of students—teachers), as shown in
Figure 5. Therefore, drawing from both the input provided by the teachers and findings from similar studies in Greece [
4,
5,
6], we placed the sensors in specific locations and at certain heights in the corridors outside the classrooms and the teachers’ offices, at an optimal height (not reachable by the pupils) for monitoring the sound levels and the environmental conditions. This placement was intended to ensure accurate data collection.
2.2. Evaluation of Low-Cost Acoustic Level Sensor
According to the work performed by the authors in [
6,
7,
8,
9], low-cost sound sensors require calibration and continuous monitoring for the accuracy of their measurements [
11,
21]. Therefore, between the Sen0232 [
22] and the Sen12642 [
23] acoustic sensors, the SEN0232 sensor [
11] was utilized due to its accuracy and its simplicity of integration [
22]. Specifically, it outputs an analog voltage value that can be processed by the microprocessor and consequently be converted to a dBA. On the contrary, the Sen12642 sensor does not support dBA-associated measurements; however, it provides a proportional value that does not correspond to a specific intensity value, and this could potentially be performed afterwards with the application of an appropriate algorithm implemented in SW. Subsequently, while Sen0232 can be used as is, Sen12642 required further evaluation. It should be noted that Sen12642 is a more cost-effective solution. The SEN0232 sensor utilizes 3 pins: one for the power supply connection, another for connecting it to the ground, and the third to an analog input pin of the boards described in
Section 2.3 below. The measuring range of this acoustic signal sensor ranges from 30 dBA to 130 dBA, with a measurement error of ±1.5 dB and a frequency response ranging from 31.5 Hz to 8.5 KHz. The school environment is not a heavy industrial environment as described in the WHO finding, and consequently, the technical specifications of the SEN0232 meet the characteristics of our ecosystem, and it is an adequate and cost-effective solution to bolster the noise tracking.
2.3. Station Design: IoT Sensor Nodes
The Wi-Fi-based IoT sensor nodes comprise a WeMos D1 R2 development board [
24], which incorporates an ESP-8266 microprocessor and a Wi-Fi card. On the other hand, as mentioned in the previous sections, in the case of data collection and data transmission and reception from the senior high school building to the building of the high school, a Wi-Fi LoRa 32 (V3) device from the Heltec Automation [
25] development board was utilized. It includes an ESP32-S3FN8 microprocessor and both a Wi-Fi and a LoRa wireless card. Regarding the acoustic signal level sensor, we finally used the SEN0232 analog sound level meter as discussed in
Section 2.2 [
22]. The temperature and relative humidity measurements were conducted by employing the DHT11 [
26] and AHT10 [
27] sensors. The DHT11 sensor is a digital sensor that supports a relative humidity measurement range of 20–90% with ±5% accuracy, a temperature measurement range of 0–50 °C with ±2 °C accuracy, and a maximum current consumption of 2.5 mA. It features 3 pins (VCC, ground, and digital output). The digital output that provides the measurement data to any of the digital I/O pins of the used board. On the other hand, the AHT10 sensor provides 4 pins (VCC, ground, SDA, and SDCL). The AHT10 sensor uses the I2C (0x38) interface to feed its measurements to the board of the IoT sensor nodes by connecting the data pin SDA to the D2 pin (RX) of the boards while connecting the SCL pin to the D1 pin (TX). The AH10 sensor specification facilitates a temperature measurement range of −40 °C to 85 °C (±0.3 °C accuracy) and a relative humidity measurement range of 0% to 100% (±2%RH accuracy). Both sensors are low-cost and adequate to efficiently support the monitoring of the environmental settings in school buildings because they have been deployed inside them and are not affected or exposed to severe weather conditions like rainfalls or direct sunlight, something that would deteriorate their operation. As mentioned in previous sections, three types of data collection stations were designed and implemented, as shown in
Figure 6.
Table 1 summarizes the equipment used in the 3 different IoT sensor nodes.
Figure 7 and
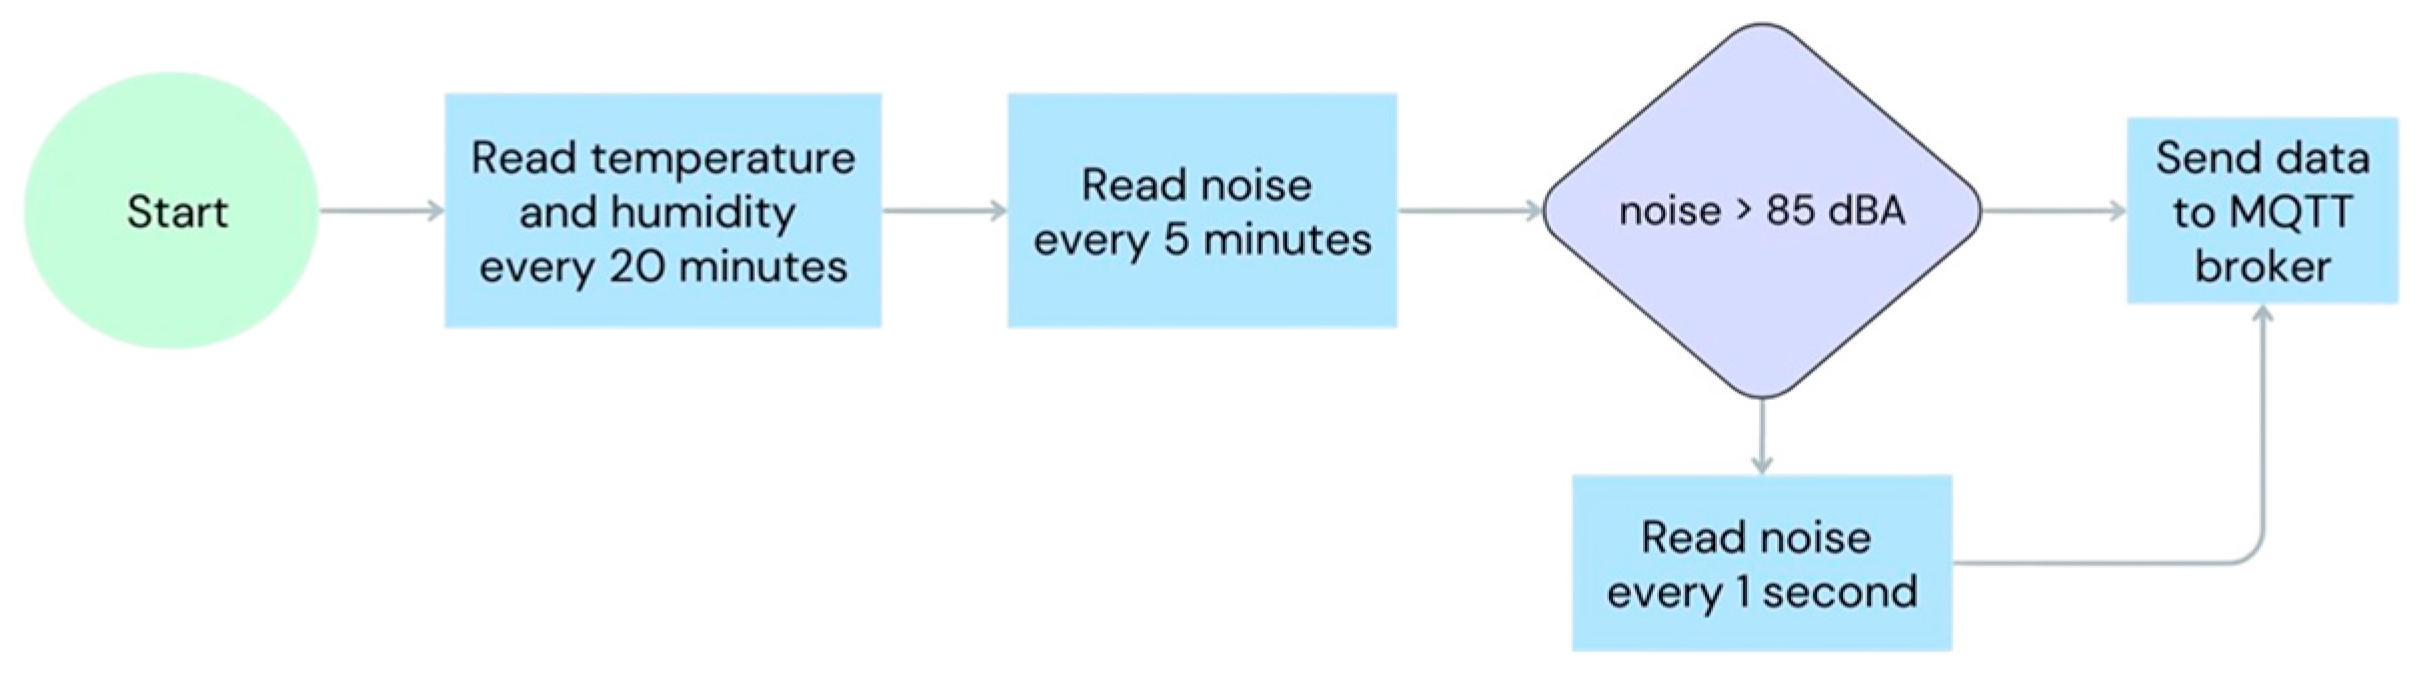
Figure 8 delineate, respectively, the operation flow of the Wi-Fi-based IoT sensor node and the LoRa-based IoT one. Specifically, the Wi-Fi-based station acquires the environmental temperature and humidity measurements every 20 min and the sound level every 5 min. The data are sent to the MQTT broker via the Wi-Fi connection. If the measured noise level is above 85 dBA (presence of high noise levels according to WHO standards), the sampling period is increased to every 1 s to record the noise behavior in detail. On the other hand, for simplicity reasons, due to the LoRa transmission, the LoRa-based station reads the temperature, humidity, and noise level values every 3 s.
2.4. Data Collection and Monitoring
The measured data received via the MQTT broker were further processed in the Node-Red IoT platform and visualized in the Grafana environment (
Figure 9) as well.
The Grafana application was configured to retrieve data by querying the associated measurements stored in the InfluxDB time series database. As mentioned above, the general rule applied considers that for the atmospheric data, there is one record every 20 min, and for noise, one every 5 min. Specifically, at high school stations, the temperature and humidity data are sampled every 20 min, while the noise is sampled every 5 min. In addition, when a high-intensity noise (>85 dBA) event is detected, the recording frequency increases and is executed every second until the end of the event, that is, until the sound ≤ 85 dBA is again detected. Thus, the network measures the duration of high-intensity sounds that might be of interest in a study of working and living conditions in the school. The senior high school station received measurements every three seconds and sent them via the LoRa protocol. However, in order to harmonize the sampling rate among the building and floors, the LoRa to MQTT gateway transmitted the received temperature and humidity values every 20 min and a noise value every 5 min to the Node-Red platform. Finally, the collected values were processed and stored every 20 min. This was performed empirically.
3. Results
3.1. Limitations
Despite the fact that the IoT infrastructure started to be deployed in the fall of 2023, it was fully functional and reliably operable by the end of March 2024. Furthermore, the school was open till the first days of June 2024 (a Greek school year starts on the 10th of September and ends on the 10th of June). Moreover, the schools were closed for Easter vacation by the end of April, and then the exam period started; thus, there was no normal function as before. Therefore, the sampling period corresponded to a small portion of the school year. The conducted statistical analysis required the following preprocessing steps:
Sampling period: 2 April 2024–25 April 2024;
Friday 26 April 2024 was not included in the analysis due to the fact that it was a school day of a half period before the Easter break;
All data from the weekends have been removed;
We kept data on weekdays and between 08:00 and 14:00.
It was observed that the sound sensor installed in building 11 (i.e., high school, 1st building, 1st floor) exhibited an offset in its measurements. Specifically, it delivered data recordings greater by about 20 to 35 dBA, depending on the value (in low values the deviation was lower; in high values the offset was higher). In order to check whether the problem had to do with the location, we placed it cyclically in positions 10, 11, 20, and 21 and compared the values it acquired with the rest of the sensors in the same positions. This confirmed the above discrepancy and proved that it was due to the sensor malfunction. The lack of time did not allow for its replacement, and therefore the data were corrected based on a linear interpolation. Specifically, the averages of the minimum and maximum values of the measurements of the remaining sound sensors were calculated. Thus, a minimum and a maximum were obtained, between which the recordings of the problematic sensor were adjusted accordingly.
3.2. Sound Level Measurements and Processing
As already mentioned, noise sampling at the four stations of the school infrastructures (i.e., buildings 10, 11, 20, and 21) considers one measurement every five minutes unless an event of high sound level (>85 dBA) is detected, and therefore, the sampling adjusts to one measurement every second for the whole duration that the event remains active. This is performed to identify and record events of high sound level that otherwise would not have been monitored by the user. Hence, high intensities were not well represented in the final sample, and position measures in the descriptive statistics could give larger—incorrect—values than the real ones, as the statistical processing revealed. To correct this oversampling problem, the data were grouped into five-minute intervals, averages of these five-minute intervals were calculated, and new records were created, where each five-minute interval is represented by the average of the intervals of the measurements. In this case, we have concluded to capture records every five minutes, from which the weighting in favor of high noise levels has been eliminated. That generated a correct and consistent picture of the noise in the school complex.
Table 2 below compares the average values before and after grouping and delineates the correction. Specifically, it is shown how grouping has mitigated the oversampling issue stated before (see column 5-min grouping—calibration frequency—where the improvement of the average values is significant compared to the no-grouping ones). It should be noted that the adoption of fine-grain frequency sampling for capturing the event of high noise is convenient to easily visualize and monitor its activity. However, debating on whether this scheme could be useful to apply for the whole duration of a school day, we concluded to reduce the sampling frequency and the subsequent data transmission due to energy-wise savings in the IoT sensor nodes and storage resource limitations in the cloud platform. Additionally, it should be emphasized that when a low-cost sensor exhibits significant deviation from actual measurements, and software adjustments fail to resolve the issue, it is more cost-effective to replace the sensor. This is because the cost of repairing and maintaining such a sensor is typically higher than purchasing a new one.
It is denoted that Station 30, which was placed in the senior high school, did not cause noise overestimation due to the fact the sampling rate remained constant (one measurement every five minutes). Therefore, as can be noticed in
Table 2, no deviations were identified. However, for clarity reasons, we also performed data annotation by grouping in five-minute intervals, which, of course, led to the same measurement results. One would debate why we did not follow the same approach for all stations. The main reason is that we wanted to provide detailed visualizations and study the spectrum of noise in case of an event for its whole duration (e.g., spikes, sensor errors, noise from machines, noise generated by pupils). It is obvious that sound can fluctuate greatly in a short period while appearing sporadically, so dense sampling is needed (5 min or more often if necessary). On the contrary, we do not expect significant changes, e.g., temperature within a few minutes; thus, we record values in longer periods (20 min) so that, without losing accuracy, we have short data flows in the network to minimize the storage requirements. Thus, sampling was configured at a different rate depending on the measurement variable. In order to derive homogeneous data that can be classified and compared accurately, an additional grouping was performed every hour (60 min). Therefore, we offline transformed data of all measuring stations and created representations for their hourly average values. It is denoted that this per-hour group was performed for the temperature, relative humidity, and PM values, and their school day variations were significantly low.
3.3. Noise Analysis
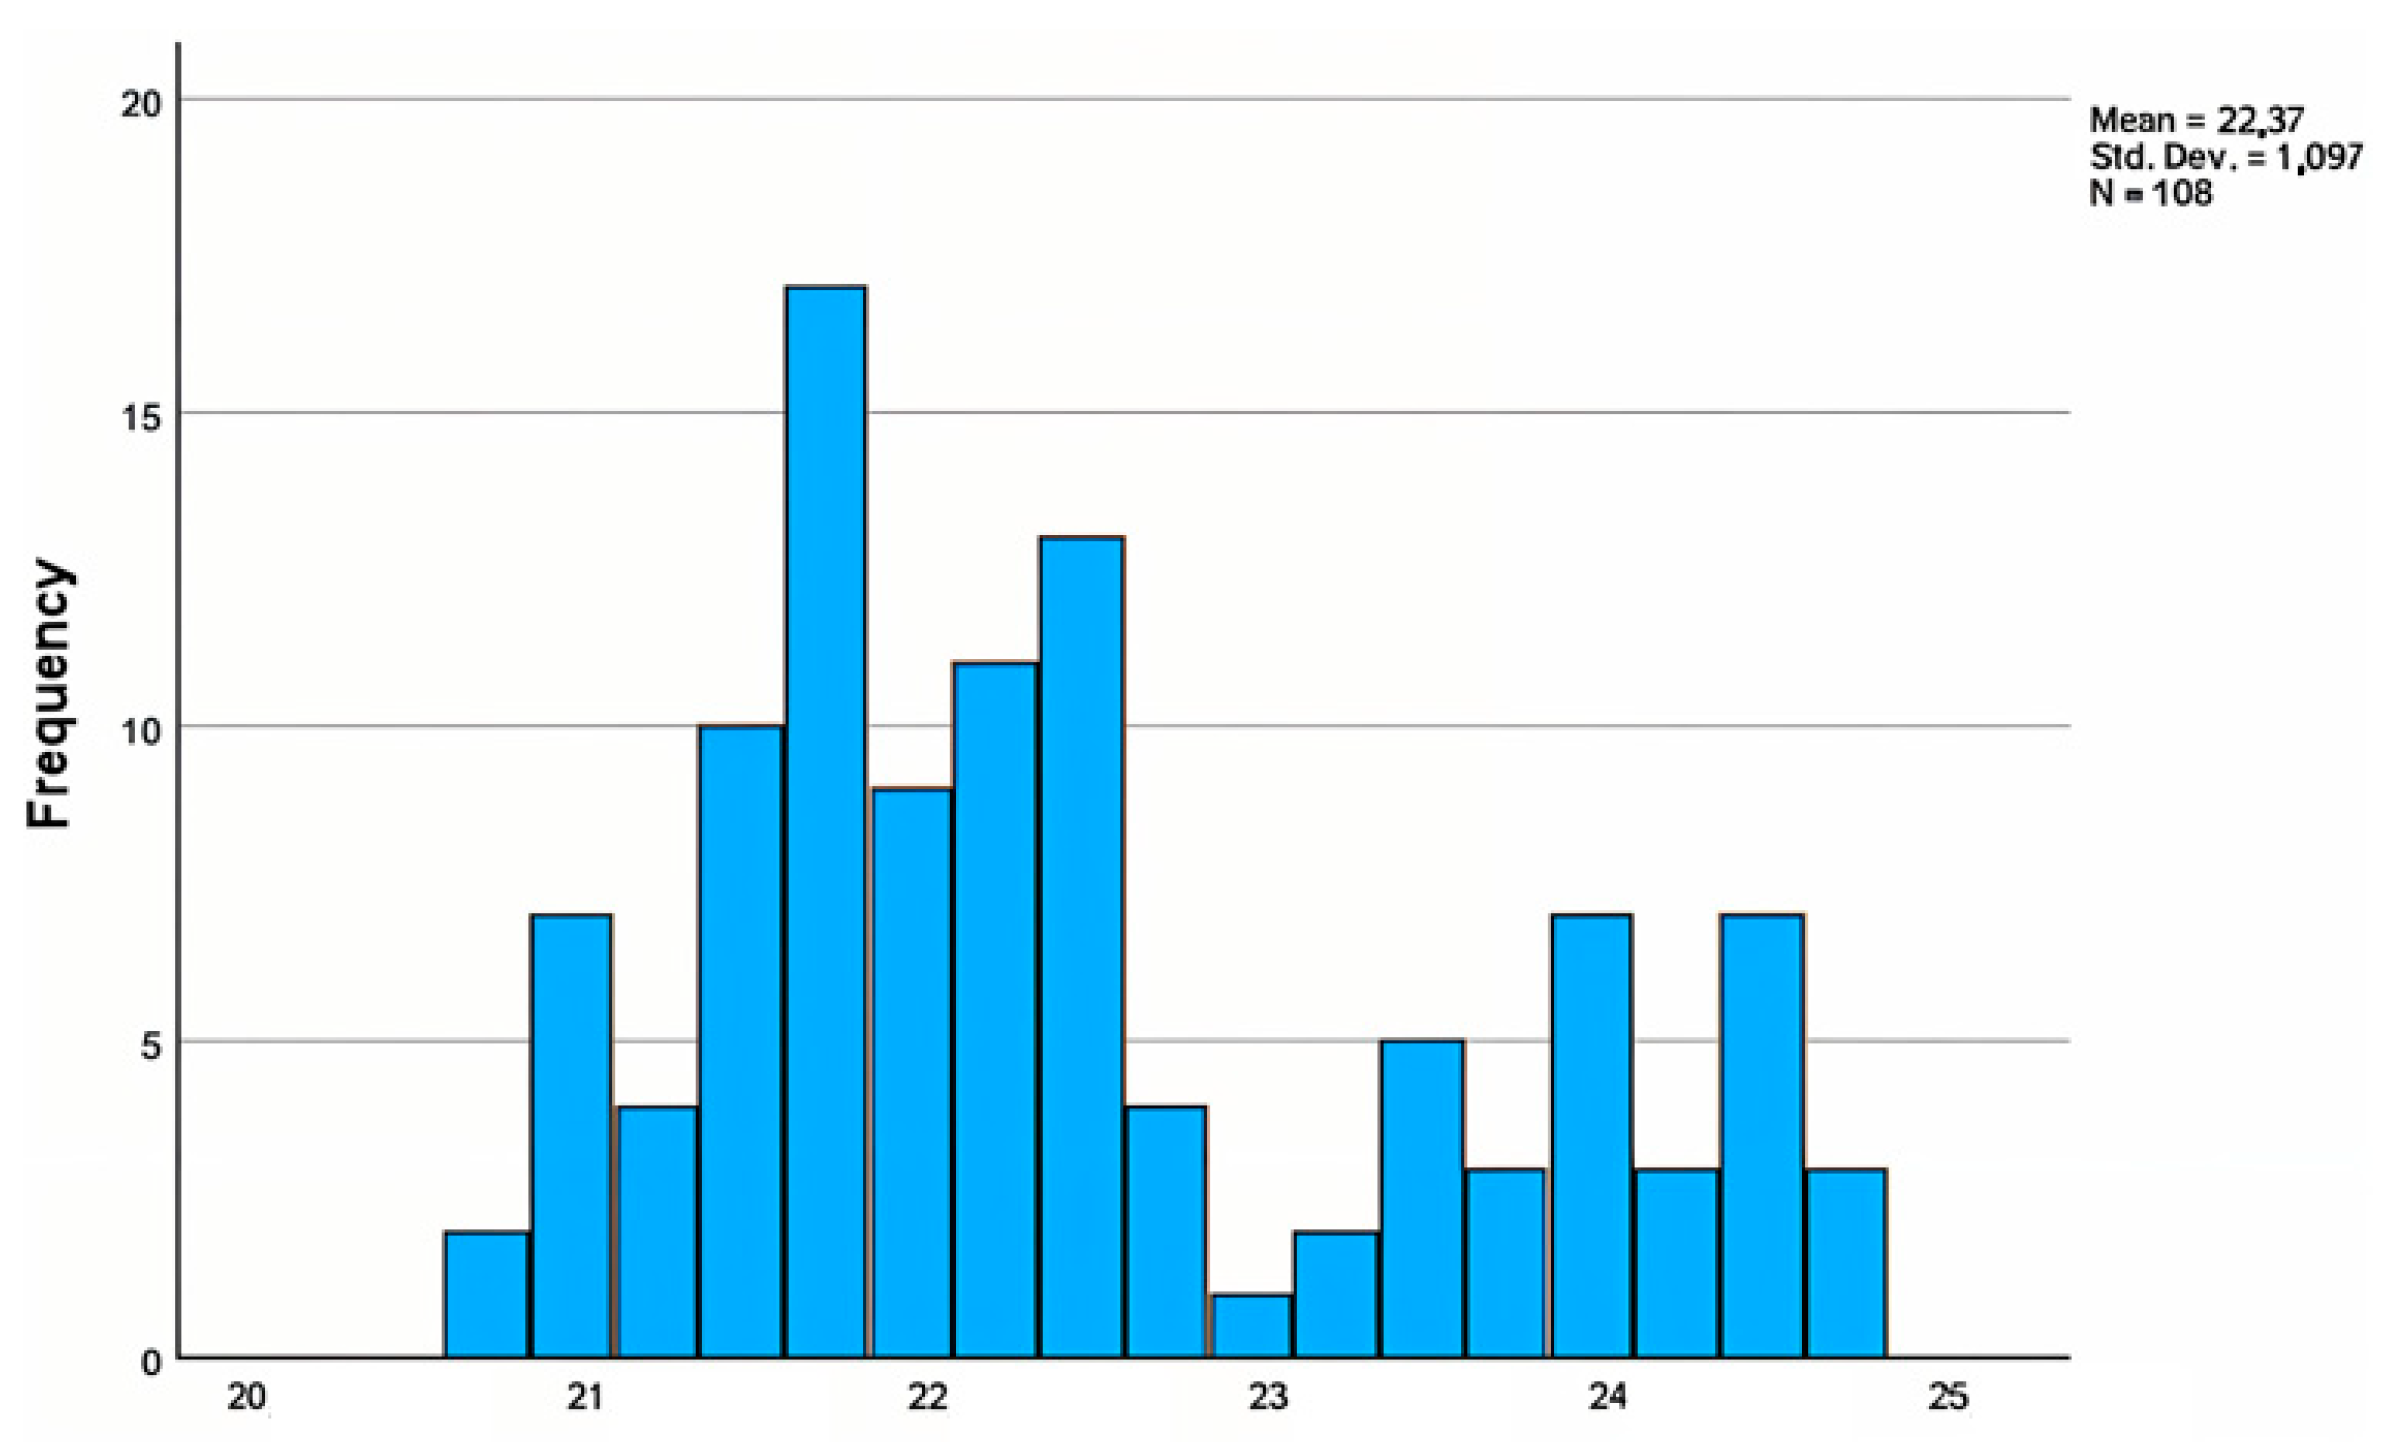
The grouping of the noise measurements was performed in the intervals [08:00–08:05), [08:05–08:10), etc., until [13:55–14:00] for each one of the weekdays. Each interval is represented by the mean value.
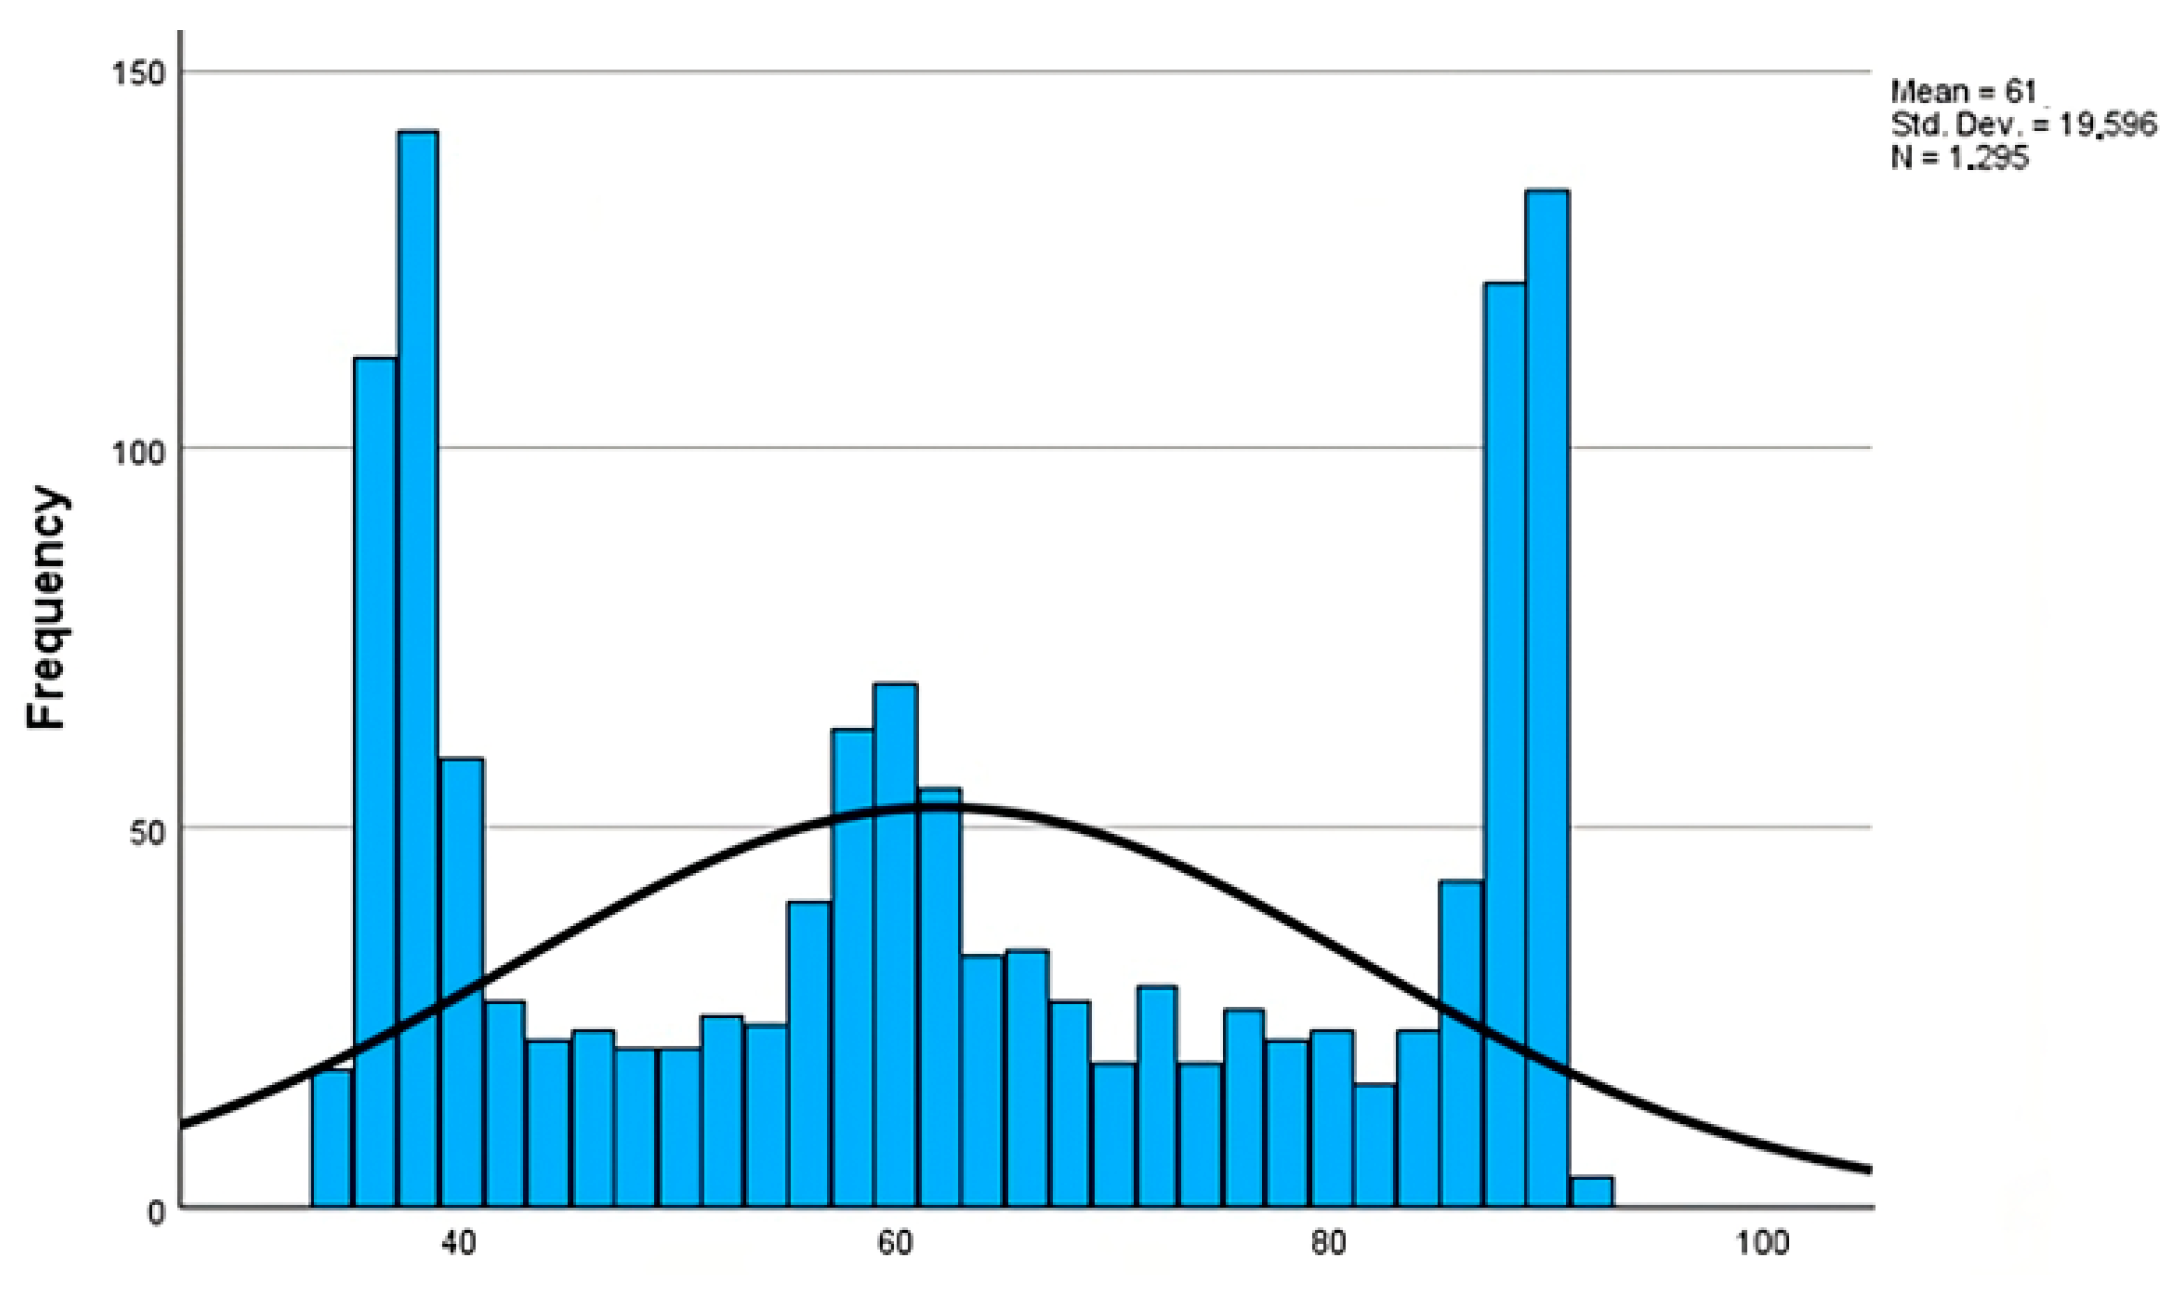
Table 3 shows the noise characteristics, while
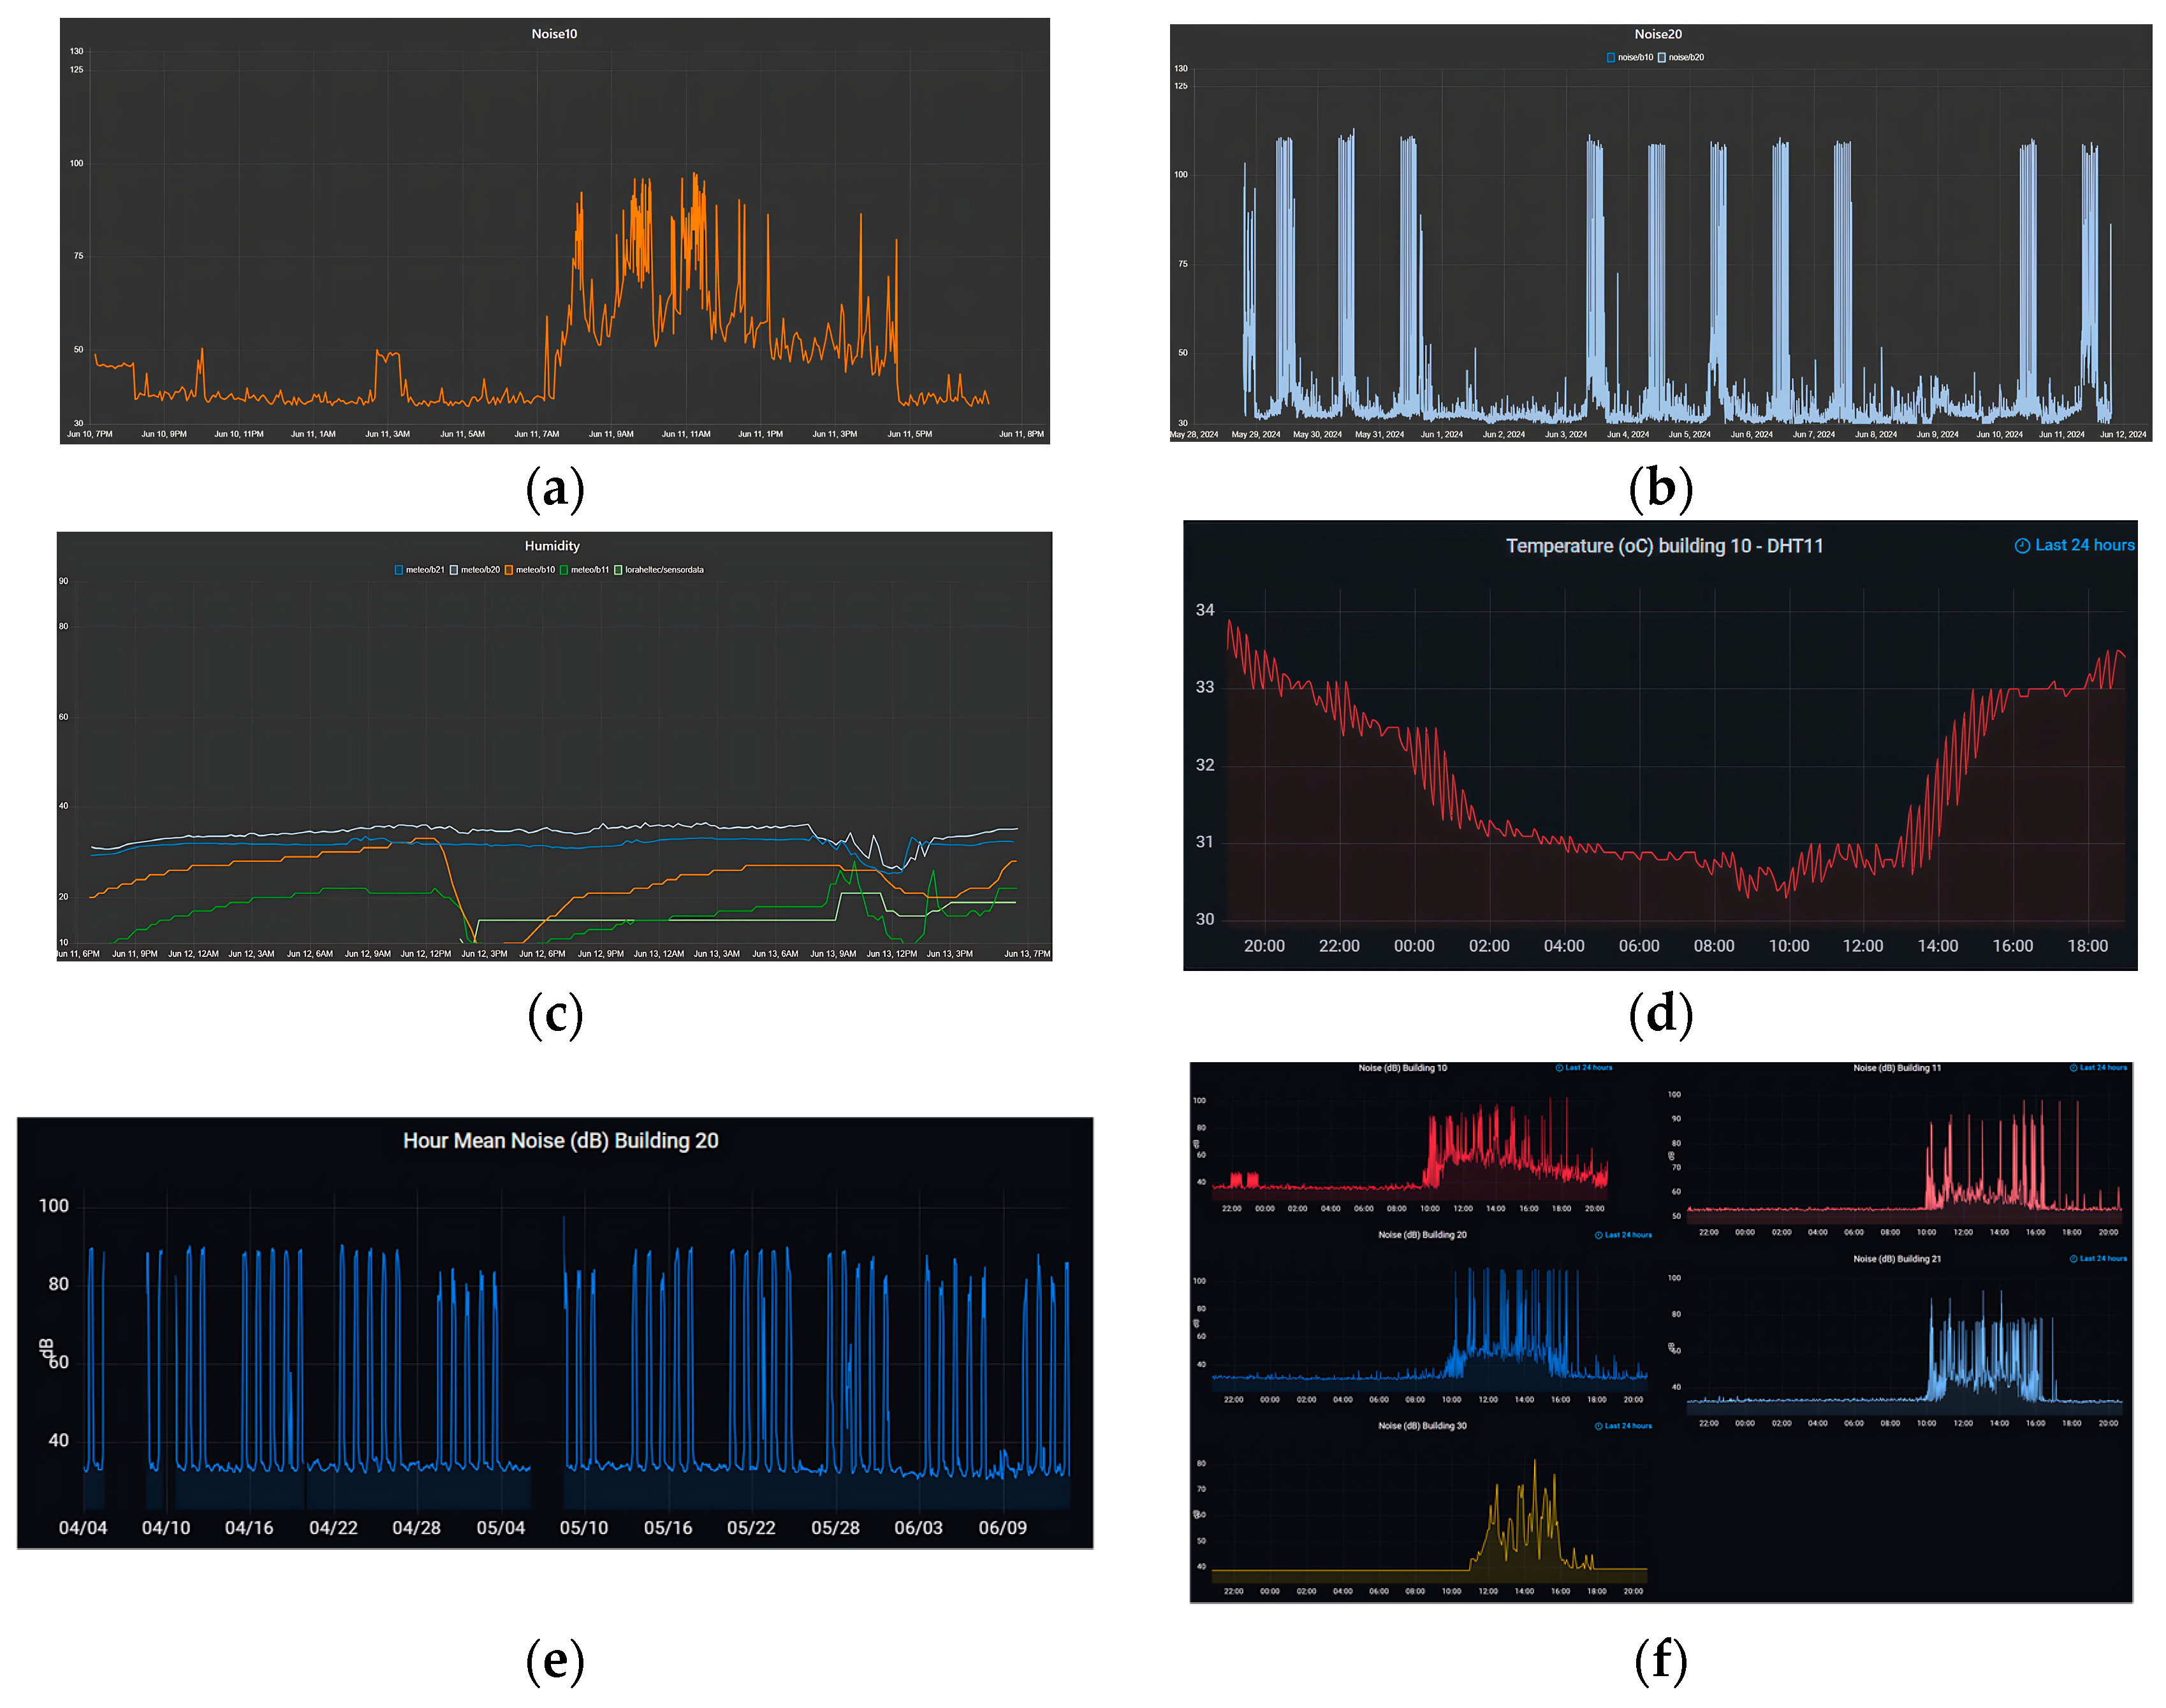
Figure 10 depicts the histogram with the distribution of noise values in building B10.
It is obvious—as expected, due to the nature of the data—that the values do not follow a normal distribution. Experience has shown that high schools are generally noisier than senior high schools.
Table 2 above verifies this empirical assessment. It should be noted that in senior high school there was not a single instantaneous recording greater than or equal to 100 dBA, while in high school such intensities were recorded by all measuring stations, as shown in
Table 4.
In the above tables, we observed that there were significant differences in the number of measurements (missing data). There were three reasons for this, which are as follows:
3.4. Analysis of Temperature, Humidity, and PM Measurements
Table 5,
Table 6 and
Table 7 present the statistical characteristics (non-grouped version) of the measurements that concern the data received from the temperature, humidity, and particulate matter (PM) concentration (air pollutant) sensors. The analysis confirms the experiential knowledge that in the higher floors of the same building, we expect higher temperature values (B11, B10: 24.06 °C > 22.42 °C and B21, B20: 26.60 °C > 25.60 °C) and lower humidity values (Β11, Β10: 33.82% < 38.19% and Β21, Β20: 41.62% < 42.69%).
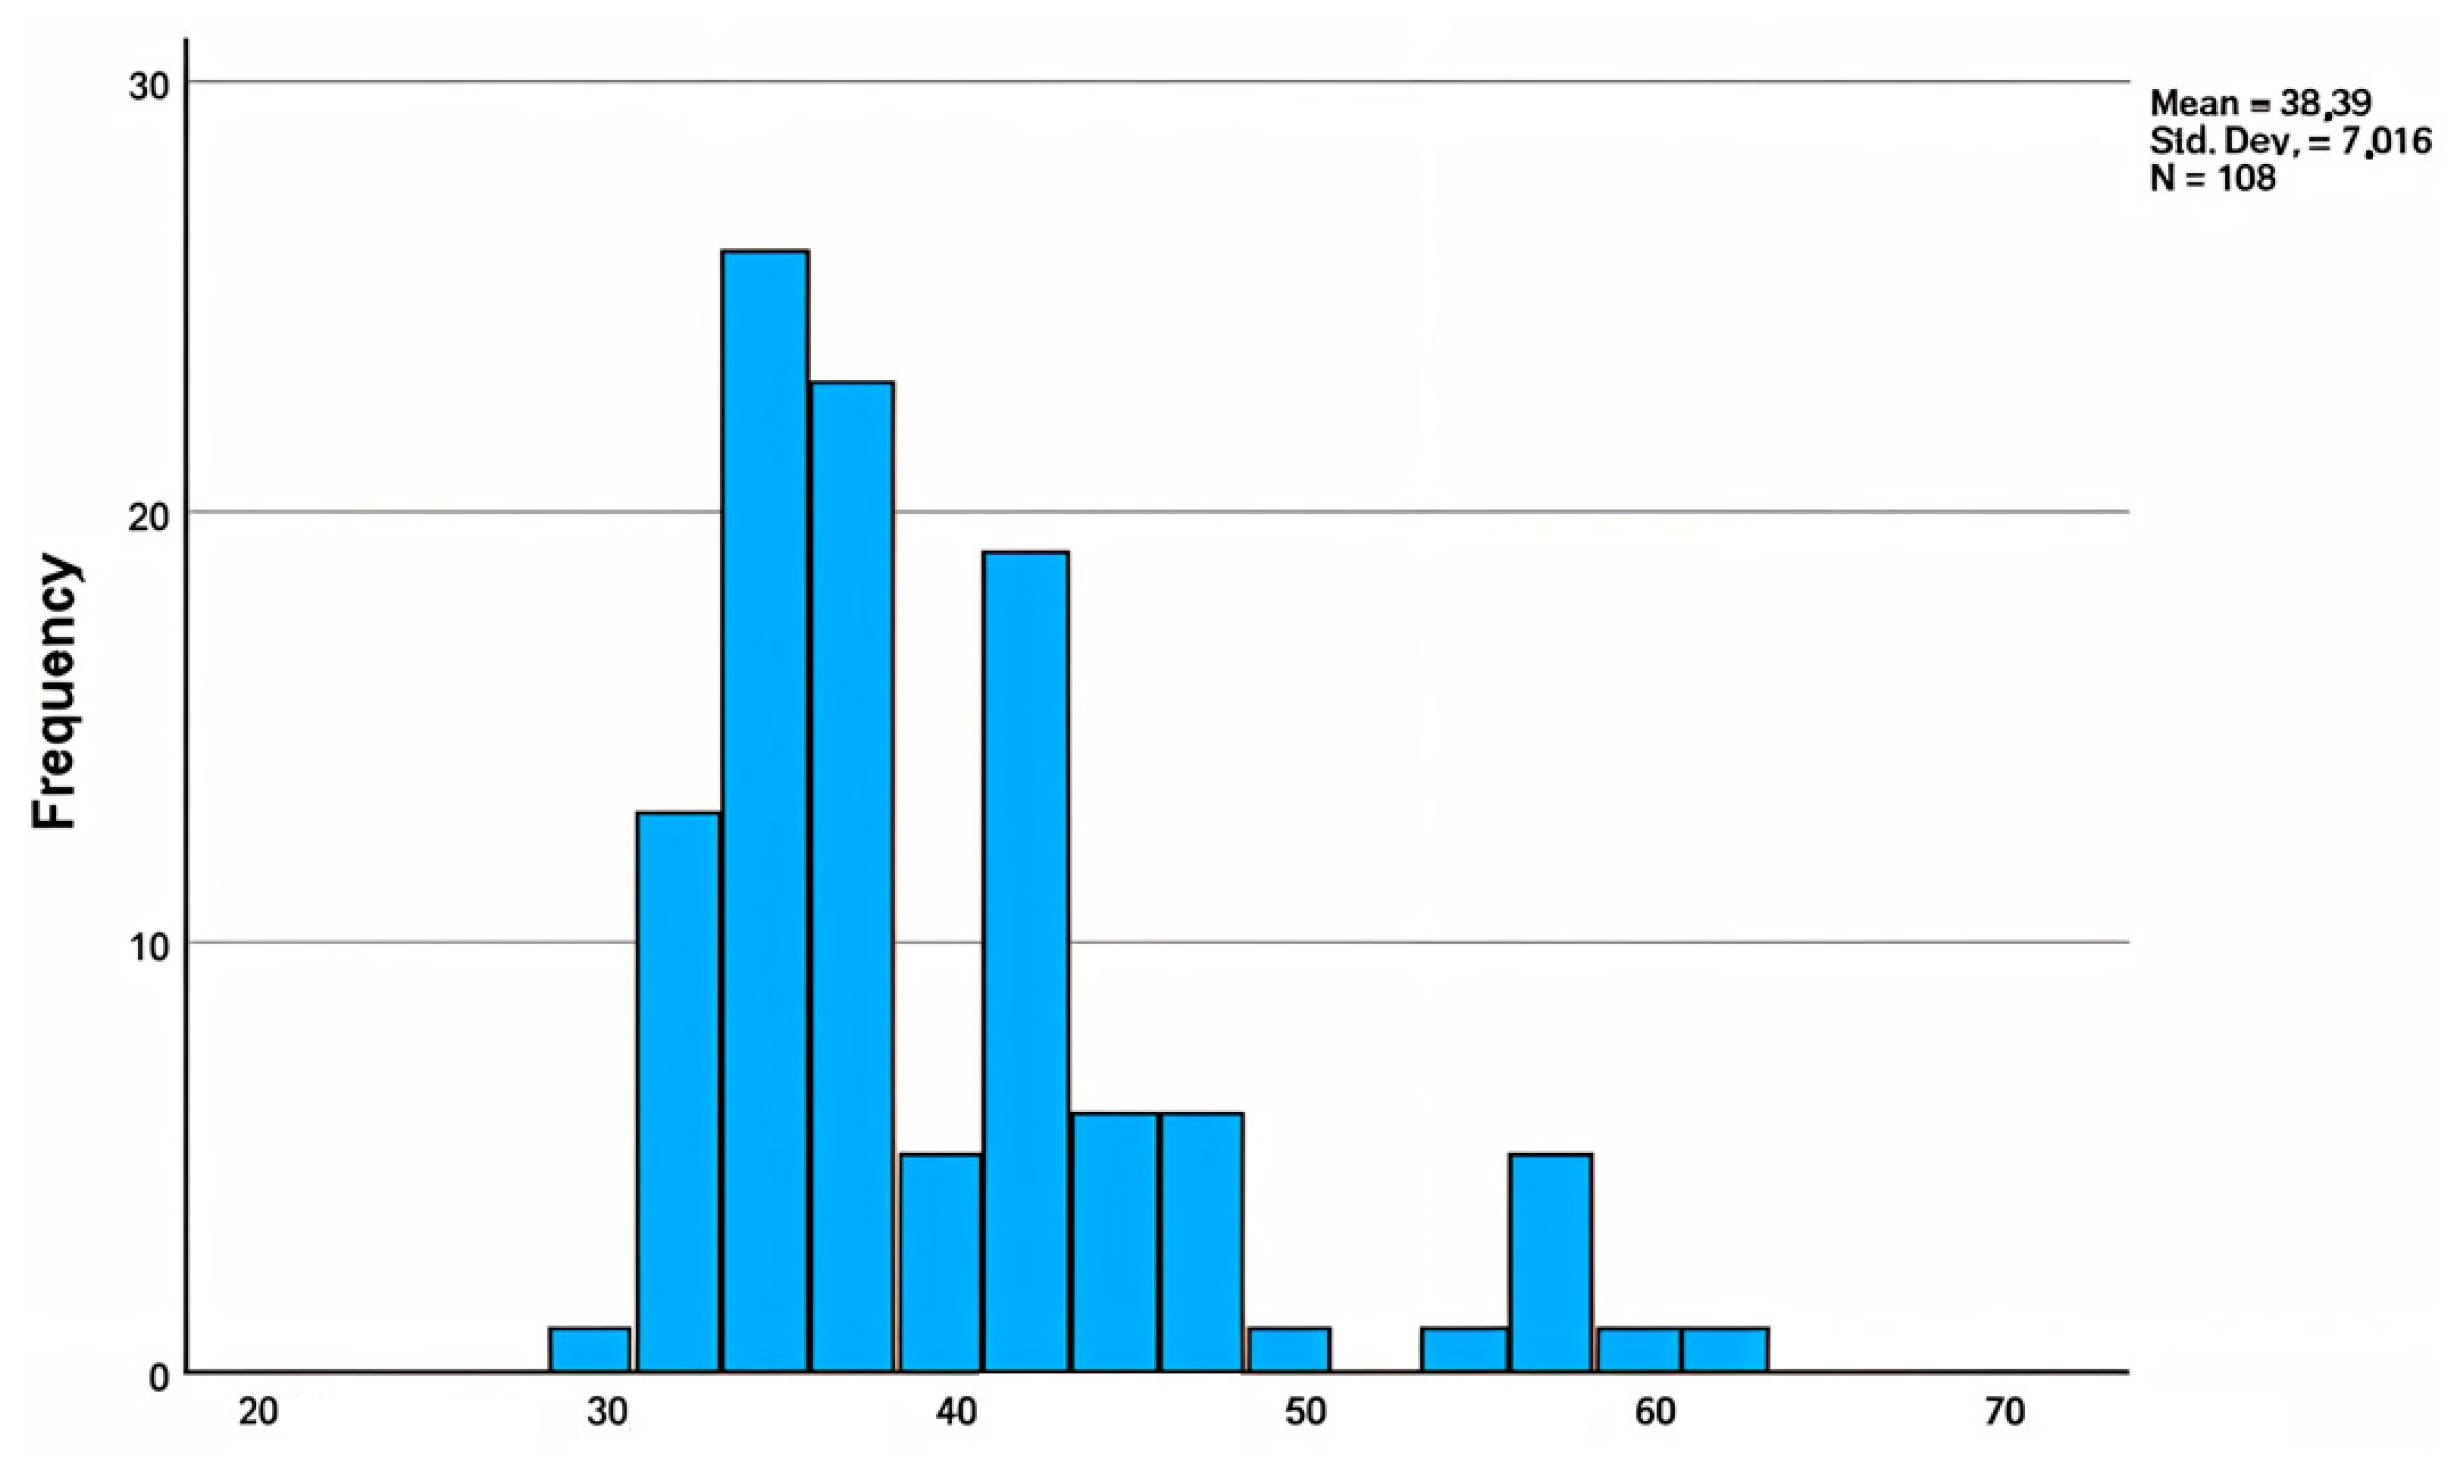
3.5. Analysis of Grouped per Hour Measurements
We performed per-hour grouping at six timing intervals [08:00–09:00), [09:00–10:00), [10:00–11:00), [11:00–12:00), [12:00–13:00), and [13:00–14:00] for each one of the weekdays. Each interval is represented by the mean and median values of the measurements it includes.
Table 8,
Table 9,
Table 10 and
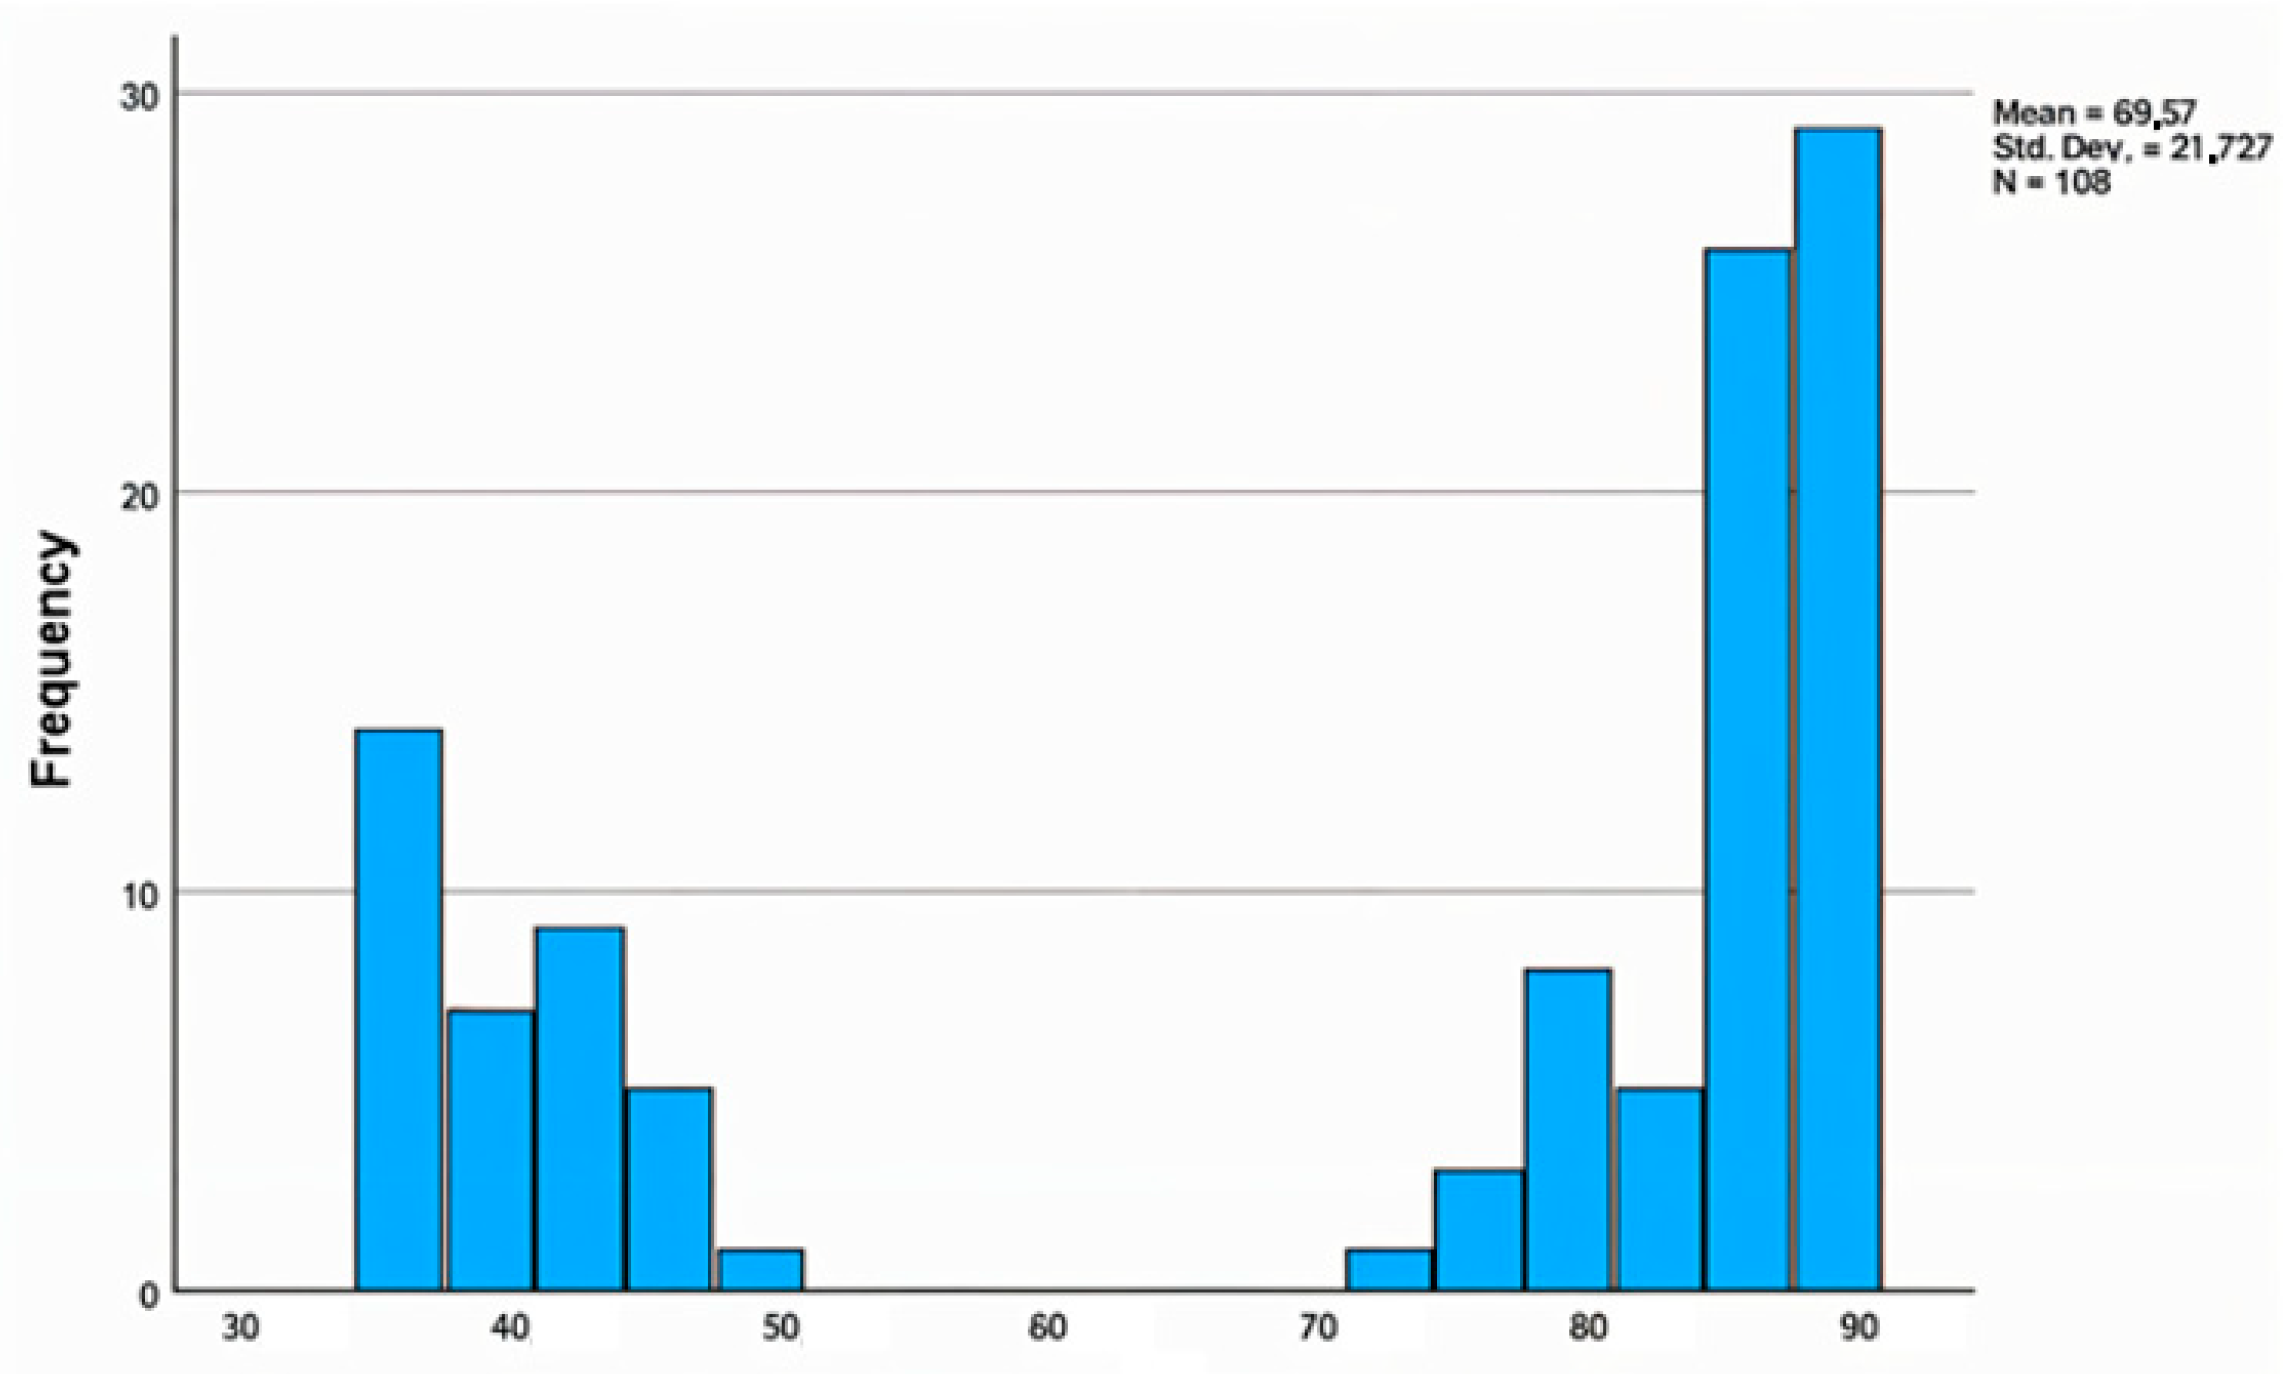
Table 11 show the output of our analysis, while
Figure 11,
Figure 12 and
Figure 13 illustrate the sensor value histograms for specific buildings.
3.6. Comparisons
As can be deduced from the histograms, the data do not follow a normal distribution. Thus, nonparametric tests were selected for the statistical study: the Kruskal–Wallis H test [
28] for overall comparisons and the Mann–Whitney U test [
29] for two-sample comparisons. The data grouped by hour were used.
Specifically, the Kruskal–Wallis H test has resulted that noise intensity differs from building to building (H(4) = 114.365, p < 0.001). The corresponding Mann–Whitney U test was then executed to compare the noise intensity between buildings B10 and B11, which resulted in a statistically significant difference for the noise between the two buildings, z = 2801.00, p < 0.001. Similarly, the Mann–Whitney U test was executed to compare the intensity of noise between the B20 and B21 buildings. The outcome produced a statistically significant difference for the noise between the two buildings, z = 2469.00, p < 0.001. Finally, the Mann–Whitney U test was accomplished to compare the intensity of noise between the B10 and B30 buildings, which again resulted in a statistically significant difference for the noise between the two buildings, z = 2152.00, p < 0.001.
We followed the same approach for the temperature and the humidity values. The H test showed that both temperature and humidity values differentiate among buildings (H(4) = 131.657 and p < 0.001, H(4) = 77.576 and p < 0.001, respectively). The U test for temperature comparisons between buildings B10 and B11 revealed a statistically significant difference (z = 9141.00, p < 0.001). Equivalent results were obtained when we compared the temperature values between buildings B20 and B21 (z = 7143.00, p < 0.001) and between B10 and B30 (z = 6425.00, p < 0.001). The U test execution for the relative humidity values led to similar results for buildings Β10 and Β11: z = 3697.50—p < 0.001, while it did not output a statistically significant difference for the other building comparisons (Β20 and Β21: z = 4493.50—p = 0.862, Β10 and Β30: z = 3959.00, p < 0.131).
Furthermore, we conducted an analysis to identify the evolvement of the intensity of the noise per hour throughout the school complex. The H test showed (
Table 12) that the noise intensity varies during the working day, H(5) = 232.851,
p < 0.001. The 1st hour is “quieter” than the 3rd (
p = 0.000), the 4th (
p = 0.000), the 5th (
p = 0.000), and the 6th hour (
p = 0.000). Correspondingly, the 2nd hour is also “quieter” than the next ones, and so on. Despite, as already mentioned, the sample being relatively short, the statistical results confirm some empirical conclusions that a trained educational professional would draw.
In particular:
On the highest floors we have higher temperature and lower humidity;
High school is noisier than the senior high school;
The noise intensity evolves during the hours. That is, the early hours are quieter and the last noisy;
During the breaks the noise (20% of a regular school day) is much higher and exceeds the WHO limits (external noise in school yards should not exceed 55 dBA [
3]);
Noise levels increase during the mid-day, when pupils tend to be more active;
4. Discussion
The total cost for the construction of the IoT stations by using off-the-shelf components was approximately EUR 700, a low-cost construction that required trimming in order to work properly and accurately. On the contrary, the implemented IoT platform was based on open-source solutions. The whole IoT infrastructure that was designed and deployed could be part of a pilot application operating in parallel with the similar work carried out in other regions of Greece [
6], suitable for training, research, and technology workshops at all levels of education. It can be easily implemented and reproduced in both primary and academic education environments. Much and various research could be performed on the working conditions of teachers and students and how noise levels affect their health and performance. In general, it could further explore whether the learning process and school productivity could also be affected. The statistics developed in this work are a small example of a research approach.
Furthermore,
Table 13 summarizes and compares the associated results presented in [
4,
5,
6] regarding noise level measurements in Greek schools with the findings of the current study. Our results complement previous studies and highlight the urgent need for substantial reforms inside school buildings. Specifically, it is shown that although the improvements to the buildings were made, the problem persists indoors, and similarly, the sound level increases towards the end of the school day. This impacts teachers’ performance during their rest time in breaks.
Moreover, the nature of the technology used and the design followed sustain a flexible IoT architecture that could be easily expanded and cover buildings that do not support Wi-Fi access to the internet via LoRa communication protocols. Extensions could be performed both in size and in functionality. Furthermore, the IoT sensors support development boards that easily integrate other environmental sensors (e.g., CO2 sensors, NO2 sensors, etc.) or actuators, which eventually respond to relevant events depending on the values. For instance, in a human gathering area (classroom, waiting area, etc.), the levels of carbon monoxide (CO) can be measured, and when they exceed a limit, the windows or ventilation automatically open (e.g., HVAC systems). Also, an alarm could be added to the implemented network to display a notice when the noise exceeds a limit, according to the relevant WHO recommendations and guidelines.
It should be noted that the buildings where the network was installed had been energy upgraded recently during the year 2022 [
30] in order to reduce their energy footprint. Teachers and auxiliary staff have noticed the produced result in the sense that there is a significant improvement in the environmental working conditions after this upgrade. Since the energy upgrading of school buildings continues in Greece, not only could the deployed IoT infrastructure assess this upgrade, but also it can measure the noise isolation level. Specifically, it could assist during the upgrades to improve noise immunity.
The high level of noise is an issue of concern among all teachers in secondary and primary education, which is considered to be particularly important in the case of an explosion over a long period. The data we have collected revealed that many times during the working day, the level of noise goes beyond the upper limits set by national and EU legislation and WHO recommendations. The noise recording sensor network installation, piloted in some school complexes, would help systematically record and lead to actions to mitigate the noise through the facilitation of proper insulation installations. To this end, this could identify the magnitude of the problem and create a “noise map” to design and implement interventions to address it. Definitely an interdisciplinary collaboration among teachers, engineers, and municipality authorities could boost the adoption of strategies for noise mitigation in schools, resulting in beneficial learning environments. These noise reduction strategies could include campaigns to deploy soundproofing materials during energy upgrade processes, the addition of plants in certain positions indicated by specialists, and the interior redesign of classrooms and teachers’ offices [
2,
3,
15].
Future work involves deploying the proposed infrastructure to additional schools in the area, along with further improvements to the architecture. This includes the integration of more IoT sensor nodes with enhanced energy autonomy across more school buildings, aimed at identifying potential common noise patterns in schools throughout the region. Specifically, long short-term memory networks to address seasonal time-series data are suitable in this case. Furthermore, to evaluate teachers’ well-being, it will be necessary to involve specialists in the future. Using targeted interviews and questionnaires, they will assess the impact of noise.


