Article

How Time Window Influences Biometrics Performance: An EEG-Based Fingerprint Connectivity Study

1
Department of Electrical and Electronic Engineering, University of Cagliari, Via Marengo 2, 09123 Cagliari, Italy
2
Department of Medical Science and Public Health, University of Cagliari, 09123 Cagliari, Italy
*
Author to whom correspondence should be addressed.
Signals 2024, 5(3), 597-604; https://doi.org/10.3390/signals5030033
Submission received: 28 June 2024 / Revised: 23 August 2024 / Accepted: 14 September 2024 / Published: 18 September 2024

Abstract

:
EEG-based biometrics represent a relatively recent research field that aims to recognize individuals based on their recorded brain activity using electroencephalography (EEG). Among the numerous features that have been proposed, connectivity-based approaches represent one of the more promising methods tested so far. In this paper, using the phase lag index (PLI) and the phase locking value (PLV) methods, we investigate how the performance of a connectivity-based EEG biometric system varies with respect to different time windows (using epochs of different lengths ranging from 0.5 s to 12 s with a step of 0.5 s) to understand if it is possible to define the optimal duration of the EEG signal required to extract those distinctive features. All the analyses were performed on two freely available EEG datasets, including 109 and 23 subjects, respectively. Overall, as expected, the results have shown a pronounced effect of the time window length on the biometric performance measured in terms of EER (equal error rate) and AUC (area under the curve), with an evident increase in the biometric performance as the time window increases. Furthermore, our initial findings strongly suggest that enlarging the window size beyond a specific maximum threshold fails to enhance the performance of biometric systems. In conclusions, we want to highlight that EEG connectivity has the potential to represent an optimal candidate as an EEG fingerprint and that, in this context, it is essential to establish an adequate time window capable of capturing subject-specific features. Furthermore, we speculate that the poor performance obtained with short time windows mainly depends on the difficulty of correctly estimating the connectivity metrics from very small EEG epochs (shorter than 8 s).

1. Introduction

EEG-based biometrics represent a relatively recent research field that aims to recognize individuals based on their recorded brain activity using electroencephalography (EEG). Even though it is still in the development phase, several reviews [1,2,3,4,5] have already been published, which have the merit of describing in detail the evolutions, progress, and achievements of this promising research theme.
EEG-based biometrics are strictly related to the more specific topic of evaluating individual fingerprints, which involves using several different neuroimaging techniques, such as functional magnetic resonance imaging (fMRI) and magnetoencephalography (MEG), of a human connectome [6]. During the last few years, there has been growing evidence that EEG signals, which reflect neural responses to various kinds of stimuli, including resting state activity, can be successfully used to derive distinctive features to develop high-performance, secure, and robust biometric recognition systems [2,5,7,8], thus representing a possible new method to more classical individual recognition and authentication approaches [9]. In the context of the EEG biometric system, among the numerous features proposed to investigate how the EEG signals behave in terms of brain fingerprint, connectivity-based approaches [10] represent one of the more promising methods tested so far [11,12,13,14]. In particular, phase-based connectivity methods, which allow the estimation of the correlation between different EEG channels (or the corresponding reconstructed sources) based on the phase synchronization of EEG signals, outperformed other connectivity and power-based approaches [11,15], thus representing a valid solution to develop high-performance EEG biometric systems. In this context, the PLI (phase lag index) [16] and the PLV (phase locking value) [17] connectivity methods have shown to be good candidates as EEG-based features to recognize individuals in several experimental scenarios [11,12,15].
Despite their broad application and inherent advantages over more common biometrics, EEG-based biometric systems still have some severe drawbacks, including, but not limited to, the need for standardized pipelines for the analysis [2]. In particular, it has been previously reported that the definition of the EEG time window represents a crucial issue in the EEG analysis [18] and should be considered a fundamental point when defining experimental protocols for MEG and EEG studies. More specifically, the time window length, namely the epoch length, may strongly affect several EEG features, especially those based on connectivity methods [19,20], both at the scalp and source level. These studies have highlighted that shorter epochs show less clear and more blurred connectivity patterns when compared with those obtained for longer epochs. On the other hand, understanding the optimal time window in an EEG biometric system is of huge interest because it allows one to define, at least for brain signals, the minimum required amount of time necessary to have the system properly working with satisfactory performance. In this paper, we investigate how the performance of an EEG biometric system, based on two commonly and widely used phase connectivity methods, varies with respect to different time windows with the aim to understand if, at least for EEG fingerprint approaches, it is possible to define the optimal duration of EEG signal that can be used to extract those distinctive features. We evaluated our hypothesis using a public EEG dataset [21] consisting of recordings from 109 subjects acquired with a high-density EEG system that can be downloaded at the following link: (http://physionet.org/pn4/eegmmidb/, accessed on 28 May 2024). The analysis was performed using both eyes-closed and eyes-open resting state conditions, which have been previously shown to be able to develop high-performance EEG biometric systems [12]. Moreover, with the aim of making our results more generalizable, we replicated the whole analysis using another freely available EEG dataset, namely the DREAMER dataset [22], which was previously used to understand if the aperiodic component of the power spectrum can capture subject-specific features in a naturalistic stimuli scenario [23]. Finally, we also discuss the implications and limitations of this analysis, suggesting directions for future work related to this challenging research field.

2. Materials and Methods

2.1. The Datasets

In this study, we used two different freely available EEG datasets: the EEG Motor Movement/Imagery Dataset [21] and the DREAMER dataset [22]. The EEG Motor Movement/Imagery Dataset is a high-density EEG dataset (consisting of 64 channels) that is publicly and freely accessible and includes recordings from 109 healthy subjects. The raw data are available on the PhysioNet website (http://physionet.org/pn4/eegmmidb/, accessed on 28 May 2024). This dataset has been previously employed for brain–computer interfaces and biometric applications. The EEG signals were acquired with a sampling rate of 160 Hz, referenced to the average of the ear-lobe electrodes, and organized into several runs involving resting state, motor movement, and imaginary tasks. For the aim of the present study and analysis, we selected the two resting state runs (eyes open and eyes closed), each lasting 1 min. The DREAMER database is a multi-modal dataset that includes electroencephalogram (EEG) data from a 14-channel system and electrocardiogram (ECG) signals, collected during emotional stimulation through audio-visual content. Data was gathered from 23 participants, who also provided self-assessments of their emotional states after each stimulus, rating valence, arousal, and dominance. The signals were recorded using portable, wearable, wireless, and low-cost off-the-shelf equipment, demonstrating the potential for integrating affective computing techniques into everyday applications. The subjects under examination were shown 18 film clips that aimed to trigger different emotional states and a ‘neutral’ clip to help the subject return to a neutral emotional state. For the intent of this study, we used the EEG signals acquired during the first minute of each of the 18 acquisitions made while watching the ‘neutral’ clip.

2.2. Pre-Processing

The raw EEG signals were band-pass filtered (without phase distortion [24]) using high beta (20–30 Hz) and gamma (30–45 Hz) frequency bands since, as previously reported, the other frequency contents did not show relevant results in the context of EEG fingerprinting [11]. Successively, for each subject and separately for each frequency band, the following steps were performed: (i) epoch segmentation, (ii) functional connectivity analysis (using both PLI and PLV methods), and (iii) performance evaluation.

2.3. Epoch Segmentation

In order to test our hypothesis, the preprocessed signals were organized into epochs of different lengths, ranging from 0.5 s to 12 s with a step of 0.5 s, thus obtaining 24 different time window sizes. All the subsequent analyses were performed separately for these different time windows.

2.4. Functional Connectivity Analysis

This step was performed by evaluating pair-wise statistical interdependence between EEG signals using the PLI (phase lag index) [16] and the PLV (phase locking value) [17] methods. The PLI is an index of asymmetry of the distribution of instantaneous phase differences between EEG channels. Its values range from 0 (no interaction or interaction with zero phase lag) to 1 (maximum interaction), and it is robust to signal spreads, linear mixing, and active references. The PLV detects transient phase locking values, independent of the signal amplitude, and represents the absolute value of the mean phase difference between the two EEG channels.

2.5. Performance Evaluation

In a hypothetical scenario of user authentication, we used a feature vector containing the connectivity values (for PLI and PLV separately), extracted using the upper triangular part of the correlation matrix to compute the biometric performance. As previously reported [12,25], pair-wise similarity scores between feature vectors were estimated as 1/(1 + d), where d represents the Euclidean distance. Genuine and impostor score distributions were finally used to compute the equal error rate (EER) and the area under the ROC curve (AUC), which allowed us to assess the performance for each band, each condition, and each time window. In particular, the EER is a standard measure to summarize the performance of a biometric system. Considering the False Reject Rate (FRR), the percentage of times that a legitimate subject is incorrectly recognized as an imposter by the system, and the False Accept Rate (FAR), the percentage of imposters incorrectly recognized as genuine by the system, the EER represents the system’s error when the FRR equals the FAR. Lower values of EER indicate better classification performance.
Although in the traditional ROC curve, where a True Positive Rate (TPR) is plotted against a False Positive Rate (FPR), a higher AUC indeed indicates better performance. In the biometric context, the ROC curve here refers to a plot of False Accept Rate (FAR) versus False Reject Rate (FRR), where a lower AUC reflects better performance.

3. Results

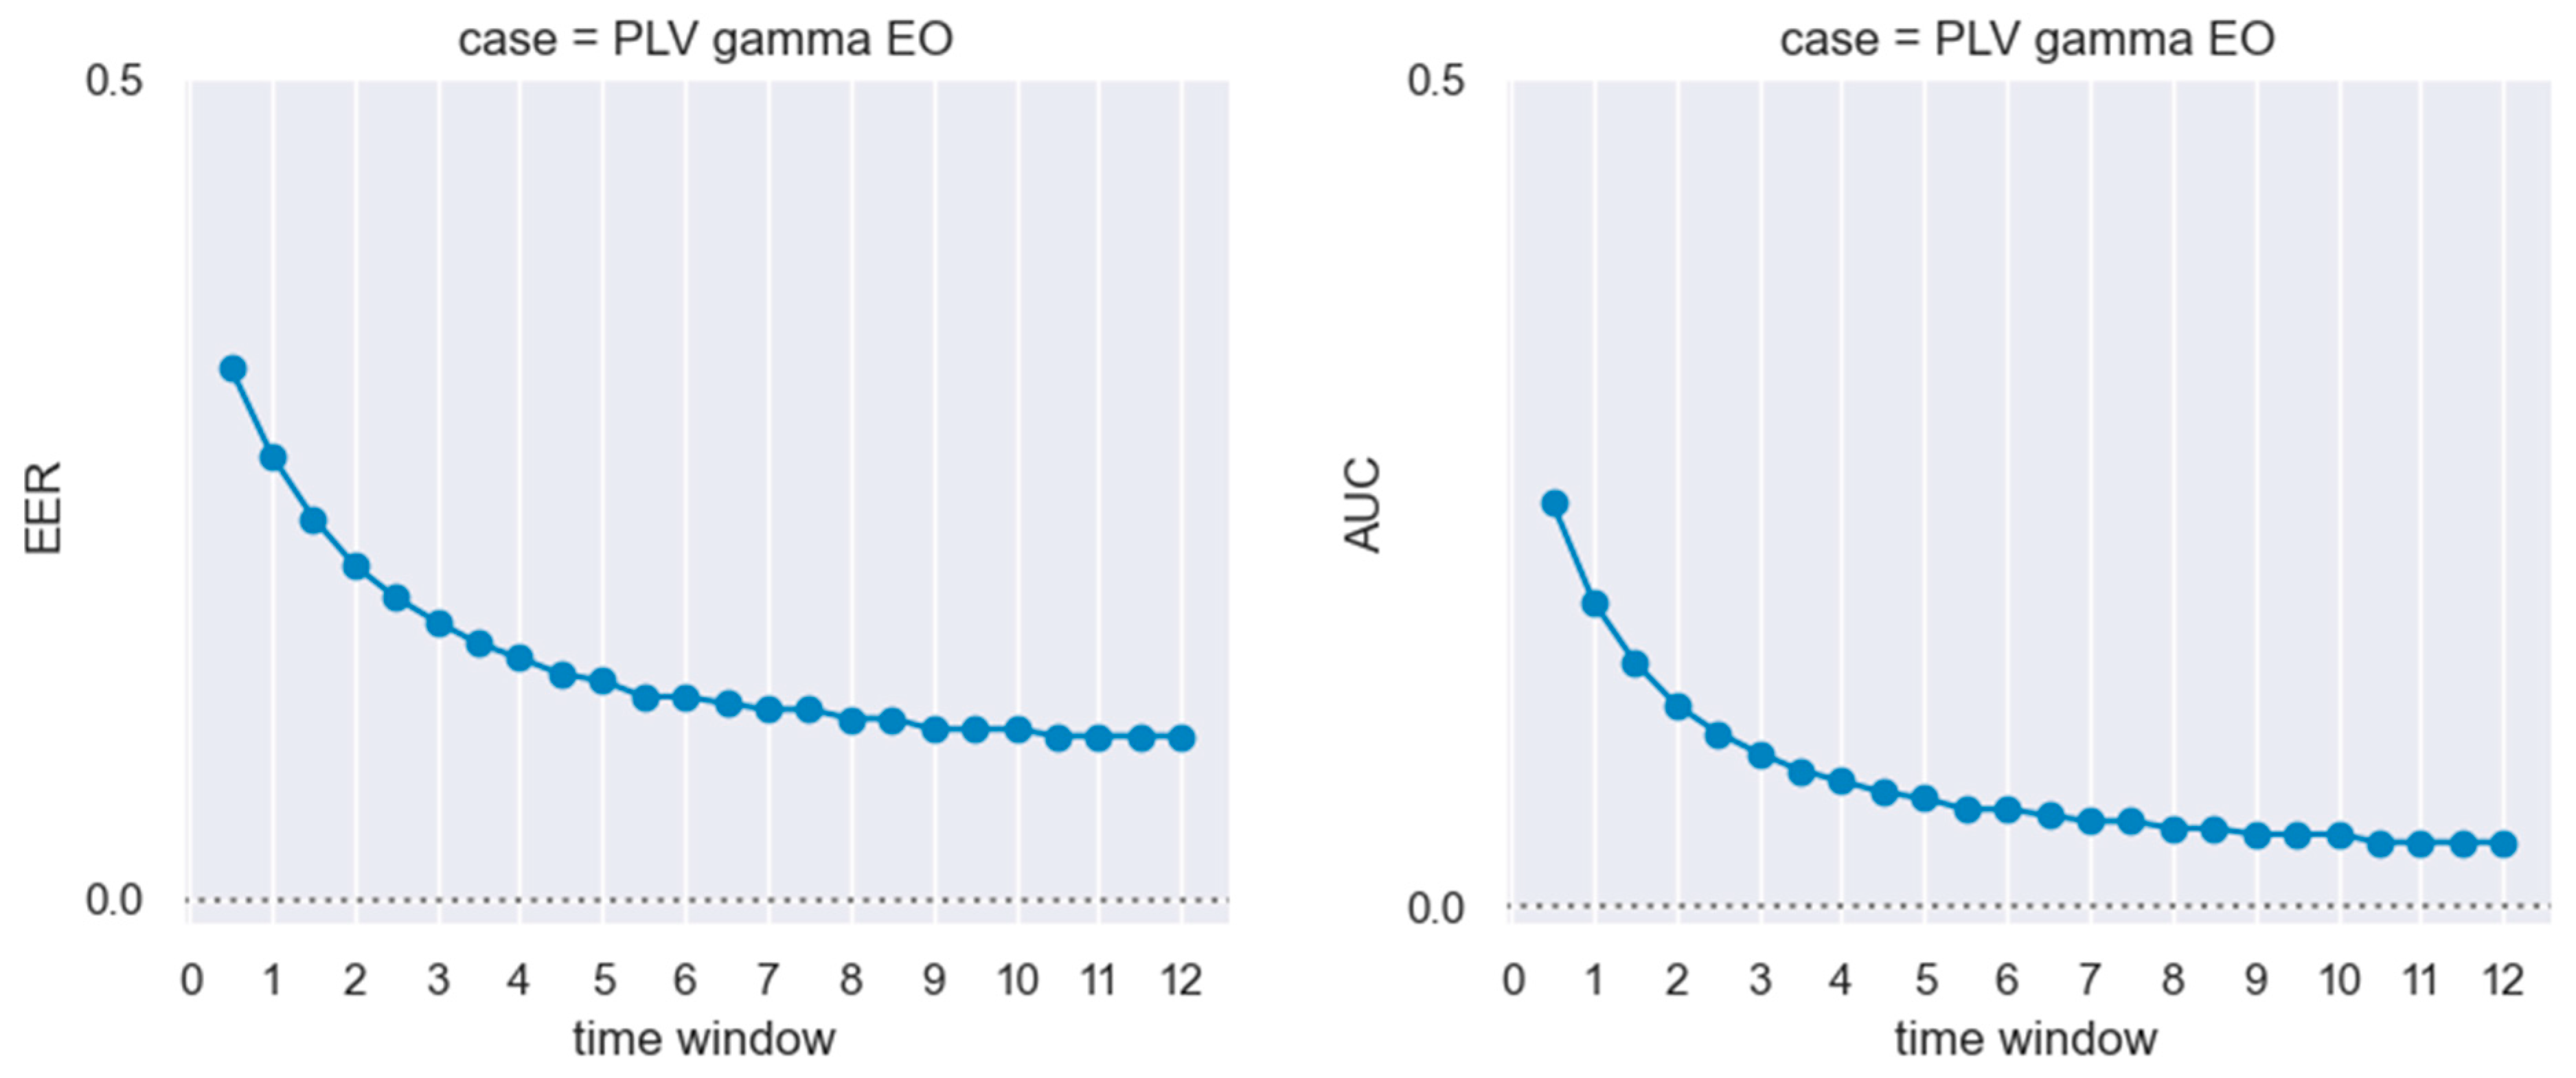
As summarized in Figure 1, Figure 2 and Figure 3 for the EEG Motor Movement/Imagery dataset and in Figure 4 for the DREAMER dataset, overall, the results of the present study clearly show an evident increase in the biometric performance (as expressed in terms of EER and AUC) with an increase in the time window, for all the experimental conditions, for both beta and gamma frequency bands and, even though with different magnitudes, for both the PLI and the PLV method. In particular, for the EEG Motor Movement/Imagery dataset, the best performance was obtained for the PLV approach in the gamma band for the eyes-open resting state condition with a minimum time window equal to at least 10.5 s (EER = 0.018) and the PLV approach in the beta band for the eyes-closed resting state condition again with a minimum time window equals to at least 10.5 s (EER = 0.035). In more detail, Figure 1 shows the effect of using different time windows with a step of 0.5 s on the EER for both the PLV and PLI, the beta and gamma frequency bands, and the two resting state conditions.
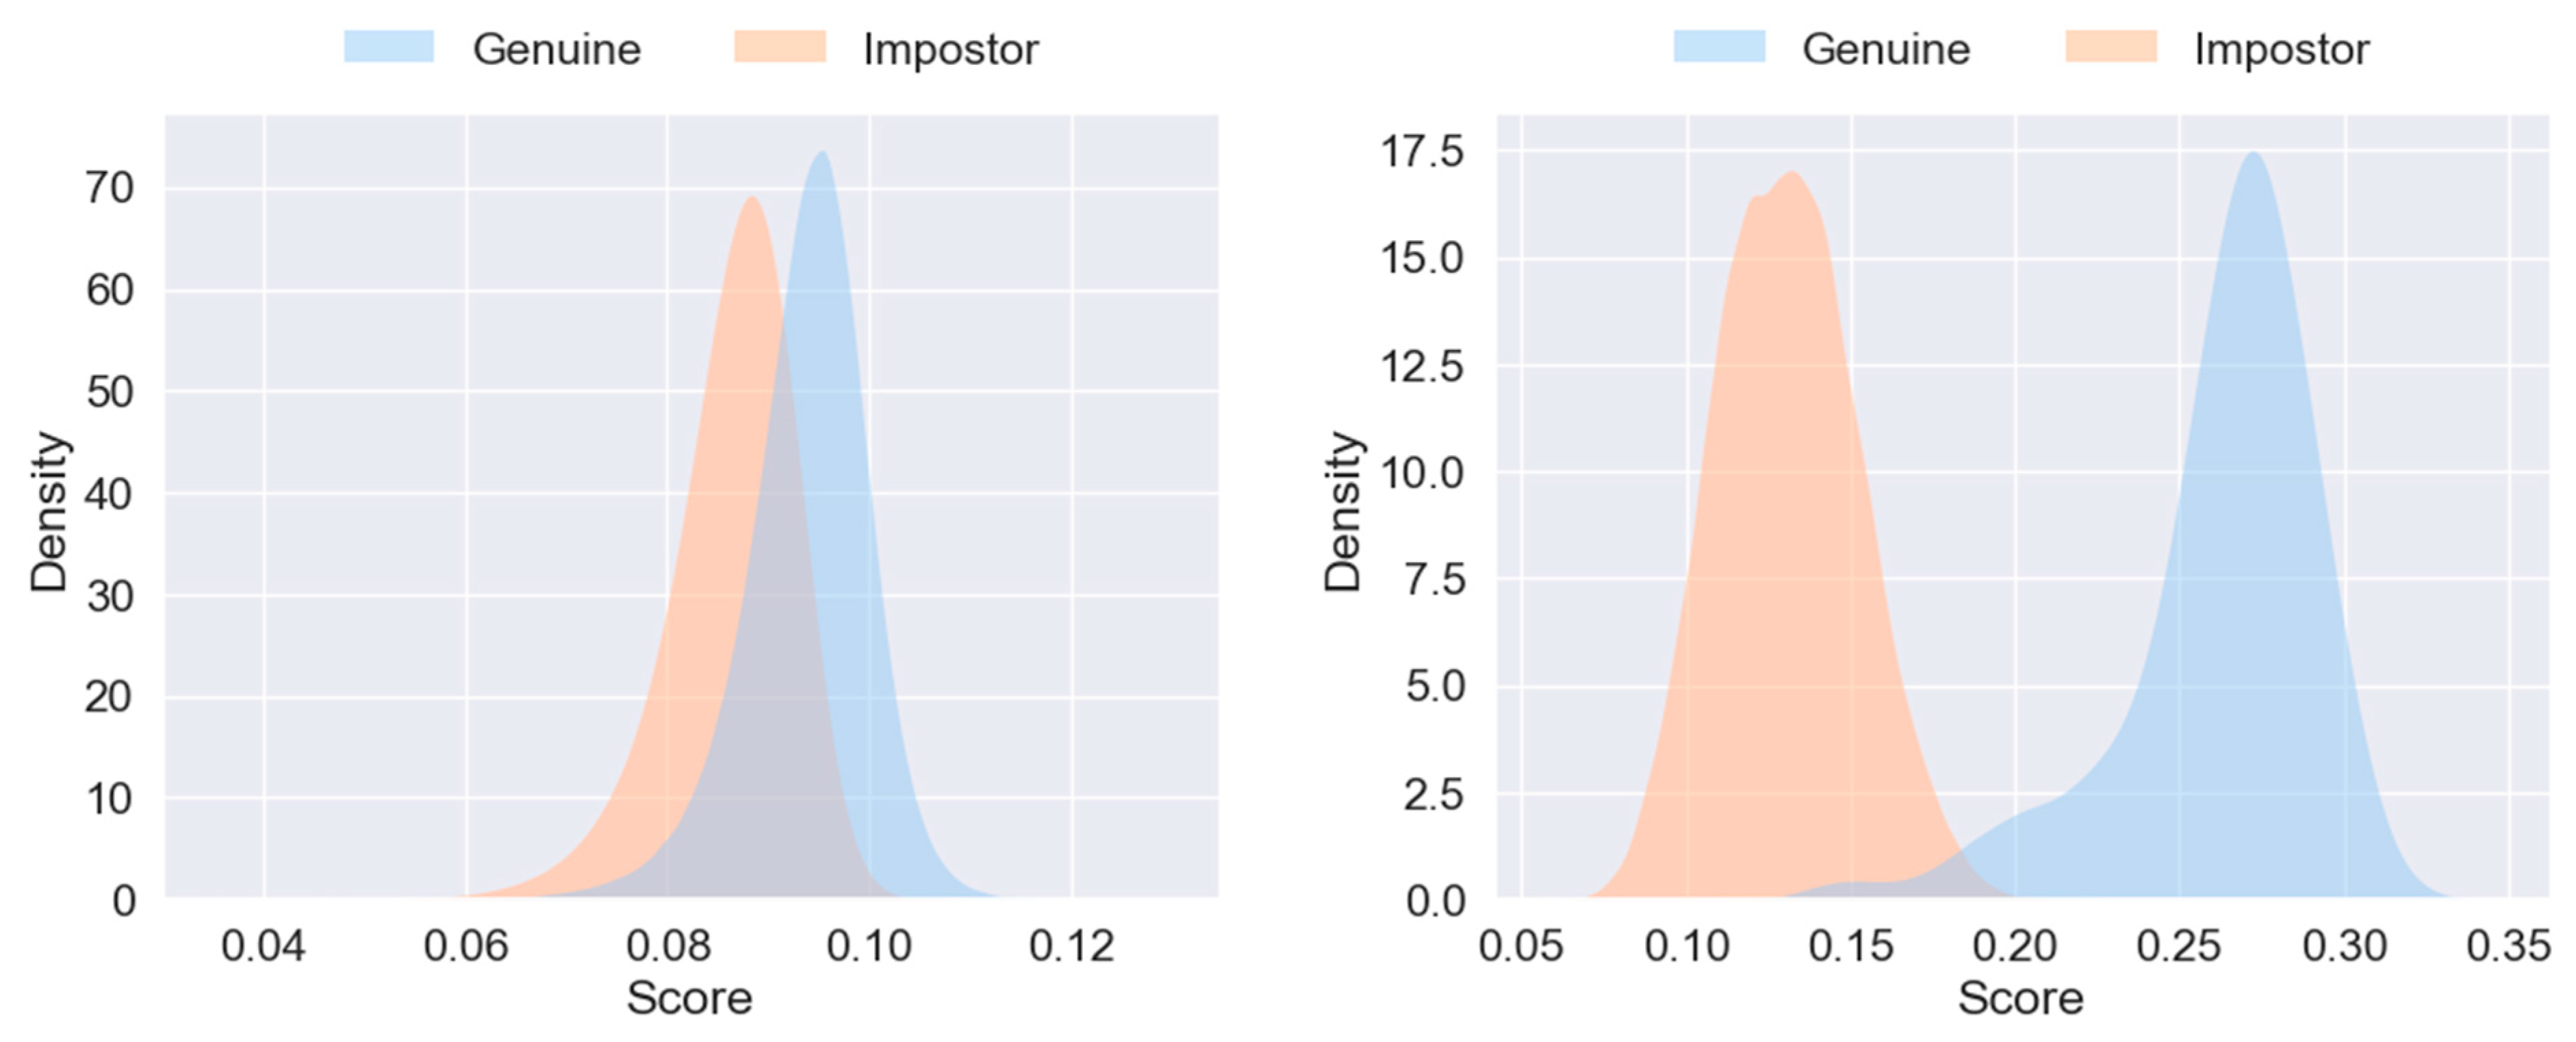
Moreover, Figure 2 shows the effect of using different time windows, always with a step of 0.5 s, on the AUC, again for both the PLV and PLI, beta and gamma frequency bands, and the two resting state conditions. Finally, to better represent the effect of the time window on the computed performance, Figure 3 shows the score distributions for the two more extreme windows, the shorter of 0.5 s and the larger of 12 s, for the PLV methods in the gamma frequency band for the eyes-open resting state condition. This latest result clearly indicates how the time window affects the overall performance in terms of the total overlap between genuine and impostor score distributions. As for the DREAMER dataset, as depicted in Figure 4, similar to what was already reported for the EEG Motor Movement/Imagery dataset, the results still show a clear trend towards an increase in the performance using longer time windows, with an EER equal to 0.09 and an AUC equal to 0.03 for time windows of at least 9 s.

4. Discussion

In the present study, we investigated the effect of the time window on a hypothetical EEG-based biometric system for user authentication. The rationale for this study is derived from the evidence where it has been previously reported that the definition of the EEG time window may represent a crucial issue in the EEG analysis [18] and that the length of the time window may strongly affect several EEG features, especially those based on connectivity methods [19,20]. In particular, these studies have highlighted that shorter epochs show less clear and more blurred connectivity patterns when compared with those obtained for longer epochs.
Altogether, these studies suggest that the size of the EEG segment to be considered when developing an EEG-based biometric system may play a key role and have a relevant effect on the final findings. Furthermore, deriving the optimal time window in an EEG biometric system would allow us to define the minimum required amount of time necessary to have the system properly working with satisfactory performance, thus avoiding including in the analysis longer segments of EEG recordings. This latest issue is particularly relevant in the resting state condition when drowsiness may occur, causing changes in the derived EEG characteristics. To test this research question, we used two well-known, widely used connectivity metrics shown to have good aptitude as subject-specific fingerprints in a resting state EEG [11,15]. The analysis was performed on two different freely available EEG datasets to make the study more reproducible.
Overall, as hypothesized, the reported results showed a pronounced effect of the time window on the biometric performance measured in terms of both the EER and AUC. In particular, we observed that the EER varied from 0.478 for the smaller time window to 0.018 for the larger, meaning that for short EEG recording segments, it is impossible to extract connectivity features able to detect any subject distinctive characteristic of the original signal. In contrast, for longer segments of the EEG signal, regardless of the connectivity metric and the dataset, our results confirm previous studies that reported very high performance in terms of individual authentication using an EEG-based system. The same output was observed for the AUC, which, again, varied from 0.476 for the smaller window to 0.002 for the larger one.
In summary, these findings suggest that it is possible to achieve very high performance levels even with relatively short EEG time windows, specifically in the order of 10 s. This result has significant implications for the development of future biometric systems, as it implies that such systems could be designed to function effectively with minimal EEG recording durations. By utilizing shorter EEG recordings, the overall quantity of data that needs to be acquired, stored, and processed can be substantially reduced, thereby enhancing the efficiency and practicality of these systems in real-world applications.
In our opinion, these results align with previous studies [20] that have reported the effect of epoch length on connectivity metrics and suggest an optimal time window (around 10 s) necessary to develop future EEG-based biometric systems that use connectivity metrics to extract the features from the original recordings. This optimal window is likely crucial for the development of future EEG-based biometric systems, where the balance between data sufficiency and recording duration is critical.
Furthermore, we speculate that the poor performance obtained with short time windows mainly depends on the difficulty of correctly estimating the connectivity metrics from very small EEG epochs (shorter than 8 s). When the EEG epoch is too short, there may not be enough data to provide a stable and accurate estimation, leading to poorer performance in biometric applications. This insight highlights the importance of selecting an appropriate epoch length in designing and implementing EEG-based biometric systems, ensuring that the time windows used are sufficiently long to capture the necessary information for robust feature extraction and system performance.

5. Conclusions

In conclusions, we want to highlight that, to develop any EEG-based biometric system, EEG connectivity represents an optimal candidate as an EEG fingerprint and that, in this context, it is essential to define a sufficient time window to collect the subject-specific features. Moreover, our preliminary results show that extending the window size beyond a certain maximum does not improve biometric systems’ performance. Among the questions left unanswered by this study, it is essential to explore the factors contributing to a decline in performance as the epoch width decreases. When epochs are too short, connectivity measures may not yield accurate results. In such cases, this issue could be resolved by adopting more robust connectivity measures. Alternatively, the problem might stem from the limited amount of information available in excessively short epochs, irrespective of the measurement approach used. In this scenario, the issue would be intrinsic to epoch size and, therefore, not remediable by alternative measures. Further investigations are required to clarify these aspects.

Author Contributions

Conceptualization, L.D., S.M.P., C.F. and M.F.; Methodology, C.F. and M.F.; Formal analysis, L.D. and M.F.; Writing—original draft, L.D., S.M.P., C.F. and M.F.; Writing—review & editing, L.D. and M.F. All authors have read and agreed to the published version of the manuscript.

Funding

Matteo Fraschini, Claudio Frongia, and Luca Didaci were in part funded by Fondazione di Sardegna under the project “TrustML: Towards Machine Learning that Humans Can Trust’’, CUP: F73C22001320007. This research was also partially funded by the IDEA-FAST project, which has received funding from the Innovative Medicines Initiative 2 Joint Undertaking under grant agreement No. 853981. This joint undertaking receives support from the European Union’s Horizon 2020 research and innovation program, EFPIA, and associated partners.

Data Availability Statement

The experimental data that support the findings of this study are publicly available and are cited below: Movement/Imagery Dataset [21], https://physionet.org/content/eegmmidb/1.0.0/ (accessed on 28 May 2024) and DREAMER dataset [22], https://zenodo.org/records/546113 (accessed on 28 May 2024).

Conflicts of Interest

The authors declare no conflict of interest.

References

  1. Maiorana, E.; La Rocca, D.; Campisi, P. On the Permanence of EEG Signals for Biometric Recognition. IEEE Trans. Inf. Forensics Secur. 2016, 11, 163–175. [Google Scholar] [CrossRef]
  2. Jalaly Bidgoly, A.; Jalaly Bidgoly, H.; Arezoumand, Z. A Survey on Methods and Challenges in EEG Based Authentication. Comput. Secur. 2020, 93, 101788. [Google Scholar] [CrossRef]
  3. Chan, H.-L.; Kuo, P.-C.; Cheng, C.-Y.; Chen, Y.-S. Challenges and Future Perspectives on Electroencephalogram-Based Biometrics in Person Recognition. Front. Neuroinform. 2018, 12, 66. [Google Scholar] [CrossRef] [PubMed]
  4. Del Pozo-Banos, M.; Alonso, J.B.; Ticay-Rivas, J.R.; Travieso, C.M. Electroencephalogram Subject Identification: A Review. Expert Syst. Appl. 2014, 41, 6537–6554. [Google Scholar] [CrossRef]
  5. Fidas, C.A.; Lyras, D. A Review of EEG-Based User Authentication: Trends and Future Research Directions. IEEE Access 2023, 11, 22917–22934. [Google Scholar] [CrossRef]
  6. Amico, E.; Goñi, J. The Quest for Identifiability in Human Functional Connectomes. Sci. Rep. 2018, 8, 8254. [Google Scholar] [CrossRef] [PubMed]
  7. Saia, R.; Carta, S.; Fenu, G.; Pompianu, L. Influencing Brain Waves by Evoked Potentials as Biometric Approach: Taking Stock of the Last Six Years of Research. Neural Comput. Appl. 2023, 35, 11625–11651. [Google Scholar] [CrossRef]
  8. Zhang, S.; Sun, L.; Mao, X.; Hu, C.; Liu, P. Review on EEG-Based Authentication Technology. Comput. Intell. Neurosci. 2021, 2021, e5229576. [Google Scholar] [CrossRef]
  9. Jain, A.K.; Flynn, P.; Ross, A.A. Handbook of Biometrics; Springer Science & Business Media: Berlin/Heidelberg, Germany, 2007; ISBN 978-0-387-71041-9. [Google Scholar]
  10. Kida, T.; Tanaka, E.; Kakigi, R. Multi-Dimensional Dynamics of Human Electromagnetic Brain Activity. Front. Hum. Neurosci. 2016, 9, 713. [Google Scholar] [CrossRef]
  11. Fraschini, M.; Pani, S.M.; Didaci, L.; Marcialis, G.L. Robustness of Functional Connectivity Metrics for EEG-Based Personal Identification over Task-Induced Intra-Class and Inter-Class Variations. Pattern Recognit. Lett. 2019, 125, 49–54. [Google Scholar] [CrossRef]
  12. Fraschini, M.; Hillebrand, A.; Demuru, M.; Didaci, L.; Marcialis, G.L. An EEG-Based Biometric System Using Eigenvector Centrality in Resting State Brain Networks. IEEE Signal Process. Lett. 2015, 22, 666–670. [Google Scholar] [CrossRef]
  13. Wang, M.; Hu, J.; Abbass, H.A. BrainPrint: EEG Biometric Identification Based on Analyzing Brain Connectivity Graphs. Pattern Recognit. 2020, 105, 107381. [Google Scholar] [CrossRef]
  14. Rocca, D.L.; Campisi, P.; Vegso, B.; Cserti, P.; Kozmann, G.; Babiloni, F.; Fallani, F.D.V. Human Brain Distinctiveness Based on EEG Spectral Coherence Connectivity. IEEE Trans. Biomed. Eng. 2014, 61, 2406–2412. [Google Scholar] [CrossRef] [PubMed]
  15. Pani, S.M.; Ciuffi, M.; Demuru, M.; Cava, S.M.L.; Bazzano, G.; d’Aloja, E.; Fraschini, M. Subject, Session and Task Effects on Power, Connectivity and Network Centrality: A Source-Based EEG Study. Biomed. Signal Process. Control 2020, 59, 1. [Google Scholar] [CrossRef]
  16. Stam, C.J.; Nolte, G.; Daffertshofer, A. Phase Lag Index: Assessment of Functional Connectivity from Multi Channel EEG and MEG with Diminished Bias from Common Sources. Hum. Brain Mapp. 2007, 28, 1178–1193. [Google Scholar] [CrossRef] [PubMed]
  17. Lachaux, J.P.; Rodriguez, E.; Martinerie, J.; Varela, F.J. Measuring Phase Synchrony in Brain Signals. Hum. Brain Mapp. 1999, 8, 194–208. [Google Scholar] [CrossRef]
  18. Pernet, C.; Garrido, M.I.; Gramfort, A.; Maurits, N.; Michel, C.M.; Pang, E.; Salmelin, R.; Schoffelen, J.M.; Valdes-Sosa, P.A.; Puce, A. Issues and Recommendations from the OHBM COBIDAS MEEG Committee for Reproducible EEG and MEG Research. Nat. Neurosci. 2020, 23, 1473–1483. [Google Scholar] [CrossRef]
  19. Basti, A.; Chella, F.; Guidotti, R.; Ermolova, M.; D’Andrea, A.; Stenroos, M.; Romani, G.L.; Pizzella, V.; Marzetti, L. Looking through the Windows: A Study about the Dependency of Phase-Coupling Estimates on the Data Length. J. Neural Eng. 2022, 19, 016039. [Google Scholar] [CrossRef]
  20. Fraschini, M.; Demuru, M.; Crobe, A.; Marrosu, F.; Stam, C.J.; Hillebrand, A. The Effect of Epoch Length on Estimated EEG Functional Connectivity and Brain Network Organisation. J. Neural Eng. 2016, 13, 036015. [Google Scholar] [CrossRef]
  21. Goldberger, A.L.; Amaral, L.A.; Glass, L.; Hausdorff, J.M.; Ivanov, P.C.; Mark, R.G.; Mietus, J.E.; Moody, G.B.; Peng, C.K.; Stanley, H.E. Eugene PhysioBank, PhysioToolkit, and PhysioNet. Circulation 2000, 101, e215–e220. [Google Scholar] [CrossRef]
  22. Katsigiannis, S.; Ramzan, N. DREAMER: A Database for Emotion Recognition Through EEG and ECG Signals From Wireless Low-Cost Off-the-Shelf Devices. IEEE J. Biomed. Health Inform. 2018, 22, 98–107. [Google Scholar] [CrossRef] [PubMed]
  23. Fraschini, M.; Meli, M.; Demuru, M.; Didaci, L.; Barberini, L. EEG Fingerprints under Naturalistic Viewing Using a Portable Device. Sensors 2020, 20, 6565. [Google Scholar] [CrossRef] [PubMed]
  24. Delorme, A.; Makeig, S. EEGLAB: An Open Source Toolbox for Analysis of Single-Trial EEG Dynamics Including Independent Component Analysis. J. Neurosci. Methods 2004, 134, 9–21. [Google Scholar] [CrossRef]
  25. Crobe, A.; Demuru, M.; Didaci, L.; Marcialis, G.L.; Fraschini, M. Minimum Spanning Tree Andk-Core Decomposition as Measure of Subject-Specific EEG Traits. Biomed. Phys. Eng. Express 2016, 2, 017001. [Google Scholar] [CrossRef]
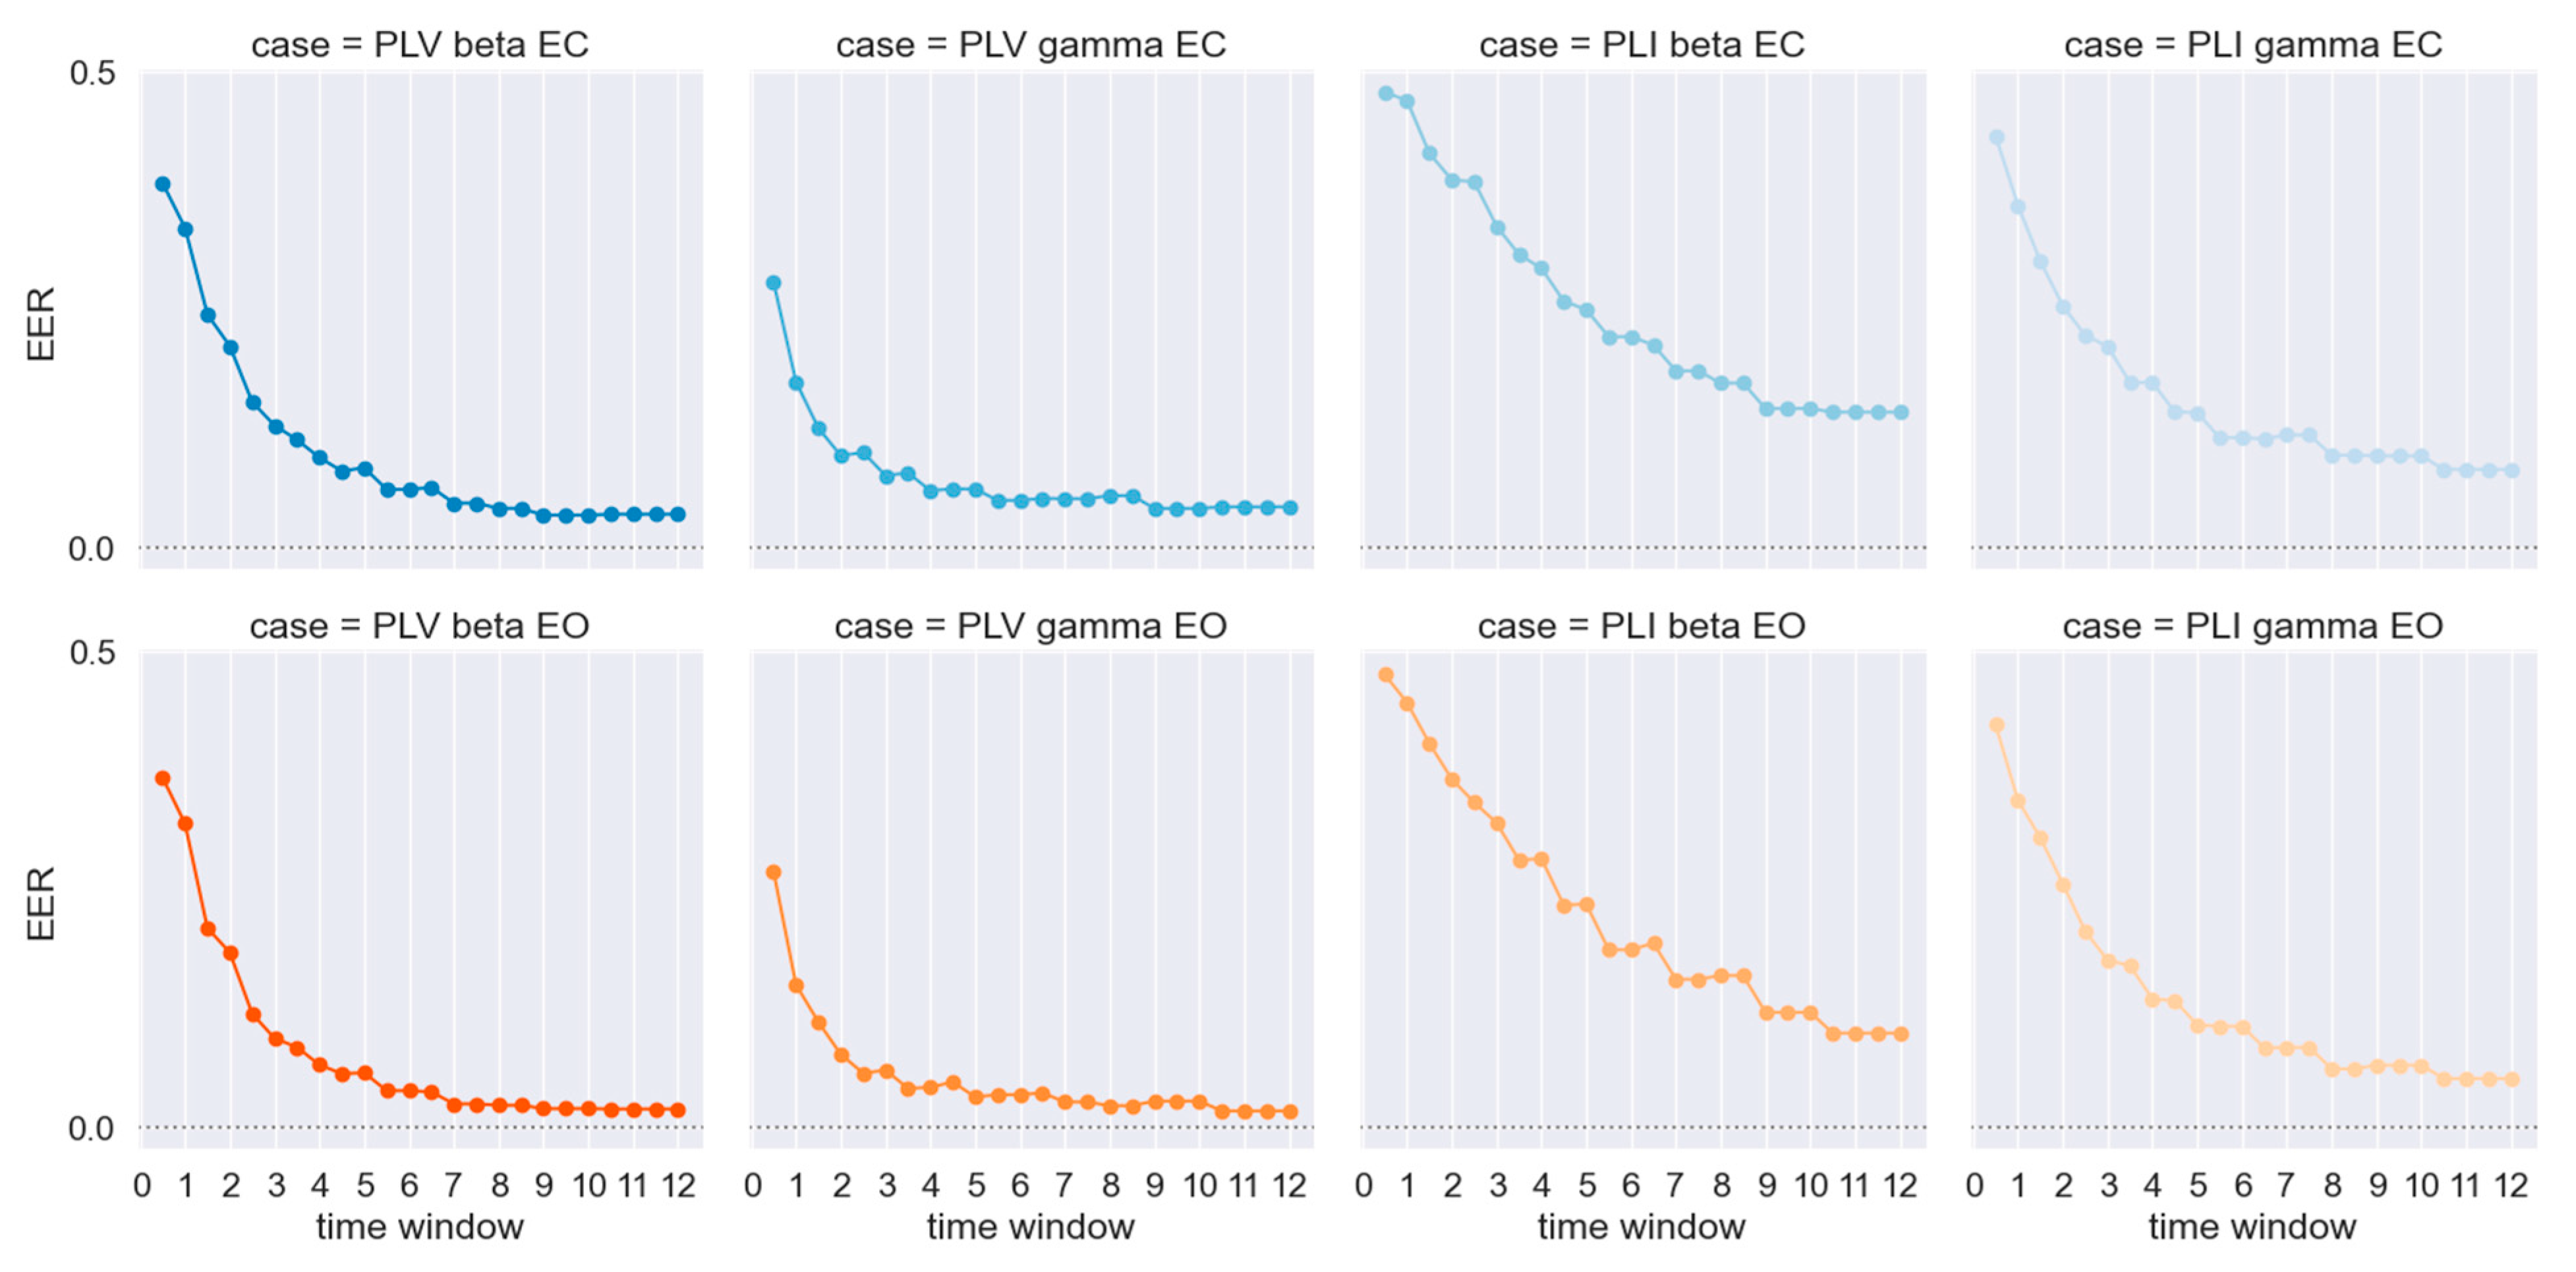
Figure 1. The effect of using different time windows from 0.5 s to 12 s, with a step of 0.5 s, on the EER for both the PLV and PLI, the beta and gamma frequency bands, and the two resting state conditions, namely eyes-closed (EC) and eyes-open (EO).
Signals 05 00033 g001
Figure 2. The effect of using different time windows from 0.5 s to 12 s, with a step of 0.5 s, on the AUC for both the PLV and PLI, the beta and gamma frequency bands, and the two resting state conditions, namely eyes-closed (EC) and eyes-open (EO).
Signals 05 00033 g002
Figure 3. The score distributions for the two more extreme windows, the shorter of 0.5 s and the larger of 12 s, for the PLV methods in the gamma frequency band for the eyes-open resting state condition.
Signals 05 00033 g003
Figure 4. The effect of using different time windows, from 0.5 s to 12 s, with a step of 0.5 s, on the EER (left panel) and AUC (right panel) for the PLV in the gamma frequency band using the DREAMER EEG baseline traces.
Signals 05 00033 g004
Disclaimer/Publisher’s Note: The statements, opinions and data contained in all publications are solely those of the individual author(s) and contributor(s) and not of MDPI and/or the editor(s). MDPI and/or the editor(s) disclaim responsibility for any injury to people or property resulting from any ideas, methods, instructions or products referred to in the content.