Article

Development of an Integrated System of sEMG Signal Acquisition, Processing, and Analysis with AI Techniques

1
Laboratory of Biomedical Applications Technologies and Sensors (BATS), Department of Health Science, “Magna Græcia” University, I-88100 Catanzaro, Italy
2
Department of Civil, Energetic, Environmental and Material Engineering, “Mediterranea” University, I-89122 Reggio Calabria, Italy
3
Department of Information Engineering, Infrastructures and Sustainable Energy, “Mediterranea” University, I-89122 Reggio Calabria, Italy
*
Author to whom correspondence should be addressed.
These authors contributed equally to this work.
Signals 2024, 5(3), 476-493; https://doi.org/10.3390/signals5030025
Submission received: 24 June 2024 / Revised: 12 July 2024 / Accepted: 25 July 2024 / Published: 26 July 2024
(This article belongs to the Special Issue Advanced Methods of Biomedical Signal Processing II)

Abstract

:
The development of robust circuit structures remains a pivotal milestone in electronic device research. This article proposes an integrated hardware–software system designed for the acquisition, processing, and analysis of surface electromyographic (sEMG) signals. The system analyzes sEMG signals to understand muscle function and neuromuscular control, employing convolutional neural networks (CNNs) for pattern recognition. The electrical signals analyzed on healthy and unhealthy subjects are acquired using a meticulously developed integrated circuit system featuring biopotential acquisition electrodes. The signals captured in the database are extracted, classified, and interpreted by the application of CNNs with the aim of identifying patterns indicative of neuromuscular problems. By leveraging advanced learning techniques, the proposed method addresses the non-stationary nature of sEMG recordings and mitigates cross-talk effects commonly observed in electrical interference patterns captured by surface sensors. The integration of an AI algorithm with the signal acquisition device enhances the qualitative outcomes by eliminating redundant information. CNNs reveals their effectiveness in accurately deciphering complex data patterns from sEMG signals, identifying subjects with neuromuscular problems with high precision. This paper contributes to the landscape of biomedical research, advocating for the integration of advanced computational techniques to unravel complex physiological phenomena and enhance the utility of sEMG signal analysis.

1. Problem Introduction

Non-invasive methodologies for the analysis and detection of diseases represent a significant contribution to medical science. At the same time, the development of these methodologies poses new challenges to the scientific community regarding the use of technology, sensor placement, and the evolution of biomedical signal analysis and study. Therefore, methodologies and technologies must always be implementable and easily reproducible. The challenge is to develop powerful and interfaced integrated software–hardware devices for individual use, particularly considering the complexity of biomedical signals, which are derived from electrical signals detected on the human body [1,2].
Biomedical signals are vital in medical diagnostics because they convey information from biological tissues or organs during normal or pathological functioning. Often, this information is not easily accessible and requires specific acquisition and processing procedures to extract diagnostically and therapeutically relevant information. Biomedical signals are typically detected using electrodes, which measure the potential difference between two points [3,4]. The automated acquisition and processing of these signals promises to extract physiological and clinical information with greater accuracy. Therefore, there is an urgent need to develop new tools and employ appropriate, non-intrusive processing techniques to achieve this goal. The integration of automation has significantly advanced both diagnostic methodologies and therapeutic interventions [5]. The search for circuit structures that can accommodate exponentially attenuated signals is crucial to advancing electronic device technologies in various fields, particularly biomedical applications. Sensors used in biomedical contexts are of particular interest, given their critical role in monitoring physiological parameters, detecting abnormalities, and facilitating medical interventions [6,7].
Robust and efficient circuit structures are essential to ensuring the accuracy and reliability of data acquisition in these crucial applications. The development of circuit structures capable of processing exponentially attenuated signals is essential to driving advances in electronic device technologies, especially in the biomedical field, where the speed and reliability of data acquisition are of primary importance for diagnostic and therapeutic purposes [8]. One of the most significant challenges in the field of biomedical signal processing is the presence of disturbances and noise that permeate the signal of interest, thus preventing accurate determination of its trajectory. For example, surface electromyographic (sEMG) signals, which transmit the propagation of electrical activity, are typically acquired using electrodes attached to the patient’s skin [9]. Electromyography is a methodology that allows the study of the nervous system by recording the electrical muscle signal that propagates during contraction. From a medical perspective, electromyography allows the study of muscle pathophysiology. From an engineering perspective, when skeletal muscle fibers contract, they conduct electrical activity (action potential, AP) that can be measured by electrodes applied to the skin surface above the muscles [10]. The propagation of the potential, in the case of surface electromyography, is acquired through electrodes applied to the patient’s skin. The most common surface electrodes are adhesive or Ag/AgCl-type gels, given their characteristics, including low noise (5–10 μV) and ease of manufacture [11]. Needle or wire electrodes are typically made of stainless steel and are mainly used in emergency cases. In humans, the basic action potential is triphasic; the first two phases are similar in width, while the terminal phase has a peak-to-peak width that is only 5–10% of that of the first two phases. In clinical settings, the summation of the action potentials of all the motor units (MUs) in each muscle is detected using a pair of appropriately positioned electrodes. This summation is represented by bipolar signals with a symmetrical distribution of positive and negative amplitudes, known as the interference pattern. The two most important parameters that influence the amplitude and density of the analyzed signals are the recruitment of MUs and their frequency of activation. These parameters are the main control strategies used by the central nervous system to regulate the contraction process and thus modulate the strength of the muscle involved. Biological tissues perform a low-pass filtering effect on the original signal, which is why the surface electromyography (sEMG) signal does not reflect the original amplitude and frequency but is only a representation of it [12,13]. The interference pattern of the sEMG signal is random in nature as the set of activated MUs constantly changes, and the effects of motor unit action potentials (MUAPs) arbitrarily overlap [14]. For the same motor task performed with the same force, it is unlikely to observe identical patterns in the signal because the number of recruited MUs and the frequency of activation change continuously. Applying filtering algorithms or selecting appropriate amplitude parameters attempts to limit the non-replicable part of the signal. This study proposes an integrated system for the acquisition, processing, and analysis of the sEMG signal using artificial intelligence (AI) techniques and supervised learning. Data were acquired using a device developed for sEMG. The study then processed the data using a convolutional neural network (CNN), a supervised learning technique inspired by biological processes, which has several applications in image and video recognition, as well as in bioinformatics. CNNs have proven to be highly effective in analyzing electrophysiological signals due to their ability to automatically extract and learn relevant features from raw data [15,16,17]. Applied to sEMG data, CNNs can identify numerous spatially independent patterns, each associated with a single time flow, providing a way to separate the different electrical signals from various muscle activities [18]. Unlike the variable nature of sEMG signals recorded from a single muscle in isolation, the CNN analysis of sEMG signals from several muscles simultaneously allows for the detection of highly reproducible components [19]. The use of filtering algorithms and the adjustment of amplitude parameters during signal processing and acquisition serve to mitigate the non-replicable aspects of the signal. The primary purpose of this study is to employ appropriate processing techniques to obtain a trace directly associated with a characteristic of the muscle, typically the generated force. The researchers in this paper demonstrate important applications in monitoring the work activities of different subjects, significantly improving the quality and safety of work. The developed electronic device consists of a signal acquisition circuit from six electrodes and a Raspberry processor. The integrated system aims to filter and store signals from the electrodes and send them to a cloud platform for further processing using an AI technique. The proposed model has the goal of analyzing sEMG data with a supervised learning approach. In particular, a one-dimensional convolutional neural network (1D-CNN) was designed to detect the presence of neuropathies in subjects by identifying distinctive patterns in the sEMG signals. The present document is organized as follows: Section 2 lists similar works in which there are different points of view from the one presented in the paper. Section 3 discusses the challenges of electromyography, particularly the physical characteristics and nature of the sEMG signal. Section 3 describes the electronic device, the sensors used, and the implemented acquisition system. The computational model is presented in Section 4. Section 5 reports the results obtained from the processing of experimental data. Finally, conclusions are drawn.

2. Related Works

Electromyography (EMG) has been used as a measure to track the progress of rehabilitation and to identify diseases that affect muscle activation patterns. Although widely used, conventional EMG recording and interpretation techniques lack the ability to provide accurate signal detection and robust classification accuracy. In recent years, thanks to advances in materials science and artificial intelligence, EMG detection techniques have improved at a rapid pace. Materials that allow for greater biocompatibility have improved the quality of the data recorded by the electrodes. The use of machine learning algorithms has opened up new ways to understand complex EMG signals, enabling different, new, and improved application scenarios within the healthcare framework. To interpret the EMG signal, some studies have used algorithms based on machine learning or deep learning techniques for the pre-processing and interpretation of EMG signals. Raw EMG data are collected from subjects using surface or needle electrodes [20], and a high-pass filter with a cutting frequency of 2 Hz [21] is used to remove DC offset and low-frequency noise. To eliminate the interference of the feed frequency, a notch filter at 50 Hz is adopted, while the implementation of the signal can be carried out with classification algorithms for better results. Some studies present a non-invasive method of superficial EMG to support the diagnosis of Amiotropic Lateral Sclerosis (ALS). Using a flexible surface electrode applied to the thoracic and primary dorsal intersonic (FDI) muscles, while the reference electrodes were located near the elbow, EMG signals were processed with a linear discriminating analysis (LDA) classifier, obtaining a diagnostic performance of 90% sensitivity and 100% specificity for the diagnosis of ALS subjects [22].
Other studies, however, evaluated a biomarker that could predict the disease of patients with chronic obstructive lung disease (COPD). The development potential during their hospitalization period was acquired by the neural respiratory pulse extracted from sEMG signals, by placing surface electrodes (Blue Sensor Q, Ambu, St Ives, UK) in the second intercoastal space, immediately adjacent to the sternum. Using the t-test or Wilcoxon signed-rank tests, data were obtained with relatively high reception accuracy in 14 and 28 days [23].
Other work proposed a method to diagnose gastrointestinal diseases through patients’ sEMG signals, adopting the BIOPAC Systems Model MP36 Data Acquisition Unit and placing the single-use gel surface electrodes on the area near the navel. The recording signals were pre-processed from the decomposition of the empirical model and then transmitted to a number of machine learning classifiers, including a quadratic SVM, a fine KNN, RUS Boosted trees, and a cubic SVM, among which the highest achieved an accuracy of 100% in the differentiation of diarrhea, constipation, and normal gastrointestinal situations [24]. Similarly, scientists developed a generic algorithm based on sEMG signals to automatically detect tonic–clonic seizures. Auto-regression (AR) and DWT were applied to extract characteristics, and an ANN was used to classify. This approach achieved 100% accuracy in the differentiation of people with bruxism from others [25,26].
To help accurately diagnose unilateral spastic cerebral palsy based on EMG signals, a semi-automatic method was sought. Specifically, it was chosen to use auto-adhesive pairs of Ag/AgCl EMG bipolar surface electrodes (recording diameter 10 mm), which were placed on the muscles of the pronator teres (PT) and the pronator quadratus (PQ). The recorded signals were pre-processed and then presented to three EMG experts for intra-rater reliability analysis. Krippendorff’s alpha reliability estimate with 95% confidence intervals was used to validate the results, showing predictive accuracy of 96% positive and 91% negative [27].
To differentiate patients with essential tremor from dominant Parkinson’s disease with the combination of an accelerometer and an EMG, methods have been implemented that use bipolar surface Ag/AgCl electrodes attached to the extensor and flexor muscles of the subject’s left and right arm. The data were pre-processed by DWT and PCA, and the classification algorithm used was a support vector machine (SVM), whose overall accuracy was 83% for distinguishing patients with essential tremor (ET) from those with Parkinson’s disease (PD) [28]. Table 1 displays the many uses of sEMG signals in disease analysis.
Following the above outline of some research in the field of engineering for the treatment of various diseases with the use of biomedical devices combined with signal analysis using soft-computing techniques, in Section 3 this paper focuses on the challenges of electromyography and the nature of the sEMG signal.

3. Challenges in Electromyography

3.1. Phsical Principles

Electromyography (EMG) is based on the fundamental principles of neurophysiology and allows to study the nervous system by recording the electrical signal of a muscle that spreads during contraction [29]. Often, electromyographic examinations are combined with other diagnostic methods, such as electroneurography, computed axial tomography, and magnetic resonance imaging, and other methods of analysis and diagnosis are necessary to evaluate the presence of any pathologies in the patient [30,31,32]. The electromyographic signal depends on various factors such as anatomical, physiological, and muscle properties and the state of the peripheral nervous system, so it is a very complex signal. However, its usefulness goes beyond simple functional analysis, as it also serves as a diagnostic tool to outline the location and severity of neurological lesions. When the fibers of the skeletal muscle contract, they conduct an electrical activity (action potential, AP) that can be measured by electrodes placed on the skin surface above the muscles [33]. Small functional groups of muscle fibers, called motor units (MUs), contract synchronously, giving rise to a potential of action of the motor unit (MUAP). To support the force, an MU is activated repeatedly by the central nervous system several times per second. The repeat frequency, or average, is often between 5 and 30 times per second (or faster). The amplitude of the signal varies between 20 and 2000 µV. The electromyographic signal (EMG) is widely used as a suitable means to access the physiological processes involved in the production of joint movements. The EMG surface (sEMG) measures the electrical potential resulting from the overlap of the action potential of individual muscle fibers. The use of sEMG simplifies signal acquisition not only because of the non-invasiveness of the procedure, but also because the acquisition can be carried out while performing functional exercises. The information extracted from EMG signals can be exploited in various applications. The sensors typically used for EMG measurement are needle sensors (unipolar or bipolar). In the latter case, two sensors are placed on the muscle under analysis. The experimental data analyzed here come from non-invasive surface EMG sensors, which have the cross-talk effect, i.e., the detection of electrical activity by several muscles simultaneously in action. In addition, there are several sources of “noise” that influence the recording. The impedance of the electrodes and the slight variation in the electrode positions suggest the use of appropriate techniques for filtering the sEMG data.
These cells exhibit distinct resting and action potentials, with potential differences across their membranes typically spanning −40 to −90 mV. As a discipline at the intersection of physiology and technology, EMG measurement encounters various challenges. To obtain optimal signals, efficient filtering techniques are required, and the type of EMG measurement must be accurate, such that it provides signals with less noise and greater reliability. The signal amplitude of the surface EMG measurements is analyzed to estimate the level of muscle contraction, while the frequency component is used to assess muscle activation performance. However, the amplitude of the detected EMG signal and the average frequency are influenced by the position of the surface electrodes, although the action potentials in a muscle are generated simultaneously. The fairly wide voltage range means that the signals are not reproducible. For this reason, the resting potential best represents an indication of the membrane potential under normal conditions. Goldman’s equation (Equation (1)) provides a framework for calculating the resting potential, incorporating key variables such as membrane concentration and resistance.
E = V a V b = R T F   P N a N a + b + P k K + b + P C l C l b P N a N a + a + P k k + a + P C l C l b  
The temperature in Kelvin degrees is denoted by T in this equation, the gas constant by R, and the Faraday constant by F. The ion membrane permeability of sodium (PNa), potassium (PK), and chloride (PCl) is designated. Conversely, the amounts within the blocks show the ions’ internal and exterior concentrations. The sodium–potassium pump is an active mechanism that mostly depends on the passive diffusion of potassium ions to maintain the stability of the resting potential. This method generates a negative charge inside the cell by requiring an energy source, creating significant concentration gradients between the interior and outside of the cell, and involving the evacuation of three sodium ions and the entry of two potassium ions at each stage. The Nernst equation (Equation (2)), which specifies the balance potential required for the ion to balance under those circumstances, describes the balance potential of an ion.
E k = R T n F l n K o K i = 0.06151 l o g 10 K o K i  
where R represents the universal constant for ideal gases; T denotes the absolute temperature expressed in Kelvin; n signifies the number of moles of electrons exchanged during the half-reaction; F stands for the Faraday constant; [K] represents the concentration of the reduced species, located to the right of the arrow in the redox half-reaction, which loses electrons; [K′] denotes the concentration of the oxidized species, situated to the left of the arrow in the redox half-reaction, which gains electrons; o symbolizes the stoichiometric coefficient of [K]; and i signifies the stoichiometric coefficient of [K′]. When the stimulus causes depolarization of the plasma membrane, a potential difference is generated; this is measured using pairs of bio-electrodes, which evaluate the potential difference between two positions within a biological system. Electrodes serve as transducers, facilitating the conversion of energy between the ionic and electronic realms. Their morphology and characteristics significantly influence factors such as noise levels, frequency distortion, and inadequate rejection of common-mode interference.

3.2. Signal Characteristics

The muscle is responsible for the movement of joints in the human body and the force it can generate is usually proportional to its cross-sectional area. One of its main characteristics is plasticity, i.e., the ability to adapt to stimuli and modify its structure to meet functional demands [34]. The muscle fibers of a singular motor unit contract synchronously, resulting in the manifestation of a uniform motor unit potential. Within the muscle, fibers contract in small clusters simultaneously, necessitating the arrival of stimuli from the central nervous system or an external electrical stimulator. These stimuli propagate along the motor neurons axon until reaching the fibers of the motor unit. Upon innervation of each fiber, two depolarization zones emerge and propagate towards the fiber’s ends at a velocity of 3–5 m/s. As the action potential traverses the fiber, it generates an electric field that disperses into the surrounding conducting medium, generating detectable voltages [35]. These voltages can be captured either via needle electrodes or on the skin’s surface using surface electrodes.
Due to variations in innervation points and conduction velocities among the fibers within a motor unit, the sources of the electric field are not perfectly aligned in space, resulting in asynchronous arrival times at the recording electrodes. Each descending impulse originating from the motor neuron and traveling along the axon triggers simultaneous contraction of the muscle fibers within the same motor unit.
A growing body of evidence suggests that movements that appear fluid to the naked eye are actually composed of the temporal and spatial superposition of discrete sub-movements that are precisely recruited and coordinated by the central nervous system [36]. However, the spatial and temporal superposition of sub-movements has generally made it difficult to isolate the effects of individual sub-movements [37].
The detection of non-stationarity in sEMG and kinematic variables is necessary to identify the onset of temporally overlapping sub-movements. It is therefore relevant to know how motor neurons that transmit electrical impulses to muscle fibers, causing them to contract, involve non-stable impulses that cause undetectable action potentials. The electrical activity that spreads along the muscle fibers, in fact, reflects the sum of numerous MUAPs, each of which contributes to the overall complexity and variability of the signal. Mathematically, the EMG signal can be modeled as a stochastic process characterized by deterministic and random components [38].
The deterministic part is associated with the repetitive launch patterns of the motor units, while the random component arises from the asynchronous launch and the variability of the recruitment rates of the engine units. The frequency domain analysis of EMG signals is crucial to understanding muscle fatigue, neuromuscular disorders, and muscle activation efficiency. Techniques such as Fourier Transform, Wavelet Transform, and PCA/ICA are commonly used to break down biopotential signals (i.e., ECG, EEG, EMG) into their constituent frequencies, providing detailed spectral analysis [39,40,41].
Modern signal processing techniques have significant potential to improve the quality and interpretability of EMG signals. Adaptive filtering, for example, can be used to dynamically remove noise and artifacts, improving the signal–noise ratio [42]. Furthermore, machine learning algorithms, convolutional neural networks (CNNs), have shown promise in the identification and classification of patterns within EMG signals. These algorithms can effectively manage the non-stationary nature of EMG signals and mitigate cross-talk effects, providing more accurate and reliable analysis.

4. Case Study: High-Frequency Tasks

The main objective of this work is the development of a hardware–software system consisting of an electronic device for acquiring the sEMG signal and a processor integrated with the acquisition circuit used to store and send the data to a cloud platform. The received data will be analyzed and implemented with AI techniques for surface electromyography. Tools for signal acquisition and signal processing were used for its realization. In particular, biopotential electrodes, an acquisition circuit, a variable power supply device to power the circuit, and an acquisition board to convert the signal from analogue to digital were used for acquisition. In order to study and process the signal, an acquisition system was set up, i.e., an electronic measuring system whose purpose is to record and process the measurements of the emitted signal [43,44].
The acquired signal is subjected to amplification to make it compatible with the specifications of the instrumentation. Filtering reduces the amount of noise that is added to the useful signal. After the conversion from analogue to digital form, the signal is sent to an integrated circuit consisting of a Raspberry processor, which has the task of taking the information acquired from the circuit and sending it to a cloud platform [45,46], where the data will be processed and analyzed with AI algorithms.
The hardware design of an EMG signal acquisition system involves careful consideration of various components and functionalities to ensure the effectiveness, safety, and reliability of the device.
For this reason, targeted, constant, and intensive monitoring of EMG parameters was carried out. The monitoring was performed by a central unit consisting of an acquisition board and a processor for storing and processing signals from the electrodes interfaced to the acquisition circuit. The acquired signals are managed by an intelligent System On Module (SOM), i.e., an independent electronic device capable of managing a Linux operating system and carrying out complex numerical processing. The acquired signals are then sent to a database, via an Internet key, which stores them and makes them available to be handled and processed (Figure 1).
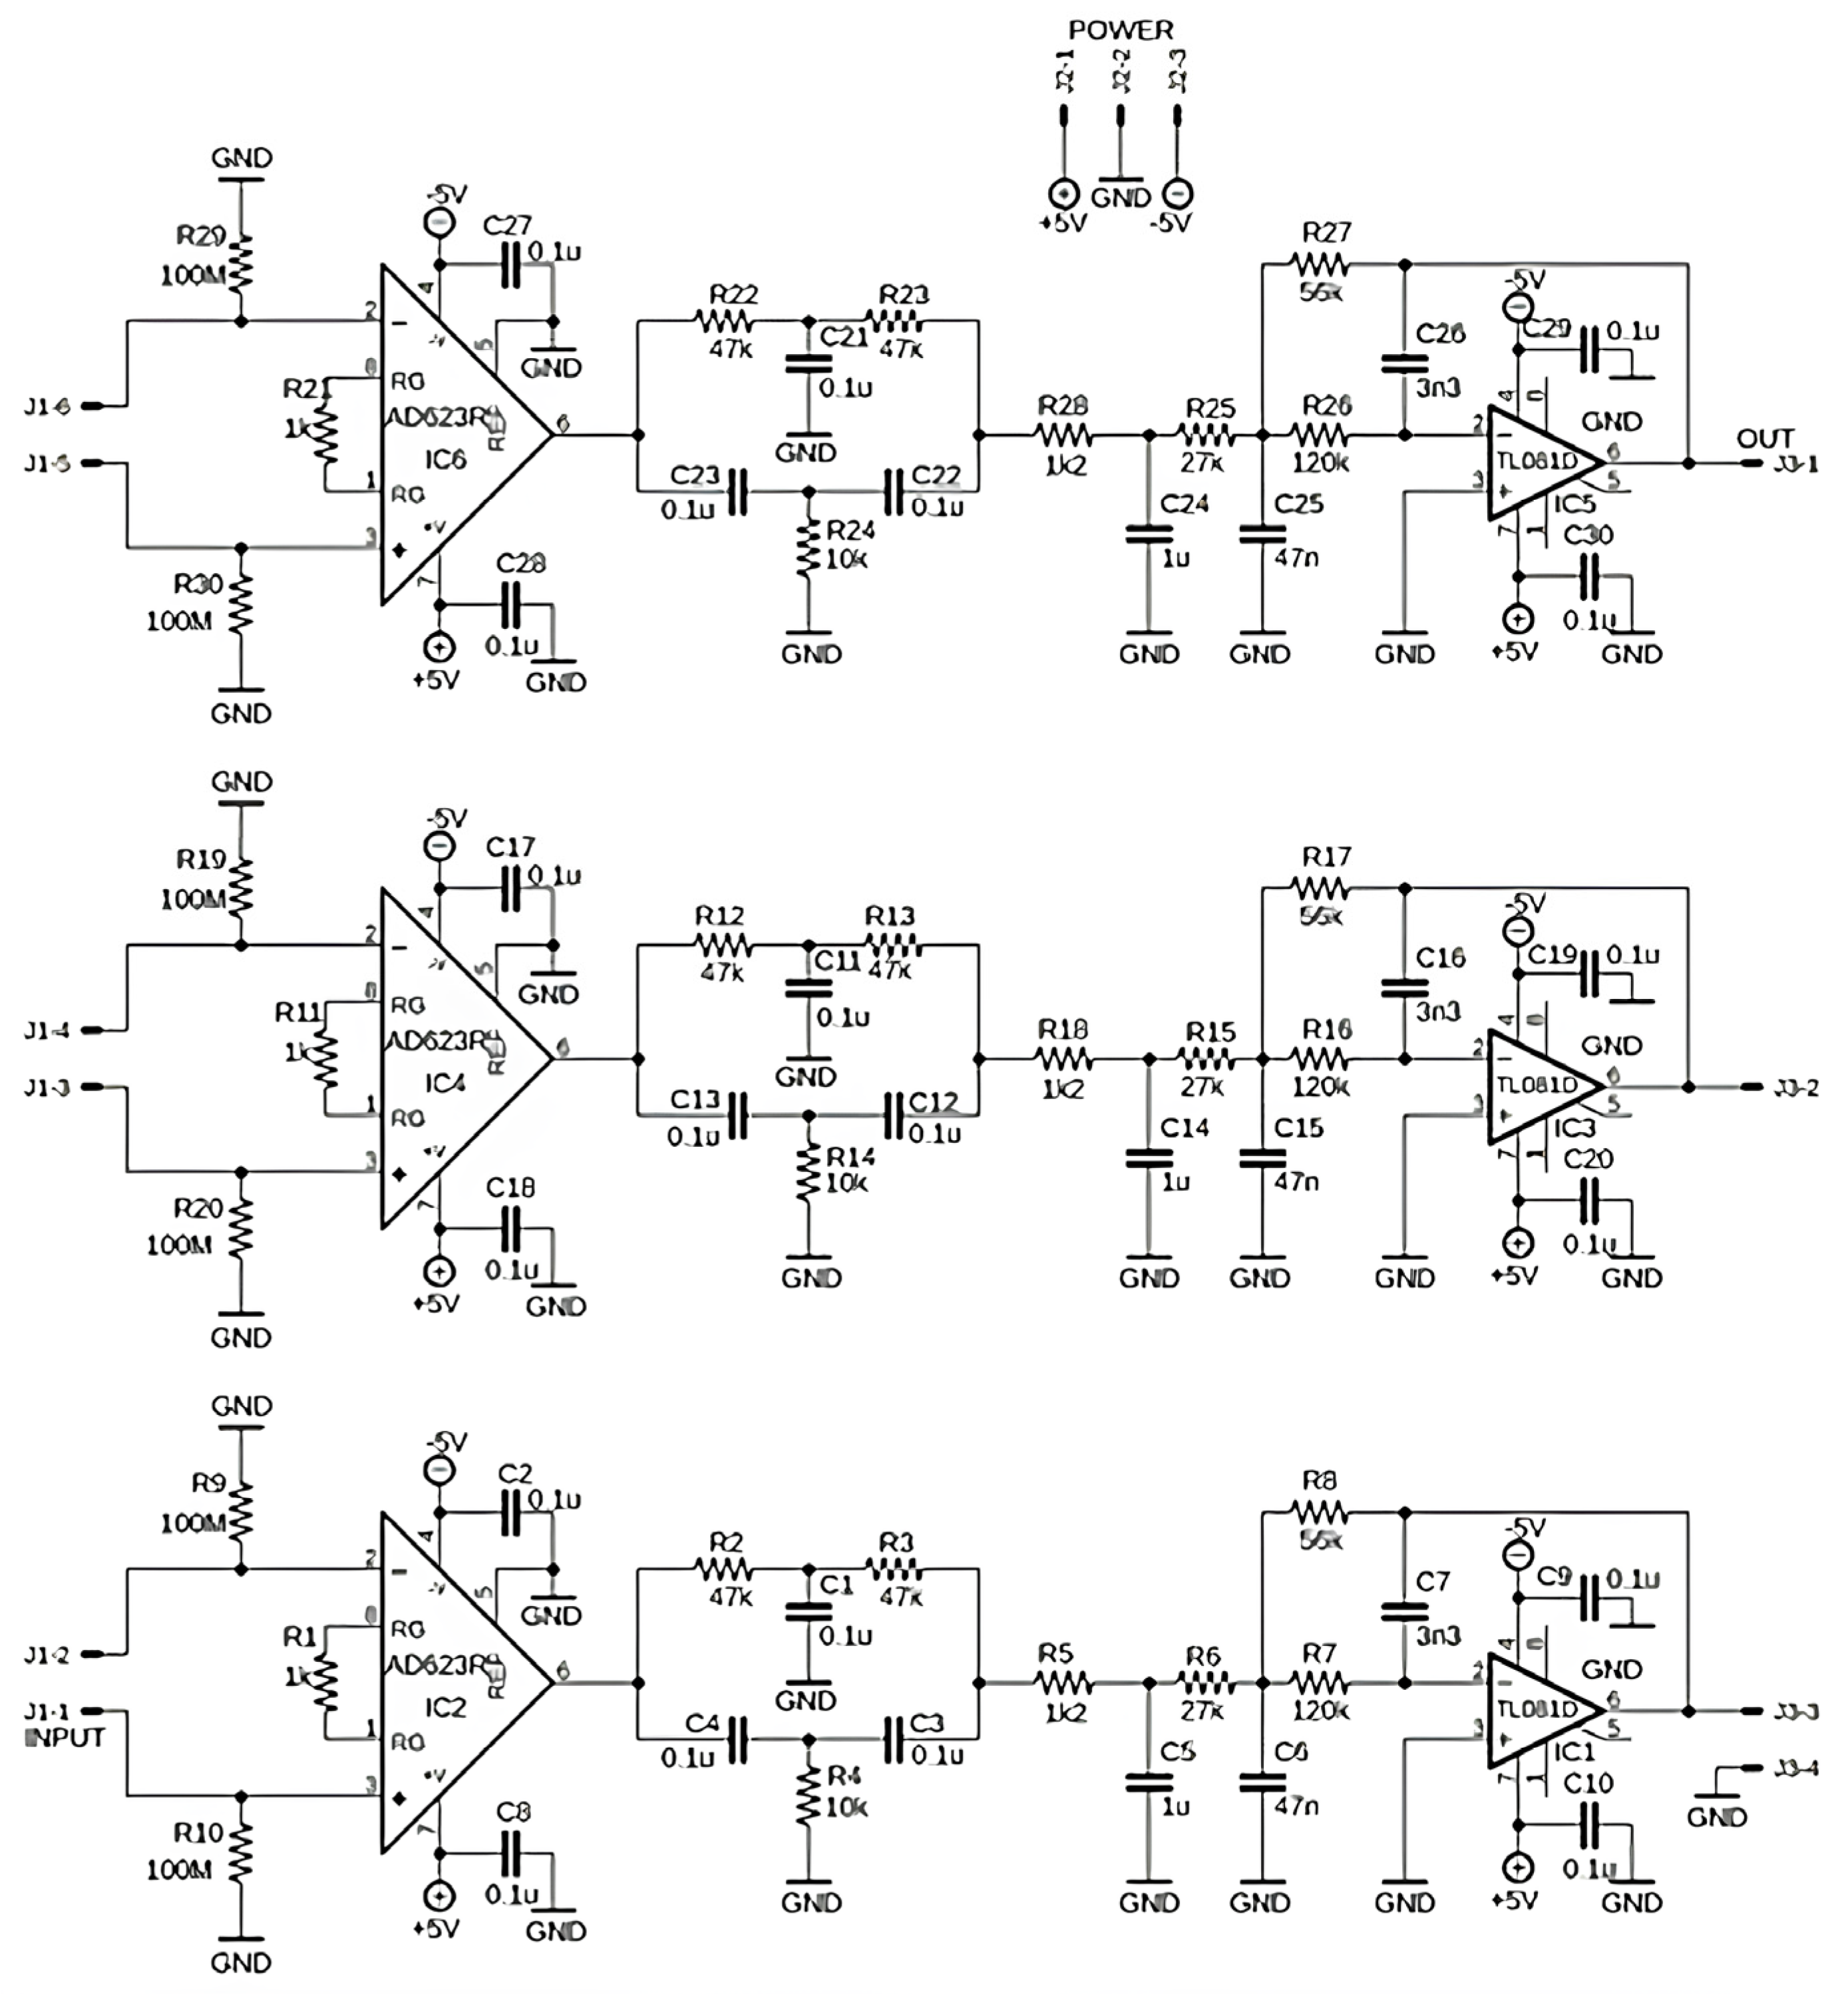
The specific details may vary depending on the intended use and the technology involved. The acquisition circuit proposed in this study was designed according to the diagram shown in Figure 2.
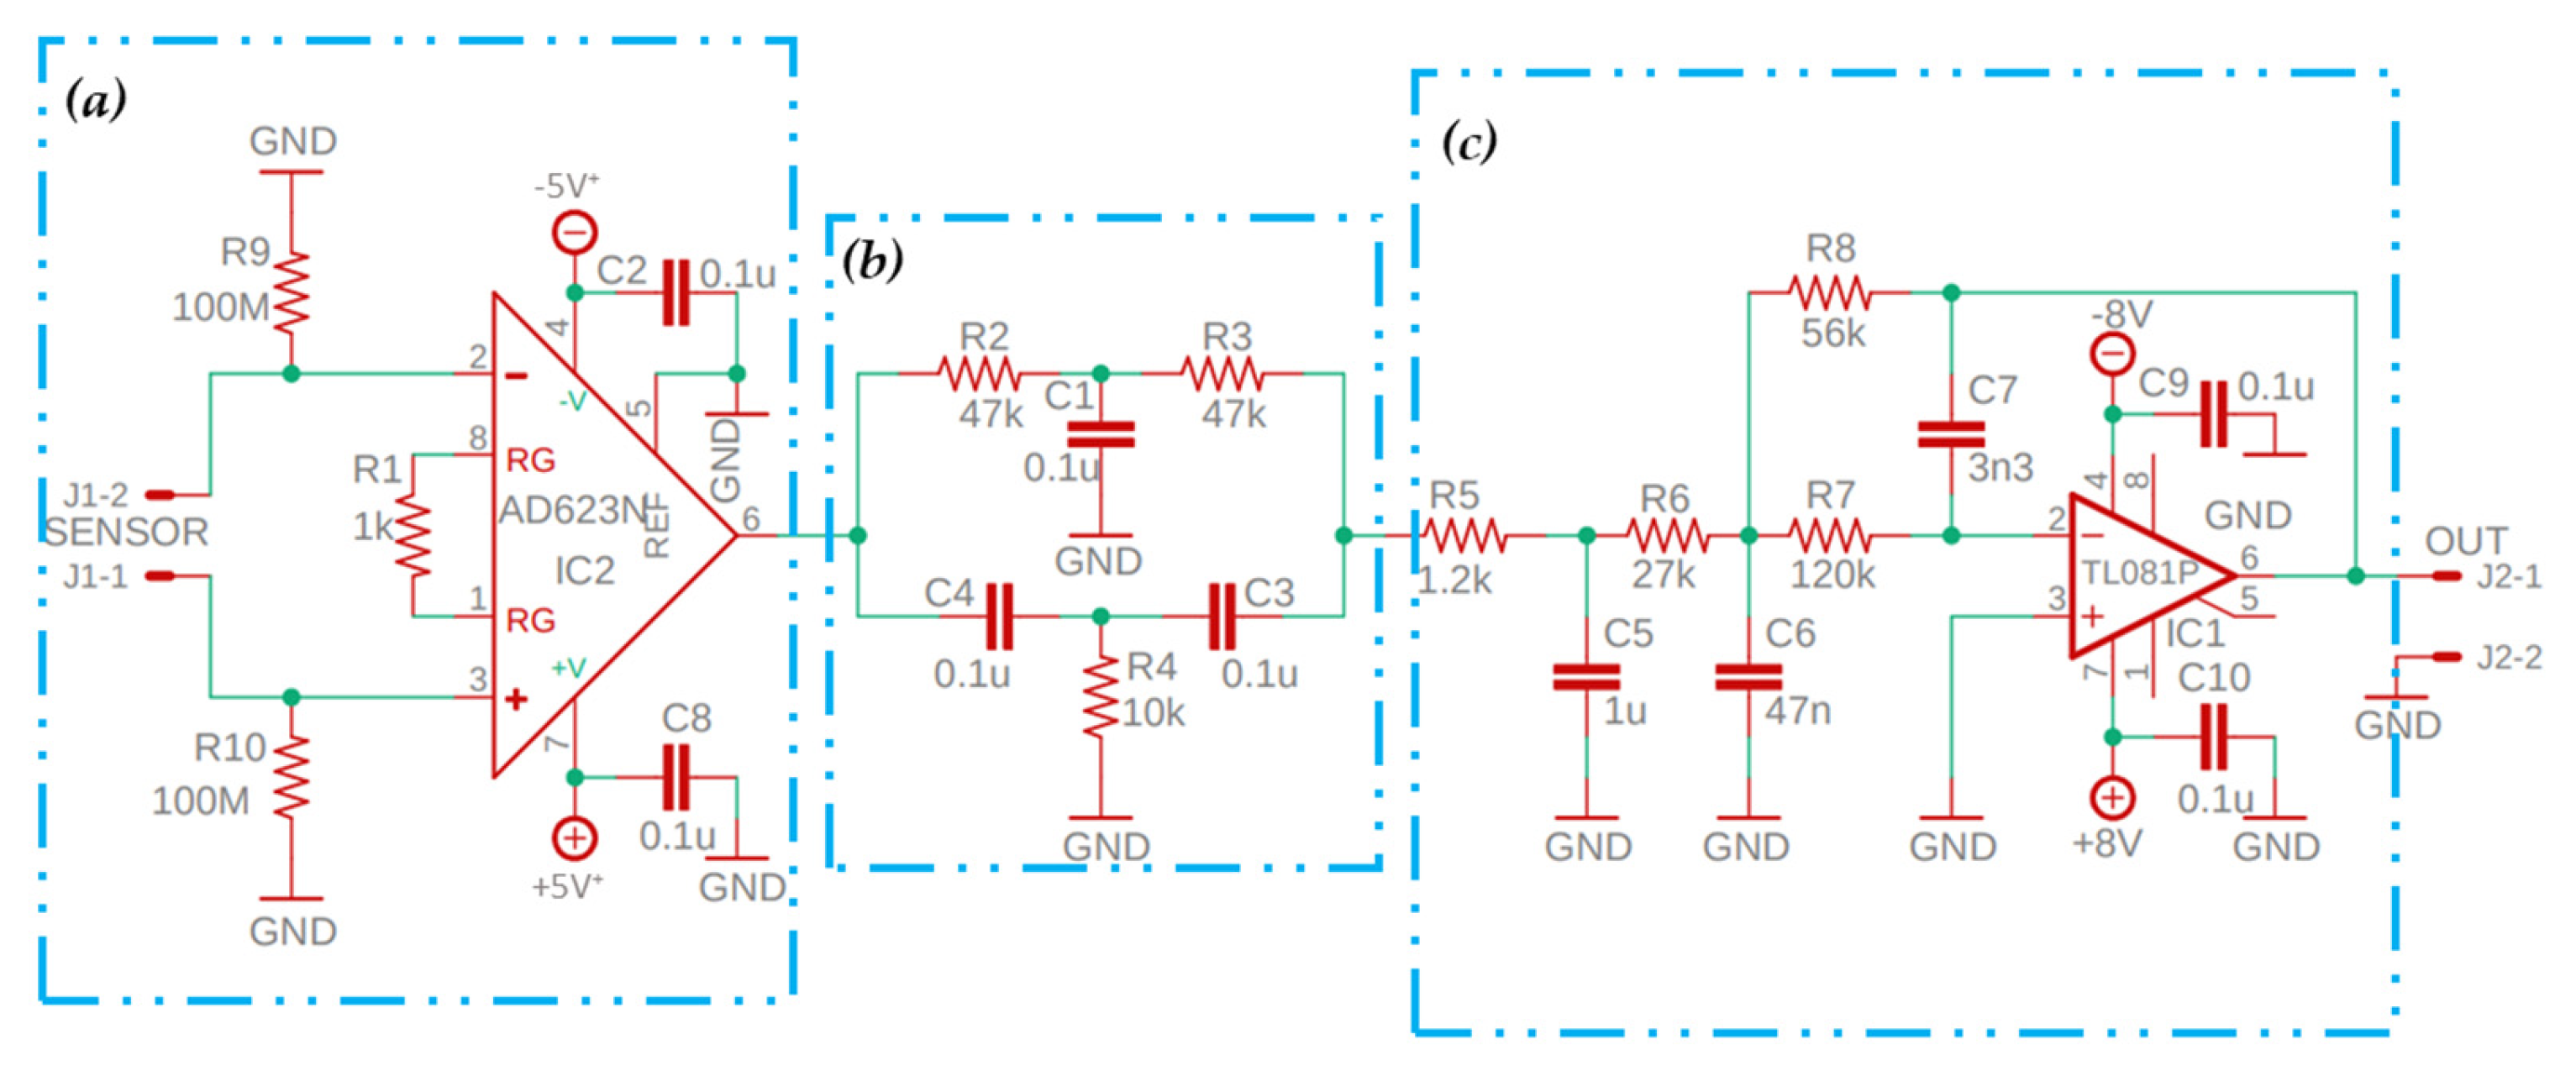
At the base of the instrumentation used is a variable power supply that was set at ±5 volts and connected to the power terminals of the acquisition circuit. The circuit is equipped with three power supply terminals, three input terminals, i.e., the three pairs of electrodes that will be applied to the subject’s skin, and three output cables that are used to connect the circuit with the acquisition board. As far as amplification is concerned, as detailed in Figure 3, the RG resistor allows for a gain of G = 1000 (60 dB) using the specific pin configuration of the AD623 amplifier.
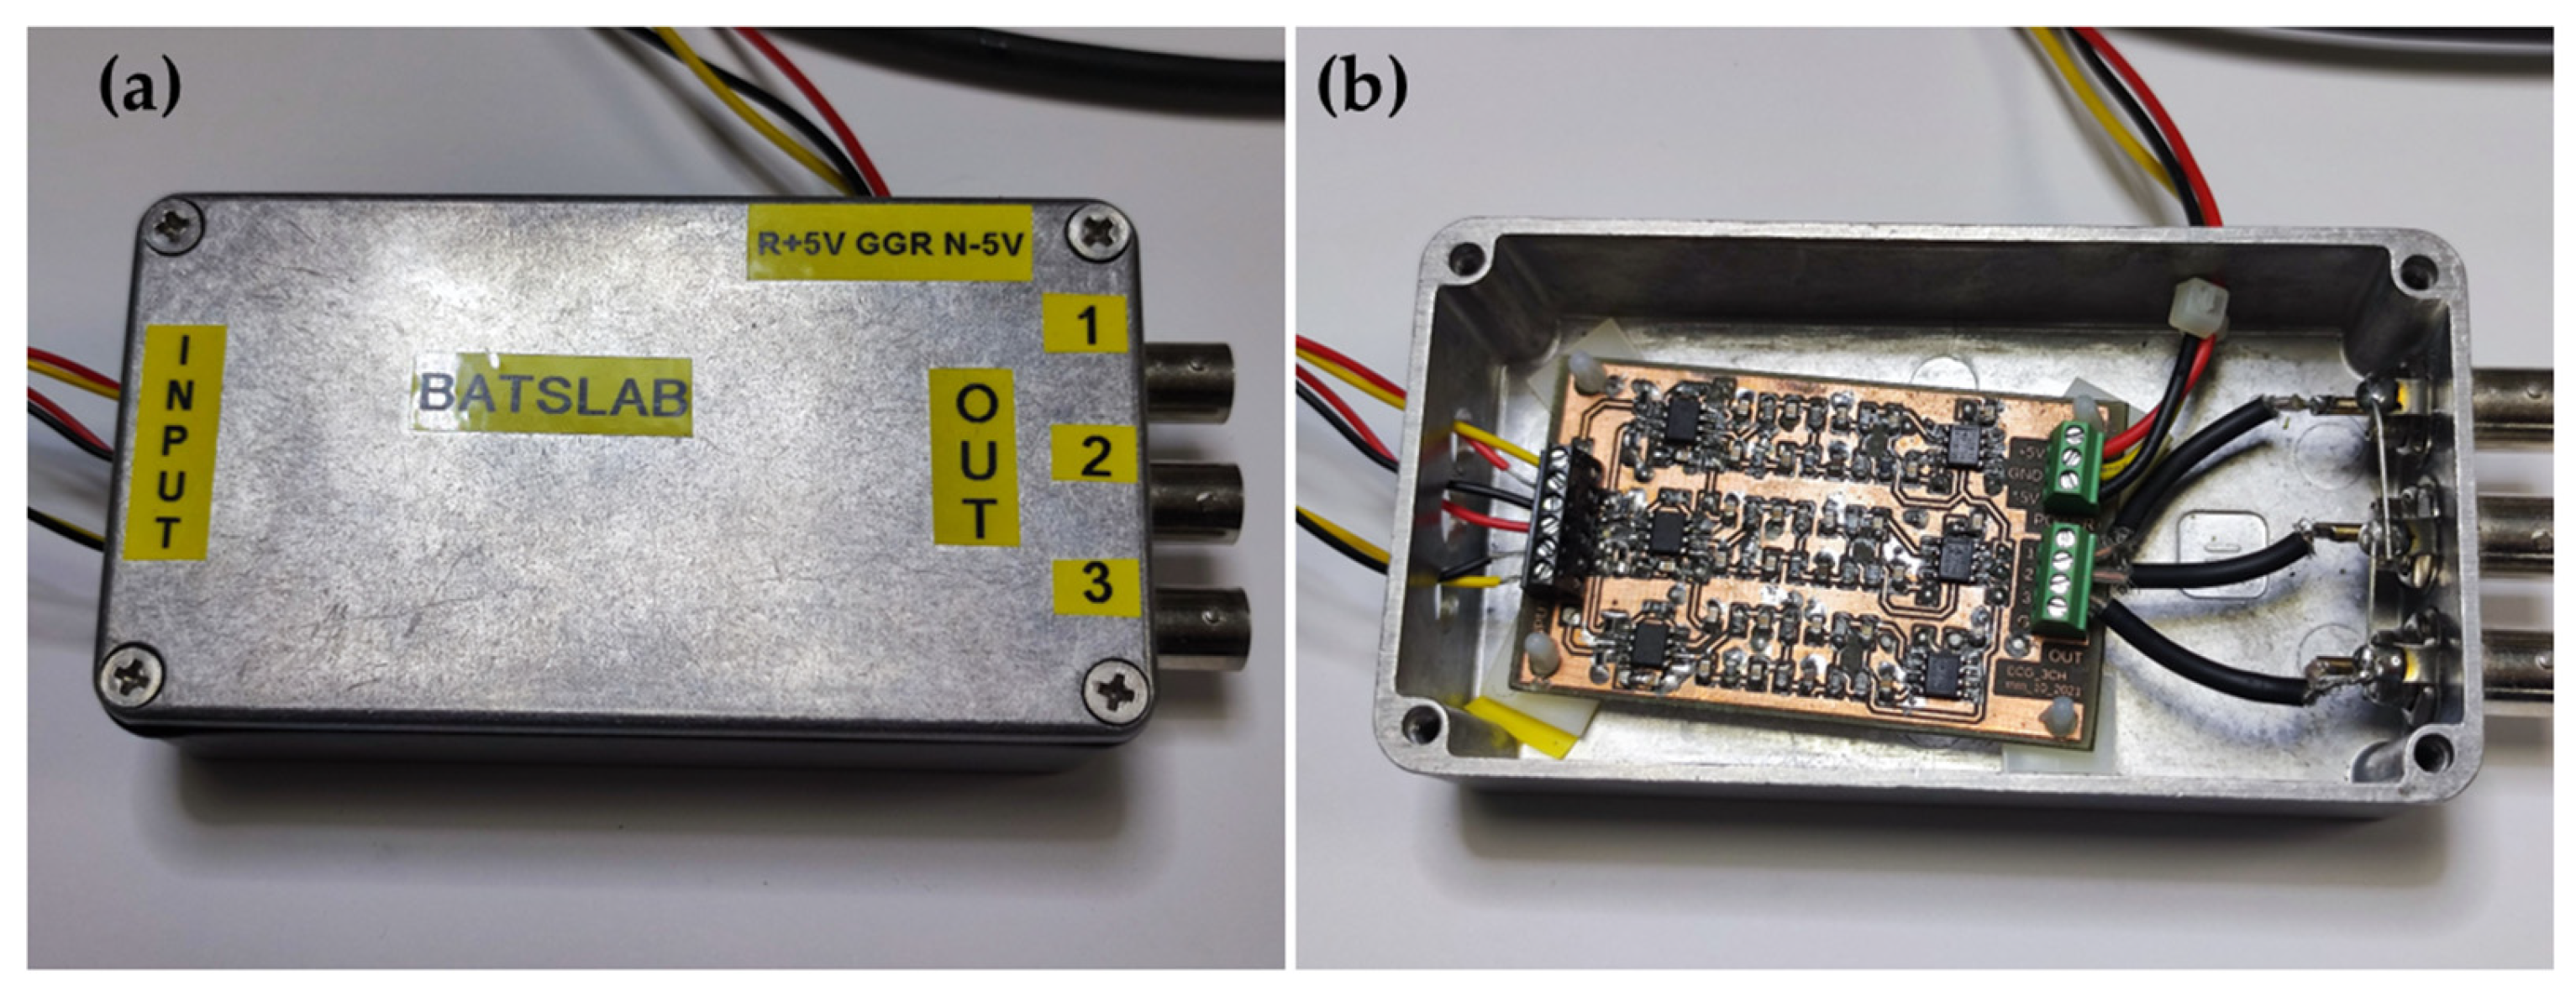
The passive notch filter makes it possible to eliminate the specific frequency of f = 50 Hz by means of a combination of various resistors and capacitors, which, thanks to their particular positioning, create a system consisting of a pole and two simple zeros that make it possible to stop the frequency that causes noise. Finally, an active third-order low-pass filter was added to attenuate all frequencies above the cutoff frequency f = 150 Hz, with a trend of −60 dB per decade. In addition, two capacitors, of capacitance C = 0.1 μF, were added between the ground and the amplifier supplies. This addition is necessary, as these capacitors have the function of noise suppressors, absorbing voltage peaks usually coming from the power supply itself. For this reason, they have been mounted as close as possible to the power supply pins of the ICs. The manufacturing of the prototype is reported in Figure 4.
The EMG signal detected and acquired by the circuit is transmitted with a General-Purpose Input/Output (GPIO) connection to an 8-channel analogue-to-digital converter, specifically the MCP3008 converter. The ADC converter, configured in Python, is connection to a Raspberry processor, which has the task of storing and sending the data on a cloud platform, where the digitized signals are extrapolated from the processor’s base data and then processed. This step is necessary because the Raspberry needs an external ADC converter, which is why we have used the GPIO, through which we can connect external electronic components and, among them, of course, an ADC converter.
Specifically, the system processes three different stages: the first is to acquire the signal, the second is to display it, and the last is to save and send it. The electronic system consists of an acquisition process necessary to acquire the signal; a process of displaying the EMG signal during the process of Maximum Voluntary Concentration (MCV), which retrieves the file with the previously acquired data and performs some processing on the signal; and finally a “Task” display process, which consists of a program that can extract from the signals the various parameters in the time domain, such as the maximum peak, the average value, and the effective value (Root Mean Square). In the first phase, the signals are detrended and then subjected to a series of lower cut filtrations at 30 Hz and a higher cut frequency of 450 Hz. This allows the transition only to certain frequencies, including those in the range of 30 Hz to 450 Hz. After the filtering operation, the signal correction is applied, which makes all the values of the signal positive so that even the negative signals are twisted relative to the time axis. This operation allows for better signal reading and allows for the calculation of standard parameters such as the average, effective value (RMS), and maximum value. Subsequently, a fourth-order low-pass filter is set to a cut frequency of 5 Hz and allows the passing of frequencies below the value of the cut rate. The main purpose of the filtering is to eliminate the noise, and in this case, through the low-pass filter, an operation of the envelope that allows the removal of the interference signal. The ultimate purpose is to extract the individual processed signal (MCV). This value allows us to redefine the signal that will no longer be evaluated by a voltage but by a percentage; this operation takes the name of normalization and consists of acquiring the extent to which a subject can contract a muscle and then assigning the value of maximum contraction to the maximum value (corresponding to 1), and the contraction zero (corresponding a 0). Usually, for this measurement, the subject has a maximum contraction for a few seconds, and this process is repeated several times with a period of pause between one contraction and the other. This is a powerful method for comparing electromyographic data obtained from tests on different subjects.
Normalizing sEMG signals compared to MVC is also a commonly used method to reduce variability between different recordings. For the implementation of the latest analysis of “Task,” the same blocks were used in the MCV. Therefore, there exist a process for reading the previously acquired signal, a process to perform the detrending of the signals, a filter that passes the band of the fourth order with a bandwidth ranging from 30 Hz to 450 Hz, a procedure for performing the correction of the signal, and a low-pass filter of the fourth order with a cutting frequency equal to 5 Hz. In addition, there are also blocks here that are intended to read the values of the peaks detected by the previous process on the three channels of the maximum voluntary contraction signal. These will be used to normalize the signal that is translated with the ratio between the processed and filtered signal and the maximum value of the MCV calculated with the previous process. Following the normalization, the characteristic parameters of the signal are extracted, i.e., the average value, RMS, and maximum value. The program implemented on the Raspberry saves the data on the device in .txt format and sends it to a cloud platform to be subsequently post-processed (Section 4). The choice of a Raspberry Pi card is due to the fact that it has adequate memory for saving and sending the acquired data, because it has a large volume, and finally because it offers high performance. Furthermore, Raspy-GPIO allows the status of a GPIO to be viewed and its behavior to be modified. The GPIO zero Python library has ensured a quality leap in programming thanks to higher-level abstractions such as a motion sensor, light sensor, LED, and motor, and has allowed the adoption of an approach capable of managing the underlying hardware by reading or setting its state with more intuitive commands. The integrated signal acquisition, storage, and transmission system presents a different approach than other integrated systems [47,48]. The proposed integrated system aims to allow the operator to analyze the signals and data remotely, while the patient can remain comfortably at home. While the authors of the paper [49] chose the Arduino Mega to avoid the memory and power limitations of smaller boards, as data acquisition and filtering required a large amount of memory, the proposed paper divides the process into two phases. The first focuses on the acquisition of the EMG signal, trying to eliminate interference and keep the signal unaltered; the second focuses on storage and transmission. The subdivision of the process ensures a better quality of the acquired and processed signal, at the expense of increasing the complexity of the system.

5. Post-Processing EMG Signals: Proposed Supervised Learning Model

A supervised learning model (SLM) that has shown great promise for analyzing temporal and visual data is the convolutional neural network (CNN) [50,51]. CNNs’ distinctive architecture, composed of convolutional, pooling, and fully connected layers, makes them especially good at identifying patterns and structures in data. By applying convolution operations to the input data, the convolutional layers enable the network to recognize regional patterns and characteristics. The dimensionality of the data is reduced by pooling layers. This improves computation efficiency and increases the network’s resistance to even tiny changes in the input. Even though traditional CNNs are designed for image data, they can be adapted to handle sequential data such as time series or signal data through one-dimensional convolutional layers [52,53].
A recent work has shown that one-dimensional convolutional neural networks (1D-CNNs) are specifically intended to process sequential data, making them highly suitable for analyzing EMG signals [54]. The proposed SLM is an advanced 1D-CNN trained from scratch, which analyzes sEMG signals and detects complex patterns to identify healthy subjects or those with potential neuropathy.

5.1. Data Assessment

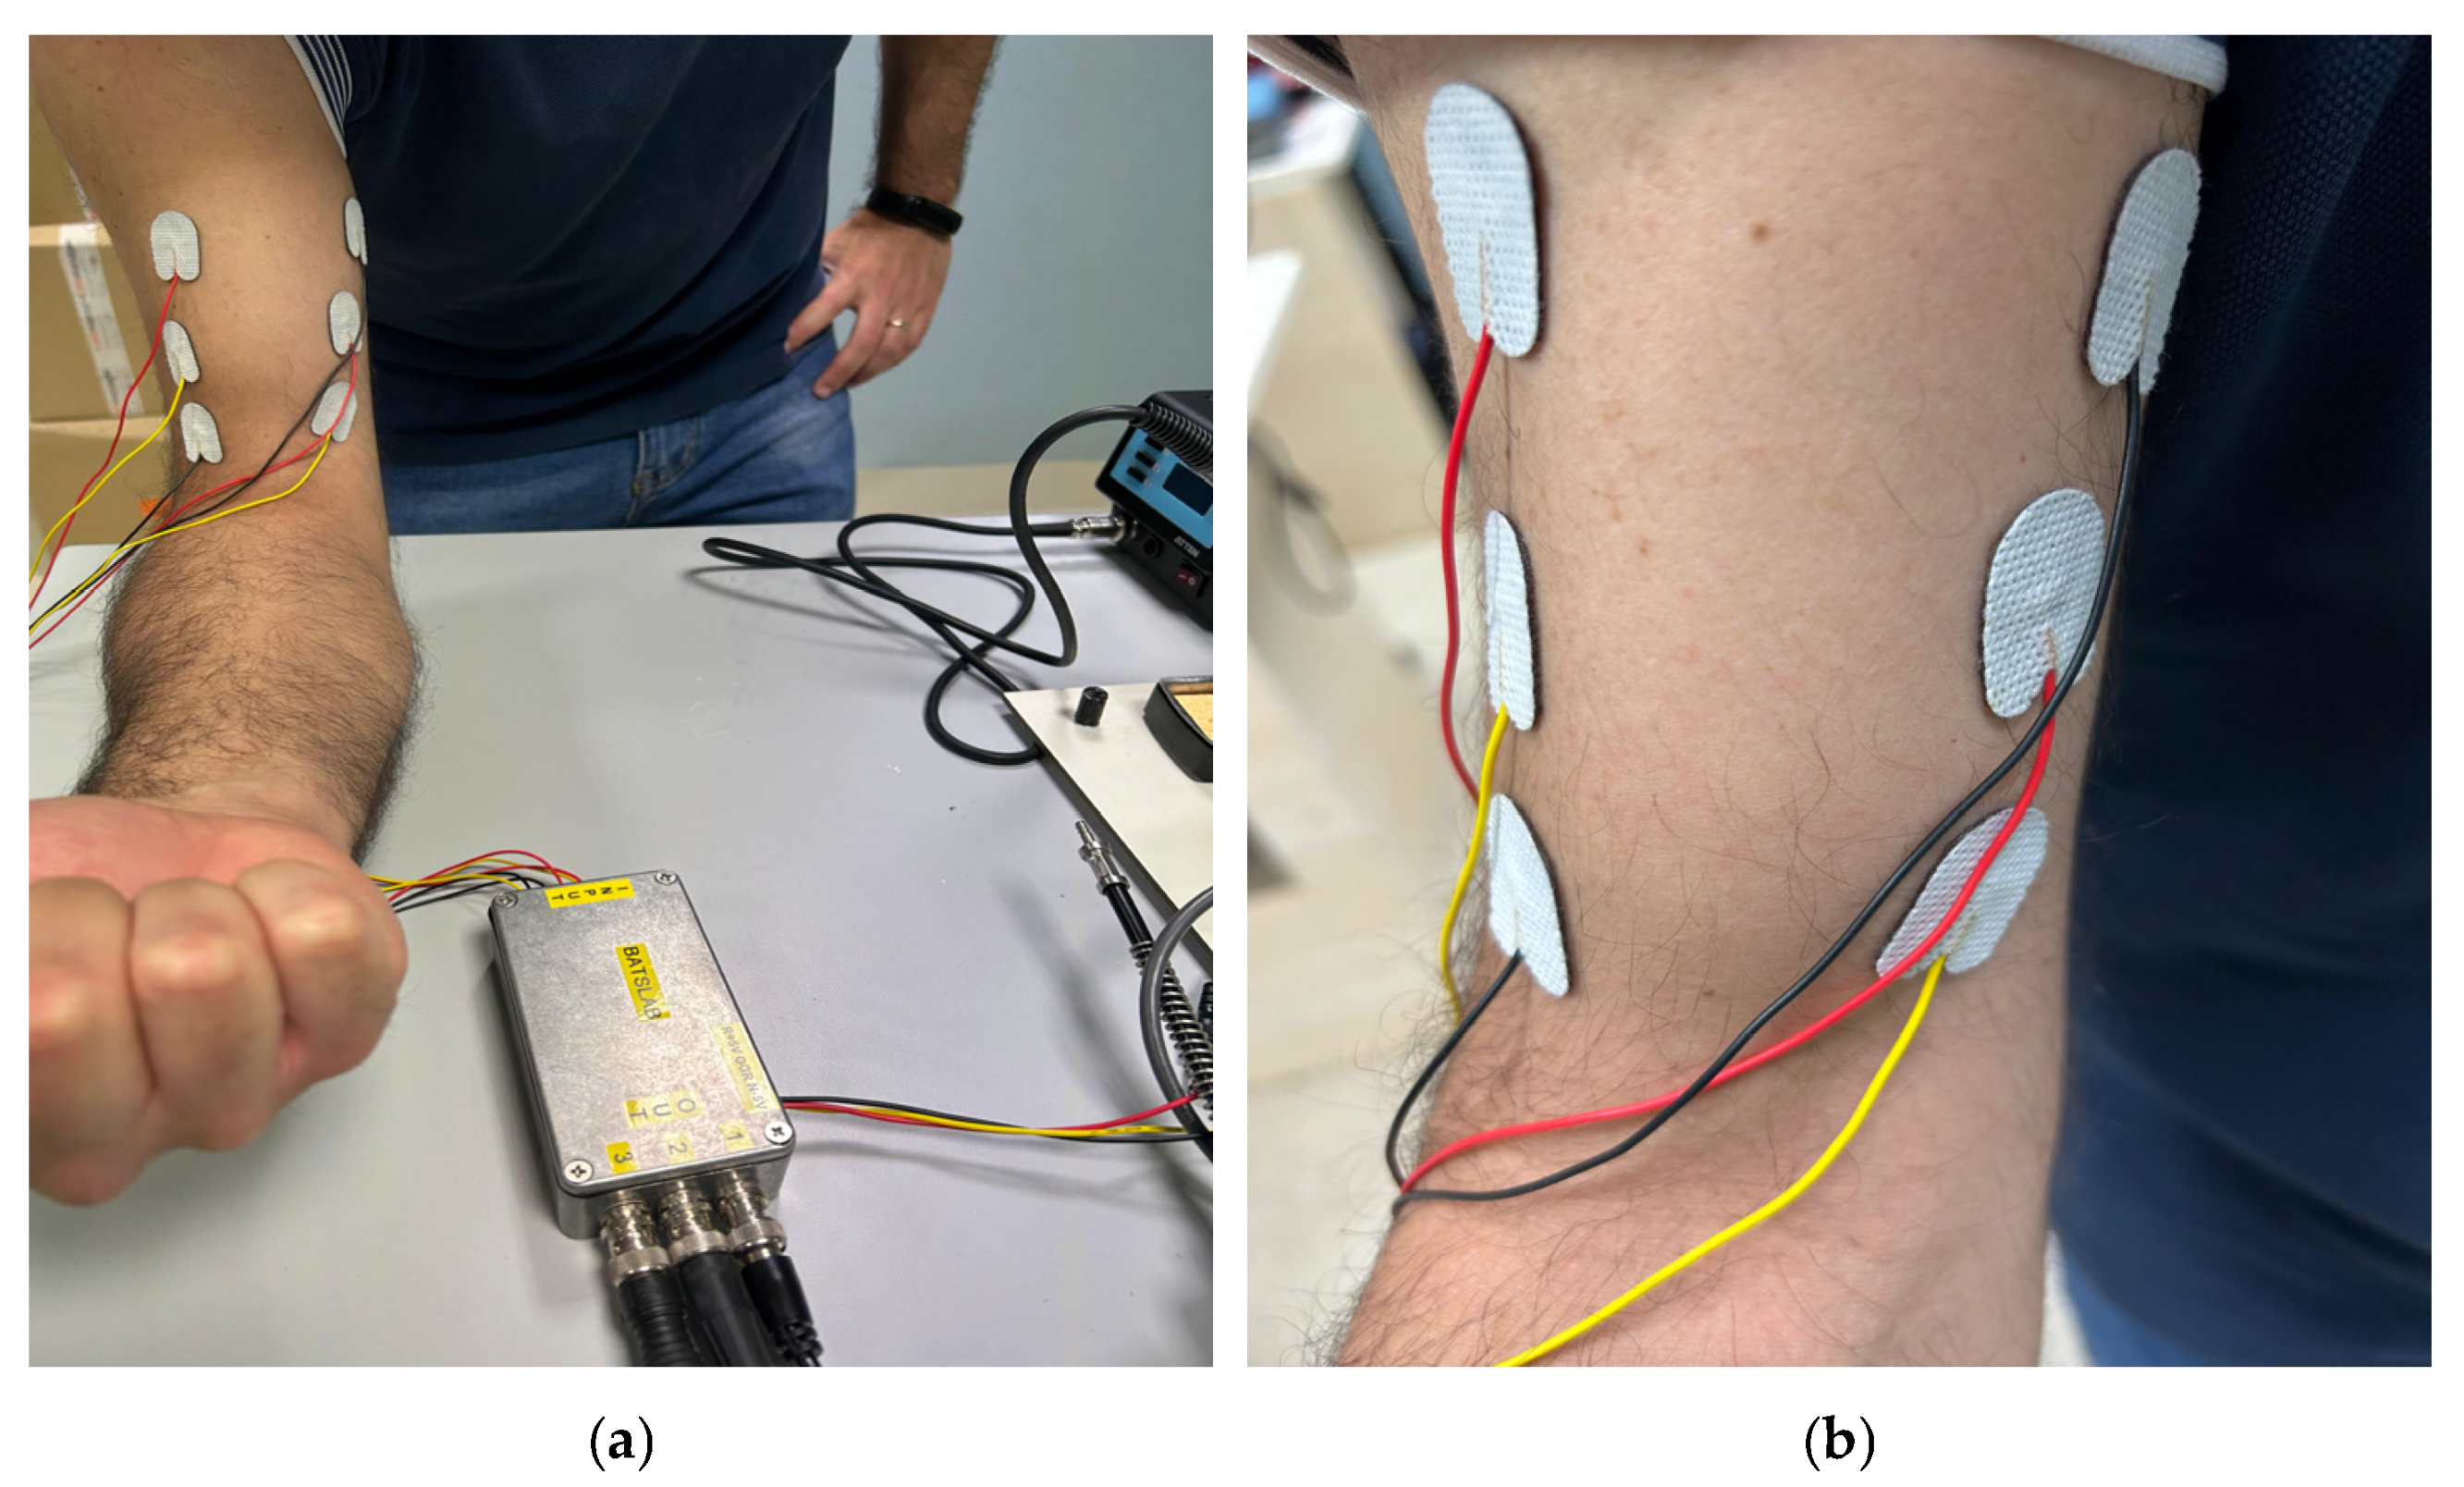
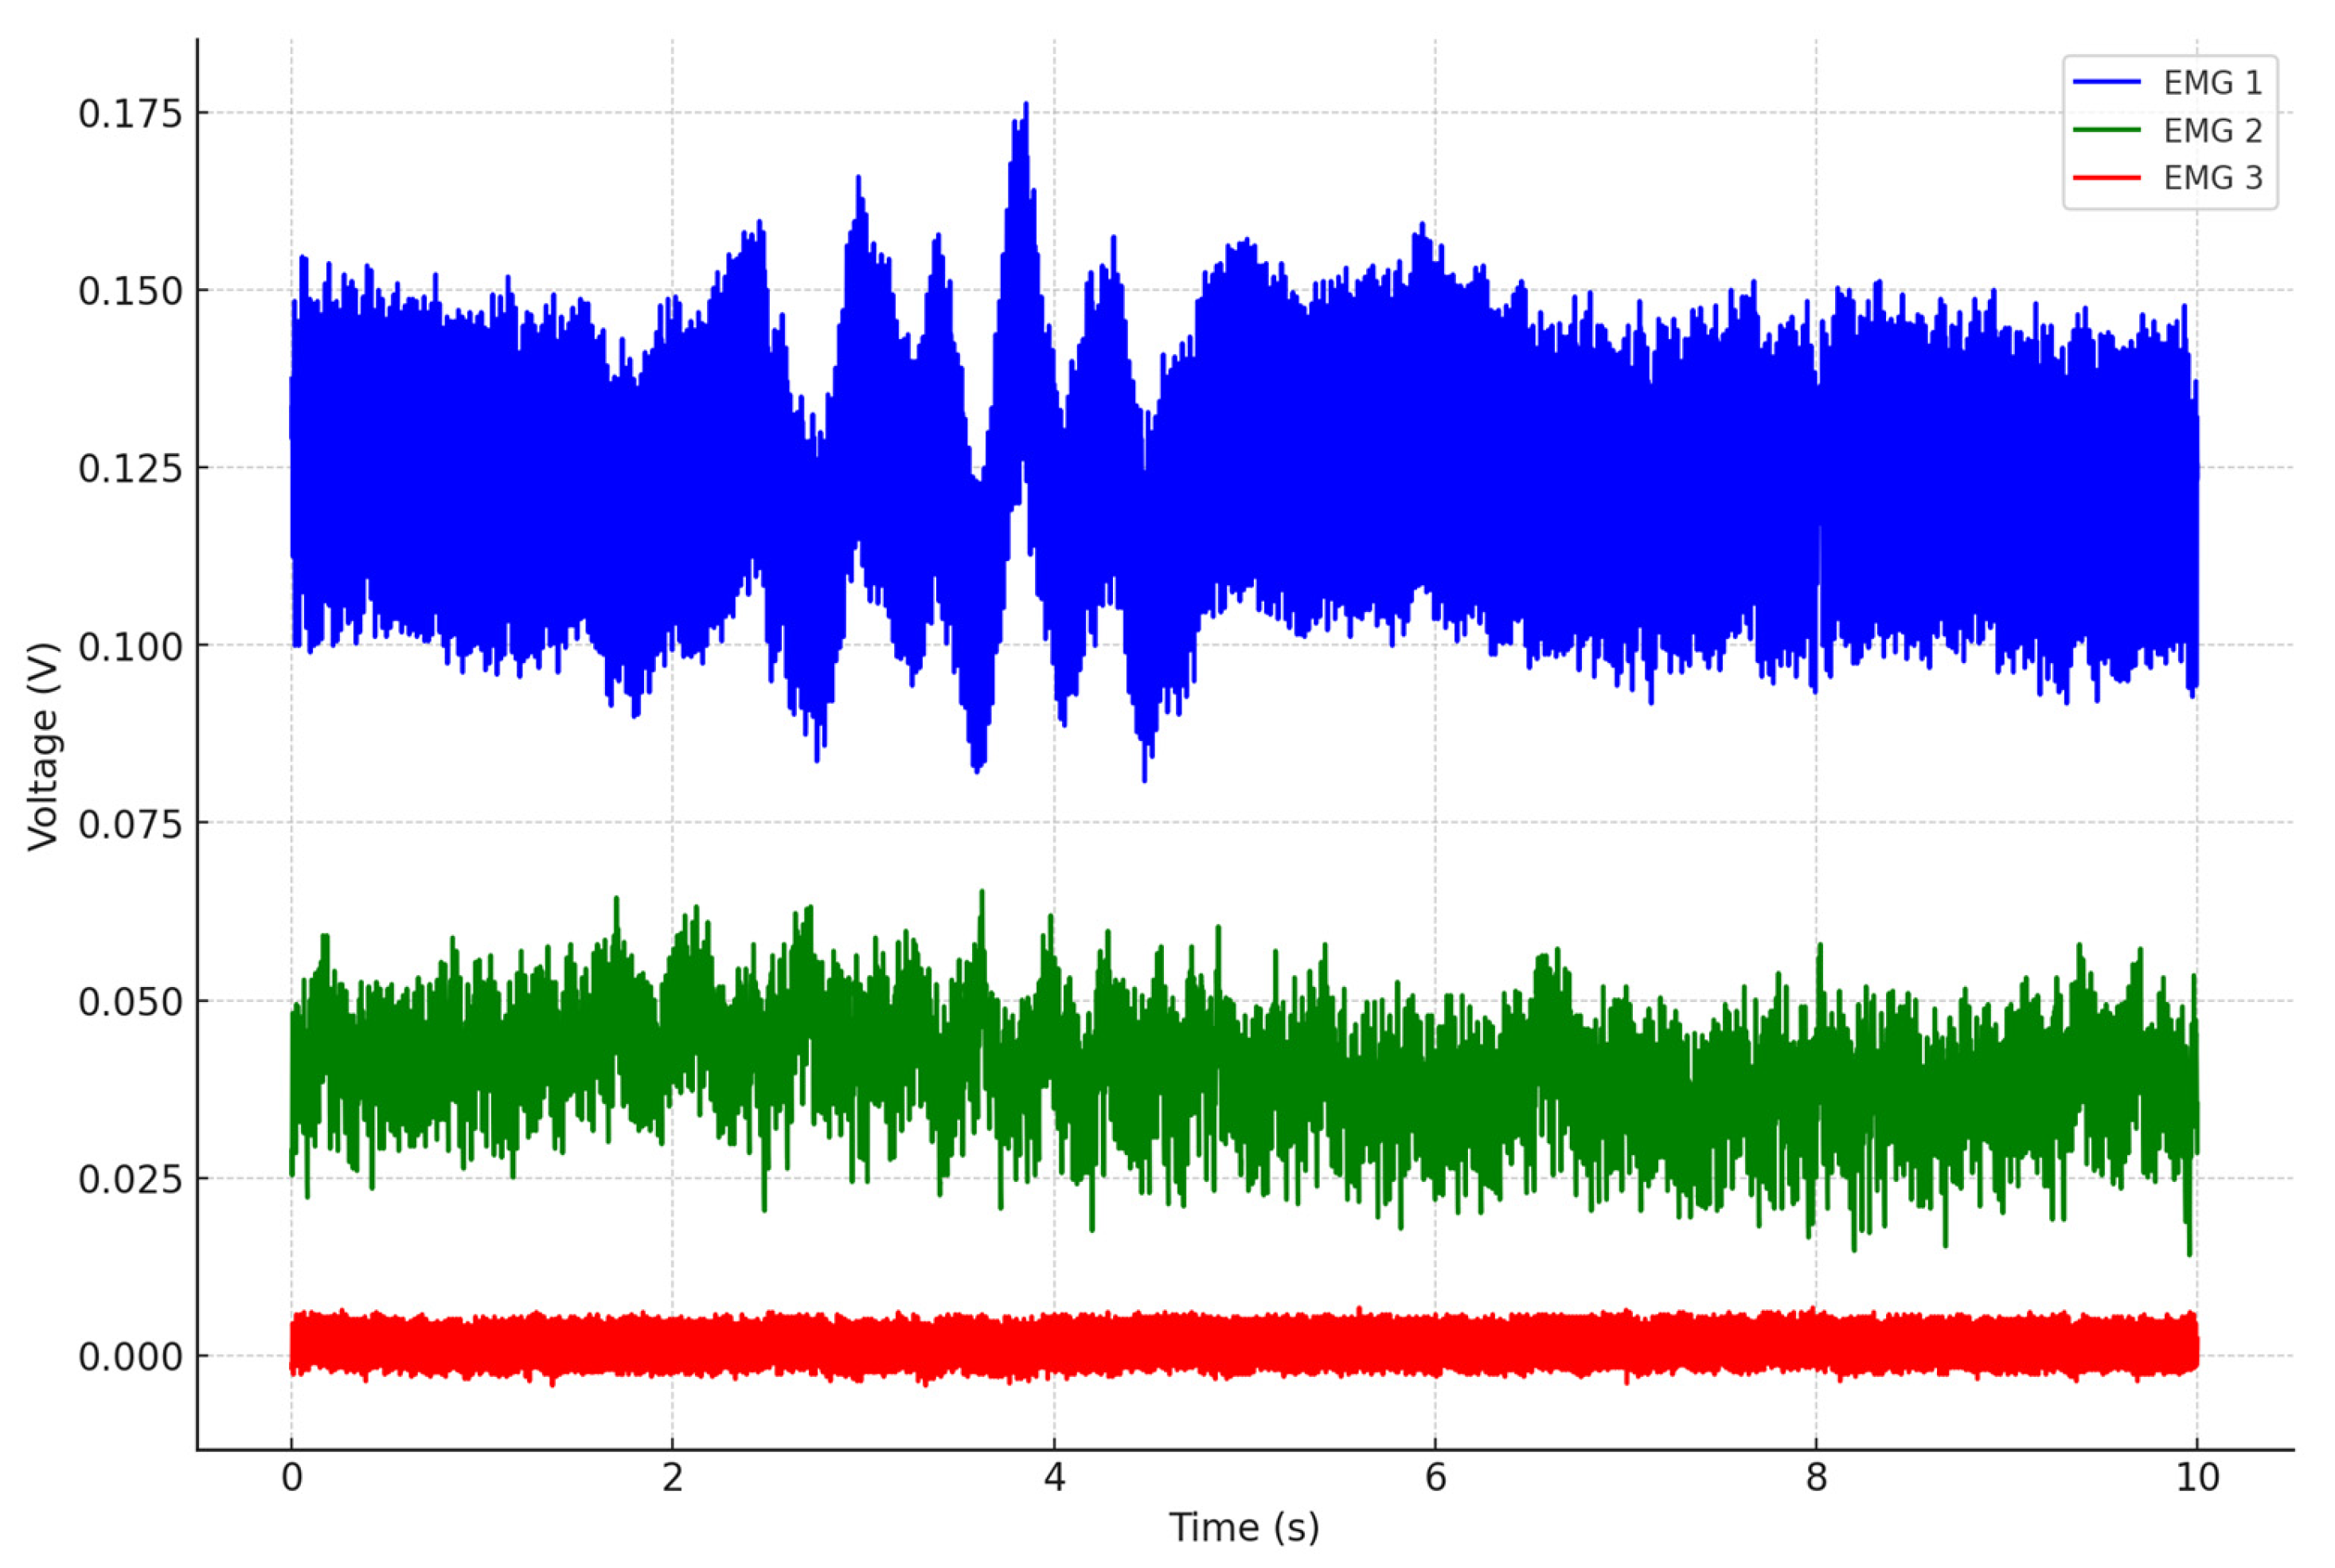
The post-processing phase of signal analysis involved examining biopotential signals through sEMG on 200 subjects, 110 females and 90 males, aged between 20 and 40 years. These subjects were divided in two classes: healthy and potential neuropathy. The signals were obtained by placing six electrodes on the bicep muscle of each subject, assessing voltage values over time during MVC conditions and during “task” operation for 10 s (Figure 5).
The signals are normalized by making the ratio between the signal acquired during the task and that derived from the MCV. The EMG data collected represent tension over time measured across the six electrodes.
The voltage profile on healthy subjects is homogeneous, and there are no sudden changes in the trend of the curves (Figure 6).
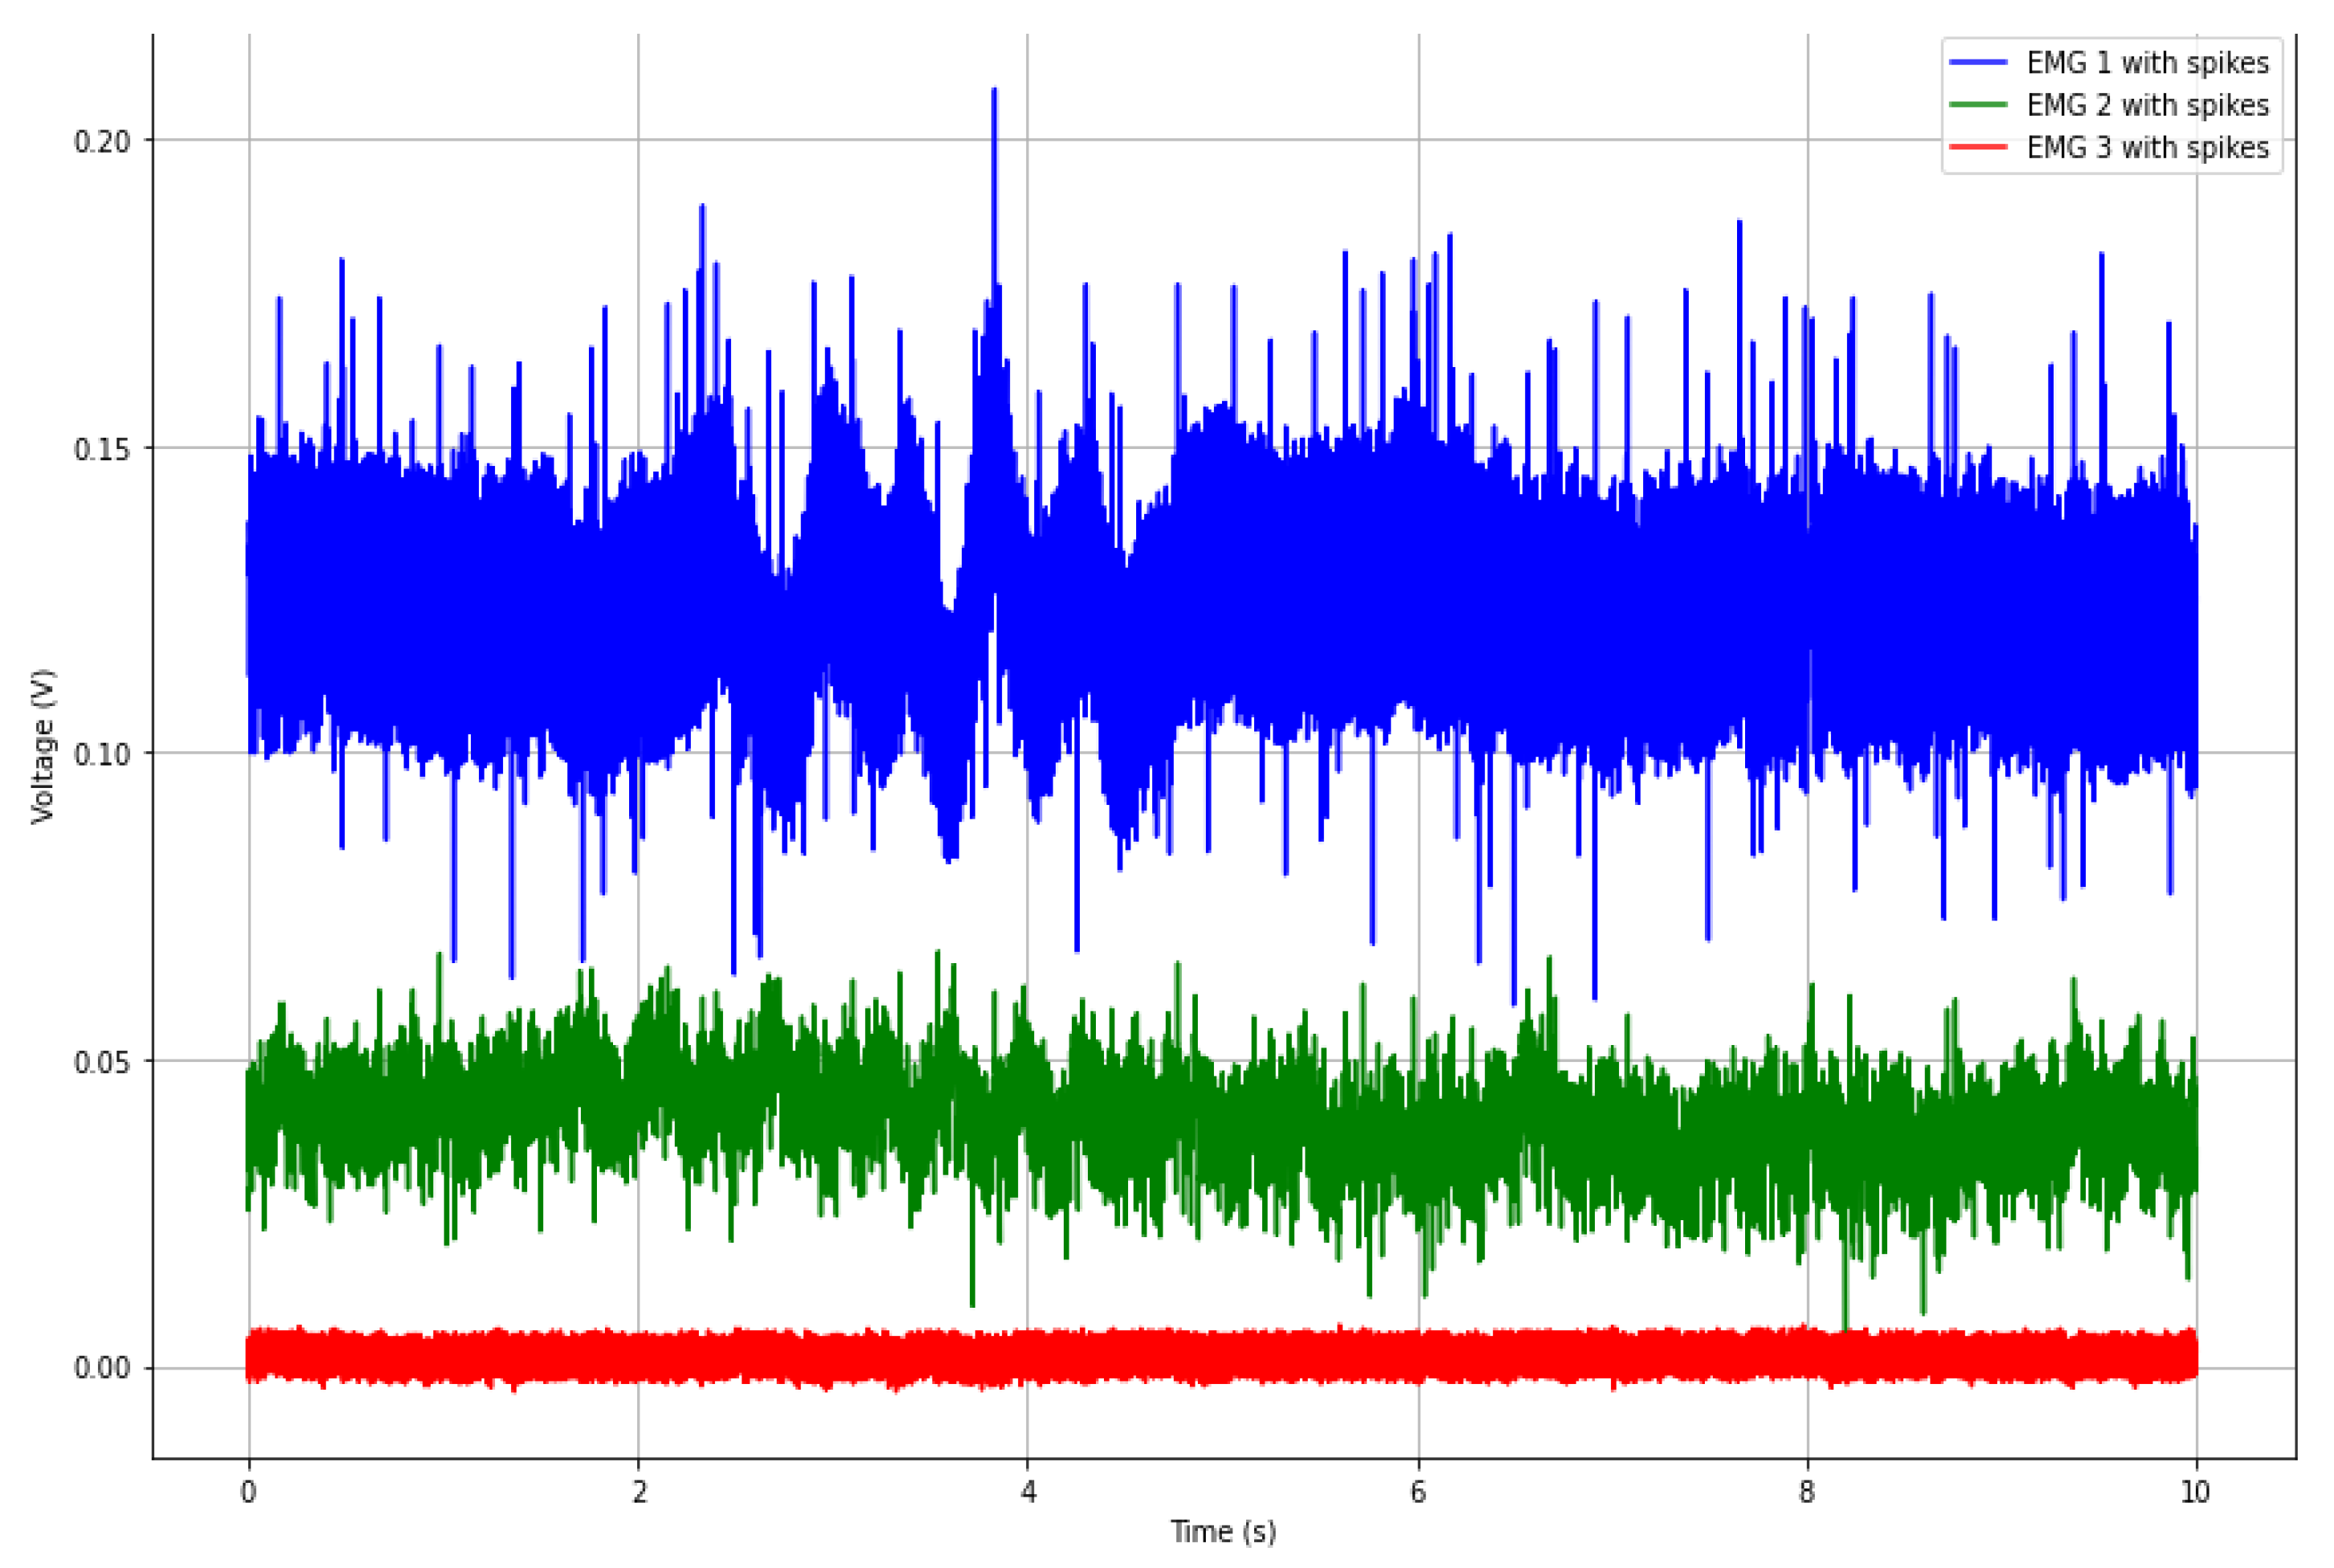
Patients that have abnormal voltage values on the EMG have conditions potentially attributable to a neuropathy.
In particular, the EMG graph shows spikes that at their highest or lowest points are more than 30% away from the mean trend line (Figure 7).

5.2. Data Pre-Processing

The pre-processing phase of sEMG data plays a crucial role to ensure that the raw signals are effective for input into the advanced 1D-CNN. Pre-processing techniques provide help to enhance the quality of the data, reduce noise, and improve the performance of the neural network [55,56]. At the beginning, sEMG .txt files was converted into matrix .xlc files of [20,000, 6] dimension. sEMG data represent three different voltage values over time, measured by the six electrodes placed on the biceps of the subjects. The data loading procedure included reading these files in an organized manner, ensuring they were consistently structured for the subsequent pre-processing and analysis. Thereafter, normalization was performed to scale the sEMG signals to a consistent range. Normalization was performed by dividing each value in the sEMG signal by the maximum value in the dataset, resulting in normalized values between 0 and 1, in order to stabilize the training process and improve the convergence of the network. Right after normalization, the data from multiple subjects were concatenated to form a comprehensive dataset. This step involved combining the normalized sEMG signals of healthy subjects and those with neuropathic conditions into a single array. Each subject’s data were assigned a label (0 for healthy and 1 for neuropathic) to facilitate supervised learning. The dataset was divided in an 80–20 working split; 80% of the data was used for training, and the remaining 20% was reserved for testing. This split ensured that the network was trained on a substantial portion of the data while being evaluated on unseen examples, allowing for an accurate assessment of its generalization performance. The last pre-processing step was data augmentation. Data augmentation is important to enhance the robustness of the neural network. For sEMG signals, augmentation included adding noise, shifting the signal in time, and varying the amplitude slightly. These augmentations help to simulate different scenarios and improve the network’s ability to generalize to new unseen data [57,58].

5.3. SLM Architecture

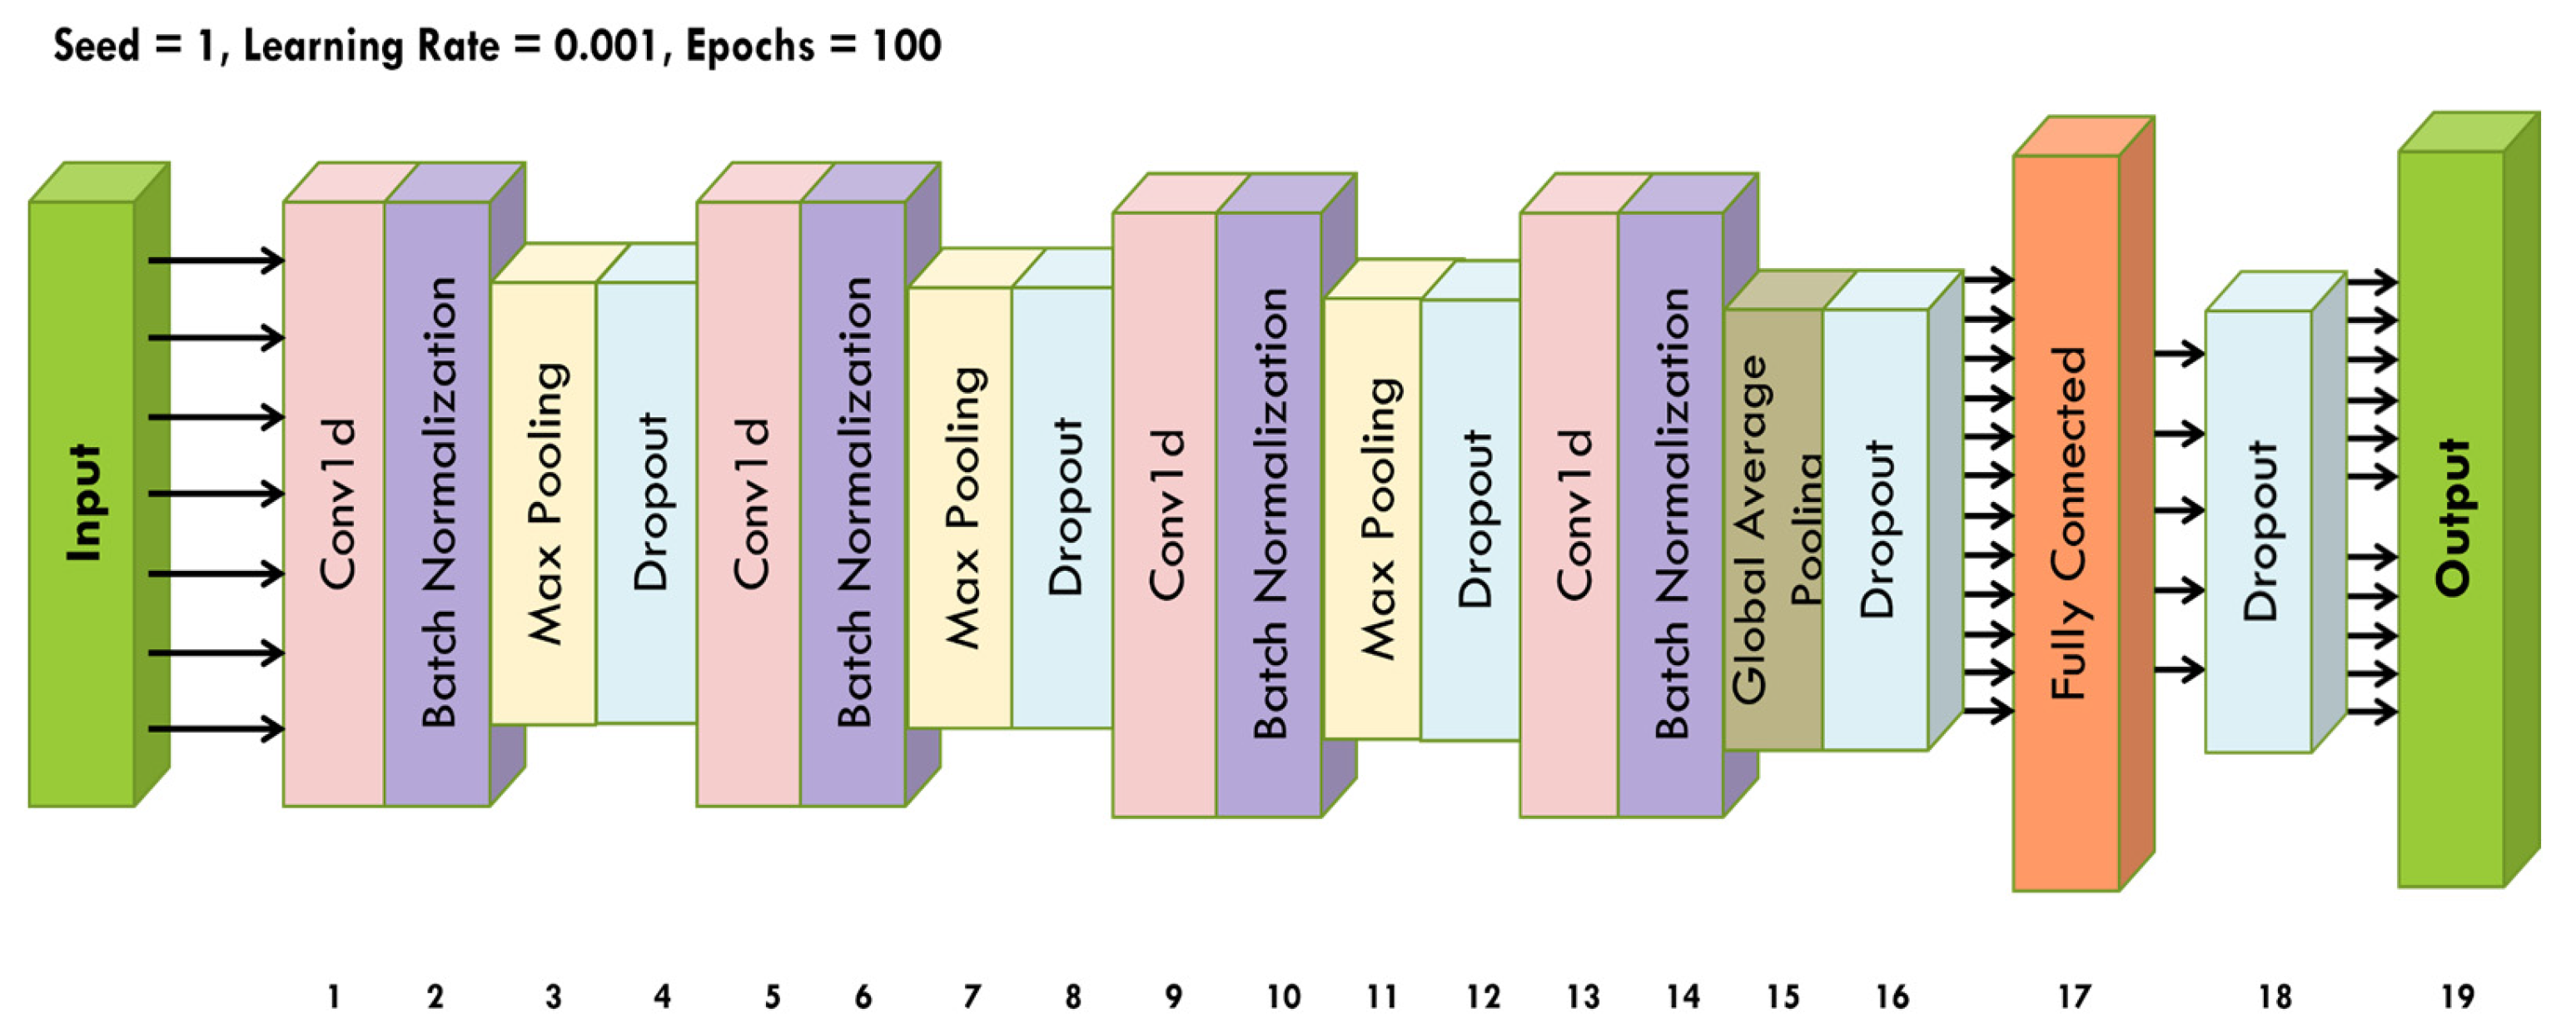
In this study, we developed an advanced one-dimensional convolutional neural network (1D-CNN) designed for classification of surface electromyographic (sEMG) signals, which show temporal patterns indicative of muscle activity [59,60,61]. The input to the network is a three-dimensional tensor of shape (20,000, 6, 3), representing the sequence length and the number of channels of the sEMG signals. The SLM architecture is composed of a first convolutional layer (64 filters, kernel size = 5) with Rectified Linear Unit (ReLU) as an activation function to introduce nonlinearity and allow the network to learn complex patterns. This layer is intended to extract local features from sEMG signals, capturing important characteristics like spikes and troughs associated with muscle contractions. Batch normalization is then used to normalize the output, thereby stabilizing and accelerating the training process. Batch normalization guarantees that activations remain within a reasonable range, resulting in faster convergence and higher performance.
The output of this layer is then passed through a max-pooling layer in order to downsample the dimensionality of the feature maps. This operation retains the most significant features and reduces computational complexity, making the network more efficient and less sensitive to small shifts in the input data. Immediately after, a dropout layer (rate = 0.3) is also used to prevent overfitting by randomly setting a fraction of the input units to zero during training, causing the network to learn redundant representations and improve generalization. The network then moves on to a second convolutional layer (128 filters, kernel size = 5), followed by another batch normalization layer. This convolutional layer extracts higher-level features from downsampled feature maps. A second max-pooling layer is used to reduce dimensionality further, followed by a dropout layer to prevent overfitting. Third and fourth convolutional layers capture even more complex patterns in sEMG signals and apply batch normalization to the output for stability. A global average pooling layer is then used to condense each feature map into a single value by averaging all of the values contained within it.
At the end, the flattened output is then fed into a fully connected dense layer with 256 units and ReLU activation, which combines the learned features into a comprehensive representation. The output layer is made up of a single unit with a sigmoid activation function that returns a probability value between 0 and 1, indicating the possibility of the input being classified as neuropathic. The architecture of the constructed SLM has 19 layers following the input signal. (Figure 8).
The framework was implemented with Tensorflow and the Keras library “https://keras.io” (accessed on 16 April 2024) in Python 3.11.9.
The model was developed and tested on a machine equipped with an NVIDIA GPU, utilizing the CUDA and cuDNN libraries to accelerate the training process. The 1D-CNN model was built using the Sequential API from TensorFlow’s Keras module. Below is the detailed implementation of the model architecture (Table 2).

6. Results and Discussion

Overall, this advanced 1D-CNN uses multiple convolutional layers, and aims to capture and classify intricate patterns in sEMG signals. The network’s architecture is specifically designed to handle the high dimensionality and complexity of sEMG data, making it an effective tool for distinguishing healthy from neuropathic subjects based on muscle electrical activity.
The results clearly show that the proposed neural network achieved high accuracy on both the training (96.732%) and test sets (94.234%). These findings indicate that the model is highly effective (Table 3).
The high accuracy of the model in detecting neuropathies is promising for potential integration of such neural networks into automated clinical diagnostic systems. These systems could assist medical professionals in diagnosing neuromuscular conditions, reducing the time required for manual analysis of sEMG signals and increasing diagnostic accuracy [62,63]. Although the results are promising, the size of the dataset used is relatively limited. Future studies could benefit from using larger and more diverse datasets to confirm the robustness and generalizability of the model. To translate these results into practical clinical applications, extensive clinical validation is necessary.

7. Conclusions

This study proposes a methodology for the analysis of sEMG data on different patients with an innovative methodology that integrates an electronic system and soft-computing techniques. In particular, the realization of the electronic circuit allowed the acquisition of the information of superficial electromyography using a non-invasive approach on several healthy subjects and subjects with potential neuropathy. The sEMG data from the electrodes placed on the patient’s biceps are appropriately collected from the acquisition circuit. The acquired signals are sent via the GPIO protocol to a Raspberry Pi processor, which has the task of converting files to .txt format and sending them to a cloud platform through communication with a GSM module. Subsequently, the properly pre-processed and normalized data are used for the training of an advanced 1D-CNN, which aims to identify the trend of signals and classify healthy subjects and subjects with potential neuropathy. Overall, the method proposed achieved a good result in terms of accuracy.
Future improvements could lead to studies that include collaborations with medical institutions to test the model on real clinical data and evaluate its effectiveness in a clinical context. Integrating other signal modalities, such as electrocardiograms (ECGs) or electroencephalograms (EEGs), could provide a more comprehensive view of the neuromuscular status of the subject and further improve the diagnostic precision of the model.

Author Contributions

Conceptualization, F.L. and D.P.; methodology, S.A.P. and G.O.; software, D.P. and G.A.; validation, F.L. and M.V.; formal analysis, S.A.P.; investigation, D.P.; resources, F.L.; data curation, G.A.; writing—original draft preparation, F.L. and D.P.; writing—review and editing, G.A. and M.V.; visualization, M.V.; supervision, F.L.F. All authors have read and agreed to the published version of the manuscript.

Funding

This research received no external funding.

Institutional Review Board Statement

The study did not require ethical approval. Review and ethical approval were waived for this study because it did not involve the administration of tests or experiments on humans, but only measurement campaigns on sEMG signals.

Data Availability Statement

The data are contained within this article.

Conflicts of Interest

The authors declare no conflicts of interest.

References

  1. Nahavandi, D.; Alizadehsani, R.; Khosravi, A.; Acharya, U.R. Application of artificial intelligence in wearable devices: Opportunities and challenges. Comput. Methods Programs Biomed. 2022, 213, 106541. [Google Scholar] [CrossRef]
  2. Nova, S.N.; Rahman, M.S.; Hosen, A.S. Deep Learning in Biomedical Devices: Perspectives, Applications, and Challenges. In Rhythms in Healthcare; Springer: Singapore, 2022; pp. 13–35. [Google Scholar]
  3. Fu, Y.; Zhao, J.; Dong, Y.; Wang, X. Dry electrodes for human bioelectrical signal monitoring. Sensors 2020, 20, 3651. [Google Scholar] [CrossRef]
  4. Tasneem, N.T.; Pullano, S.A.; Critello, C.D.; Fiorillo, A.S.; Mahbub, I. A low-power on-chip ECG monitoring system based on MWCNT/PDMS dry electrodes. IEEE Sens. J. 2020, 20, 12799–12806. [Google Scholar] [CrossRef]
  5. Washington, P.; Park, N.; Srivastava, P.; Voss, C.; Kline, A.; Varma, M.; Tariq, Q.; Kalantarian, H.; Schwartz, J.; Patnaik, R.; et al. Data-driven diagnostics and the potential of mobile artificial intelligence for digital therapeutic phenotyping in computational psychiatry. Biol. Psychiatry Cogn. Neurosci. Neuroimaging 2020, 5, 759–769. [Google Scholar] [CrossRef] [PubMed]
  6. Menniti, M.; Laganà, F.; Oliva, G.; Bianco, M.G.; Fiorillo, A.S.; Pullano, S.A. Development of Non-Invasive Ventilator for Homecare and Patient Monitoring System. Electronics 2024, 13, 790. [Google Scholar] [CrossRef]
  7. Menniti, M.; Oliva, G.; Laganà, F.; Bianco, M.G.; Fiorillo, A.S.; Pullano, S.A. Portable Non-Invasive Ventilator for Homecare and Patients Monitoring System. In Proceedings of the 2023 IEEE International Symposium on Medical Measurements and Applications (MeMeA), Jeju, Republic of Korea, 14–16 June 2023. [Google Scholar]
  8. Gregorio, F.; González, G.; Schmidt, C.; Cousseau, J. Signal Processing Techniques for Power Efficient Wireless Communication Systems: Practical Approaches for RF Impairments Reduction; Springer: Cham, Switzerland, 2020. [Google Scholar]
  9. Wu, Y.; Guo, K.; Chu, Y.; Wang, Z.; Yang, H.; Zhang, J. Advancements and Challenges in Non-Invasive Sensor Technologies for Swallowing Assessment: A Review. Bioengineering 2024, 11, 430. [Google Scholar] [CrossRef]
  10. Vidhya, C.M.; Maithani, Y.; Singh, J.P. Recent advances and challenges in textile electrodes for wearable biopotential signal monitoring: A comprehensive review. Biosensors 2023, 13, 679. [Google Scholar] [CrossRef] [PubMed]
  11. Pulcinelli, M.; Pinnelli, M.; Massaroni, C.; Lo Presti, D.; Fortino, G.; Schena, E. Wearable Systems for Unveiling Collective Intelligence in Clinical Settings. Sensors 2023, 23, 9777. [Google Scholar] [CrossRef]
  12. Merces, L.; Ferro, L.M.M.; Nawaz, A.; Sonar, P. Advanced Neuromorphic Applications Enabled by Synaptic Ion-Gating Vertical Transistors. Adv. Sci. 2024, 11, 2305611. [Google Scholar] [CrossRef]
  13. Laganà, F.; De Carlo, D.; Calcagno, S.; Pullano, S.A.; Critello, D.; Falcone, F.; Fiorillo, A.S. Computational model of cell deformation under fluid flow based rolling. In Proceedings of the 2019 E-Health and Bioengineering Conference (EHB), Iasi, Romania, 21–23 November 2019. [Google Scholar]
  14. Pandarinath, C.; Bensmaia, S.J. The science and engineering behind sensitized brain-controlled bionic hands. Physiol. Rev. 2022, 102, 551–604. [Google Scholar] [CrossRef]
  15. Arif, A.; Wang, Y.; Yin, R.; Zhang, X.; Helmy, A. EF-Net: Mental State Recognition by Analyzing Multimodal EEG-fNIRS via CNN. Sensors 2024, 24, 1889. [Google Scholar] [CrossRef] [PubMed]
  16. Watson, N.; Fernandez, C.; Rusk, S.; Nygate, Y.; Turkington, F.; Mortara, J. 426 Clinical Validation of A.I. Analysis of Photoplethysmogram (PPG) Based Sleep-Wake Staging, Total Sleep Time, and Respiratory Rate. Sleep 2021, 44, A168–A169. [Google Scholar] [CrossRef]
  17. Rajwal, S.; Aggarwal, S. Convolutional Neural Network-Based EEG Signal Analysis: A Systematic Review. Arch. Comput. Methods Eng. 2023, 30, 3585–3615. [Google Scholar] [CrossRef]
  18. Wei, Z.; Zhang, Z.Q.; Xie, S.Q. Continuous Motion Intention Prediction Using sEMG for Upper-Limb Rehabilitation: A Systematic Review of Model-Based and Model-Free Approaches. IEEE Trans. Neural Syst. Rehabil. Eng. 2024, 32, 1466–1483. [Google Scholar] [CrossRef] [PubMed]
  19. Tchantchane, R.; Zhou, H.; Zhang, S.; Alici, G. A review of hand gesture recognition systems based on noninvasive wearable sensors. Adv. Intell. Syst. 2023, 5, 2300207. [Google Scholar] [CrossRef]
  20. Ozdemir, M.A.; Kisa, D.H.; Guren, O.; Akan, A. Dataset for multi-channel surface electromyography (sEMG) signals of hand gestures. Data Brief 2022, 41, 107921. [Google Scholar] [CrossRef] [PubMed]
  21. Strzecha, K.; Krakós, M.; Więcek, B.; Chudzik, P.; Tatar, K.; Lisowski, G.; Mosorov, V.; Sankowski, D. Processing of EMG Signals with High Impact of Power Line and Cardiac Interferences. Appl. Sci. 2021, 11, 4625. [Google Scholar] [CrossRef]
  22. Zhang, X.; Barkhaus, P.E.; Rymer, W.Z.; Zhou, P. Machine learning for supporting diagnosis of amyotrophic lateral sclerosis using surface electromyogram. IEEE Trans. Neural Syst. Rehabil. Eng. 2013, 22, 96–103. [Google Scholar] [CrossRef] [PubMed]
  23. Suh, E.-S.; Mandal, S.; Harding, R.; Ramsay, M.; Kamalanathan, M.; Henderson, K.; O’Kane, K.; Douiri, A.; Hopkinson, N.S.; Polkey, M.I.; et al. Neural respiratory drive predicts clinical deterioration and safe discharge in exacerbations of COPD. Thorax 2015, 70, 1123–1130. [Google Scholar] [CrossRef] [PubMed]
  24. Khan, M.U.; Aziz, S.; Amjad, F.; Mohsin, M. Detection of dilated cardiomyopathy using pulse plethysmographic signal analysis. In Proceedings of the 2019 22nd International Multitopic Conference (INMIC), Islamabad, Pakistan, 29–30 November 2019; pp. 1–5. [Google Scholar]
  25. Conradsen, I.; Beniczky, S.; Wolf, P.; Jennum, P.; Sorensen, H.B. Evaluation of novel algorithm embedded in a wearable sEMG device for seizure detection. In Proceedings of the 2012 Annual International Conference of the IEEE Engineering in Medicine and Biology Society, San Diego, CA, USA, 28 August–1 September 2012; pp. 2048–2051. [Google Scholar]
  26. Conradsen, I.; Beniczky, S.; Wolf, P.; Kjaer, T.W.; Sams, T.; Sorensen, H.B. Automatic multi-modal intelligent seizure acquisition (MISA) system for detection of motor seizures from electromyographic data and motion data. Comput. Methods Programs Biomed. 2012, 107, 97–110. [Google Scholar] [CrossRef]
  27. Sarcher, A.; Brochard, S.; Perrouin-Verbe, B.; Raison, M.; Letellier, G.; Leboeuf, F.; Gross, R. Detection of pronator muscle overactivity in children with unilateral spastic cerebral palsy: Development of a semi-automatic method using EMG data. Ann. Phys. Rehabil. Med. 2019, 62, 409–417. [Google Scholar] [CrossRef] [PubMed]
  28. Vescio, B.; Nisticò, R.; Augimeri, A.; Quattrone, A.; Crasà, M.; Quattrone, A. Development and Validation of a New Wearable Mobile Device for the Automated Detection of Resting Tremor in Parkinson’s Disease and Essential Tremor. Diagnostics 2021, 11, 200. [Google Scholar] [CrossRef] [PubMed]
  29. Brambilla, C.; Pirovano, I.; Mira, R.M.; Rizzo, G.; Scano, A.; Mastropietro, A. Combined use of EMG and EEG techniques for neuromotor assessment in rehabilitative applications: A systematic review. Sensors 2021, 21, 7014. [Google Scholar] [CrossRef] [PubMed]
  30. Laganà, F.; De Carlo, D.; Calcagno, S.; Oliva, G.; Pullano, S.A.; Fiorillo, A.S. Modeling of Electrical Impedance Tomography for Carcinoma Detection. In Proceedings of the 2022 E-Health and Bioengineering Conference (EHB), Iasi, Romania, 17–18 November 2022. [Google Scholar]
  31. Hussain, S.; Mubeen, I.; Ullah, N.; Shah, S.S.U.D.; Khan, B.A.; Zahoor, M.; Ullah, R.; Khan, F.A.; Sultan, M.A. Modern diagnostic imaging technique applications and risk factors in the medical field: A review. BioMed Res. Int. 2022, 2022, 5164970. [Google Scholar] [CrossRef] [PubMed]
  32. Kadja, G.T.; Culsum, N.T.; Mardiana, S.; Azhari, N.J.; Fajar, A.T.; Irkham. Recent advances in the enhanced sensing performance of zeolite-based materials. Mater. Today Commun. 2022, 33, 104331. [Google Scholar] [CrossRef]
  33. Cheng, L.; Li, J.; Guo, A.; Zhang, J. Recent advances in flexible noninvasive electrodes for surface electromyography acquisition. npj Flex. Electron. 2023, 7, 39. [Google Scholar] [CrossRef]
  34. Scott, D.N.; Frank, M.J. Adaptive control of synaptic plasticity integrates micro-and macroscopic network function. Neuropsychopharmacology 2023, 48, 121–144. [Google Scholar] [CrossRef] [PubMed]
  35. Serrano-Garcia, W.; Bonadies, I.; Thomas, S.W.; Guarino, V. New Insights to Design Electrospun Fibers with Tunable Electrical Conductive–Semiconductive Properties. Sensors 2023, 23, 1606. [Google Scholar] [CrossRef] [PubMed]
  36. Coyle, D.; Sosnik, R. Neuroengineering. In Springer Handbook of Computational Intelligence; Springer: Berlin/Heidelberg, Germany, 2015; pp. 727–769. [Google Scholar]
  37. Mazzucato, L. Neural mechanisms underlying the temporal organization of naturalistic animal behavior. eLife 2022, 11, e76577. [Google Scholar] [CrossRef]
  38. Rampichini, S.; Vieira, T.M.; Castiglioni, P.; Merati, G. Complexity analysis of surface electromyography for assessing the myoelectric manifestation of muscle fatigue: A review. Entropy 2020, 22, 529. [Google Scholar] [CrossRef]
  39. Boyer, M.; Bouyer, L.; Roy, J.-S.; Campeau-Lecours, A. Reducing noise, artifacts and interference in single-channel EMG signals: A review. Sensors 2023, 23, 2927. [Google Scholar] [CrossRef] [PubMed]
  40. La Foresta, F.; Morabito, F.C.; Azzerboni, B.; Ipsale, M. PCA and ICA for the extraction of EEG components in cerebral death assessment. In Proceedings of the 2005 IEEE International Joint Conference on Neural Networks, Montreal, QC, Canada, 31 July–4 August 2005; Volume 4, pp. 2532–2537. [Google Scholar]
  41. Calcagno, S.; La Foresta, F.; Versaci, M. Independent component analysis and discrete wavelet transform for artifact removal in biomedical signal processing. Am. J. Appl. Sci. 2014, 11, 57–68. [Google Scholar] [CrossRef]
  42. Chatterjee, S.; Thakur, R.S.; Yadav, R.N.; Gupta, L.; Raghuvanshi, D.K. Review of noise removal techniques in ECG signals. IET Signal Process. 2020, 14, 569–590. [Google Scholar] [CrossRef]
  43. Ehrmann, G.; Blachowicz, T.; Homburg, S.V.; Ehrmann, A. Measuring biosignals with single circuit boards. Bioengineering 2022, 9, 84. [Google Scholar] [CrossRef] [PubMed]
  44. Blachowicz, T.; Wójcik, D.; Surma, M.; Magnuski, M.; Ehrmann, G.; Ehrmann, A. Textile fabrics as electromagnetic shielding materials—A review of preparation and performance. Fibers 2023, 11, 29. [Google Scholar] [CrossRef]
  45. Li, W. Big Data precision marketing approach under IoT cloud platform information mining. Comput. Intell. Neurosci. 2022, 2022, 4828108. [Google Scholar] [CrossRef] [PubMed]
  46. Palumbo, A.; Vizza, P.; Calabrese, B.; Ielpo, N. Biopotential Signal Monitoring Systems in Rehabilitation: A Review. Sensors 2021, 21, 7172. [Google Scholar] [CrossRef]
  47. Rodríguez-Tapia, B.; Soto, I.; Martínez, D.M.; Arballo, N.C. Myoelectric Interfaces and Related Applications: Current State of EMG Signal Processing—A Systematic Review. IEEE Access 2020, 8, 7792–7805. [Google Scholar] [CrossRef]
  48. Del Toro, S.F.; Wei, Y.; Olmeda, E.; Ren, L.; Guowu, W.; Díaz, V. Validation of a Low-Cost Electromyography (EMG) System via a Commercial and Accurate EMG Device: Pilot Study. Sensors 2019, 19, 5214. [Google Scholar] [CrossRef]
  49. Laganà, F.; Cacciola, M.; Calcagno, S.; De Carlo, D.; Megali, G.; Versaci, M.; Morabito, F.C. Evaluating Soft Computing Techniques for Path Loss Estimation in Urban Environments. Front. Artif. Intell. Appl. 2009, 204, 323–331. [Google Scholar]
  50. Alzubaidi, L.; Zhang, J.; Humaidi, A.J.; Al-Dujaili, A.; Duan, Y.; Al-Shamma, O.; Santamaría, J.; Fadhel, M.A.; Al-Amidie, M.; Farhan, L. Review of deep learning: Concepts, CNN architectures, challenges, applications, future directions. J. Big Data 2021, 8, 53. [Google Scholar] [CrossRef] [PubMed]
  51. Nwachukwu, S.C.; Edo, G.I.; Jikah, A.N.; Emakpor, O.L.; Akpoghelie, P.O.; Agbo, J.J. Recent advances in the role of mass spectrometry in the analysis of food: A review. J. Food Meas. Charact. 2024, 18, 4272–4287. [Google Scholar] [CrossRef]
  52. Pratticò, D.; Calcagno, S.; Gattuso, F.; Laganà, F.; Oliva, G.; Pullano, S.A.; La Foresta, F. A Soft Computing Approach for Sensory Analysis with Thermographic Techniques for Structural Monitoring of Bronze Statues. In Proceedings of the NMP 2024, Reggio Calabria, Italy, 22–24 May 2024. in press. [Google Scholar]
  53. Liu, L.; Si, Y.W. 1D convolutional neural networks for chart pattern classification in financial time series. J. Supercomput. 2022, 78, 14191–14214. [Google Scholar] [CrossRef]
  54. Ahmed, A.A.; Ali, W.; Abdullah, T.A.A.; Malebary, S.J. Classifying Cardiac Arrhythmia from ECG Signal Using 1D CNN Deep Learning Model. Mathematics 2023, 11, 562. [Google Scholar] [CrossRef]
  55. Ahmed, M.R.; Islam, S.; Islam, A.M.; Shatabda, S. An ensemble 1D-CNN-LSTM-GRU model with data augmentation for speech emotion recognition. Expert Syst. Appl. 2023, 218, 119633. [Google Scholar] [CrossRef]
  56. Zhao, X.; Solé-Casals, J.; Li, B.; Huang, Z.; Wang, A.; Cao, J.; Zhao, Q. Classification of Epileptic IEEG Signals by CNN and Data Augmentation. In Proceedings of the ICASSP 2020—2020 IEEE International Conference on Acoustics, Speech and Signal Processing (ICASSP), Barcelona, Spain, 4–8 May 2020; pp. 926–930. [Google Scholar]
  57. Jia, H.; Huang, Z.; Caiafa, C.F.; Duan, F.; Zhang, Y.; Sun, Z.; Solé-Casals, J. Assessing the Potential of Data Augmentation in EEG Functional Connectivity for Early Detection of Alzheimer’s Disease. Cogn. Comput. 2024, 16, 229–242. [Google Scholar] [CrossRef]
  58. Coskun, M.; Yildirim, O.; Demir, Y.; Acharya, U.R. Efficient deep neural network model for classification of grasp types using sEMG signals. J. Ambient. Intell. Humaniz. Comput. 2022, 13, 4437–4450. [Google Scholar] [CrossRef]
  59. Baygin, M.; Barua, P.D.; Dogan, S.; Tuncer, T.; Key, S.; Acharya, U.R.; Cheong, K.H. A hand-modeled feature extraction-based learning network to detect grasps using sEMG signal. Sensors 2022, 22, 2007. [Google Scholar] [CrossRef]
  60. Bilotta, G.; Calcagno, S.; Bonfa, S. Wildfires: An application of remote sensing and OBIA. WSEAS Trans. Environ. Dev. 2021, 17, 282–296. [Google Scholar] [CrossRef]
  61. Chen, L.; Fu, J.; Wu, Y.; Li, H.; Zheng, B. Hand Gesture Recognition Using Compact CNN via Surface Electromyography Signals. Sensors 2020, 20, 672. [Google Scholar] [CrossRef]
  62. Bianco, M.G.; Quattrone, A.; Sarica, A.; Vescio, B.; Buonocore, J.; Vaccaro, M.G.; Aracri, F.; Calomino, C.; Gramigna, V.; Quattrone, A. Cortical atrophy distinguishes idiopathic normal-pressure hydrocephalus from progressive supranuclear palsy: A machine learning approach. Park. Relat. Disord. 2022, 103, 7–14. [Google Scholar] [CrossRef] [PubMed]
  63. Hu, F.; He, K.; Qian, M.; Gouda, M.A. TFN-FICFM: sEMG-Based Gesture Recognition Using Temporal Fusion Network and Fuzzy Integral-based Classifier Fusion. J. Bionic Eng. 2024, 21, 1878–1891. [Google Scholar] [CrossRef]
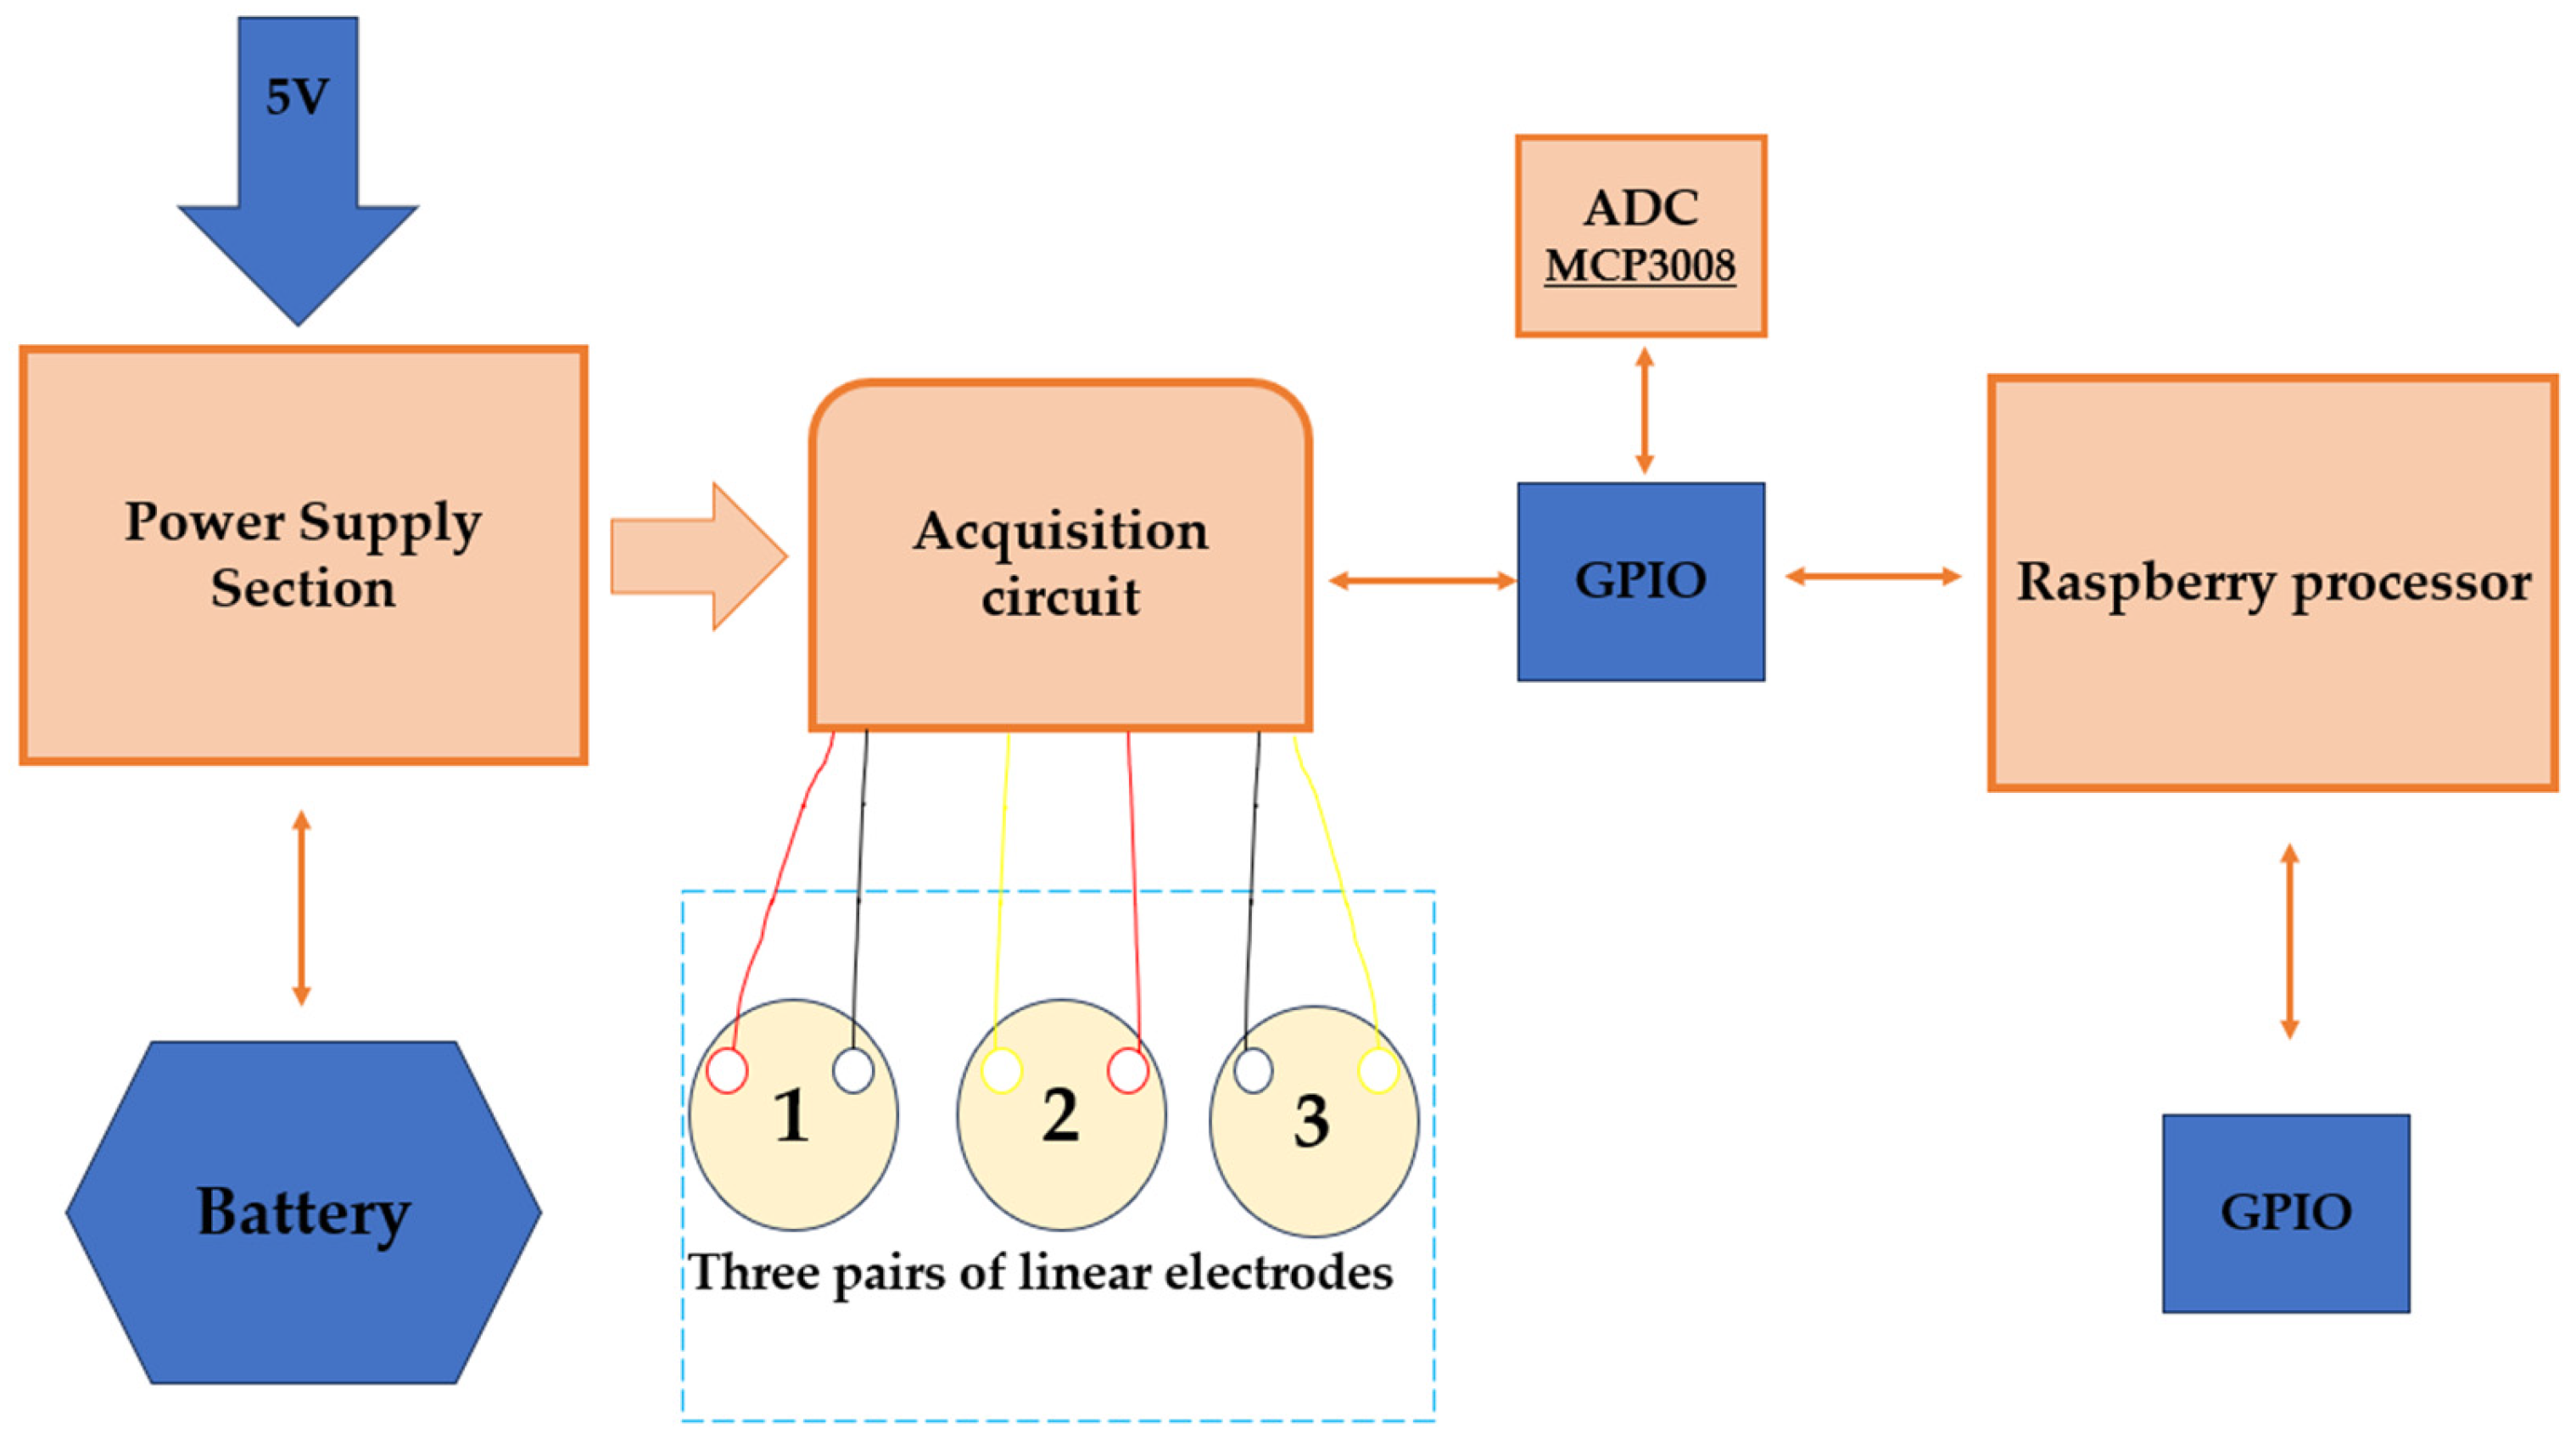
Figure 1. Integrated electronic system flow chart.
Signals 05 00025 g001
Figure 2. Schematic diagram of the acquisition circuit with front-end amplifier.
Signals 05 00025 g002
Figure 3. Detail of the acquisition circuit in the schematic composition: (a) amplification; (b) notch; (c) low-pass filter.
Signals 05 00025 g003
Figure 4. (a) Front panel of the Biopotential Signal Acquisition (EMG) circuit. (b) Internal view.
Signals 05 00025 g004
Figure 5. (a) sEMG acquisition system; (b) setting of electrodes on bicep muscle.
Signals 05 00025 g005
Figure 6. sEMG data on healthy subjects (V-s).
Signals 05 00025 g006
Figure 7. sEMG data on subjects with potential neuropathy (V-s).
Signals 05 00025 g007
Figure 8. SLM architecture: advanced 1D-CNN.
Signals 05 00025 g008
Table 1. Applications of sEMG signals in disease analysis.
ApplicationElectrodes Algorithm AccuracyAdvantages and Disadvantages
Detect neuromyopathy disorders9 mm silver/silver
chloride electrodes
DWT
WPT
SVM
8%
False detection rate
Advantages
Higher sensitivity and specificity
Relatively simple processing
Diagnoses diseasesSurface electrode array
Gel surface electrodes
Ag/AgCl bipolar electrode
LDA
Cubic SVM AR
DWT
ANN
PCA
SVM
83–100%Advantages
Low cost and less time-consuming
Disease prognosisSurface electrode arrayWilcoxon signed-rank tests
LR
ROC
RMS
RMSD
≈74.7% Disadvantages
Unsure ability in distinguishing disorders
Cross-talk overestimation of amplitude
Table 2. SLM architecture: layer descriptions.
Layer NumberLayer NameInput ShapeOutput ShapeKernel SizeStride
1Conv1D(batch_size, 20,000, 6)(batch_size, 19,996, 64)51
2BatchNormalization(batch_size, 19,996, 64)(batch_size, 19,996, 64)- 1-
3MaxPooling1D(batch_size, 19,996, 64)(batch_size, 9998, 64)22
4Dropout(batch_size, 9998, 64)(batch_size, 9998, 64)--
5Conv1D(batch_size, 9998, 64)(batch_size, 9994, 128)51
6BatchNormalization(batch_size, 9994, 128)(batch_size, 4997, 128)--
7MaxPooling1D(batch_size, 9994, 128(batch_size, 4997, 128)22
8Dropout(batch_size, 4997, 128)(batch_size, 4997, 128)--
9Conv1D(batch_size, 4997, 128)(batch_size, 4993, 256)51
10BatchNormalization(batch_size, 4993, 256)(batch_size, 2496, 256)--
11MaxPooling1D(batch_size, 4993, 256)(batch_size, 2496, 256)22
12Dropout(batch_size, 2496, 256)(batch_size, 2496, 256)--
13Conv1D(batch_size, 2496, 256)(batch_size, 2492, 512)51
14BatchNormalization(batch_size, 2492, 512)(batch_size, 2492, 512)--
15GlobalAveragePooling1D(batch_size, 2492, 512)(batch_size, 512)--
16Dropout(batch_size, 512)(batch_size, 512)--
17Dense(batch_size, 512)(batch_size, 256)--
18Dropout(batch_size, 256)(batch_size, 256)--
19Dense(batch_size, 256)(batch_size, 1)--
1 No value.
Table 3. Accuracy of the proposed SLM.
TrainingTest
Accuracy96.732%94.234%
Disclaimer/Publisher’s Note: The statements, opinions and data contained in all publications are solely those of the individual author(s) and contributor(s) and not of MDPI and/or the editor(s). MDPI and/or the editor(s) disclaim responsibility for any injury to people or property resulting from any ideas, methods, instructions or products referred to in the content.