Article

Neuromuscular Control in Incline and Decline Treadmill Running: Insights into Movement Synergies for Training and Rehabilitation

1
Department of Physical Therapy, School of Allied Health Sciences, University of Phayao, Phayao 56000, Thailand
2
Department of Sport Science, University of Innsbruck, A-6020 Innsbruck, Austria
Submission received: 10 December 2024 / Revised: 10 January 2025 / Accepted: 10 January 2025 / Published: 14 January 2025
(This article belongs to the Special Issue Advanced Methods of Biomedical Signal Processing II)

Abstract

:
Treadmill running simulates various conditions, including flat, uphill, and downhill gradients, making it useful for training and rehabilitation. This study aimed to examine how incline and decline treadmill running affect local dynamic stability of individual running movement components that cooperatively contribute to achieving the running tasks. Principal component analysis (PCA) was used to decompose movement components, termed principal movements (PMs), from kinematic marker data collected from 19 healthy recreational runners (9 females and 10 males, 23.6 ± 3.7 years) during treadmill running at 10 km/h across different gradients (−6, −3, 0, +3, +6 degrees). The largest Lyapunov exponent (LyE) of individual PM positions (higher LyE = greater instability) was analyzed using repeated-measures ANOVA to assess treadmill gradient effects across PMs. The results showed that the effects of treadmill gradient appear in PM3, which corresponds to the mid-stance phase of the gait cycle. Specifically, decline treadmill running significantly decreased local dynamic stability (greater LyE) compared to equivalent incline conditions (p ≤ 0.005). These findings suggest that decline treadmill running should be used cautiously in rehabilitation settings due to its potential to reduce an ability to control and respond to small perturbations, thereby increasing the risk of instability during the weight-bearing support phase of gait.

1. Introduction

Running is a fundamental human motor task that plays a vital role in various physical activities and sports, serving not only as a primary mode of locomotion but also as a key element in competitive athletics. The complexity of running movements involves the coordinated contribution of multiple body segments, including the arms, legs, hips, and core, to achieve effective and efficient movement [1,2]. Each stride requires synchronized muscle activation, joint movement, and balance, all of which must adapt to changing conditions such as terrain [3], speed [4], and incline [5]. Treadmill running, as a specific form of running, is an effective exercise and training modality, offering several advantages for fitness, performance enhancement, and rehabilitation. However, relatively few studies have investigated how these factors influence neuromuscular control during running, specifically focusing on the movement synergies involved. The central nervous system (CNS) coordinates complex muscle activations to maintain stability and optimize performance under varying conditions [6,7].
Regarding the effects of treadmill gradients, this type of running effectively simulates various conditions, including flat, inclined, and declined surfaces, making it ideal for targeted training and rehabilitation. Incline treadmill running has been shown to increase step frequency and internal mechanical work, demanding higher levels of muscular activation, especially in the hip and lower-limb muscles required to lift the body against gravity [8]. Additionally, incline running places significant demands on the glutes, hamstrings, and calves, necessitating enhanced joint stabilization, particularly at the hip. This increased workload translates into a higher metabolic cost, as the cardiovascular system must work harder to supply oxygen to the muscles [9]. Moreover, uphill running increases energy expenditure, further amplifying the body’s metabolic demands [6]. In contrast, declined treadmill running maintains similar contact times to level running but tends to decrease step frequency, potentially increasing forward momentum and elevating the risk of falls [8]. It induces greater peripheral fatigue in the knee extensors compared to incline or level running and is often perceived as less pleasant, more effortful, and more painful [5]. Additionally, declined running increases knee joint moment contributions, raising concerns about joint health and the potential for cartilage degeneration, particularly in individuals who have undergone anterior cruciate ligament (ACL) reconstruction [9]. This form of running also heightens tibial shock and impact forces, often linked to overuse injuries [6]. While both incline and decline treadmill gradients present altered biomechanical challenges critical for training and rehabilitation, their specific effects on motor behavior—particularly running movement components or synergies—remain less explored. This gap in the literature highlights the need for further investigation into how these gradients influence movement strategies.
The CNS employs near-optimal strategies to govern movements by utilizing task-relevant synergistic muscle activations [10]. This is particularly evident in running, where the complexity of movements necessitates the coordinated efforts of multiple body segments, including the arms, legs, hips, and core [1,2]. Observations of motor behaviors reveal various task-dependent movement synergies—patterns of muscle coordination that work together to achieve specific motor goals [7]. These synergies flexibly adapt to both internal conditions and external demands, such as changes in terrain [11]. Dimensionality reduction techniques, such as principal component analysis (PCA), have gained prominence in analyzing complex three-dimensional (3D) kinematic data. PCA reduces the number of variables while retaining essential information about the motor behavior of individual movement components, referred to as “principal movements” (PMk), where k denotes the order of the movement components [12,13]. In locomotion analysis, each principal movement (PM) can be visualized as a distinct movement synergy representing phases of a gait cycle, such as swing or stance, which work in tandem to accomplish the task [1,2,14]. This PCA-based approach also offers valuable insights into each PM’s position and acceleration, reflecting the neuromuscular control associated with different movement strategies, including the forces exerted by the system [11,12] and related myoelectric activities [7]. Previous research has demonstrated the utility of PCA in identifying principal movement patterns [1,15,16] and assessing the effects of perturbations on running stability [14]. In motor control, variability refers to variations in the amplitude of a time series, quantified using measures like standard deviation [15]. Understanding the impact of treadmill gradients on neuromuscular control at the level of individual running movement components could inform the development of training programs and rehabilitation protocols tailored to specific goals.
Temporal variations in gait are analyzed using non-linear methods, such as the largest Lyapunov exponent (LyE), which measures how quickly trajectories diverge [17,18,19,20]. LyE reflects the “predictability” of a time series and is commonly interpreted as a measure of dynamic or local stability, indicating the stability of the system across step cycles [17,18,19,20]. LyE has been used to evaluate the ability to compensate for small internal or external perturbations and maintain functional locomotion [17,18,19,20]. In this context, stability refers to a system’s (e.g., the movement system) capacity to preserve its original state when confronted with internal (e.g., neuromuscular) or external (e.g., environmental) disturbances [19]. Stability parameters provide insight into the variability in motor task performance and quantify the system’s ability to correct dynamic errors [21]. LyE, when applied to the positions of individual principal movements (PMs), reflects the neuromuscular system’s ability to control and adapt to minor disruptions in movement patterns [1,14]. In running, local dynamic stability indicates the neuromuscular system’s capability to handle these small perturbations [17,18,19,20]. Reduced stability has been linked to an increased risk of overuse injuries, such as bone stress injuries, which occur when repetitive loads exceed the bone’s capacity for recovery [22,23]. The current study builds on these methodologies to investigate gradient-specific neuromuscular adaptations during running.
In summary, this study aimed to explore how variations in treadmill gradient—both incline and decline—affect the local dynamic stability of individual running movement components/synergies, reflecting neuromuscular control during locomotion. It was hypothesized that changes in gradients would modulate the neuromuscular control of running movement components, as incline and decline treadmill gradients introduce altered biomechanical aspects to running [6]. It was also expected that the gradient effects on running stability would particularly influence the weight-bearing support phase, which is crucial for balance and stability [14]. The findings provide valuable insights into how treadmill gradients affect movement stability, with implications for optimizing training and rehabilitation, especially for patients recovering from lower-limb injuries.

2. Materials and Methods

2.1. Participants and Experimental Procedure

The kinematic marker data of 19 healthy recreational runners (9 females and 10 males) during treadmill running at different gradients were retrieved from the C3D files of a peer-reviewed open access dataset [24]. The study was approved by the local ethics committee (nr. 2019-1138) and was conducted in accordance with the Declaration of Helsinki [24]. All participants provided informed consent prior to the measurements.
The experimental procedure was fully described by Van Hooren et al. [24,25]. In brief, all participants completed a single test session and were instructed to avoid strenuous activity for 36 h, alcohol for 24 h, caffeine for 6 h, and a heavy meal 1 h before the session. Prior to data collection, participants were instructed to run for 8 min at a fixed-paced speed of 2.78 m/s to familiarize themselves with treadmill running. Each participant randomly performed a single session of treadmill running on a CAREN system (Motek, The Netherlands) at various gradients (−6, −3, 0, +3, +6 degrees), wearing their own shoes. Rest periods were allowed between trials. For each running condition, the treadmill speed gradually increased from zero to a constant speed of 2.78 m/s (approximately equivalent to 10.008 km/h) within 30 s, remained constant for 30 s, and then gradually decreased to a stop. However, there was no explicit justification provided for the choice of these particular speeds [24]. Twenty-six retroreflective markers were attached to anatomical landmarks on the trunk (C7, T10, xiphoid process, sternum), pelvis (ASIS and PSIS), and lower extremities (thigh, knee, lateral malleolus, heel, 2nd and 5th metatarsal bones). Running movements were recorded using a 12-camera three-dimensional motion capture system (Vicon Nexus v2.1, Oxford Metrics Group, Oxford, UK) with a sampling frequency of 100 Hz. Participant characteristics are detailed in Table 1.

2.2. Signal Processing and Movement Component Analysis

All data processing was conducted in MATLAB version 2024a (MathWorks Inc., Natick, MA, USA). The 30 s constant running of each trial of each participant was selected for analysis. An example of original running movement is represented in Supplementary Video S1. Twenty-six markers from each dataset, contributing 78 spatial coordinates (x, y, z), were interpreted as 78-dimensional posture vectors. Each dataset was preprocessed by subtracting the mean posture vector and then normalized to the mean Euclidean distance [13]. The data from all volunteers were concatenated to form an input matrix (100 [sampling rate] × 5 [number of trials] × 30 [trial duration] × 19 [number of participants] × 78 [marker coordinates]) for further PCA.
PCA was calculated using a singular-value decomposition of the covariance matrix through the PManalyzer software [13] to decompose all kinematic marker data retrieved from five running conditions of all participants into a set of orthogonal eigenvectors, i.e., principal components (PCs), where k denotes the order of movement components. Animated stick figures can be created to characterize each eigenvector’s movement pattern, which has been called “principal movement” (PMk), visually representing movement synergies that contributed to achieve the running task [13,26]. Moreover, the actual time evolution (t, time series) of individual PMk is quantified by the PC scores called principal positions (PPk(t)), representing positions in posture space, i.e., the vector space spanned by the PC eigenvectors [13]. Additionally, the acceleration of each PM called principal acceleration (PAk(t)) can also be determined through the second-time differentiations, reflecting the neuromuscular control of each PM, as it is associated with myoelectric activity [7]. The term ‘‘principal” in the variable names denotes that these variables were obtained through a PCA, and (t) indicates that these variables are functions of time t [13].
In this study, the PM time series were filtered with a third-order zero-phase 6 Hz low-pass Butterworth filter to avoid noise amplification in the differentiation processes. The leave-one-out cross-validation was then used to evaluate the vulnerability of the PMk and the dependent variables to changes in the input data matrix to address validity considerations [13]. The first five PCs, which proved robust and explained 97.7% of the total variance, were selected to test the hypotheses. Each participant-specific relative explained variance (rVAR) of PPk (PPk_rVAR) and PAk (PAk_rVAR) calculated from the PPk( t ) and PAk( t ) represent the coordinative structure or composition of running movements and running acceleration, respectively [14]. The PPk_rVAR and PAk_rVAR quantify how much (in percent) each PM contributed to the total variance in postural positions and postural accelerations, respectively [14]. It has been suggested in the literature that movement components with limited positional amplitudes, when performed rapidly, significantly affect accelerations and, in turn, the forces acting in the system [27].

2.3. Computing PCA-Based Variables

The local dynamic stability of individual PMs for each participant was computed using the largest Lyapunov exponent (LyE) of PPk(t), denoted as PPk_LyE, which has been applied in previous studies [1,14,27,28,29,30]. LyE is a non-linear analysis method that quantifies the rate of divergence of nearby trajectories in state space, representing the motor system’s ability to attenuate small perturbations [31]. Specifically, a greater LyE value indicates reduced motor system efficiency in controlling perturbations, resulting in higher divergence of state space trajectories and thus lower running stability [32,33]. LyE was calculated using Wolf’s algorithm [34], where the time delay (τ = 10) and embedding dimension ( m = 4) were determined through average mutual information (AMI) [1,29] and the false nearest neighbor method [35], respectively. Embedding dimension and time delay were chosen based on previous studies [32] to optimize the sensitivity of LyE in detecting subtle stability changes during running. A greater LyE value reflects the inability of the motor system to diminish the perturbations, resulting in a higher divergence of the state space trajectories that reflects the lower running stability of the individual [14,18].
Additionally, the root mean square (RMS) of PAk(t), denoted as PAk_RMS, was computed for each participant’s individual principal movements (PMs) [14,36] as a measure of the magnitude or intensity of the acceleration signals [37]. This additional measure aids in better understanding neuromuscular control, as higher principal postural acceleration is correlated with increased myoelectric activity [7].

2.4. Statistical Analysis

With the alpha level set at α = 0.05, all statistical analyses were conducted using IBM SPSS Statistics software version 26.0 (SPSS Inc., Chicago, IL, USA). The Shapiro–Wilk test was used to assess the normality of the data distribution. For each PCA-based variable (PPk_LyE and PAk_RMS), repeated-measures ANOVA was performed to evaluate the main effects of treadmill gradient (−6, −3, 0, +3, +6 degrees). The effect size (partial eta squared, ηp2) and observed power (1−β) were reported. Post hoc tests for pairwise comparisons across the five treadmill gradients were conducted, with the alpha level adjusted to α = 0.01. Cohen’s d for each pairwise comparison was calculated to provide more context about the magnitude of differences.

3. Results

3.1. Movement Components of Treadmill Running

Visualizations of the first five PMs (PM1–5) and their compositions of principal position (PPk_rVAR) and acceleration (PAk_rVAR) are depicted in Figure 1 and movement characteristics are described in Table 2. The first principal movement (PM1), which resembles the swing-phase movement coupled with trunk rotation, shows the highest contribution to the total variance in postural positions and in postural accelerations. Animated stick figures of PM2–5 corresponding to phases of the gait cycle are represented in Supplementary Video S2.
As shown in Figure 1 and described in Table 2, the analysis of movement characteristics revealed distinct patterns in the variance of principal movements (PMk) during running. PM1, which involves the swing-phase movement coupled with trunk rotation, exhibited the highest variance in both PP1_rVAR (72.5 ± 7.3%) and PA1_rVAR (49.0 ± 4.2%), indicating that this phase significantly contributes to both postural positions and accelerations. The swing phase plays a critical role in balancing the body’s momentum, contributing to high forces acting on the system. In contrast, PM2, during double-leg support with anteroposterior sliding, showed lower variance, with PP2_rVAR at 12.8 ± 6.6% and PA2_rVAR at 2.8 ± 0.8%, suggesting that this phase contributes less to both postural positions and accelerations. PM3, the single-leg support phase coupled with trunk rotation, showed values of 7.3 ± 3.2% for PP3_rVAR and 5.3 ± 2.1% for PA3_rVAR, suggesting lower forces and greater stability compared to the swing phase. PM4, which involves double-leg support coupled with hip and knee flexion/extension, showed higher variance in PA4_rVAR (27.0 ± 2.4%) compared to PP4_rVAR (2.9 ± 0.5%), indicating that joint movements during this phase contribute more to accelerations. Finally, PM5, corresponding to single-leg support with mediolateral sliding, exhibited the least variance, with PP5_rVAR at 2.2 ± 1.8% and PA5_rVAR at 0.2 ± 0.1%, suggesting that this phase has minimal impact on postural positions and accelerations. These results highlight that different components of the running gait cycle contribute to the complete execution of treadmill running.

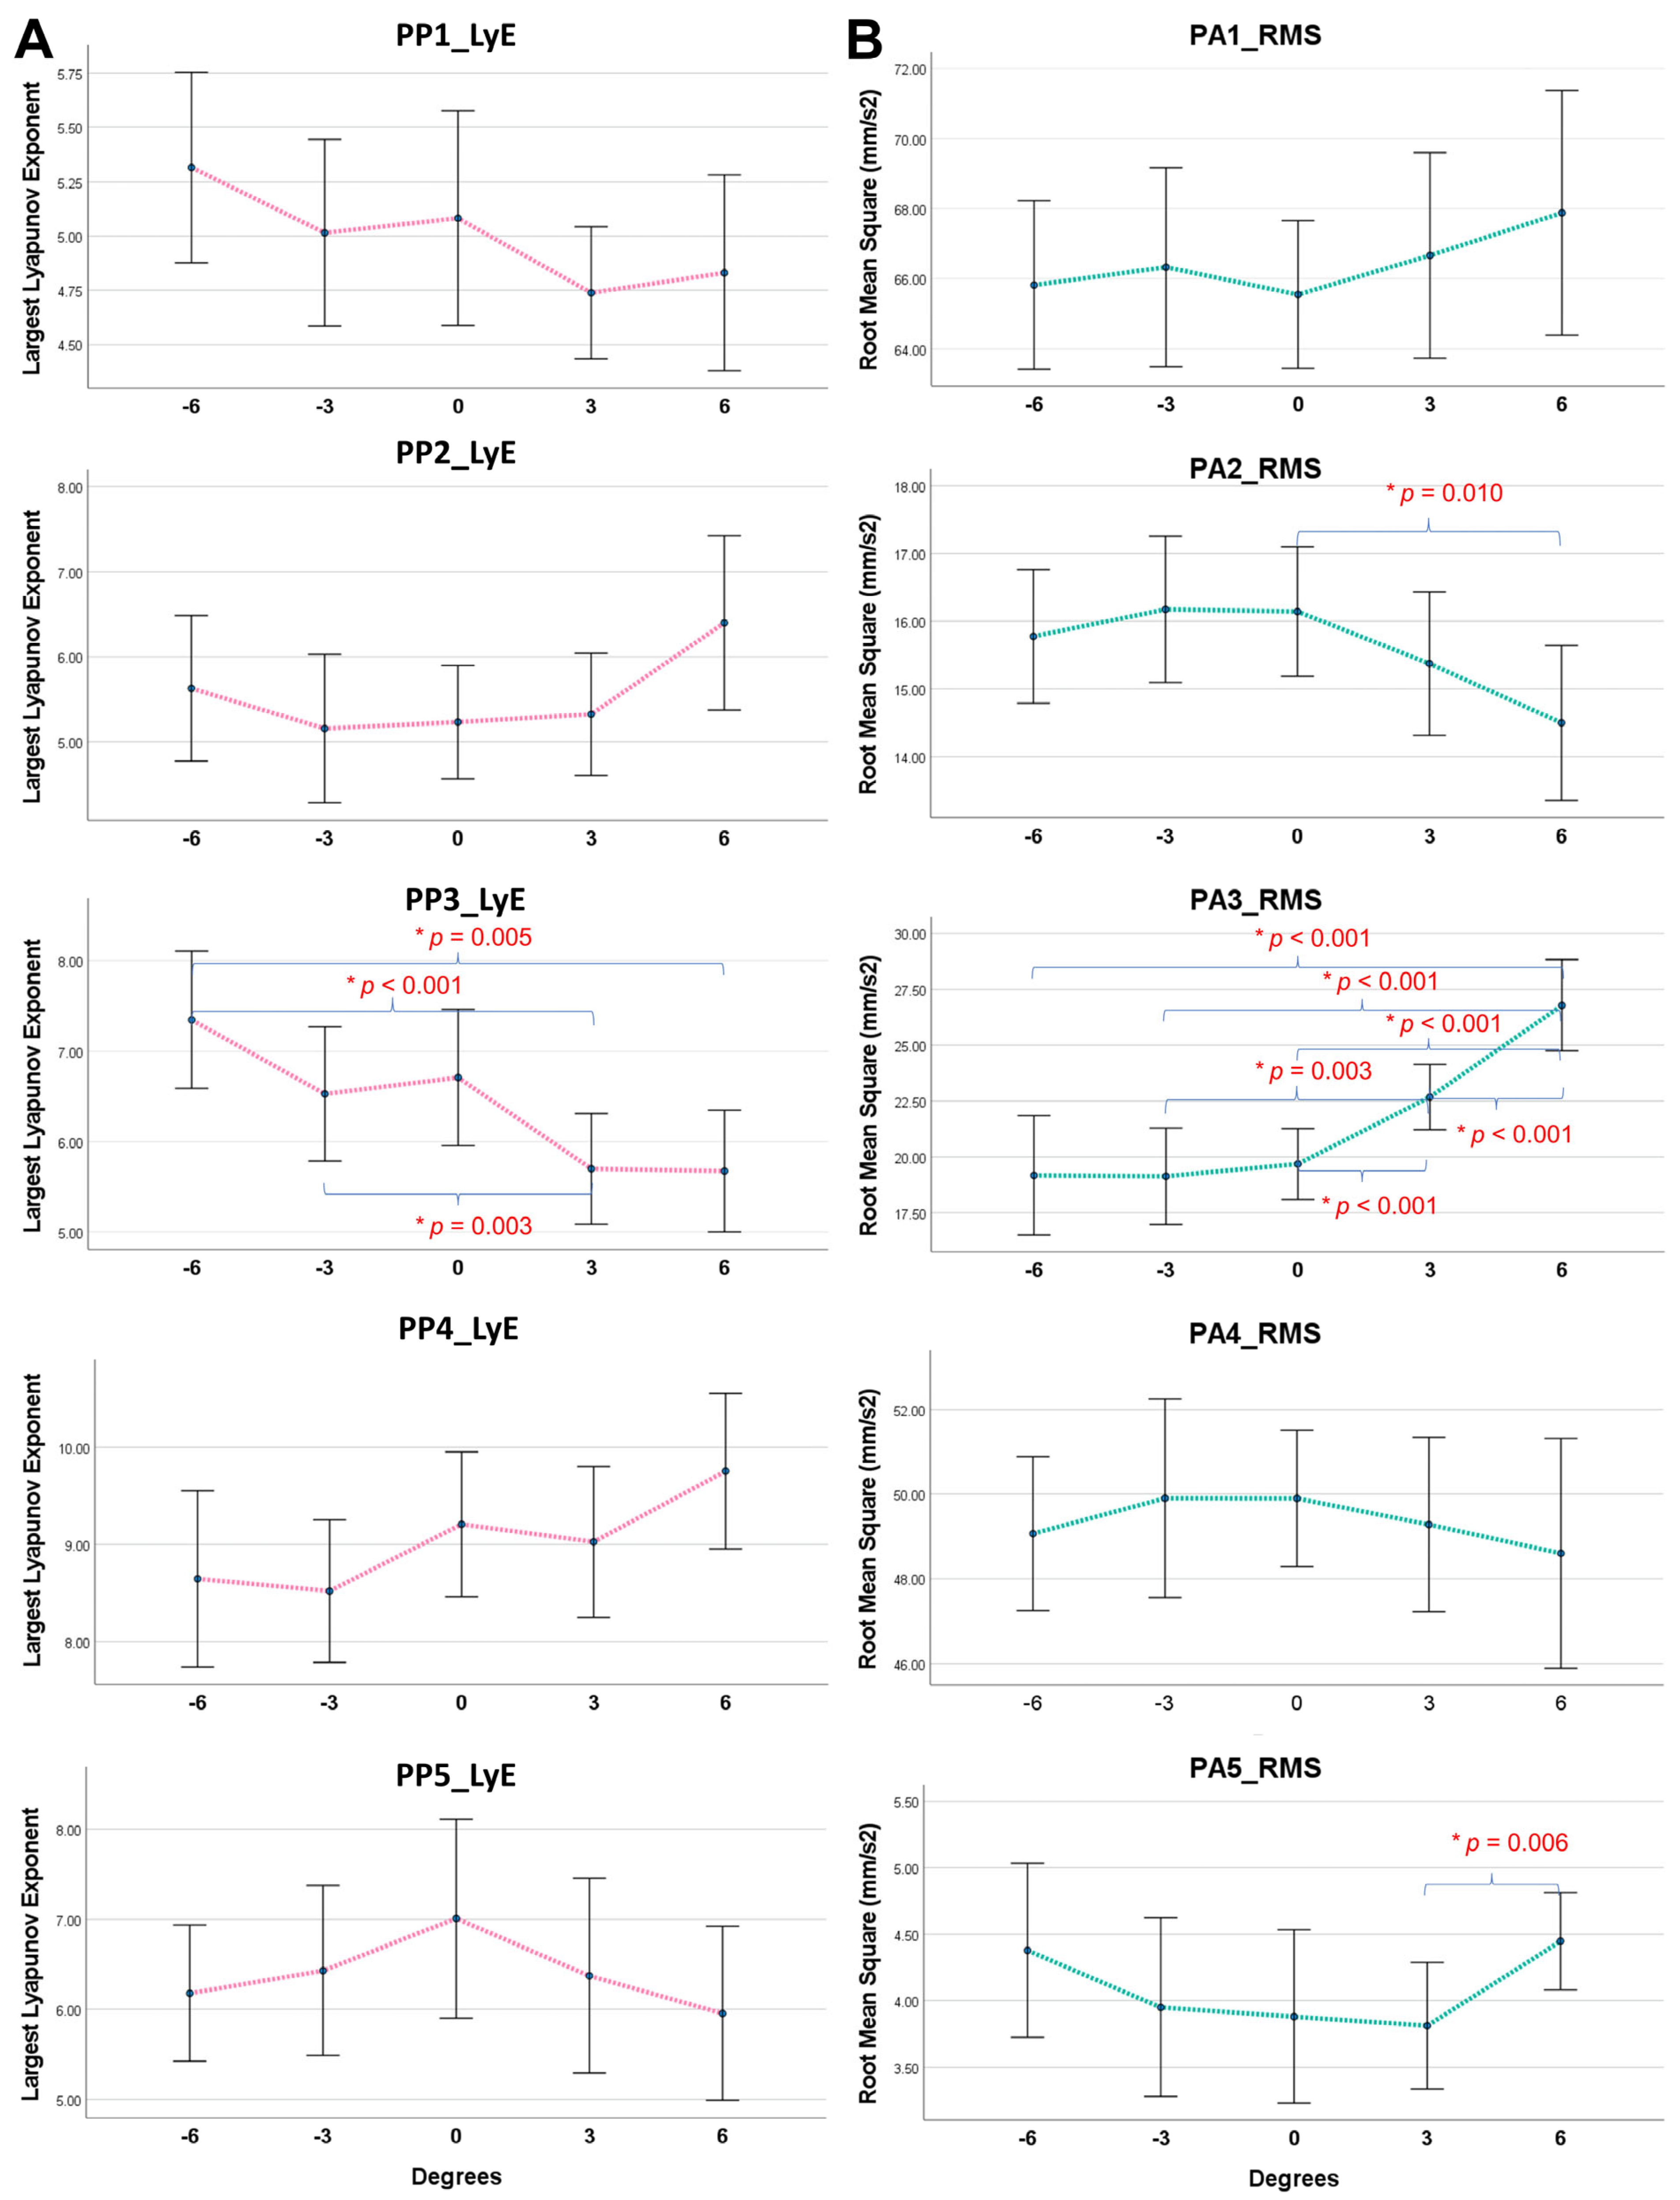
3.2. Treadmill Gradient Effects on Local Dynamic Stability and Acceleration Magnitude

The results indicate that the main effects of treadmill gradients on running stability, as assessed by the LyE of individual PMs (PPk_LyE), are predominantly observed in PM3, corresponding to the mid-stance phase of the gait cycle (PP3_LyE: F(4,72) = 10.877, p < 0.001, ηp2 = 0.377, 1 − β = 1). Post hoc tests (Figure 2A) reveal that decline treadmill running results in higher instability compared to incline treadmill running. Specifically, running with a 6-degree decline exhibited a higher LyE value, indicating lower stability than running with both a 3-degree incline (p < 0.001, Cohen’s d = 1.162) and a 6-degree incline (p = 0.005, Cohen’s d = 1.176). Furthermore, running with a 3-degree decline also showed greater instability than running with a 3-degree incline (p = 0.003, Cohen’s d = 0.588). Post hoc tests revealed large effect sizes (Cohen’s d), indicating substantial differences in running stability (LyE) between conditions. Specifically, decline treadmill running, particularly at 6°, exhibited large effect sizes when compared to the incline conditions, suggesting a marked decrease in stability during decline running.
In terms of the acceleration magnitude of individual PMs (PAk_RMS), significant effects of treadmill gradients were noted in PM2 (PA2_RMS: F(4,72) = 6.378, p < 0.001, ηp2 = 0.262, 1 − β = 0.986), PM3 (PA3_RMS: F(4,72) = 31.170, p < 0.001, ηp2 = 0.634, 1 − β = 1), and PM5 (PA5_RMS: F(4,72) = 2.933, p = 0.026, ηp2 = 0.140, 1 − β = 0.762). Post hoc analyses (Figure 2B) for PM2 indicate that running on a flat treadmill (0 degrees) resulted in a greater RMS value compared to running with a 6-degree incline (p = 0.01, Cohen’s d = 0.754). For PM3, running with a 6-degree incline exhibited a higher RMS value than running with a 3-degree incline (p < 0.001, Cohen’s d = 1.115), a 0-degree incline (p < 0.001, Cohen’s d = 1.630), a 3-degree decline (p < 0.001, Cohen’s d = 1.756), and a 6-degree decline (p < 0.001, Cohen’s d = 1.542). Additionally, running with a 3-degree decline showed a lower RMS value compared to running with a 3-degree incline (p = 0.003, Cohen’s d = 0.925), while running at 0 degrees had a lower RMS value than running with a 3-degree incline (p < 0.001, Cohen’s d = 0.945). Lastly, for PM5, running with a 3-degree incline had a lower RMS value than running with a 6-degree incline (p = 0.006, Cohen’s d = 0.725). Post hoc tests revealed moderate to large effect sizes (Cohen’s d), indicating substantial differences in acceleration magnitude between conditions.

4. Discussion

The current study investigated the impacts of treadmill gradients on running stability (LyE) and the acceleration magnitude (RMS) of individual phases of motion (PMs). As expected, the results indicate that these effects emerge in specific phases of the gait cycle. Running on a decline treadmill significantly decreases local dynamic stability (indicated by greater LyE) compared to running on an incline, with the effect particularly pronounced in the mid-stance phase of the gait cycle (PM3). Additionally, the effects of treadmill gradients were also tested on the acceleration magnitude (RMS) of individual phases of motion (PMs), showing that incline running produces higher acceleration magnitudes (RMS) than decline running, particularly in the mid-stance phase (PM3).
Regarding running stability, running on a 3-degree and 6-degree decline resulted in higher LyE values, indicating greater instability compared to equivalent incline conditions, particularly in the mid-stance phase (PM3) of the gait cycle. These findings might be attributed to several key biomechanical and neuromuscular factors. First, the increased forward momentum generated during downhill running propels the runner forward with possibly less control, unlike uphill running, where gravity slows the runner’s pace and offers more stability [6,8]. Unlike outdoor terrain running, which presents irregular perturbations, treadmill gradients provide a controlled perturbation environment. The findings align with Bontemps et al. study [38], where decline running exhibited heightened instability due to increased eccentric loading. Second, declined gradient treadmill running has been reported to lead to reduced foot–ground contact time, making it harder to maintain balance and stability as the body spends more time in the air and less time in controlled contact with the ground [8]. Third, decline running also places a significant demand on eccentric muscle contractions, especially in the quadriceps, to absorb shock and control descent that might lead to muscle fatigue, impaired motor control, and reduced stability [5]. The rear-foot strike pattern typical in decline running results in higher joint impact forces, particularly on the knees, disrupting movement control and further increasing instability [6,9].
Moreover, progressive incline running produces higher acceleration magnitudes (RMS) than decline running, particularly during the mid-stance phase (PM3). This difference can be attributed to several biomechanical factors. Running uphill significantly increases the workload on key muscle groups, including the glutes, hamstrings, and calves, which require greater joint stabilization, especially at the hips [8]. This heightened effort translates into increased metabolic costs as the cardiovascular system works harder to deliver oxygen to these active muscles [6,8]. Biomechanically, incline running tends to increase step frequency while shortening the swing phase, promoting greater strength and endurance, which aids in injury prevention [8]. The reduced foot–ground contact time associated with increased forward momentum makes it more challenging to maintain stability, potentially raising the risk of falls and overuse injuries [8]. Although decline running provides specific training benefits, such as enhancing downhill endurance and strengthening muscles engaged in braking, it also imposes unique challenges, including greater joint impact forces due to a rear-foot strike pattern [6,8].
From a practical perspective, the current findings suggest that decline treadmill running, while beneficial for certain training purposes, should be approached cautiously due to its destabilizing effects. Running is often likened to bouncing; when the foot strikes the ground, kinetic and gravitational potential energy are stored as elastic strain energy in muscles, tendons, and ligaments, which is subsequently recovered during the propulsive phase of the stance [39]. The mid-stance phase (PM3) plays a crucial role in maintaining stability and forward momentum, demanding a higher metabolic cost compared to the swing and double-support phases [40]. This is partly due to a lateral weight shift that can increase instability in the mediolateral direction [41,42]. The greater instability during decline treadmill running in this phase may be linked to challenges in controlling weight bearing, which relies heavily on lower-limb muscle strength. Therefore, training should focus on strengthening key muscles involved in mid-stance, including the hip extensors [43], knee flexors [44], and frontal-plane muscles such as the hip abductors [45], which are essential for mediolateral stability. Strengthening these key muscle groups can help mitigate instability and improve mediolateral stability, which is vital for maintaining balance during decline running. The heightened instability observed during decline running suggests that such protocols should be prescribed cautiously, especially for older adults or individuals recovering from lower-limb injuries. Tailored interventions may mitigate the risks while retaining the benefits of gradient training. Understanding the mechanics of this phase is vital for enhancing performance and reducing injury risk in runners.

Limitations and Future Research

One notable limitation of the current study is that no markers were placed on the head or upper limbs during data collection. The upper body, particularly the head and arms, plays a critical role in balance and momentum control during running. By excluding these areas, the analysis was limited to the lower extremities and trunk, potentially missing a full picture of the interconnected biomechanics involved in locomotion tasks [1,14]. In addition, the lack of markers on the head and upper limbs may lead to underestimation of the contributions of upper body dynamics to overall stability. Future studies should incorporate a full-body marker set for a more comprehensive analysis.
Another limitation is the relatively short running duration, which may not fully reflect real-world running scenarios and may not fully capture long-term neuromuscular adaptations. Future studies should explore longer interventions and larger, more diverse samples. Additionally, as the current study is a secondary data analysis, it is constrained by the original dataset’s participant selection criteria and the information available. This limits the ability to examine additional factors, such as detailed training history, running habits, or injury history. Future research could benefit from a more diverse sample, including participants with varying levels of running experience, from novice runners to more advanced athletes, to explore how gradient changes affect different populations.

5. Conclusions

The present study demonstrates that treadmill gradients significantly affect running stability, particularly in specific principal movements (PMs) during the gait cycle. Running on a decline, especially at 3-degree and 6-degree angles, decreases stability, as reflected by higher Lyapunov exponent (LyE) values during the mid-stance phase (PM3) compared to equivalent incline conditions. This reduced stability requires greater neuromuscular control, which may increase the risk of instability and injuries. These findings suggest that decline treadmill running should be used cautiously in rehabilitation settings due to its potential to compromise local dynamic stability, particularly during the single-leg support phase of gait.

Supplementary Materials

The following supporting information can be downloaded at https://www.mdpi.com/article/10.3390/signals6010002/s1, Video S1: Example of original running movement; Video S2: Visualizations of the principal movements (PM2–5) corresponding to the phases of the gait cycle.

Funding

This study was funded by University of Phayao and Thailand Science Research and Innovation Fund (Fundamental Fund 2025, Grant No. 5030/2567).

Institutional Review Board Statement

The study was conducted in accordance with the Decla-ration of Helsinki and approved by the local ethics committee (nr. 2019-1138) [24]. Informed consent was obtained from all participants involved in the study.

Informed Consent Statement

Written informed consent has been obtained from all participants to publish this paper as reported in [24].

Data Availability Statement

The data analyzed in this study are available at https://osf.io/7qbxc/ (accessed on: 26 May 2024) by Van Hooren et al. [24].

Conflicts of Interest

The author declares no conflicts of interest.

References

  1. Federolf, P.; Tecante, K.; Nigg, B. A Holistic Approach to Study the Temporal Variability in Gait. J. Biomech. 2012, 45, 1127–1132. [Google Scholar] [CrossRef] [PubMed]
  2. Maurer, C.; Federolf, P.; von Tscharner, V.; Stirling, L.; Nigg, B.M. Discrimination of Gender-, Speed-, and Shoe-Dependent Movement Patterns in Runners Using Full-Body Kinematics. Gait Posture 2012, 36, 40–45. [Google Scholar] [CrossRef] [PubMed]
  3. Voloshina, A.S.; Ferris, D.P. Biomechanics and Energetics of Running on Uneven Terrain. J. Exp. Biol. 2015, 218, 711–719. [Google Scholar] [CrossRef] [PubMed]
  4. Self, Z.T.; Spence, A.J.; Wilson, A.M. Speed and Incline during Thoroughbred Horse Racing: Racehorse Speed Supports a Metabolic Power Constraint to Incline Running but Not to Decline Running. J. Appl. Physiol. 2012, 113, 602–607. [Google Scholar] [CrossRef]
  5. Garnier, Y.M.; Lepers, R.; Dubau, Q.; Pageaux, B.; Paizis, C. Neuromuscular and Perceptual Responses to Moderate-Intensity Incline, Level and Decline Treadmill Exercise. Eur. J. Appl. Physiol. 2018, 118, 2039–2053. [Google Scholar] [CrossRef]
  6. Vernillo, G.; Giandolini, M.; Edwards, W.B.; Morin, J.-B.; Samozino, P.; Horvais, N.; Millet, G.Y. Biomechanics and Physiology of Uphill and Downhill Running. Sports Med. 2017, 47, 615–629. [Google Scholar] [CrossRef]
  7. Promsri, A.; Mohr, M.; Federolf, P. Principal Postural Acceleration and Myoelectric Activity: Interrelationship and Relevance for Characterizing Neuromuscular Function in Postural Control. Hum. Mov. Sci. 2021, 77, 102792. [Google Scholar] [CrossRef]
  8. Ferley, D.D.; Osborn, R.W.; Vukovich, M.D. The Effects of Incline and Level-Grade High-Intensity Interval Treadmill Training on Running Economy and Muscle Power in Well-Trained Distance Runners. J. Strength Cond. Res. 2014, 28, 1298–1309. [Google Scholar] [CrossRef]
  9. Harrison, K.; Holmes, H.H.; Finley, E.B.; Guzman, K.S.; Kimbrough, K.C.; Roper, J.A. Incline and Decline Running Alters Joint Moment Contributions but Not Peak Support Moments in Individuals with an Anterior Cruciate Ligament Reconstruction and Controls. Front. Sports Act. Living 2023, 5, 1217783. [Google Scholar] [CrossRef]
  10. Bizzi, E.; Cheung, V.C.K. The Neural Origin of Muscle Synergies. Front. Comput. Neurosci. 2013, 7, 51. [Google Scholar] [CrossRef]
  11. Promsri, A.; Haid, T.; Federolf, P. Complexity, Composition, and Control of Bipedal Balancing Movements as the Postural Control System Adapts to Unstable Support Surfaces or Altered Feet Positions. Neuroscience 2020, 430, 113–124. [Google Scholar] [CrossRef] [PubMed]
  12. Federolf, P.A. A Novel Approach to Study Human Posture Control: “Principal Movements” Obtained from a Principal Component Analysis of Kinematic Marker Data. J. Biomech. 2016, 49, 364–370. [Google Scholar] [CrossRef] [PubMed]
  13. Haid, T.H.; Zago, M.; Promsri, A.; Doix, A.-C.M.; Federolf, P.A. PManalyzer: A Software Facilitating the Study of Sensorimotor Control of Whole-Body Movements. Front. Neuroinform. 2019, 13, 24. [Google Scholar] [CrossRef] [PubMed]
  14. Promsri, A. Sex Difference in Running Stability Analyzed Based on a Whole-Body Movement: A Pilot Study. Sports 2022, 10, 138. [Google Scholar] [CrossRef] [PubMed]
  15. Federolf, P.A.; Boyer, K.A.; Andriacchi, T.P. Application of Principal Component Analysis in Clinical Gait Research: Identification of Systematic Differences Between Healthy and Medial Knee-Osteoarthritic Gait. J. Biomech. 2013, 46, 2173–2178. [Google Scholar] [CrossRef]
  16. Hoerzer, S.; Federolf, P.A.; Maurer, C.; Baltich, J.; Nigg, B.M. Footwear Decreases Gait Asymmetry during Running. PLoS ONE 2015, 10, e0138631. [Google Scholar] [CrossRef]
  17. Dingwell, J.B.; Cusumano, J.P.; Cavanagh, P.R.; Sternad, D. Local Dynamic Stability Versus Kinematic Variability of Continuous Overground and Treadmill Walking. J. Biomech. Eng. 2001, 123, 27–32. [Google Scholar] [CrossRef]
  18. Dingwell, J.B.; Marin, L.C. Kinematic Variability and Local Dynamic Stability of Upper Body Motions When Walking at Different Speeds. J. Biomech. 2006, 39, 444–452. [Google Scholar] [CrossRef]
  19. Bruijn, S.M.; Meijer, O.G.; Beek, P.J.; Van Dieen, J.H. Assessing the Stability of Human Locomotion: A Review of Current Measures. J. R. Soc. Interface 2013, 10, 20120999. [Google Scholar] [CrossRef]
  20. England, S.A.; Granata, K.P. The Influence of Gait Speed on Local Dynamic Stability of Walking. Gait Posture 2007, 25, 172–178. [Google Scholar] [CrossRef]
  21. Hamacher, D.; Singh, N.B.; Van Dieën, J.H.; Heller, M.O.; Taylor, W.R. Kinematic Measures for Assessing Gait Stability in Elderly Individuals: A Systematic Review. J. R. Soc. Interface 2011, 8, 1682–1698. [Google Scholar] [CrossRef] [PubMed]
  22. Matcuk, G.R.; Mahanty, S.R.; Skalski, M.R.; Patel, D.B.; White, E.A.; Gottsegen, C.J. Stress Fractures: Pathophysiology, Clinical Presentation, Imaging Features, and Treatment Options. Emerg. Radiol. 2016, 23, 365–375. [Google Scholar] [CrossRef] [PubMed]
  23. Hoenig, T.; Tenforde, A.S.; Strahl, A.; Rolvien, T.; Hollander, K. Does Magnetic Resonance Imaging Grading Correlate with Return to Sports After Bone Stress Injuries? A Systematic Review and Meta-Analysis. Am. J. Sports Med. 2022, 50, 834–844. [Google Scholar] [CrossRef] [PubMed]
  24. Van Hooren, B.; Meijer, K. Dataset of Running Kinematics, Kinetics and Muscle Activation at Different Speeds, Surface Gradients, Cadences and with Forward Trunk Lean. Data Brief 2024, 54, 110312. [Google Scholar] [CrossRef]
  25. Van Hooren, B.; van Rengs, L.; Meijer, K. Per-Step and Cumulative Load at Three Common Running Injury Locations: The Effect of Speed, Surface Gradient, and Cadence. Scand. J. Med. Sci. Sports 2024, 34, e14570. [Google Scholar] [CrossRef]
  26. Federolf, P. A Novel Approach to Solve the “Missing Marker Problem” in Marker-Based Motion Analysis That Exploits the Segment Coordination Patterns in Multi-Limb Motion Data. PLoS ONE 2013, 8, e78689. [Google Scholar] [CrossRef]
  27. Longo, A.; Haid, T.; Meulenbroek, R.; Federolf, P. Biomechanics in Posture Space: Properties and Relevance of Principal Accelerations for Characterizing Movement Control. J. Biomech. 2019, 82, 397–403. [Google Scholar] [CrossRef]
  28. Longo, A.; Meulenbroek, R.; Haid, T.; Federolf, P. Postural Reconfiguration and Cycle-to-Cycle Variability in Patients with Work-Related Musculoskeletal Disorders Compared to Healthy Controls and in Relation to Pain Emerging during a Repetitive Movement Task. Clin. Biomech. 2018, 54, 103–110. [Google Scholar] [CrossRef]
  29. Longo, A.; Federolf, P.; Haid, T.; Meulenbroek, R. Effects of a Cognitive Dual Task on Variability and Local Dynamic Stability in Sustained Repetitive Arm Movements Using Principal Component Analysis: A Pilot Study. Exp. Brain Res. 2018, 236, 1611–1619. [Google Scholar] [CrossRef]
  30. Promsri, A. Assessing Walking Stability Based on Whole-Body Movement Derived from a Depth-Sensing Camera. Sensors 2022, 22, 7542. [Google Scholar] [CrossRef]
  31. Mehdizadeh, S. The Largest Lyapunov Exponent of Gait in Young and Elderly Individuals: A Systematic Review. Gait Posture 2018, 60, 241–250. [Google Scholar] [CrossRef]
  32. Dingwell, J.B.; Cusumano, J.P. Nonlinear Time Series Analysis of Normal and Pathological Human Walking. Chaos Interdiscip. J. Nonlinear Sci. 2000, 10, 848–863. [Google Scholar] [CrossRef]
  33. Kang, H.G.; Dingwell, J.B. Effects of Walking Speed, Strength and Range of Motion on Gait Stability in Healthy Older Adults. J. Biomech. 2008, 41, 2899–2905. [Google Scholar] [CrossRef] [PubMed]
  34. Wolf, A.; Swift, J.B.; Swinney, H.L.; Vastano, J.A. Determining Lyapunov Exponents from a Time Series. Phys. D 1985, 16, 285–317. [Google Scholar] [CrossRef]
  35. Kantz, H. A Robust Method to Estimate the Maximal Lyapunov Exponent of a Time Series. Phys. Lett. A 1994, 185, 77–87. [Google Scholar] [CrossRef]
  36. Ó’Reilly, D.; Federolf, P. Identifying Differences in Gait Adaptability across Various Speeds Using Movement Synergy Analysis. PLoS ONE 2021, 16, e0244582. [Google Scholar] [CrossRef]
  37. Paillard, T.; Noé, F. Techniques and Methods for Testing the Postural Function in Healthy and Pathological Subjects. BioMed Res. Int. 2015, 2015, 891390. [Google Scholar] [CrossRef]
  38. Bontemps, B.; Vercruyssen, F.; Gruet, M.; Louis, J. Downhill Running: What Are The Effects and How Can We Adapt? A Narrative Review. Sports Med. 2020, 50, 2083–2110. [Google Scholar] [CrossRef]
  39. Cappellini, G.; Ivanenko, Y.P.; Poppele, R.E.; Lacquaniti, F. Motor Patterns in Human Walking and Running. J. Neurophysiol. 2006, 95, 3426–3437. [Google Scholar] [CrossRef]
  40. Umberger, B.R. Stance and Swing Phase Costs in Human Walking. J. R. Soc. Interface 2010, 7, 1329–1340. [Google Scholar] [CrossRef]
  41. Hausdorff, J.M. Gait Variability: Methods, Modeling and Meaning. J. Neuroeng. Rehabil. 2005, 2, 19. [Google Scholar] [CrossRef] [PubMed]
  42. Chvatal, S.A.; Ting, L.H. Common Muscle Synergies for Balance and Walking. Front. Comput. Neurosci. 2013, 7, 48. [Google Scholar] [CrossRef] [PubMed]
  43. Lenhart, R.; Thelen, D.; Heiderscheit, B. Hip Muscle Loads During Running at Various Step Rates. J. Orthop. Sports Phys. Ther. 2014, 44, 766–774, A1–4. [Google Scholar] [CrossRef] [PubMed]
  44. Fredericson, M.; Moore, W.; Guillet, M.; Beaulieu, C. High Hamstring Tendinopathy in Runners Meeting the Challenges of Diagnosis, Treatment, and Rehabilitation. Physician Sportsmed. 2005, 33, 32–43. [Google Scholar] [CrossRef]
  45. Pohl, M.B.; Kendall, K.D.; Patel, C.; Wiley, J.P.; Emery, C.; Ferber, R. Experimentally Reduced Hip-Abductor Muscle Strength and Frontal-Plane Biomechanics During Walking. J. Athl. Train. 2015, 50, 385–391. [Google Scholar] [CrossRef]
Figure 1. Visualizations of the first five principal movements (PM1–5; left column), shown in sagittal and frontal views, examples of principal position (PPk) and principal acceleration (PAk) over time (middle column), and the space–time representation of the calculated Lyapunov exponent (LyE) for PP1–5 (right column). The dashed line represents the right limb. Example data were derived from a single male participant. PM1 reflects swing-phase movement with trunk rotation to balance momentum. PM2 represents double-leg support with forward–backward sliding. PM3 illustrates single-leg support with trunk rotation aiding balance. PM4 captures hip and knee flexion/extension during double-leg support, while PM5 highlights side-to-side movements during single-leg support.
Signals 06 00002 g001
Figure 2. Post hoc tests illustrating the effects of treadmill gradient on (A) running stability, measured by the largest Lyapunov exponent (LyE), and (B) acceleration magnitude, assessed by the root mean square (RMS), of the first five movement components (PM1–5) under incline, level, and decline conditions. Data are presented as mean ± standard error, with significant differences marked at p ≤ 0.01. Treadmill gradients significantly affect running stability, with the mid-stance phase (PM3) showing the most impact. Decline running, particularly at 6°, results in greater instability compared to incline running at 3° and 6°. Treadmill gradients also significantly affect acceleration magnitude (RMS) in PM2, PM3, and PM5. For PM2, flat running showed higher RMS than running with a 6° incline. For PM3, running with a 6° incline had the highest RMS, exceeding all other gradients, while a 3° decline and flat running had lower RMS values than running with a 3° incline. For PM5, running with a 3° incline showed lower RMS than running with a 6° incline.
Signals 06 00002 g002
Table 1. Characteristics of participants (mean ± SD; * p < 0.001).
TotalFemale (n = 9)Male (n = 10)
Age (yrs.)23.6 ± 3.723.3 ± 3.923.8 ± 3.7
Weight (kg)67.2 ± 10.461.5 ± 9.172.2 ± 9.0 *
Height (cm)174.9 ± 9.2168.2 ± 7.4180.9 ± 5.9 *
Body mass index (kg/m2)21.9 ± 2.021.6 ± 1.922.0 ± 2.1
Table 2. Characteristics of the first five principal movements (PM1–5).
PMkMovement CharacteristicsPPk_rVAR (%)PAk_rVAR (%)
k = 1Swing-phase movement coupled with trunk rotation: One leg moves forward while the trunk rotates to balance the body’s momentum. 72.5 ± 7.349.0 ± 4.2
2Double-leg support coupled with anteroposterior sliding: Both feet are on the ground (double-leg support) and involve anteroposterior (forward–backward) movement. 12.8 ± 6.62.8 ± 0.8
3Single-leg support coupled with trunk rotation: One leg supports the body while the other swings forward. Trunk rotation is also involved here, assisting in the balance during the single-leg support.7.3 ± 3.25.3 ± 2.1
4Double-leg support coupled with hip and knee flexion/extension: Hip and knee movements during double-leg support, capturing the flexion and extension of these joints as both feet are in contact with the ground.2.9 ± 0.527.0 ± 2.4
5Single-leg support coupled with mediolateral sliding: The mediolateral (side-to-side) movements during the single-leg support phase.2.2 ± 1.80.2 ± 0.1
Disclaimer/Publisher’s Note: The statements, opinions and data contained in all publications are solely those of the individual author(s) and contributor(s) and not of MDPI and/or the editor(s). MDPI and/or the editor(s) disclaim responsibility for any injury to people or property resulting from any ideas, methods, instructions or products referred to in the content.

