Abstract
Analyzing brain activity during mental arithmetic tasks provides insight into psychological disorders such as ADHD, dyscalculia, and autism. While most research is conducted on the static functional connectivity of the brain while performing a cognitive task, the dynamic changes of the brain, which provide meaningful information for diagnosing individual differences in cognitive tasks, are often ignored. This paper aims to classify electroencephalogram (EEG) signals for rest vs. mental arithmetic task performance, using Bayesian functional connectivity features in the sensor space as inputs into a graph convolutional network. The subject-specific (intrasubject) classification performed on 36 subjects for rest vs. mental arithmetic task performance achieved the highest subject-specific classification accuracy of 98% and an average accuracy of 91% in the beta frequency band, outperforming state-of-the-art methods. In addition, statistical analysis confirms the consistency of Bayesian functional connectivity features compared to traditional functional connectivity features. Furthermore, the graph-theoretical analysis of functional connectivity networks reveals that good-performance subjects had higher global efficiency, betweenness centrality, and closeness centrality than bad-performance subjects. The ablation study on the classification of three cognitive states (subtraction, music, and memory) achieved a classification accuracy of 97%, and visual working memory (n-back task) achieved a classification accuracy of 94%, confirming the consistency and reliability of the proposed methodology.
1. Introduction
Neurophysiological methods like EEG are effective for measuring brain activity because of their dynamic capturing of brain activity (high temporal resolution), and they are inexpensive, noninvasive, and portable [1]. Analyzing brain activity during a mental arithmetic task provides insight into psychological disorders such as attention deficit hyperactivity disorder (ADHD) [2], dyscalculia [3], and autism with ADHD [4]. Researchers have proposed signal processing techniques such as power spectral density (PSD) [5], independent component analysis (ICA) [6], time-frequency analysis, and event-related potentials (ERP) [3]. The brain responses to mental arithmetic tasks are complicated, involve different brain regions, and modulate at different frequencies. Therefore, analyzing and classifying these brain responses using brain connectivity features helps us understand the intrinsic brain activity and provides helpful information with which to decode the brain disorders associated with cognition.
Furthermore, analyzing brain connectivity helps identify cognitive overload and ensure optimal learning [7]. Three types of brain connectivity are proposed in the literature: structural, functional, and effective. Structural (anatomical) brain connectivity corresponds to connectivity between white matter zones representing the fiber tracts of multiple brain regions [8]. Functional connectivity [9] estimates the temporal correlations of neuroimaging modalities. Effective connectivity determines the causal interactions (direct or indirect) of the brain regions [10]. This paper focuses on functional-connectivity estimation and classification, which helps to identify the underlying brain activity while performing a cognitive task.
The statistical functional-connectivity estimation methods proposed in the literature infer amplitude [11], spectral [12], and phase [13] correlations, focusing mainly on estimating the correlations on pairwise signals (such as Pearson’s correlation). These methods impose correlations between the regions of interest (ROIs) representing edge strengths between the nodes. Therefore, these methods capture only the secondary correlation between network nodes, and many confounding interactions are imposed, often thresholded by an arbitrary threshold. Researchers have used partial correlation that provides binary results of the existing correlation to avoid spurious connections between the nodes. Other sparse representation methods [14], such as the graphical least absolute shrinkage and selection operator (LASSO), use an inverse covariance matrix to impose correlations between the nodes. However, all these methods assume that the connectivity patterns are static, ignoring the dynamic behavior of brain functional connectivity. Some recent approaches have focused on dynamic functional connectivity over time [15]. These approaches have tried to estimate the covariance matrices of small time intervals from the fMRI data [16]. Later, these covariance matrices are clustered to form a tensor of connectivity matrices and fed to a classification model [17]. These methods are primarily developed on the fMRI data, where the functional-connectivity estimation of other neuroimaging and neurophysiological methods are unexplored. Researchers discovered that EEG is suitable for capturing the dynamicity of brain responses generated by synaptic transitions of millions of neurons in different frequency and time domains [18,19,20]. In addition, with its higher temporal resolution than fMRI, an EEG can directly acquire dynamic postsynaptic activity in the cerebral cortex. Hence, an EEG helps assess the synchronous fluctuations of the brain while performing a cognitive task [21]. This paper analyzes the Bayesian-structure learning method to estimate dynamic EEG functional connectivity in sensor spaces for a given cognitive task that avoids spurious pairwise correlations and ensures global functional connectivity.
In addition, we aim to classify the functional-connectivity features using different machine learning models and compare the results with state-of-the-art methods. Furthermore, we have developed a graph convolutional network (GCN) model to classify the Bayesian functional-connectivity features.
The proposed framework outperforms other classifiers and other combinations of functional-connectivity metrics and classifiers. Also, it outperforms state-of-the-art WM load classifiers using functional-connectivity metrics. Finally, we perform intrasubject statistical analysis of BSL connectivity metrics in alpha, beta, and theta frequency bands. This paper makes the following contributions:
- We analyze a Bayesian approach to estimate EEG functional connectivity for mental arithmetic tasks.
- We propose a novel GCN classifier to classify subject-specific Bayesian functional-connectivity features.
- The two-sided t-test, Spearman correlation, and graph-theoretical analysis show that the proposed Bayesian-structure learning approach produces consistent results in alpha, beta, and theta bands.
- The proposed framework outperforms state-of-the-art frameworks for EEG functional-connectivity-based classifications.
The rest of the paper is organized as follows: Section 2 presents the EEG dataset for WM load classification. Next, the Bayesian algorithm is presented to estimate functional connectivity, and the GCN model is used to classify the functional-connectivity metrics. The results are presented in Section 3, and a discussion is presented in Section 4.
2. Related Work
Different functional-connectivity estimation methods have been proposed in the last few years and developed based on different domains integrating signal processing and information theory. The functional-connectivity metrics infer different synchronizations and broadly divide into amplitude, spectral, and phase synchronizations. Although each estimation method has unique properties, they each quantify functional dependence on pairwise signals [22]. Let s(t) be the EEG signal, where is the number of time samples, and z(t) be the corresponding analytical signal computed from the Hilbert transform [23].
where is the Hilbert transform of the signal, is the instantaneous phase of the signal, and is the instantaneous amplitude of the signal.
We estimate the functional connectivity of each frequency band using amplitude, spectral, and phase synchronization methods.
Amplitude Coupling:
Leakage-corrected amplitude envelope correlation (AEC-c): Let be two EEG signals (from two EEG channels), and their complex-valued (Hilbert transform) time-frequency representations (power envelopes) are . The amplitude envelope correlation is obtained by calculating the Pearson correlation of the bandpass-filtered orthogonalized signals [24].
where denotes the imaginary operator, * denotes the complex conjugate, and denotes the orthogonality. We perform orthogonalization in both directions and compute the Pearson correlation between two orthogonalized signals simultaneously. The average of the orthogonalized correlations is the connectivity measure. The orthogonalization of the signals corrects the spatial leakage.
Spectral Coherence:
We consider coherence and imaginary coherence as spectral coupling metrics because they capture power spectra of the signals [25].
Coherence (Coh): The coherency [25] between two EEG signals, and , is defined as
where is the phase difference, and and ⟨ ⟩ denote the complex conjugation. Coherence is the absolute value of coherency defined as follows:
Coherence is affected by spatial leakage. Therefore, the imaginary part of coherence is used to reduce the spatial leakage.
Imaginary part of coherency (ImCoh): Spatial leakage in the coherence metric is corrected in ImCoh, resulting in zero phase-lag linear interaction.
Phase Synchronization:
All phase estimation measures assess the phase synchrony between two EEG signals in each frequency band obtained from the instantaneous phase of the signal [26].
Phase Transfer Entropy (PTE): In a given frequency band, we can define the PTE as lag δ, following [13]:
where H is the Hilbert transform and are states of previous time point.
Connectivity Matrix Construction:
The connectivity metrics are assessed for all pairs of EEG channels, leading to an adjacency matrix of dimension N*N, where N represents the number of channels. Then, we apply statistical thresholding by calculating the median of each correlation and binarizing the adjacency matrix. The final matrix is the connectivity matrix—a weighted undirected graph with EEG channels as nodes and edges as connectivity values. Finally, we construct the connectivity matrices over the time-series data (EEG epochs) length in all frequency bands. We use the leakage-corrected functional-connectivity metrics for our analysis.
Least Absolute Shrinkage and Selection Operator (LASSO):
LASSO is used in statistical modeling in the context of regression and graphical modeling. LASSO is primarily used in linear regression for variable selection and regularization. Graphical LASSO is a regularization technique used to learn the structure of an undirected graphical model and is particularly useful for estimating the precision matrix (or inverse covariance matrix) when dealing with high-dimensional data. The goal is to infer the connectivity between variables (in this case, EEG channels or regions) by promoting sparsity in the precision matrix, where a zero in the matrix implies conditional independence between the corresponding variables, given all other variables. This modeling can be used in compressive sensing that promotes sparse representation-based classifications [14]. The graphical LASSO approach can be adapted from the sparse representation of EEG signals by focusing on the precision matrix (Θ) estimation for EEG channels, which reflects the functional connectivity. The graphical LASSO optimization problem can be formulated as:
where Θ is the precision matrix (inverse covariance matrix), ensures that Θ is a positive definite, and is the trace of the product of the sample covariance matrix and , encouraging the model to fit the data. is the regularization parameter controlling the level of sparsity and is the L1 norm of Θ, promoting sparsity in the precision matrix.
3. Materials and Methods
The current study aims to classify the EEG functional-connectivity features for rest vs. a mental arithmetic task. The dataset contains the EEG data acquired from the subjects while performing the arithmetic task. The authors removed the artifacts of the dataset, such as eye blinking and noise, before publishing the dataset. The dataset was bandpass-filtered to obtain theta, alpha, beta, and gamma frequency bands. Next, functional-connectivity features for these frequencies were extracted separately using Bayesian-structure learning. Later, the Bayesian functional-connectivity features were used as input to the graph convolutional neural network classifier to train, validate, and classify the rest vs. task EEG. The classification was subject-specific as each individual has a different brain response while performing the mental arithmetic (WM) tasks. Finally, the results were compared with state-of-the-art methods. A two-sided t-test, Spearman correlation, and graph theoretical analysis were performed to find out the consistency of Bayesian functional-connectivity features. The methodology overview is presented in Figure 1.
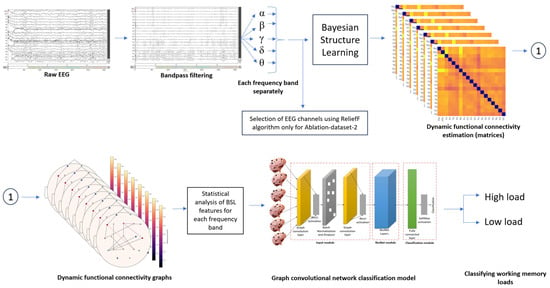
Figure 1.
Methodology overview.
3.1. EEG Data and Preprocessing
The dataset consists of the WM EEG dataset: 36 healthy subjects (mean age is 18 with an age range of 16–26) performing a mental arithmetic task [27]. The dataset used in this manuscript is a publicly available dataset in the PhysioNet public repository (https://physionet.org/content/eegmat/1.0.0/, accessed on 17 December 2018). Out of 36 subjects, 9 are male and 27 are female. Researchers consider mental arithmetic tasks as standard experimental protocols to estimate cognitive load. According to [28], a 15 min serial subtraction is a psychological stress. Therefore, assessing the functional connectivity for mental arithmetic tasks provides insight into underlying brain mechanisms with increasing WM load. The experimental design is as follows:
- The subjects were asked to sit on the reclined armchair in a dark, soundproof chamber.
- A resting-state EEG was recorded for 3 min.
- Later, the subjects performed arithmetic tasks without finger movements or speaking mentally.
- The task involved performing a serial subtraction with four-digit and two-digit numbers, with a minuend and a subtrahend, respectively (ex: 3141 and 42). The participants had to perform the subtraction in mind.
- Then, 23-channel EEG data were collected from the subjects while performing the task according to the 10–20 system (see Figure 2a). The sampling frequency was 500 Hz. The performance of each subject was noted for reference.
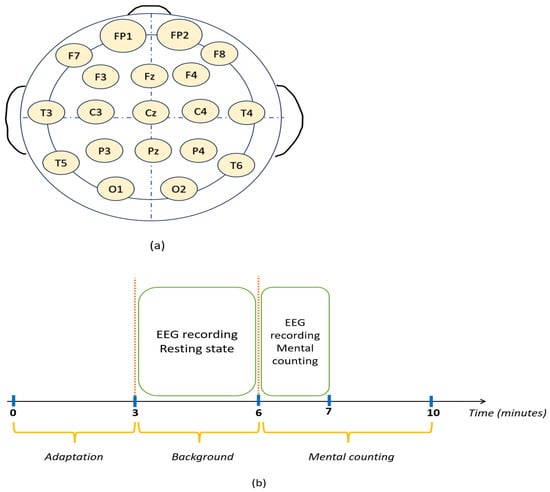 Figure 2. (a) 10–20 system of EEG placement (b) Experimental paradigm.
 - EEG data were recorded for 4 min, and the subject could perform as many subtractions as possible in the given time (see Figure 2b).
- Each EEG recording contained 180 s of resting-state and 60 s of mental-arithmetic-task data.
3.2. Feature Extraction
Dynamic functional connectivity:
Functional-connectivity estimation can be static and dynamic. The static functional-connectivity metrics assume that the degree of connectivity remains constant throughout the trial. Therefore, these metrics can only estimate the average degree of connectivity over the trial. Many static functional-connectivity methods are proposed in the literature, such as the phase locking value (PLV) [29], Pearson correlation [30], and the weighted phase lag index (wPLI) [31]. While all these methods focus on static functional connectivity, they differ in their approach to bypass volume conduction [24]. However, static approaches fail to detect the intervals during which brain regions are functionally connected or disconnected [15]. Therefore, there is a need to find additional information when these changes occur, and hence, the researchers have introduced a dynamic functional-connectivity approach. The adaptive sliding window is computed using the relative intersection of the confidence interval rule (RICI) algorithm proposed in [15].
Bayesian Score:
Given a Bayesian network represented as a directed acyclic graph (DAG), the observed data-to-score nodes were utilized in this network to ascertain their fit and appropriateness. This scoring method is especially essential when discerning the optimal structure for the Bayesian Network considering the data.
Observed Data:
Let G = (V,E) be a DAG representing a set of random variables X1, X2,…, Xn. The observed dataset is given by [32]:
where
each is a vector comprising n observed values for each variable in the network, linked to the ith data point.
Bayesian Scoring:
The Bayesian score of the network structure G, given the observed data D, is:
where is the likelihood of the data given the network structure, and is the prior probability of the network structure.
Node Score:
For a particular node i in the network, the score, termed score(i), is defined as [33]:
where:
- Γ represents the gamma function.
- denotes the hyperparameter tied to the ith configuration of the parent nodes for node i as per a Dirichlet prior [34].
- symbolizes the observed count of the concurrent occurrence of node i and its pth parent configuration within the data.
- The node score quantifies both:
- ○
- The alignment of the node with the observed data (captured by the multinomial likelihood).
- ○
- The prior convictions about the distribution of the node’s values are conditional on its parents (expressed via the Dirichlet prior).
Bayesian-Structure Learning Algorithm:
Different Bayesian-structure learning algorithms, which can be broadly classified into score-based, constraint-based, and hybrid algorithms, are proposed in the literature. The score-based algorithms use a goodness-of-fit score that learns the data structure by iteratively maximizing the score, whereas constraint-based algorithms learn the dependence structure of data using conditional independence tests. The hybrid algorithms combine both methods. Of these algorithms, score-based methods are fast and produce efficient results. These algorithms include local search, genetic algorithms, simulated annealing, and greedy search; a thorough review is provided in [32]. This paper uses the local search algorithm to estimate the functional connectivity of EEG signals in the sensor space. The step-by-step procedure of the Bayesian-structure learning algorithm is presented in Algorithm 1.
| Algorithm 1: Bayesian-Structure Learning Algorithm |
| Inputs: G: Initial graph structure Steps: The number of iterations for the algorithm. Data: A matrix of observed variables (EEG data) with dimensions (N, T), where N is the number of variables (EEG channels) and T is the number of time points. Window size: The size of the time window to use for each iteration. Overlap: The overlap between adjacent time windows is a fraction of the window size. Outputs: Graphs: A list of updated graph structures—one for each time window. |
|
| Return the list of updated graph structures, one for each time window. The resultant list is a set of connectivity graphs with shape (N*N*L) where N is the number of nodes (EEG channels), and L is the number of slides. |
3.3. Classification
Graph Convolutional Residual Network (GCN):
The proposed GCN model can be divided into three sequential modules: Input, ResNet, and Classification. The architecture of the proposed model is displayed in Figure 3. A k-fold cross-validation is performed, where (k-1) folds are used for training and validating the model, and the remaining fold is used for testing the model. Each module is discussed in this section.
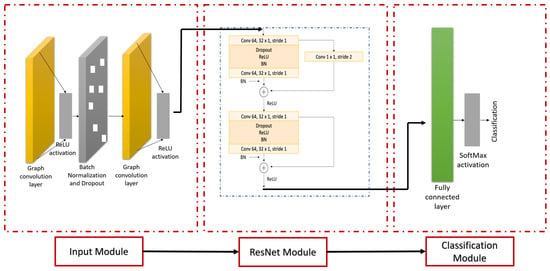
Figure 3.
Architecture of GCN. The model consists of the input, ResNet, and classification modules. The input module contains graph convolutional layers that receive functional-connectivity features. The ResNet module includes a "shortcut" network structure in convolutional and identity blocks. The classification module includes a fully connected layer followed by SoftMax activation.
Input module: The input module is designed for graph data, particularly for handling the intricacies of irregular and non-uniform graph structures. By integrating the graph convolutional network (GCN) design, the module efficiently captures both the localized and broad characteristics present in the graph. It achieves this by assimilating data from proximate nodes and their respective edges, rendering a comprehensive understanding of the graph’s topology [9].
The core operation in the GCN layer is represented by:
where
Here:
- X is an input feature matrix with dimensions N × D. N is the node count, and D indicates the number of initial features.
- symbolizes the weighted adjacency matrix of the graph.
- The resultant Z is a node-level output matrix of size N × F, with F denoting the feature count for each node.
- signifies the weight matrix transitioning from input to hidden layer, designed for a hidden layer comprising H feature maps.
- is the weight matrix transitioning from the hidden layer to the eventual output features.
- The term serves as a nonlinear ReLU activation function.
The hidden neural network is described by:
Starting with and culminating in , where L is the total number of layers.
ResNet module: The performance of deep neural networks, such as convolutional neural networks (CNNs), began to degrade due to the complications associated with training. These impediments, attributed mainly to vanishing and exploding gradient problems, hindered the convergence of the generalizability of profoundly deep networks. Residual network (ResNet) architectures often incorporate a “shortcut” structure in the network to counteract these challenges [14]. These structures provide an unimpeded gradient flow throughout the network. The shortcut structure facilitates feature learning using optimal learning and congruent mapping as follows:
The proposed GCN model consists of an identity block and a convolutional block. Each block consists of dropout and batch-normalization layers. The dropout layer is employed against overfitting; the dropout layers intermittently neutralize a subset of neurons, instilling a degree of randomness and thereby preventing co-adaptation of features. The batch-normalization layers are incorporated to avoid “internal covariate shift” and overfitting [14].
Classification module: The classification block consists of a fully connected layer and a classification layer with a SoftMax activation function.
3.4. Other Datasets for Ablation Study
The proposed methodology is validated with two more WM datasets, and its classification accuracy is compared with traditional functional-connectivity metrics.
Subtraction, music, and memory dataset (ablation-dataset-1):
The dataset from the OpenNeuro repository contains EEG recordings from 62 healthy individuals who participated in 3 distinct cognitive exercises: subtraction, music, and memory [36,37]. These activities are analyzed alongside resting-state EEGs, with eyes open and closed, to evaluate participants’ cognitive function and resting state. The EEG data were collected using a 64-channel setup based on the international 10–20 system during the tasks, with a sampling rate of 500 Hz.
- Memory Task: Participants are instructed to remember and recount all significant events from the day, from when they woke up until they arrived at the laboratory.
- Subtraction Task: Participants perform mental arithmetic by subtractively counting backward from 5000 in increments of 7.
- Music Task: Participants sing a song of their choice.
These cognitive states—memory (Me), subtraction (Ma), and music (Mu)—are then compared with the resting states. Additionally, participants complete a questionnaire regarding each task to gather behavioral data. This information is used to conduct a three-class classification of the cognitive states mentioned above.
Visual WM task (n-back task) (ablation-dataset-2):
The dataset comprises EEG recordings from 20 healthy individuals engaging in the n-back task, as documented in studies [38,39]. These recordings are compared against measurements taken during resting states. The EEG data, captured using a 256-channel setup in alignment with the 10–20 international system, have a sampling rate of 1000 Hz. The subjects, evenly divided between 10 males and 10 females, contributed bandpass filtered data from 3 to 45 Hz, with corrections made to remove artifacts like eye blinks and muscle movements.
The dataset encompasses EEG data from four distinct activities:
- Resting State: Subjects relax with their eyes open for 10 min.
- Visual Naming: Subjects name 80 distinct images and are also shown 40 scrambled images to which they should not react.
- Auditory Naming: Subjects listen to 80 different sounds and are required to identify each audibly.
- WM: Subjects are shown 80 images, including 40 previously displayed during the visual naming task, and must press a button to indicate recognition of repeated images.
This research also explores a binary classification comparing resting-state vs. working memory tasks (n-back/0-back). Additionally, the study examines the effectiveness of various EEG channel selections (19, 21, 32, 256 channels) using a reliefF algorithm to optimize channel selection [40].
4. Results
The model was run on an Intel® Core™ i7 processor, NVIDIA GeForce RTX 2070 GPU (8 GB memory), Python 3.7, and TensorFlow 2.2. The statistical analysis was performed using the Scikit-Learn module, visualizations of topomaps were developed using the MNE module, global efficiency plots were developed, and brain connectivity plots were developed using the Matplotlib module. The ROC curves were plotted using Scikit-Learn and Matplotlib modules. Scikit-Learn, MNE, and Matplotlib are Python modules (libraries). Other figures were plotted on an Excel sheet.
4.1. Statistical Analysis
This study uses a two-sided t-test to explore the differences in BSL functional-connectivity features across various EEG frequency bands (theta, alpha, beta, and gamma) when comparing rest states against mental arithmetic tasks. The delta band had no significant differences in rest vs. task. Therefore, the delta band was not investigated further in this study. This analysis aims to identify statistically significant changes in brain activity patterns associated with cognitive load. The degrees of freedom for our tests were set at 70, and a p-value threshold of <0.05 was considered to determine statistical significance. The results of this analysis are summarized in Table 1. For the alpha band, the difference in connectivity features was 0.076. However, with a t-statistic of 1.809 and a p-value of 0.0748, this difference was not considered statistically significant at the 0.05 level, suggesting that beta band activity does not significantly differ between rest and task conditions. The t-statistic and p-values in theta, beta, and gamma bands between rest and task conditions indicate the significant differences between the tasks in these frequency bands.

Table 1.
BSL two-sided t-test for frequency bands.
4.2. Reproducibility of Single Subject Inference (Spearman Correlation)
A Spearman correlation was calculated using and compared between two EEG trials to verify whether the proposed BSL features are reproducible between the trials. The highest correlation between the trials was found in the alpha band (0.98), followed by gamma (0.92), theta (0.89), and beta (0.82) bands (see Figure 4). The Spearman correlation was compared with state-of-the-art functional-connectivity features: leakage corrected amplitude envelope correlation (AEC-c), graphical least absolute shrinkage and selection operator (GLASSO), phase transfer entropy (PTE), and imaginary coherence (ImCoh). BSL features had consistent results in all four frequency bands compared to state-of-the-art functional-connectivity features.
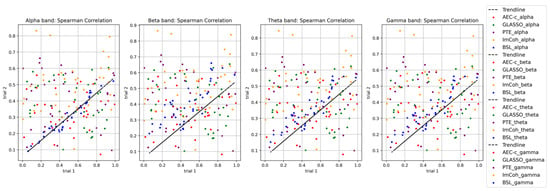
Figure 4.
Comparison of Spearman correlation of BSL features in theta, alpha, beta, and gamma frequency bands with state-of-the-art connectivity features.
4.3. Behavioral Data Analysis
After performing the mental arithmetic task, the count of subtractions over 4 min and their correctness was reported for each subject. The task performance is good only when the subjects have accurately subtracted a two-digit subtrahend from the initial four-digit number. Finally, the subjects were divided into good and bad performances (see Figure 5). The mean number of subtractions for good performers is 21, and for bad performers, it is 7. Subject 27 (female, age = 19) had the highest number of subtractions with 34 counts. The least number of subtractions was performed by subjects 10 (female, age = 17) and 21 (female, age = 20) with one count. The highest number of subtractions in the bad-performers group is 10 (subject 30, male, age = 17).
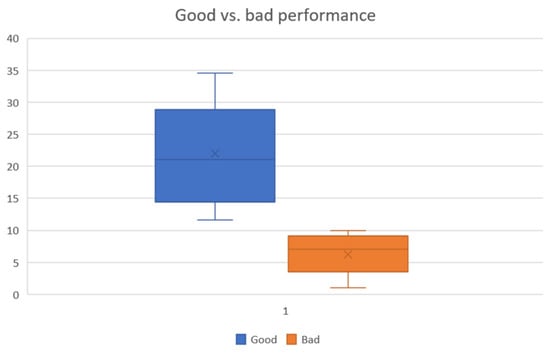
Figure 5.
Subtraction counts of good vs. bad performers.
4.4. Performance of the Proposed Method with Different Frequency Bands
As mentioned in Section 3.3, subject 27 had the highest number of accurate subtractions (count: 34), and subjects 10 and 21 had the lowest number (count: 1). Therefore, subjects 27 and 21 were selected to compare the frequency band activations and their corresponding connectivity. Figure 6 displays topomaps of subjects 27 and 21 in theta, alpha, beta, and gamma frequency bands (Figure 6a) and their corresponding functional connectivity (Figure 6b). For ease of comparison, the topomaps and corresponding functional connectivity are plotted at 6.4 s, when the subjects received the input numbers and started to perform the mental arithmetic task (subtraction). The red-to-blue gradient indicates the activity intensity, with red areas showing stronger activity and the blue regions showing less activity.
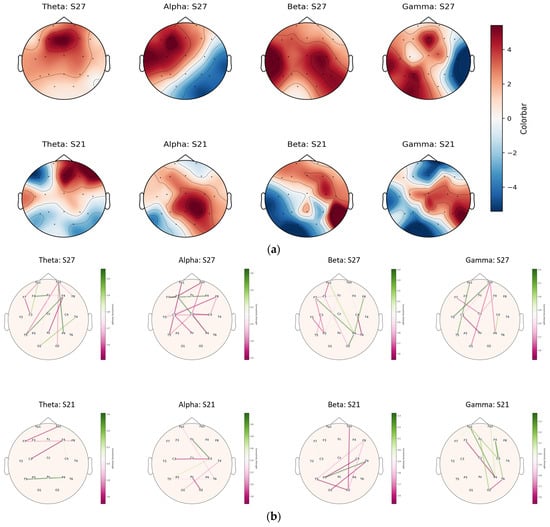
Figure 6.
Topomap and corresponding connectivity graph of good- vs. bad-performance subjects in four frequency bands. (a) Topomaps of good- vs. bad-performance subjects at the onset of the task (6.4 s). (b) Connectivity maps of corresponding frequency bands of good- vs. bad-performance subjects at 6.4 s.
The theta band displays higher activations in the frontal region in both subject 27 and subject 21. However, the cortical activations decreased in subject 21 in the central, parietal, and occipital regions compared to subject 27. The alpha band had higher activations in the left hemisphere of the brain in subject 27, whereas the right hemisphere was highly activated in subject 21. The beta band has higher activation throughout the brain in subject 27, whereas it is limited to frontal and right parieto-temporal regions in subject 21. Similar activations are observed in the gamma band in subject 27, emphasizing higher activations in the left hemisphere than in the right hemisphere in subject 21. For ease of comparison, the functional-connectivity network is plotted at 6.4 s, corresponding to four frequency bands in Figure 6a, and displayed in Figure 6b. The edge weight (ε) > 1.5 is considered to optimize the connectivity plots across all frequency bands. The lines represent connections (edges) with varying strengths: the thicker the line, the stronger the connectivity. The sidebars next to each map may indicate the overall connectivity strength for each frequency band, with green likely representing a standard or baseline level of connectivity and the pink-to-purple scale indicating deviations from this baseline. The connectivity plots in Figure 6b align with the brain activations in Figure 6a. Higher connectivity is observed in the frontal, central, and parietal regions in the left hemisphere in the good-performance subject; this is compared to right hemisphere connectivity in the performance subject.
4.5. Graph Theoretical Analysis
Global efficiency:
Global efficiency is a measure used in graph theory-based brain-network analyses and indicates how efficiently information is exchanged over the network. The scatter plots presented in Figure 7 illustrate a comparative study of global efficiency across four frequency bands—theta, alpha, beta, and gamma—between subjects categorized based on their performance in a cognitive task. The scatter plot for good-performance subjects on the left exhibits global efficiency values predominantly ranging from approximately 0.3 to 0.8, with the gamma band showing a particularly tight clustering around the 0.6 to 0.8 range. This suggests a robust association between high global efficiency in the gamma frequency and enhanced cognitive processing. Conversely, the scatter plot for bad-performance subjects on the right demonstrates a broader spread of values, mainly between 0.2 and 0.7, with none reaching the efficiency peaks observed in the good-performance group. The comparative dearth of higher efficiency values in the bad performers highlights a potential correlation between lower global efficiency and suboptimal cognitive task execution. These visual data insights thus offer a quantifiable link between the efficiency of neural connectivity and cognitive performance levels, potentially guiding future interventions aimed at cognitive enhancement.
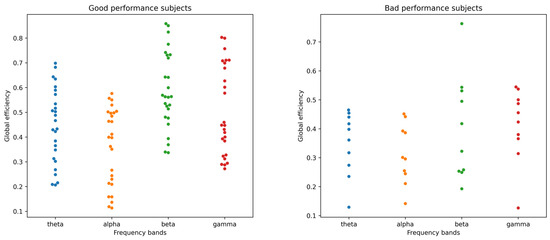
Figure 7.
Global efficiency of BSL functional-connectivity graphs for good (left) vs. bad (right) performance subjects in theta, alpha, beta, and gamma frequency bands.
Clustering coefficient:
The clustering coefficient, a quantitative network connectivity metric, gauges the extent to which nodes within a graph—here representing EEG channels—tend to cluster. The bar chart (Figure 8) depicts the clustering coefficients across EEG channels, delineating the contrast between subjects with good and bad performance on a cognitive task. As illustrated, the good-performance group exhibits notably higher clustering coefficients across a range of EEG channels, with the most pronounced differences observed at channels Fp1 (~0.005 for bad vs. ~0.035 for good), F8 (~0.007 for bad vs. ~0.045 for good), T5 (~0.007 for bad vs. ~0.04 for good), and O1 (~0.005 for bad vs. ~0.035 for good). Conversely, channels such as Fp2, F3, and Fz show a less marked contrast, though the good-performance group still maintains a lead. The coefficient disparity implies a more robust local connectivity within the brain’s neural network among the high-performing subjects, potentially facilitating more effective cognitive processing. This relationship is especially evident in the frontal and occipital regions—known for their roles in higher-order cognitive functions and visual processing, respectively—where higher coefficients correlate with better task performance. Conversely, the lower clustering coefficients observed in the bad-performance group across channels such as Fp2 (~0.005), F3 (~0.01), and Fz (~0.015) suggest a less interconnected network, which might contribute to their suboptimal cognitive task outcomes. These insights emphasize the significance of localized brain network configurations in cognitive abilities and task execution.
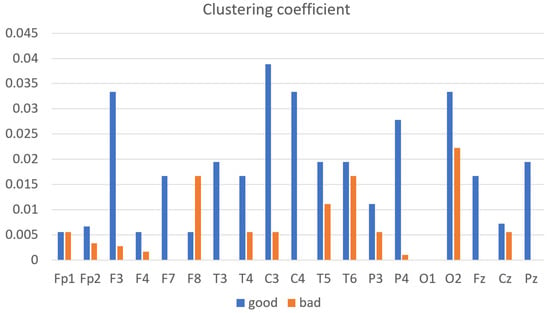
Figure 8.
The average clustering coefficient of good- vs. bad-performance subjects.
Betweenness centrality:
Betweenness centrality is a measure from graph theory that calculates how often a node serves as a connecting point on the shortest route between two other nodes. In the context of neural networks, it reflects the importance of a particular region in the flow of information throughout the brain. The bar graph (Figure 9) depicts the mean betweenness centrality of EEG channels for subjects grouped into good- and bad-performance categories based on their outcomes in a cognitive task measured across EEG channels. The good-performance group demonstrates higher betweenness centrality at specific EEG channels, suggesting that these nodes play a more central role in cognitive processing. For instance, channel C3 shows a significant difference, with centrality peaking at approximately 0.016 for the good performers, compared to around 0.008 for the bad performers. Other channels, such as F4 and T5, also show higher centrality in the good-performance group, with values around 0.014 and 0.012, respectively, further suggesting a pattern where specific brain regions are integral to efficient cognitive function. In contrast, the bad-performance group generally exhibits lower betweenness centrality, implying a less-central role for these nodes in their cognitive networks, which may relate to their poorer task performance. The disparities in betweenness centrality between the two groups across various channels provide insight into the structural and functional connectivity of the brain.
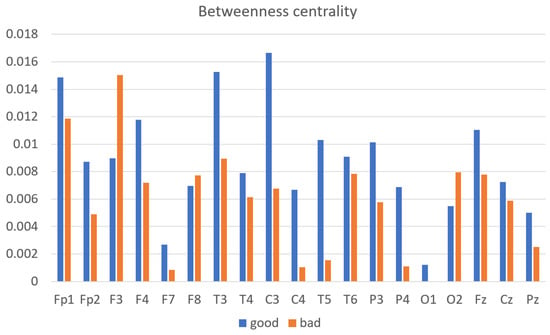
Figure 9.
Average betweenness centrality of good- vs. bad-performance subjects.
4.6. Intrasubject Classification
A binary subject-specific (intrasubject) classification was performed by training, validating, and testing the model for each subject using the BSL features. A 10-fold cross-validation was performed to train, validate, and test the model. Subject 26 had the highest classification accuracy in the beta band (98%) among all classifications. The theta band had 97% accuracy for subject 20, followed by the gamma band, which had 89% classification accuracy for subject 05. Finally, the alpha band had an 85% classification accuracy for subject 19. The good-performance subjects (Figure 10) had the highest classification accuracies compared to the bad-performance subjects (Figure 11). The sensitivity and specificity results provided in Figure 12 offer insight into the model performance across individual classes. The results suggest that the proposed model performed well in identifying the negative cases (high specificity) and positive cases (high sensitivity). The beta band had high sensitivity and specificity in all classifications, followed by theta, gamma, and alpha bands. The receiver operating characteristic (ROC) curves are plotted for 10-fold cross-validation in all four frequency bands for top classifications (Figure 13). The ROC curve further represents that the model performance is consistent in all four frequency bands.
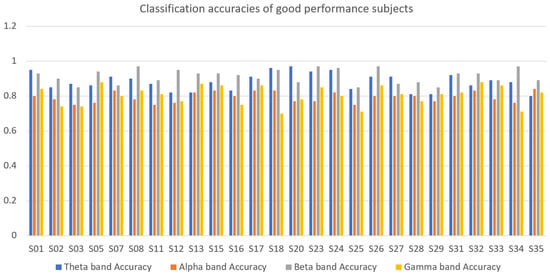
Figure 10.
Classification accuracies of good-performance subjects in theta, alpha, beta, and gamma frequency bands.
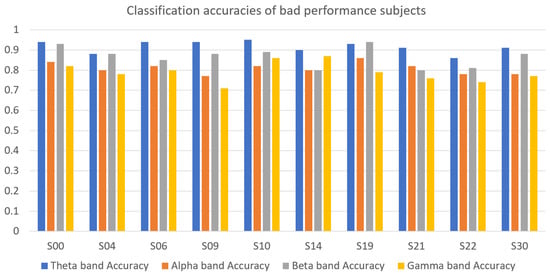
Figure 11.
Classification accuracies of bad-performance subjects in theta, alpha, beta, and gamma frequency bands.
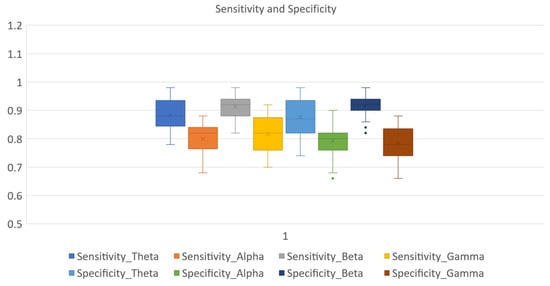
Figure 12.
Sensitivity and specificity ranges of GCN classifier in theta, alpha, beta, and gamma frequency bands.
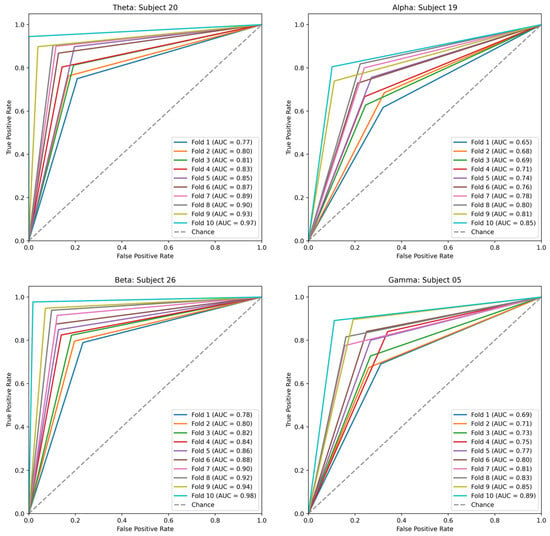
Figure 13.
ROC curves for 10-fold cross-validation of top-classifications in theta, alpha, beta, and gamma frequency bands.
4.7. Comparison with Different Functional-Connectivity Features
In the pursuit of advancing machine learning algorithms, this study explores functional-connectivity features such as amplitude, spectral, and phase synchronizations, specifically focusing on those corrected for spatial leakage, including AEC-c, ImCoh, and PTE. The efficiency of the proposed model is evaluated alongside the graphical LASSO technique. The independent classification of these connectivity features using the proposed GCN model reveals, as shown in Table 2, that the BSL and imaginary coherence features achieve over 90% accuracy, comparable to the proposed model’s highest classification accuracy for any subject. AEC-c and graphical LASSO achieved above 85% accuracy, and PTE had the lowest accuracy of 76%.

Table 2.
Comparison of classification of BSL functional connectivity with state-of-the-art functional-connectivity features using GCN classifier.
4.8. Comparison of the Proposed Feature Extraction Method with Different Classification Models
The proposed BSL algorithm’s efficiency was scrutinized by applying various classifiers documented in the literature, including SVM, CNNs, k-NN, and LDA. SVM, k-NN, and LDA are developed using Scikit-Learn in Python version 3.6. The architecture of the CNN was developed using TensorFlow (version 2.2), as proposed in [41]. Table 3 details the performance outcomes, with the GCN model achieving the highest classification accuracy of 98% for the beta band and maintaining an average accuracy of 91% across subjects, thus surpassing the efficiencies of the other classifiers examined. SVM attains the second-best accuracy levels for both the highest-scoring subject and, on average, across all subjects, followed by the CNN. However, k-NN and LDA had an accuracy below 60%.

Table 3.
Comparison of classification of BSL features using GCN and other classifiers.
4.9. Comparison with State-of-the-Art Methods
Table 4 compares various machine learning approaches for classifying EEG data for mental arithmetic tasks, highlighting the diversity in feature extraction techniques, classifiers, and the achieved accuracies. Ref. [42] utilizes mean segmented samples and standard deviation as features and applies an SVM (support vector machine) classifier, achieving an accuracy of 92.5%. Ref. [43] learn directly from raw EEG data using ANNs (artificial neural networks) and LSTM (long short-term memory) networks, with 96.8% and 94% accuracy, respectively. This approach emphasizes the effectiveness of deep learning models in handling raw EEG data. Ref. [1] explores time-domain and frequency-domain features and uses a Gaussian Naïve Bayes classifier, resulting in an 85% accuracy. This indicates a focus on both temporal and spectral characteristics of EEG signals. Ref. [44] works with frequency domain features, spectral entropy, and Shannon entropy, employing neural networks for classification, which yields an 88.8% accuracy. These entropy-based features indicate the complexity and information content in EEG signals. Ref. [45] adopts neighborhood component analysis as their feature extraction technique and uses KNNs (K-nearest neighbors) for classification, obtaining a 77.3% accuracy. This approach focuses on reducing dimensionality while preserving the structure necessary for classification. Ref. [46] utilizes multivariate multiscale entropy as features and an SVM classifier, achieving a 90% accuracy. This method assesses the complexity of EEG signals at multiple scales, highlighting the signal’s dynamic behavior. Ref. [47] focuses on PSD (power spectral density) features and uses EEG-TopoNet for classification, with an accuracy of 94.2%. This innovative approach likely leverages topological data analysis or network-based features derived from PSD. The proposed method utilizes BSL features and a GCN classifier, reporting the highest classification accuracy among all subjects at 98% and an average accuracy of 91%. Therefore, the results suggest that the proposed method outperforms the other listed techniques in terms of both individual and average classification accuracies.

Table 4.
Comparison of the proposed method with state-of-the-art methods in classifying mental arithmetic tasks.
4.10. Ablation Study with Other Datasets
4.10.1. Ablation Dataset-1
Reproducibility of functional connectivity: In this investigation, a one-way ANOVA was conducted to evaluate three cognitive tasks: subtraction, music, and memory, with a significance threshold set at a p-value of <0.05. The analysis showed significant variations in the beta and theta frequency bands’ powers among subjects performing different tasks, with p-values of 0.015 and 0.045, respectively. Across different participants, both beta and theta bands showed notable differences, with p-values of 0.0089 and <0.005, respectively. The alpha band also exhibited significant differences between participants (p < 0.001) and was marginally significant within subjects (p = 0.069). The delta band had a p-value close to the threshold at approximately 0.054, while the gamma band was statistically significant, recording a p-value of 0.0012. Therefore, all frequency bands were included in the analysis of this dataset. The reproducibility analysis (Spearman correlation) revealed that the BSL connectivity metrics exhibited high reliability, particularly in the alpha band, where a correlation of 0.95 was observed (see Figure 14). This was followed by similarly robust results in the beta band, with a correlation of 0.93, and the theta band, with a correlation of 0.87.
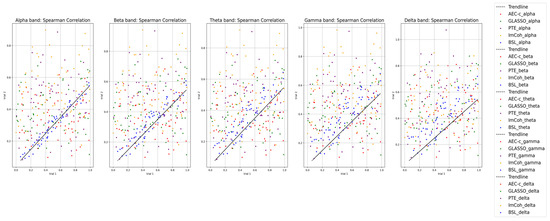
Figure 14.
Comparison of Spearman correlation of BSL features in delta, theta, alpha, beta, and gamma frequency bands with state-of-the-art connectivity features for ablation-dataset-1.
Intrasubject classification: Table 5 provides a detailed summary of classification outcomes across various EEG frequency bands—alpha, beta, gamma, delta, and theta—for the top-performing classifications in each band, as evaluated by accuracy, sensitivity, specificity, and the Kappa coefficient. In the alpha band, subjects 19 and 49 achieved the highest classification accuracy, each scoring 0.97. In the beta band, subject 06 stood out with an impressive accuracy of 0.93 and a sensitivity rate of 0.9. The gamma band saw subject 15 reaching the top classification accuracy of 0.91. For the delta band, subjects 34 and 55 both recorded the highest accuracy at 0.86. Lastly, in the theta band, subjects 14 and 19 demonstrated exceptional classification accuracy, scoring 0.96.

Table 5.
Accuracy, sensitivity, specificity, and kappa coefficients of top five classifications in alpha, beta, gamma, delta, and theta frequency bands for ablation-dataset-1.
Comparison with traditional functional-connectivity features: Table 6 evaluates the model’s performance using various functional-connectivity features, illustrating the classification accuracy of each method across different frequency bands. The graphical LASSO, PTE, and BSL methods achieved individual classification accuracies exceeding 90% in the theta, alpha, beta, and gamma bands. In contrast, AEC-c and ImCoh recorded slightly lower accuracies, at 86% and 89%, respectively. Furthermore, when considering the average classification accuracies for all subjects, graphical LASSO and BSL demonstrated outstanding performance, surpassing 90% accuracy in both theta and alpha frequency bands.

Table 6.
Performance comparison of functional-connectivity metrics using the proposed classification model (GCN) for ablation-dataset-1.
Comparison with different classifiers: Table 7 details the classification performance of BSL features when used with various classifiers. Among the classifiers evaluated, the GCN stands out as the proposed method. Following the GCN, the CNN achieved the highest individual classification accuracy at 92% and an average accuracy of 83%. SVM and k-NN also showed commendable accuracies of 85% and 75%, respectively. LDA recorded the lowest performance, with a classification accuracy of 69%.

Table 7.
Performance comparison of the proposed BSL functional-connectivity classification with other classifiers for ablation-dataset-1.
4.10.2. Ablation Dataset-2
Reproducibility of functional connectivity: Figure 15 highlights the correlation coefficients across EEG frequency bands, showing the alpha band leading with a correlation of 0.95, followed by theta at 0.92, gamma at 0.87, beta at 0.79, and delta at 0.73. These correlations were assessed against established functional-connectivity metrics: AEC-c, GLASSO, PTE, and ImCoh. The BSL features maintained consistent performance across all bands compared to these traditional metrics. The alpha and theta bands exhibited reliable reproducibility across all tested functional-connectivity metrics.
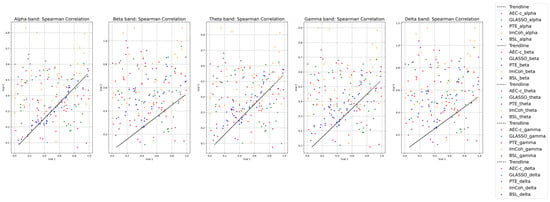
Figure 15.
Spearman correlation of functional-connectivity metrics in alpha, beta, theta, gamma, and delta frequency bands for ablation-dataset-2.
Performance of the proposed method with selected channels: This section examines the influence of EEG channel selection on classification accuracy as identified in studies utilizing the reliefF algorithm [40]. Different channel configurations analyzed include:
- Nineteen channels: Fp1, Fp2, F7, F3, Fpz, F4, F8, C3, Cz, C4, P3, Pz, P4, O1, O2, T3, T4, T5, T6.
- Twenty-one channels: Adds Fpz and Oz to the nineteen-channel setup.
- Thirty-two channels: Includes additional midline and parietal channels such as F1, F2, F5, F6, FCz, C5, C6, CP1, CP2, CP5, CP6, P1, P2, TP7, TP8, POz, O11h, O12h.
Table 8 presents the classification accuracy of a specific method applied to EEG data across five frequency bands: delta, theta, alpha, beta, and gamma. The evaluation spans four EEG configurations with different channel counts: 19, 21, 32, and 256 channels. Results show that the 19-channel setup achieves the highest accuracy in all frequency bands except for delta, where the 21-channel setup excels slightly. However, as the number of channels increases to 32, there is a noticeable decline in accuracy across all bands, most markedly in the beta band. Expanding to 256 channels leads to a substantial decrease in accuracy in all bands, indicating potential issues with scaling or increased noise and complexity from the larger array of channels.

Table 8.
Performance (accuracy %) of the proposed method with selected channels for ablation-dataset-2.
Notably, the alpha and theta bands demonstrate the highest accuracies with the 19 and 21-channel setups, suggesting these bands are more stable and reliable for the method used, particularly in configurations with fewer channels. Given these observations, further analyses in this study will focus on the 19-channel EEG setup and continue examining the theta, alpha, and gamma bands due to their superior performance, while the delta and beta bands, which showed poorer results, will be less emphasized.
Male vs. female performance analysis: The dataset comprises EEG data from twenty participants, split evenly between ten males and ten females. Female participants are between 21 and 40 years old, while male participants range from 20 to 38. Subject 3, aged 40, and subject 13, aged 38, had already obtained university degrees at the time of data collection, whereas the remainder were university students. Subject 17 recorded the highest accuracy in the theta band at 91%, as shown in Figure 16. The lowest theta band accuracy was observed for subject 12 at 81%. In the alpha band, subject 09 achieved the highest classification accuracy, approximately 94%, while subject 12 again showed the lowest accuracy. For the gamma band, subject 06 had the lowest classification accuracy at 80%, while subject 10 exhibited the highest at 90%. The theta band was particularly notable for its high sensitivity and specificity in classifications, as highlighted in Figure 17. The ROC curves, detailed in Figure 18, demonstrate the model’s consistent performance across the theta, alpha, and gamma bands.
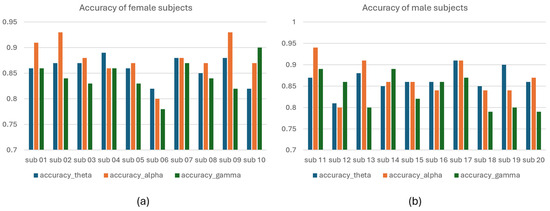
Figure 16.
Classification accuracy. (a) classification accuracy of female subjects. (b) classification accuracy of male subjects for ablation-dataset-2.
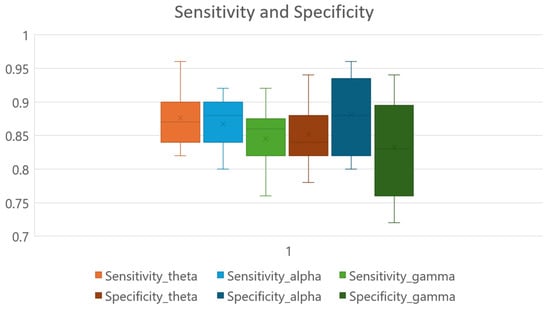
Figure 17.
Sensitivity and specificity of the model in alpha, theta, and gamma frequency bands for ablation-dataset-2.
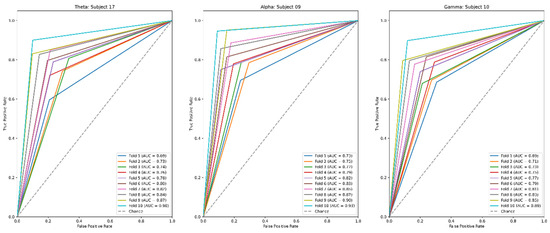
Figure 18.
ROC curves of top classifications in alpha, theta, and gamma frequency bands for ablation-dataset-2.
Comparison with other functional-connectivity features: Table 9 shows that the AEC-c and proposed BSL features achieve over 85% accuracy, followed by graphical LASSO, which has an accuracy of 82%. ImCoh has the lowest classification accuracy of 67%.

Table 9.
Performance comparison of functional-connectivity metrics using the proposed classification model (GCN) for ablation-dataset-2.
Comparison with different classification models: Table 10 details the performance of the proposed model with other classifiers in classifying BSL features. The CNN achieves the highest classification accuracy of 90%, next to the GCN (proposed model), which achieves 94%. SVM stands next to the CNN, with 89%, and the lowest classification accuracy is with a k-NN (62%).

Table 10.
Performance comparison of the proposed BSL functional-connectivity classification with other classifiers for ablation-dataset-2.
5. Discussion
This study presented a novel framework for classifying mental-arithmetic-task load using BSL features and the GCN classification model. Our approach demonstrated superior performance in distinguishing between rest vs. mental arithmetic tasks, as evidenced by the high classification accuracies across different EEG frequency bands. These findings underscore the potential of dynamic EEG functional-connectivity analysis, combined with advanced machine learning models, for understanding cognitive load and brain network dynamics during mental arithmetic tasks.
The statistical analysis, revealing significant differences in connectivity features across various frequency bands (theta, alpha, beta, and gamma), highlights the complexity of brain function during mental arithmetic tasks. Notably, the accuracy in the theta and beta bands suggests that specific frequencies are more indicative of cognitive load changes—a finding that could inform targeted interventions for cognitive enhancement. Furthermore, the comparison with state-of-the-art methods reveals the superiority of the proposed GCN model over traditional machine learning algorithms. This underscores the potential of advanced neural network architectures in handling EEG spatial and temporal complexities, providing a more accurate representation of brain activity. The reproducibility assessment conducted through Spearman correlation demonstrated the high consistency of the proposed BSL features across trials, suggesting robust feature stability. Compared to other state-of-the-art functional-connectivity features, this high reproducibility across different frequency bands indicates the reliability of BSL features in capturing the dynamic changes in brain connectivity. The consistent results in all four frequency bands reinforce the effectiveness of the proposed BSL features for analyzing EEG data in cognitive tasks, offering a promising tool for brain connectivity studies.
The study compares traditional functional-connectivity methods AEC-c, ImCoh, PTE, and graphical LASSO with the proposed BSL algorithm. AEC-c is widely used in functional-connectivity analysis to measure the synchronization between the amplitude envelopes of brain signals across different regions. The correction for spatial leakage makes AEC-c a robust measure against false connectivity patterns caused by volume conduction or signal mixing [24]. Comparing BSL with AEC-c allows us to demonstrate the ability of BSL to capture true functional connectivity without being affected by such artifacts. ImCoh is selected for its effectiveness in mitigating the influence of volume conduction by focusing on the imaginary part of the coherence spectrum. This method provides insights into true oscillatory interactions between brain regions, free from the confounding effects of signal mixing [25]. The comparison with ImCoh highlights BSL’s competence in identifying genuine neural interactions, potentially with greater specificity or sensitivity. PTE quantifies the directional flow of information between brain regions, offering insights into the effective connectivity that underpins cognitive processes [13]. Its inclusion in the comparative analysis emphasizes BSL’s capacity to capture dynamic changes in brain connectivity patterns, including directional interactions, which are crucial for understanding cognitive task performance. Graphical LASSO is a regularization technique that infers sparse graphical models, making it suitable for elucidating the underlying network structure from high-dimensional data such as EEG [14]. By comparing BSL with graphical LASSO, you underscore the adaptability and efficiency of BSL in modeling complex brain networks with potentially fewer assumptions and constraints.
By selecting these diverse methods for comparison, the study ensures a comprehensive evaluation of BSL across various dimensions of functional-connectivity analysis, including robustness to artifacts (AEC-c, ImCoh), directional connectivity (PTE), and network sparsity (graphical LASSO). These methods are well-established in the literature, providing a solid benchmark to demonstrate the advancements or unique contributions of the BSL algorithm in capturing the dynamic functional connectivity of the brain during cognitive tasks. This comparison highlights BSL’s innovative approach to estimating dynamic EEG functional connectivity, showcasing its potential superiority in accuracy, reliability, and the capture of complex connectivity patterns. This structured comparison validates the effectiveness and novelty of the BSL algorithm and contributes to the broader discourse on methodologies for EEG functional-connectivity analysis, offering insights that may guide future research in the field.
The behavioral data analysis provided insights into subjects’ performance on the mental arithmetic task, revealing a clear distinction between good and bad performers based on the number of correct subtractions. This differentiation validates the experimental design and suggests a potential correlation between the subjects’ cognitive load capacity and their arithmetic task performance. The observed variance in performance could be reflective of individual differences in working memory capacity, attentional resources, and mental efficiency, highlighting the importance of considering behavioral outcomes alongside neural data for a comprehensive understanding of cognitive task effects.
The exploration of EEG brain activations during mental arithmetic tasks has unveiled significant insights into the neural substrates of cognitive processes. One notable finding is the increased activity in the left limbic lobe, particularly within the beta frequency band, in individuals who exhibit superior performance in mental arithmetic. This observation suggests the limbic lobe’s involvement in critical functions such as visuospatial processing, memory retrieval for arithmetic facts, and emotional regulation during cognitive tasks [48]. This aligns with the broader understanding of the brain’s adaptability and specialization in response to complex cognitive demands.
Further investigations into EEG signal characteristics, such as power spectral density and coherence during mental arithmetic, have distinguished individuals based on task performance. Fourier analysis studies have categorized participants as good or poor counters, illustrating how EEG metrics can be reliable indicators of cognitive task engagement and efficiency [27]. This differentiation highlights the potential of EEG in personalizing learning and cognitive training programs by identifying individual strengths and areas for improvement.
The application of connectivity analyses like directed transfer function (DTF) and generalized partial directed coherence (GPDC) provided more profound insights into the functional network dynamics of the brain during arithmetic reasoning. Such methodologies have pinpointed specific frequency bands, notably Beta2 (15–22 Hz), as critical for distinguishing between mental arithmetic tasks and baseline states, achieving classification accuracies up to 89%. This underscores the intricate web of neural interactions that underpin mathematical cognition and its dependency on effective inter-regional communication [49].
Moreover, recent advancements in EEG analysis techniques, including using the generalized Higuchi fractal dimension spectrum (GHFDS), have significantly enhanced the accuracy of recognizing mental arithmetic tasks from EEG signals. Researchers have improved task recognition accuracy by combining GHFDS with other features, such as power spectrum density and statistical features, paving the way for more sophisticated brain-computer interfaces that can adapt to the user’s cognitive state in real time [50].
In summary, integrating these findings into our discussion not only reinforces the validity of our results but also highlights the complexity of the neural mechanisms involved in arithmetic cognition. By drawing on diverse analytical techniques and findings from the broader literature, we can better understand the multifaceted nature of brain activity during mathematical tasks. This synthesis contributes to the academic discourse on cognitive neuroscience and suggests practical implications for educational strategies and clinical assessments, paving the way for future interdisciplinary research in this field.
Applying graph theoretical measures such as global efficiency, betweenness centrality, and clustering coefficient to the EEG data analysis offers a novel perspective on the organization and functionality of brain networks during cognitive tasks. The association between higher global efficiency and clustering coefficients in good performers and enhanced cognitive processing capabilities suggests that these graph measures could be valuable indicators of cognitive efficiency [51]. The high classification accuracies achieved using the proposed BSL features across different frequency bands underscore the potential of machine learning models, specifically GCN, in distinguishing between high and low cognitive load states at an individual level. This capability is particularly promising for developing adaptive cognitive training and neurofeedback systems, where real-time cognitive load assessment can be used to adjust task difficulty or provide feedback to optimize learning and cognitive performance. The comparative analysis of different functional-connectivity features highlights the superiority of the proposed BSL features, mainly when used in conjunction with the GCN model. This comparison validates the effectiveness of the proposed method in accurately classifying mental arithmetic task-related cognitive load. It underscores the importance of selecting appropriate functional-connectivity features and classification models to capture the complex dynamics of brain connectivity during cognitive tasks.
The manuscript reviews and confirms the effectiveness of the BSL and GCN methods by applying them to other ablation datasets. This validation process is crucial for assessing both the consistency and reproducibility of these methodologies across different datasets. Such a rigorous testing framework ensures that the approaches are robust and reliable when faced with varying data conditions.
Limitations: This paper performs a subject-specific classification; therefore, the model needs to train and classify each subject dataset individually. The findings presented in this manuscript are specific to the computational setting used for this study. Therefore, outcome variations may occur when employing k-fold cross-validation in different computational settings. The study’s findings are based on a dataset of 36 healthy subjects with a mean age of 18, which may limit the generalizability of the results to broader populations, including different age groups or subjects with neurological conditions. While the manuscript validates the consistency and reproducibility of BSL and GCN methods across different ablation datasets, it suggests that additional analysis is necessary to explore cognitive behavior thoroughly. Future studies could expand the participant pool to include broader demographic and clinical populations to validate the proposed methods across diverse groups. The discussion section discusses only the results of the mental arithmetic task dataset.
6. Conclusions
This paper presents a BSL algorithm to calculate the dynamic functional connectivity of an EEG for mental arithmetic tasks. In addition, a GCN classification model using functional-connectivity features is presented to perform subject-specific classification for rest vs. task EEGs. The proposed method outperforms the traditional functional-connectivity-based classification methods in sensor space. The proposed BSL functional-connectivity algorithm efficiently captured rest vs. task features in the beta band and achieved the highest subject-specific classification accuracy of 98%, with an average of 91%. In addition, the paper emphasizes the importance of exploring different frequency bands and respective functional-connectivity features for mental arithmetic tasks. Although the behavioral results suggest that the good-performance subjects had higher activity in different frequency bands, further investigation is needed on the functional-connectivity patterns of good- vs. bad-performance subjects.
7. Future Work
In our manuscript, we have demonstrated the efficacy of our proposed method within the context of a specific dataset focused on mental arithmetic tasks as a measure of WM. We acknowledge the importance of evaluating the generalizability and robustness of our method across a broader range of datasets to fully understand its applicability and limitations in capturing the complexities of WM functions. Thus, a significant direction for our future work involves extending this research to include diverse WM datasets, encompassing different cognitive tasks, subject demographics, and experimental conditions. This will enable us to test the adaptability of our approach to various WM models and identify any modifications necessary to maintain high accuracy and reliability in classification and analysis. Additionally, by exploring datasets with varying characteristics, we aim to refine our method’s capability to handle the subtleties of EEG data analysis in WM research, ultimately contributing to a more nuanced understanding of neural connectivity patterns associated with cognitive processing. Through this extended investigation, we anticipate providing valuable insights into the neural underpinnings of WM and offering a robust, validated tool for researchers in the field of cognitive neuroscience.
Author Contributions
Conceptualization, H.G. and V.M.; methodology, H.G.; software, H.G.; validation, V.M. and H.G.; formal analysis, H.G.; investigation, H.G.; resources, H.G.; writing—original draft preparation, H.G.; writing—review and editing, H.G. and V.M.; visualization, H.G.; supervision, V.M. All authors have read and agreed to the published version of the manuscript.
Funding
There is no funding for this research.
Institutional Review Board Statement
The EEG dataset used in this study is already available in the PhysioNet database. No data were gathered from human subjects for the purposes of this study.
Data Availability Statement
The data is available in the PhysioNet public repository in the link below: https://physionet.org/content/eegmat/1.0.0/ (accessed on 17 December 2018).
Conflicts of Interest
The authors declare no conflicts of interest.
References
- Chatterjee, D.; Gavas, R.; Samanta, R.; Saha, S.K. Electroencephalogram-based cognitive performance evaluation for mental arithmetic task. In Cognitive Computing for Human-Robot Interaction: Principles and Practices; Academic Press: Cambridge, MA, USA, 2021; pp. 85–101. [Google Scholar] [CrossRef]
- Ortuño-Miró, S.; Molina-Rodríguez, S.; Belmonte, C.; Ibañez-Ballesteros, J. Identifying ADHD boys by very-low frequency prefrontal fNIRS fluctuations during a rhythmic mental arithmetic task. J. Neural Eng. 2023, 20, 036018. [Google Scholar] [CrossRef] [PubMed]
- Cárdenas, S.Y.; Silva-Pereyra, J.; Prieto-Corona, B.; Castro-Chavira, S.A.; Fernández, T. Arithmetic processing in children with dyscalculia: An event-related potential study. PeerJ 2021, 9, e10489. [Google Scholar] [CrossRef] [PubMed]
- Anobile, G.; Bartoli, M.; Masi, G.; Tacchi, A.; Tinelli, F. Math difficulties in attention deficit hyperactivity disorder do not originate from the visual number sense. Front. Hum. Neurosci. 2022, 16, 949391. [Google Scholar] [CrossRef] [PubMed]
- Simbolon, A.I.; Nadiya, U.; Rahmawati, A.; Amri, M.F.; Suhendra, M.A.; Putranto, P. Cognitive Load Assessment through Power Spectral Density in EEG. In Proceedings of the 2023 International Conference on Radar, Antenna, Microwave, Electronics, and Telecommunications (ICRAMET), Bandung, Indonesia, 15–16 November 2023; pp. 419–424. [Google Scholar] [CrossRef]
- Hsu, S.H.; Pion-Tonachini, L.; Palmer, J.; Miyakoshi, M.; Makeig, S.; Jung, T.P. Modeling brain dynamic state changes with adaptive mixture independent component analysis. NeuroImage 2018, 183, 47–61. [Google Scholar] [CrossRef] [PubMed]
- Sarailoo, R.; Latifzadeh, K.; Amiri, S.H.; Bosaghzadeh, A.; Ebrahimpour, R. Assessment of instantaneous cognitive load imposed by educational multimedia using electroencephalography signals. Front. Neurosci. 2022, 16, 744737. [Google Scholar] [CrossRef] [PubMed]
- Zamora-López, G.; Zhou, C.; Kurths, J. Exploring Brain Function from Anatomical Connectivity. Front. Neurosci. 2011, 5, 83. [Google Scholar] [CrossRef] [PubMed]
- Briels, C.T.; Schoonhoven, D.N.; Stam, C.J.; de Waal, H.; Scheltens, P.; Gouw, A.A. Reproducibility of EEG functional connectivity in Alzheimer’s disease. Alzheimer’s Res. Ther. 2020, 12, 68. [Google Scholar] [CrossRef] [PubMed]
- Talebi, N.; Nasrabadi, A.M.; Mohammad-Rezazadeh, I.; Coben, R. NCREANN: Nonlinear Causal Relationship Estimation by Artificial Neural Network; Applied for Autism Connectivity Study. IEEE Trans. Med. Imaging 2019, 38, 2883–2890. [Google Scholar] [CrossRef]
- Wei, H.T.; Francois-Nienaber, A.; Deschamps, T.; Bellana, B.; Hebscher, M.; Sivaratnam, G.; Zadeh, M.; Meltzer, J.A. Sensitivity of amplitude and phase based MEG measures of interhemispheric connectivity during unilateral finger movements. Neuroimage 2021, 242, 118457. [Google Scholar] [CrossRef]
- Sauseng, P.; Klimesch, W.; Schabus, M.; Doppelmayr, M. Fronto-parietal EEG coherence in theta and upper alpha reflect central executive functions of working memory. Int. J. Psychophysiol. 2005, 57, 97–103. [Google Scholar] [CrossRef]
- Lobier, M.; Siebenhühner, F.; Palva, S.; Palva, J.M. Phase transfer entropy: A novel phase-based measure for directed connectivity in networks coupled by oscillatory interactions. Neuroimage 2014, 85, 853–872. [Google Scholar] [CrossRef]
- Gangapuram, H.; Manian, V. A Sparse Multiclass Motor Imagery EEG Classification Using 1D-ConvResNet. Signals 2023, 4, 235–250. [Google Scholar] [CrossRef]
- Šverko, Z.; Vrankic, M.; Vlahinić, S.; Rogelj, P. Dynamic Connectivity Analysis Using Adaptive Window Size. Sensors 2022, 22, 5162. [Google Scholar] [CrossRef] [PubMed]
- Hutchison, R.M.; Womelsdorf, T.; Allen, E.A.; Bandettini, P.A.; Calhoun, V.D.; Corbetta, M.; Della Penna, S.; Duyn, J.H.; Glover, G.H.; Gonzalez-Castillo, J.; et al. Dynamic functional connectivity: Promise, issues, and interpretations. Neuroimage 2013, 80, 360–378. [Google Scholar] [CrossRef]
- Fan, L.; Su, J.; Qin, J.; Hu, D.; Shen, H. A Deep Network Model on Dynamic Functional Connectivity With Applications to Gender Classification and Intelligence Prediction. Front. Neurosci. 2020, 14, 570438. [Google Scholar] [CrossRef]
- Bakhshayesh, H.; Fitzgibbon, S.P.; Janani, A.S.; Grummett, T.S.; Pope, K.J. Detecting synchrony in EEG: A comparative study of functional connectivity measures. Comput. Biol. Med. 2019, 105, 1–15. [Google Scholar] [CrossRef]
- Gschwandtner, U.; Bogaarts, G.; Chaturvedi, M.; Hatz, F.; Meyer, A.; Fuhr, P.; Roth, V. Dynamic Functional Connectivity of EEG: From Identifying Fingerprints to Gender Differences to a General Blueprint for the Brain’s Functional Organization. Front. Neurosci. 2021, 15, 683633. [Google Scholar] [CrossRef] [PubMed]
- Yan, Y.; Ma, L.; Liu, Y.-S.; Ivanov, K.; Wang, J.-H.; Xiong, J.; Li, A.; He, Y.; Wang, L. Topological EEG-Based Functional Connectivity Analysis for Mental Workload State Recognition. IEEE Trans. Instrum. Meas. 2023, 72, 4005714. [Google Scholar] [CrossRef]
- Sridhar, S.; Manian, V. Eeg and deep learning based brain cognitive function classification. Computers 2020, 9, 104. [Google Scholar] [CrossRef]
- De Vico Fallani, F.; Richiardi, J.; Chavez, M.; Achard, S. Graph analysis of functional brain networks: Practical issues in translational neuroscience. Philos. Trans. R. Soc. B Biol. Sci. 2014, 369, 20130521. [Google Scholar] [CrossRef]
- Shan, X.; Huo, S.; Yang, L.; Cao, J.; Zou, J.; Chen, L.; Sarrigiannis, P.G.; Zhao, Y. A Revised Hilbert-Huang Transformation to Track Non-Stationary Association of Electroencephalography Signals. IEEE Trans. Neural Syst. Rehabil. Eng. 2021, 29, 841–851. [Google Scholar] [CrossRef] [PubMed]
- Ruiz-Gómez, S.J.; Gómez, C.; Poza, J.; Maturana-Candelas, A.; Rodríguez-González, V.; García, M.; Tola-Arribas, M.Á.; Cano, M.; Hornero, R. Analysis of Volume Conduction Effects on Different FunctionalConnectivity Metrics: Application to Alzheimer’s Disease EEG Signals. In Proceedings of the 2019 41st Annual International Conference of the IEEE Engineering in Medicine and Biology Society (EMBC), Berlin, Germany, 23–27 July 2019. [Google Scholar]
- Bastos, A.M.; Schoffelen, J.M. A tutorial review of functional connectivity analysis methods and their interpretational pitfalls. Front. Syst. Neurosci. 2016, 9, 175. [Google Scholar] [CrossRef] [PubMed]
- Baselice, F.; Sorriso, A.; Rucco, R.; Sorrentino, P. Phase Linearity Measurement: A Novel Index for Brain Functional Connectivity. IEEE Trans. Med. Imaging 2018, 38, 873–882. [Google Scholar] [CrossRef]
- Zyma, I.; Tukaev, S.; Seleznov, I.; Kiyono, K.; Popov, A.; Chernykh, M.; Shpenkov, O. Electroencephalograms during Mental Arithmetic Task Performance. Data 2019, 4, 14. [Google Scholar] [CrossRef]
- Noto, Y.; Sato, T.; Kudo, M.; Kurata, K.; Hirota, K. The relationship between salivary biomarkers and state-trait anxiety inventory score under mental arithmetic stress: A pilot study. Obstet. Anesth. Dig. 2005, 101, 1873–1876. [Google Scholar] [CrossRef] [PubMed]
- Xi, J.; Huang, X.L.; Dang, X.Y.; Ge, B.B.; Chen, Y.; Ge, Y. Classification for Memory Activities: Experiments and EEG Analysis Based on Networks Constructed via Phase-Locking Value. Comput. Math. Methods Med. 2022, 2022, 3878771. [Google Scholar] [CrossRef]
- Šverko, Z.; Vrankić, M.; Vlahinić, S.; Rogelj, P. Complex Pearson Correlation Coefficient for EEG Connectivity Analysis. Sensors 2022, 22, 1477. [Google Scholar] [CrossRef] [PubMed]
- Zhang, L.; Shi, B.; Cao, M.; Zhang, S.; Dai, Y.; Zhu, Y. Identifying EEG responses modulated by working memory loads from weighted phase lag index based functional connectivity microstates. In Proceedings of the Neural Information Processing: 26th International Conference, ICONIP 2019, Sydney, NSW, Australia, 12–15 December 2019; Volume 1142, pp. 441–449. [Google Scholar] [CrossRef]
- Scutari, M.; Graafland, C.E.; Gutiérrez, J.M. Who learns better Bayesian network structures: Accuracy and speed of structure learning algorithms. Int. J. Approx. Reason. 2019, 115, 235–253. [Google Scholar] [CrossRef]
- Sabzevari, Y.; Eslamian, S. Bayesian theory: Methods and applications. In Handbook of Hydroinformatics; Elsevier: Amsterdam, The Netherlands, 2023; pp. 57–68. [Google Scholar] [CrossRef]
- Yang, Y.; Gala, G.; Peharz, R. Bayesian Structure Scores for Probabilistic Circuits. In Proceedings of the International Conference on Artificial Intelligence and Statistics, Valencia, Spain, 25–27 April 2023. [Google Scholar]
- Fei, F.; Jie, B.; Zhang, D. Frequent and Discriminative Subnetwork Mining for Mild Cognitive Impairment Classification. Brain Connect. 2014, 4, 347. [Google Scholar] [CrossRef]
- Wang, Y.; Duan, W.; Dong, D.; Ding, L.; Lei, X. A test-retest resting, and cognitive state EEG dataset during multiple subject-driven states. Sci. Data 2022, 9, 566. [Google Scholar] [CrossRef]
- A Test-Retest Resting and Cognitive State EEG Dataset—OpenNeuro. Available online: https://openneuro.org/datasets/ds004148/versions/1.0.1 (accessed on 4 June 2022).
- Hassan, M.; Benquet, P.; Biraben, A.; Berrou, C.; Dufor, O.; Wendling, F. Dynamic reorganization of functional brain networks during picture naming. Cortex 2015, 73, 276–288. [Google Scholar] [CrossRef] [PubMed]
- HD-EEGtask (Dataset 2)—OpenNeuro. Available online: https://openneuro.org/datasets/ds003421/versions/1.0.2 (accessed on 22 March 2024).
- Liu, Q.; Liu, Y.; Chen, K.; Wang, L.; Li, Z.; Ai, Q.; Ma, L. Research on Channel Selection and Multi-Feature Fusion of EEG Signals for Mental Fatigue Detection. Entropy 2021, 23, 457. [Google Scholar] [CrossRef] [PubMed]
- Gupta, A.; Siddhad, G.; Pandey, V.; Roy, P.P.; Kim, B.G. Subject-Specific Cognitive Workload Classification Using EEG-Based Functional Connectivity and Deep Learning. Sensors 2021, 21, 6710. [Google Scholar] [CrossRef] [PubMed]
- Karnan, H.; Maheswari, D.U.; Priyadharshini, D.; Laushya, S.; Thivyaprakas, T.K. Cognizance detection during mental arithmetic task using statistical approach. Comput. Methods Biomech. Biomed. Eng. 2023, 1–14. [Google Scholar] [CrossRef]
- Nirde, K.; Gunda, M.; Manthalkar, R.; Gajre, S. EEG mental arithmetic task levels classification using machine learning and deep learning algorithms. In Proceedings of the 2023 3rd International Conference on Artificial Intelligence and Signal Processing, AISP 2023, Vijayawada, India, 18–20 March 2023. [Google Scholar] [CrossRef]
- Samal, P.; Hashmi, M.F. EEG based mental task classification using arithmetic operations. In Proceedings of the 2022 IEEE International Symposium on Smart Electronic Systems (iSES), Warangal, India, 18–22 December 2022; pp. 516–519. [Google Scholar] [CrossRef]
- Islam, A.; Sarkar, A.K.; Ghosh, T. EEG signal classification for mental stress during arithmetic task using wavelet transformation and statistical features. In Proceedings of the 2021 International Conference on Automation, Control and Mechatronics for Industry 4.0 (ACMI), Rajshahi, Bangladesh, 8–9 July 2021. [Google Scholar] [CrossRef]
- Ahammed, K.; Ahmed, M.U. Quantification of Mental Stress Using Complexity Analysis of Eeg Signals. Biomed. Eng. Appl. Basis Commun. 2020, 32, 2050011. [Google Scholar] [CrossRef]
- Ramaswamy, A.; Bal, A.; Das, A.; Gubbi, J.; Muralidharan, K.; Ramakrishnan, R.K.; Pal, A.; Balamuralidhar, P. Single feature spatio-temporal architecture for EEG Based cognitive load assessment. In Proceedings of the 2021 43rd Annual International Conference of the IEEE Engineering in Medicine & Biology Society (EMBC), Guadalajara, Mexico, 1–5 November 2021; pp. 3717–3720. [Google Scholar] [CrossRef]
- Dattola, S.; Bonanno, L.; Ielo, A.; Quercia, A.; Quartarone, A.; La Foresta, F. Brain Active Areas Associated with a Mental Arithmetic Task: An eLORETA Study. Bioengineering 2023, 10, 1388. [Google Scholar] [CrossRef]
- Maghsoudi, A.; Shalbaf, A. Mental Arithmetic Task Recognition Using Effective Connectivity and Hierarchical Feature Selection From EEG Signals. Basic Clin. Neurosci. 2021, 12, 817–826. [Google Scholar] [CrossRef] [PubMed]
- Wang, Q.; Sourina, O. Real-time mental arithmetic task recognition from EEG signals. IEEE Trans. Neural Syst. Rehabil. Eng. 2013, 21, 225–232. [Google Scholar] [CrossRef]
- Ismail, L.E.; Karwowski, W. A Graph Theory-Based Modeling of Functional Brain Connectivity Based on EEG: A Systematic Review in the Context of Neuroergonomics. IEEE Access 2020, 8, 155103–155135. [Google Scholar] [CrossRef]
Disclaimer/Publisher’s Note: The statements, opinions and data contained in all publications are solely those of the individual author(s) and contributor(s) and not of MDPI and/or the editor(s). MDPI and/or the editor(s) disclaim responsibility for any injury to people or property resulting from any ideas, methods, instructions or products referred to in the content. |
© 2024 by the authors. Licensee MDPI, Basel, Switzerland. This article is an open access article distributed under the terms and conditions of the Creative Commons Attribution (CC BY) license (https://creativecommons.org/licenses/by/4.0/).