1. Introduction
Assistive technologies (ATs) are used all around the world by people living with all kinds of disabilities. For instance, the use of a robotic arm has been shown to help people living with upper limb disabilities with their daily tasks [
1]. Another study on exoskeletons proved they have good potential for functional mobility in people with spinal cord injury [
2]. While the emphasis is often put on the assistive device itself, such systems actually include three important parts: the user, the control interface, and the device (e.g., robotic arm and exoskeleton). In fact, this is the case for any human–machine interaction and more often than not, the interface, which links the device to the user, seems to be the key element in the system [
3,
4,
5]. So, when it comes to design, it is worth spending time on developing a valuable interface, especially with ATs, on which the ability of a user to be independent in his or her daily living task may heavily rely on it. Besides, because of the specific abilities and needs being very unique, even for the same diagnosis, the control interface needs to be either tailor-made or flexible and adaptable.
Control interfaces are built using various sensors that may be combined with intelligent algorithms. Recently, many interfaces using different technologies have emerged, and they are yet being improved. The simplest interfaces like sip-and-puff or tongue control [
6,
7] are widely used in practice, due to the absence of complexity in their implementation and usage. Another popular instance is voice control. It has been shown that commercial voice assistants can help people in their daily tasks by providing functionalities to interact with their phone [
8], handle lights, or simply play music [
3]. Voice assistants often require an internet connection, but lighter versions can also be implemented offline [
9]. Other options include electromyography (EMG) interfaces [
10,
11,
12], which use electrical activity in muscles as input signals and control via inertial measurement units (IMUs) [
13,
14], which combine accelerometer and gyroscope signals. For instance, IMUs or EMGs can be positioned on a limb that a user can move easily (like the head, arms, or legs) and act as an input mechanism to control a robotic arm or the mouse of a computer.
One major and obvious issue to address with almost any interface–AT pair is that many interfaces have limited actual physical commands to efficiently control all of the functions of their corresponding AT. Indeed, controlling a high-dimensionality device with a low-dimensionality sensor (around which the interface is built) can be quite challenging. The dimensionality of components in this context can be interpreted as qualitative metrics to compare the work space of those components, in terms of degrees of freedom (DoF), number of functions, or some other physical restrictions, such as the number of actions a user can perform according to his or her abilities or the number of controls available. For instance, whereas a six-DoF assistive robotic arm may need 20 commands to operate (e.g., forward, backward, up, down, left, fingers, options, etc.), a computer may need 10 (mouse left, right, up, down, left click, right click, copy, paste, etc.). However, in both cases, the dimensionality of the control interface depends more on the abilities of the users (the actions they can perform and their reach). Therefore, many users only have access to basic devices, such as switches, to control the AT.
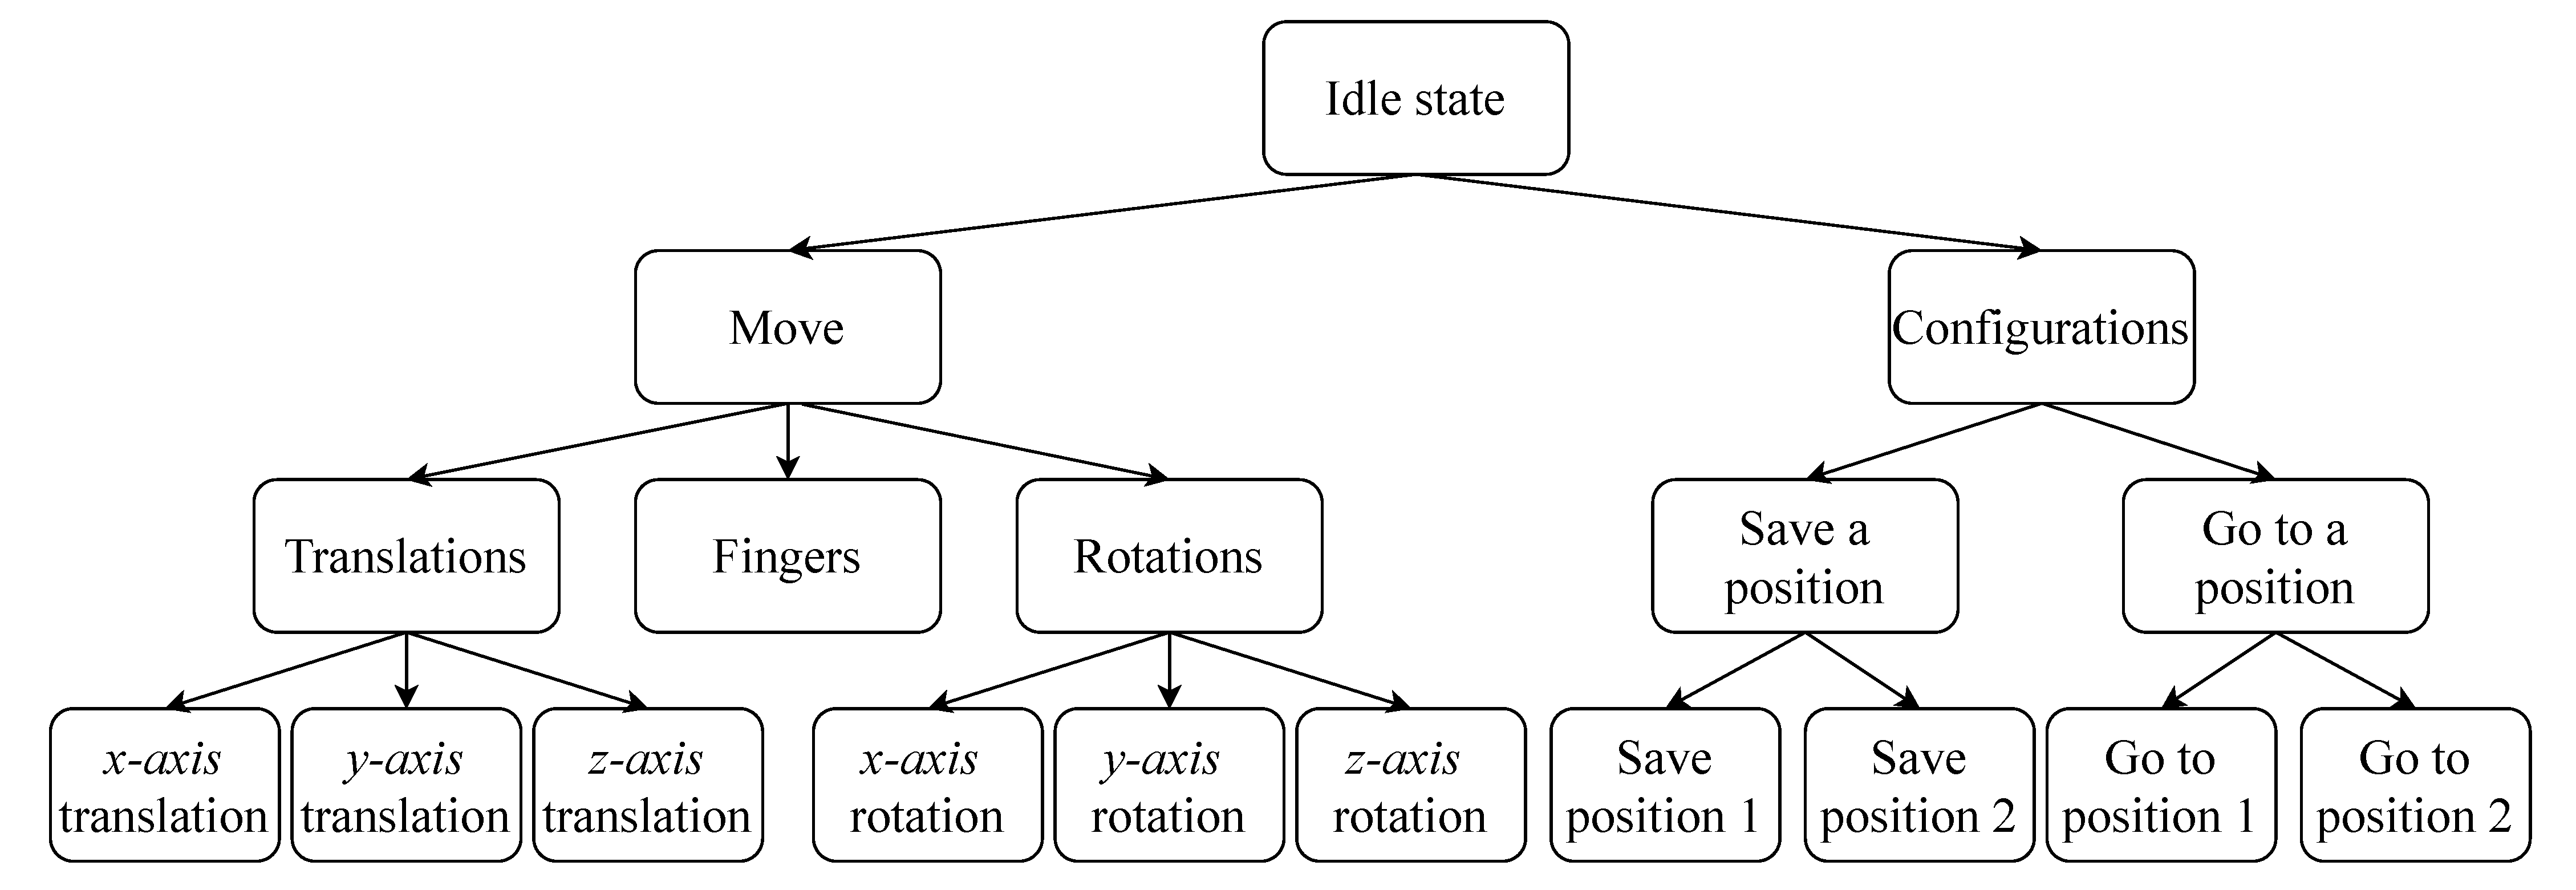
In any case, a common way to deal with the interface’s lower dimensionality is often to arrange the AT’s modes in sub-control groups. As shown in
Figure 1, with this approach, accessing a mode can require a series of actions to browse through the nested groups [
1,
15,
16]. Thus, a strategy needs to be implemented within the interface to either reduce the total number of modes, facilitate switching between them, or somehow artificially augment the dimensionality of the interface itself.
The easiest and most flexible strategy to employ is to use a scanning menu panel [
17,
18]. It can be implemented with or without a sub-groups architecture (as in
Figure 1) by granting the user direct access to the modes. This may be used with a single switch interface and can accommodate virtually any number of modes. It also gives the developer the possibility to rearrange the modes in any architecture (number of sub-groups, number of modes by sub-group, height of the nested architecture, etc.). At each level, the modes are proposed to the user, one-by-one, and the user activates the switch when the mode they want is proposed. Although this strategy is quite robust (due to its simplicity) and, thus, commonly found in practice [
19], it is time consuming and does not lead to a satisfactory user experience [
15]. In the past few years, many attempts (many of them successful) have been made to try to do better. Among them, general ideas emerged, such as level coding [
11], dynamic switching, and even automatic mode switching. Level coding can work well with analog sensors by dividing the range of the signals into multiple sub-ranges bounded by thresholds. Hence, what seemed to be a one-dimension interface (e.g., an ON/OFF switch) actually had a higher dimensionality (e.g., sensing the pressure on the switch). The thresholds can also be applied on the time axis (e.g., short click and long click). Of course, the divisibility of the signal’s magnitude depends on the user’s dexterity and the sensor. Dynamic switching, on the other hand, integrates machine learning models to predict or suggest the next move to the user [
20]. So, when it comes the time to select a mode, this algorithm might suggest one of a few modes that the user is likely to select, according to his habits. Much like the auto-completion suggestions on a smartphone keyboard, this can save the user a lot of time. On the other hand, training a classifier may require much data, and, in the case of rehabilitation technology, this can be difficult. Indeed, to deploy such an interface, the users cannot be asked to build a large training dataset themselves. Thus, the development team should have access to such a dataset and make sure that the data reflects real-life situations (e.g., noise and imperfect inputs), which might prove difficult. Finally, another strategy is to focus on a complete trajectory to execute an action (e.g., pour a glass of water with a robotic arm). In this case, the algorithm is based on graph theory, rather than machine learning [
4,
21]. The aim is to find optimal trajectories for a given action using graph search algorithms, such as Dijkstra’s algorithm. This paradigm is robust for specific actions in closed environments, but the resulting interfaces may lack flexibility when it comes to real-life scenarios.
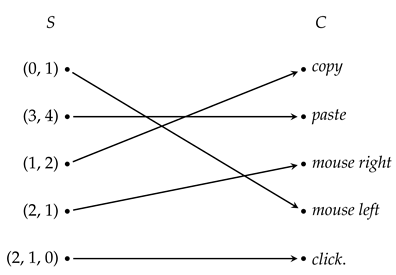
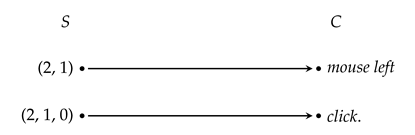
Recently, ref. [
18] proposed a novel approach to deal with low-dimensionality interfaces with a sequence matching algorithm (SMA). The idea is to arrange simple signals received from digital sensors (e.g., ON/OFF switch) into a time sequence similar to Morse code. The algorithm takes advantage of simple devices, such as switches, which are already vastly used by people living with disabilities but to artificially increase the number of output states it can generate. While a single switch can only output two states (0 or 1), a switch with SMA can generate many outputs (e.g., more than 30, with three distinct states: 0, 1, and holding 1), which enables the user to express more commands rapidly with a single switch. Instead of grouping the modes, a unique sequence is inputted by the user. Each sequence is mapped to a command (mode) of the AT (e.g., forward). This algorithm was applied to a sip-and-puff interface to control a robotic arm and has proven to be effective for augmenting the dimensionality of currently used basic interfaces, thus enhancing the user’s control over the assistive device [
18].
The objective of this paper is to build on the SMA in [
18] by adapting the algorithm to analog signals, rather than digital signals, to further increase the output dimensionality and enable the use of analog sensors to lead to more intuitive interfaces. The proof of concept consists in the development, design, and implementation of an intuitive and robust IMU-based hand gesture interface to control any assistive technology (e.g., robotic arm, mouse, and keyboard). To that effect, a classification pipeline has been developed to detect and recognize hand gestures from IMU signals. This pipeline was then embedded into the SMA. With that system, we aim to answer the previously stated issue of the dimensionality difference between the interface and the assistive technology without relying on grouping the different modes, but rather by artificially augmenting the dimensionality of the interface itself. The goal is to help people living with upper or lower body incapacities in their daily life tasks.
This novel approach combines several key concepts of the multiple interface design paradigm (previously presented). First, the usage of wearable sensors, such as IMU and EMG, offers a high level of flexibility for the user, since they can be fixed on various body parts. Furthermore, in most cases, they are not cumbersome for the user. Then, the scanning menu panel strategy is intuitive and simple to use. The idea to have a display showing the modes to help the user navigate through them is effective but not necessarily fast. The SMA can then help speed up the usage. This work aims to show that combining those ideas adds value to the user experience and can definitely help some people.
This paper is structured as follows. First, the methods for the development are presented in
Section 2,
Section 3 and
Section 4. This includes the development of an offline version of the algorithm, followed by a real-time version and, finally, the integration of the latter to the SMA. The experimental methods are presented in
Section 5 and
Section 6, with the description of the actual implementation of the interface and the experiments performed with it. Finally, the results are presented and discussed in
Section 7.
2. Hand Gesture Recognition
The process of classifying hand gestures can be done with a trained machine learning model (classifier). Since artificial intelligence is now a blooming field of computer science and robotics, some classifiers have proven effective for specific applications. In the case of accelerometer and gyroscope signals for gesture recognition, the complexity of the models can go from a linear discriminant analysis (LDA) [
12,
22] to a convolution neural network (CNN) [
23].
Many case studies for the gesture-recognition problem combine surface EMG sensors with IMUs. In [
24], LDA is proven to be accurate enough to classify signals from a wrist-worn sensor device. A smartwatch could eventually house the sensors and the lightweight classifier and be very convenient for the user. In [
25], an SVM-based recognition system is used and applied for rehabilitation purposes. Other simple, yet effective, classification models (such as Bayesian models) can also be used [
26]. However, in the framework of this project, we aim to make use of only one IMU and focus on gestures that will take advantage of the accelerometers, such as tapping on a hard surface or making a circle in the air, rather than doing hand signs. Dynamic time warping is well-known and often used with IMUs to classify hand gestures [
27,
28,
29], but may not be suitable for a real-time application, as it may not be fast enough [
30].
Since the interface targets to users living with various incapacities, the classification models have to be fitted on each user’s sample data individually. Therefore, the training dataset has to be small. Consequently, we will focus on simpler algorithms, which are fast, robust, and usable on an embedded system. Other than LDA, options considered were support vector machines (SVM) [
25], adaptive boosting (AdaBoost) [
31], and
k-nearest neighbors (kNN) [
32].
The objective of this section is to propose an encapsulated procedure that takes a signal as an input and returns a predicted gesture. In the particular case of the experiments in this paper, the signals are received from an IMU, and the hand gestures will serve as individual actions to the SMA. This section presents the first of a twofold development. The first part is the offline development and the second part is the online implementation. For the offline development, the dataset is composed of 475 examples of 5 different gestures, recorded at 100 Hz for 0.9 s, from a single individual.
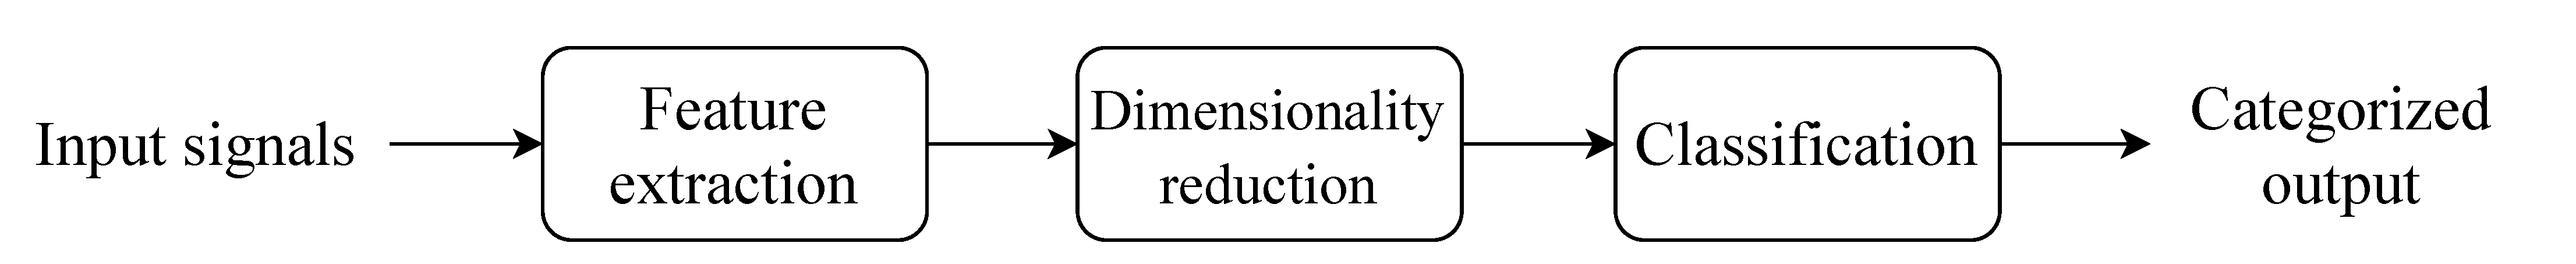
The classification pipeline includes multiple nodes. As seen in
Figure 2, features are extracted from an input signal. Then, the classification model must determine which class (gesture) those features are most likely to represent. Since it is established that the training dataset will have more dimensions than training examples, the dimensionality of the data (i.e., the number of features) must be reduced before they are presented to the classifier. The model has to be fast (during evaluation), lightweight (for an implementation on an embedded system), and robust, even with a very small training dataset. The next subsections bring details on the development process and the final pipeline.
2.1. Input Signals
In the experiments, the algorithm’s inputs were obtained through an IMU and consisted of a first-order, low-pass filtered version of the acceleration norm () and angular velocity norm ().
For the offline development of the classifier, five distinct hand gestures were studied:
hand tap (on a table),
thumb tap (on a table),
hand tilt,
swipe left and
swipe right. The signals were chosen because they include completely distinct pairs (e.g.,
hand tap and
hand tilt), as well as similar signals (e.g.,
swipe left, and
swipe right), that a simple conditional statement cannot classify. Additionally, five gestures are enough for up to 30 commands to be mapped to an AT’s modes (with sequences of one or two gestures). This is explained in detail in
Section 4.
The training set consists of 5 examples per class (25 examples total). The remaining of the balanced 475-example dataset will be used to tune the models and evaluate the performance.
2.2. Feature Extraction
The examples in the dataset are a time series. From those time series’ data, various metrics were computed to “describe” their nature to the statistical model. This process is known as
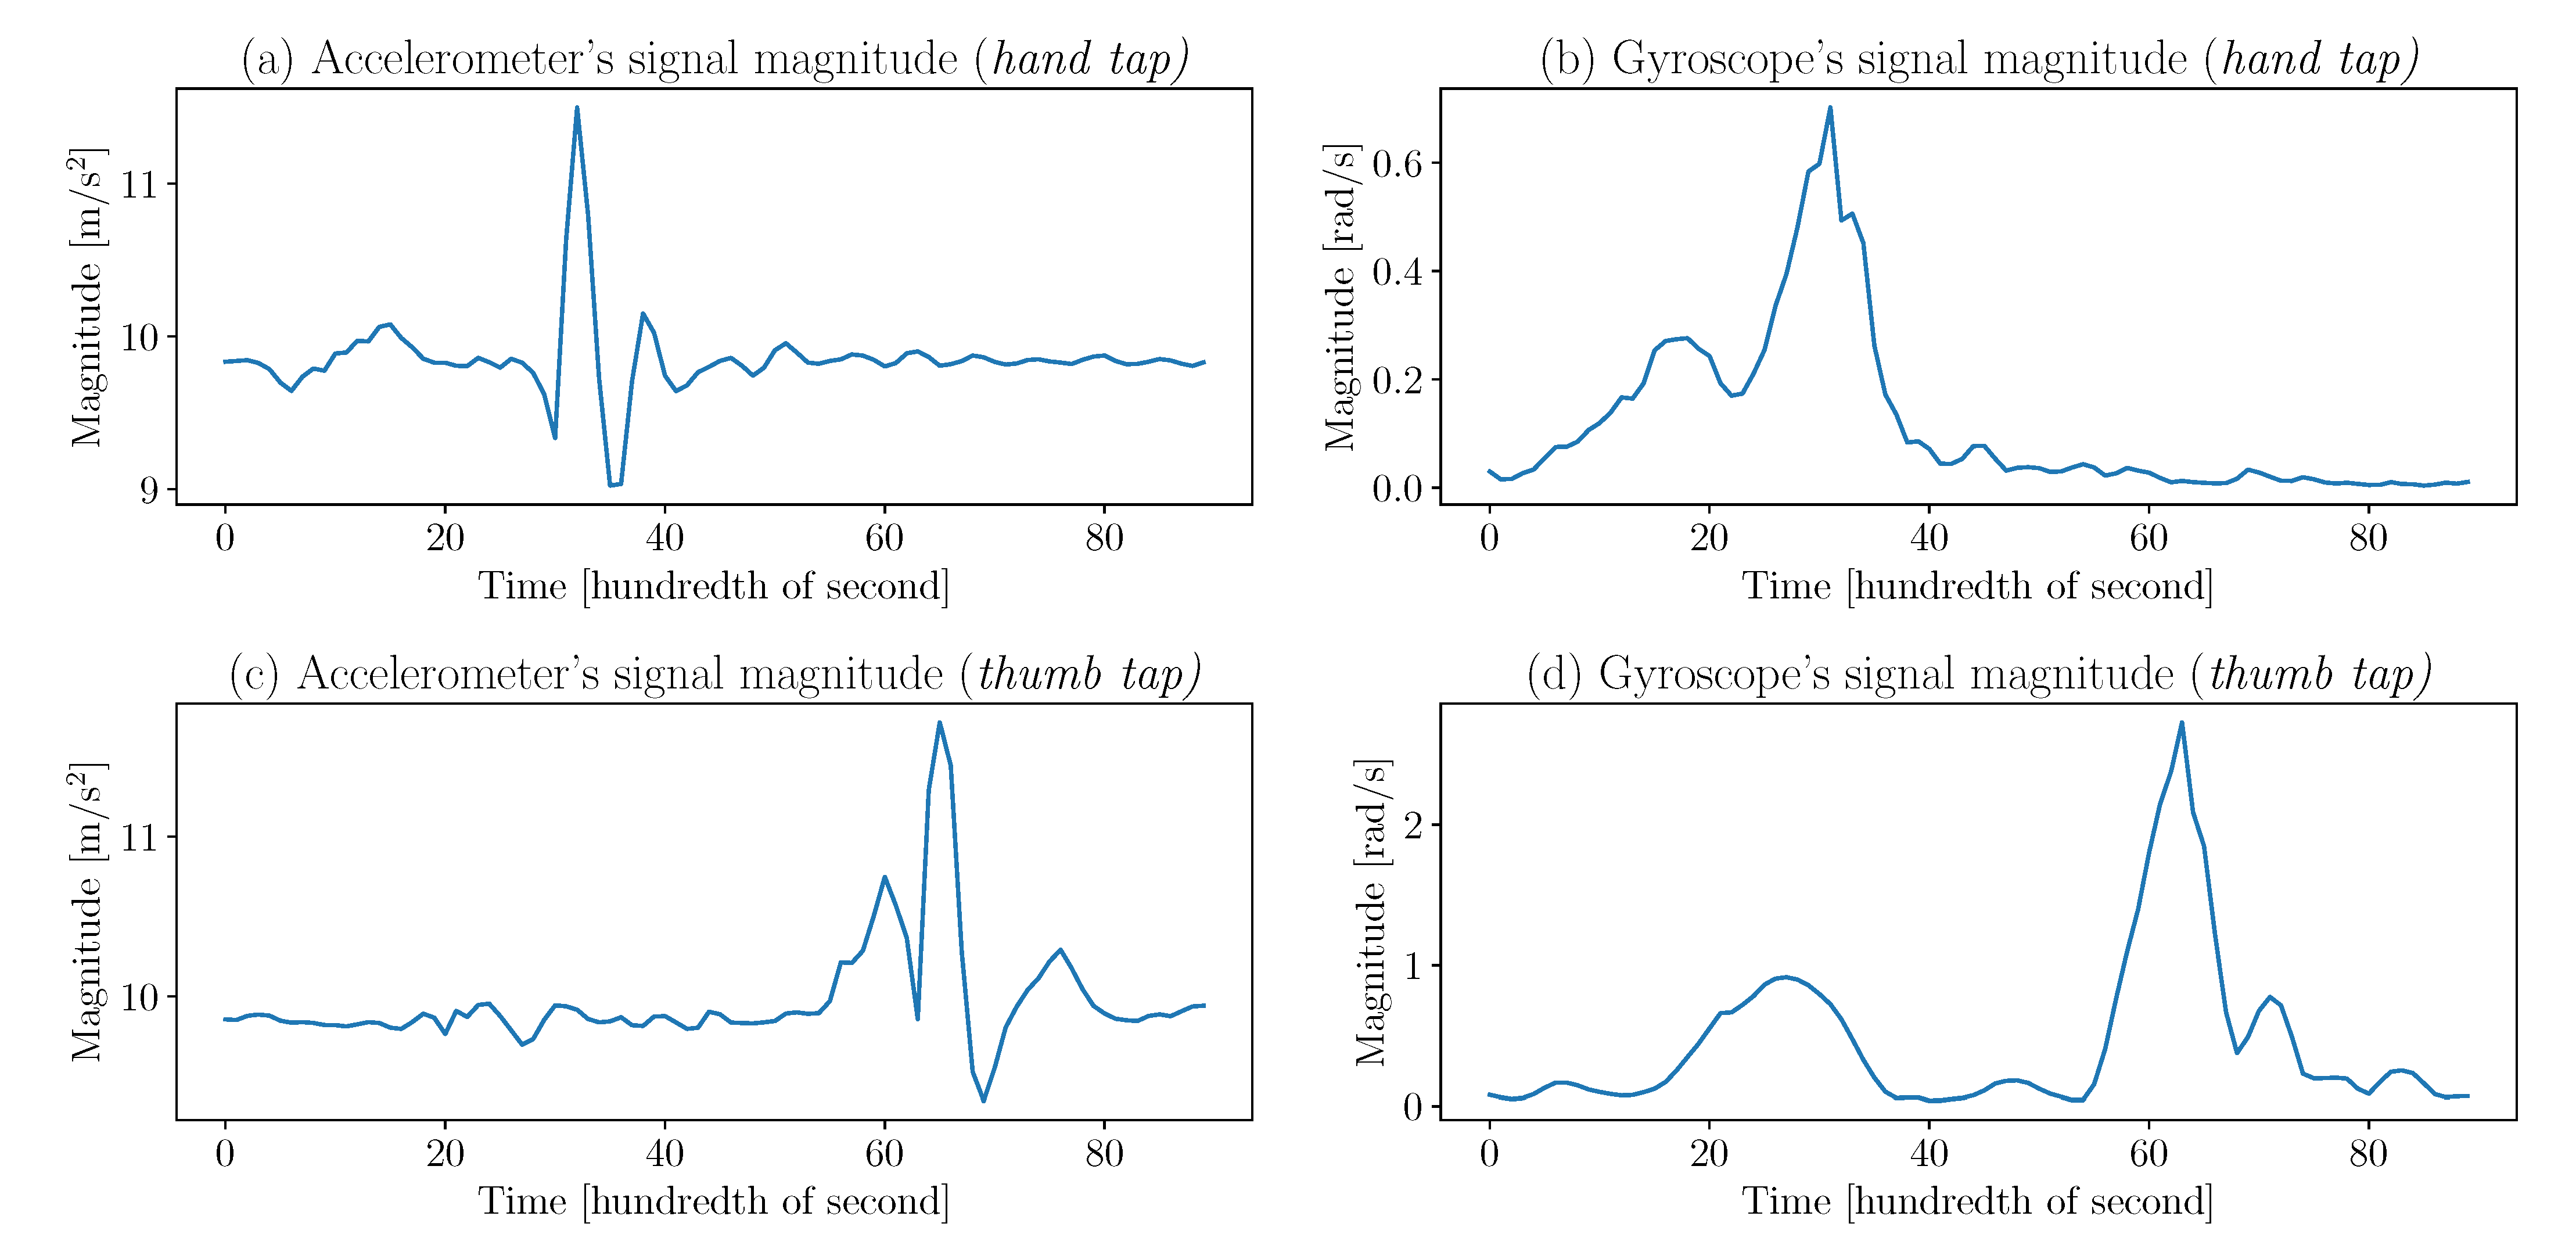
feature extraction. Identifying what features to extract from a signal first requires having a general idea of what it looks like. From
Figure 3, it is possible to infer that the means, medians, standard deviations, interquartile range, area under the curve, kurtosis, minima and maxima of accelerations, and angular velocities are simple, yet useful, metrics that allow the classification of gestures. Those metrics can be computed for the entire signal but also for parts of it. Indeed, in the
Figure 3 gyroscope signals, the two main peaks have a different time lapse between them; so by dividing the signals into two equal parts, the peaks will be distinctly distributed among the parts. Thus, the previously stated metrics applied to the signal’s parts are distinct and offer valuable information to the classifier. It is determined empirically that dividing the signals into four parts offers the best results.
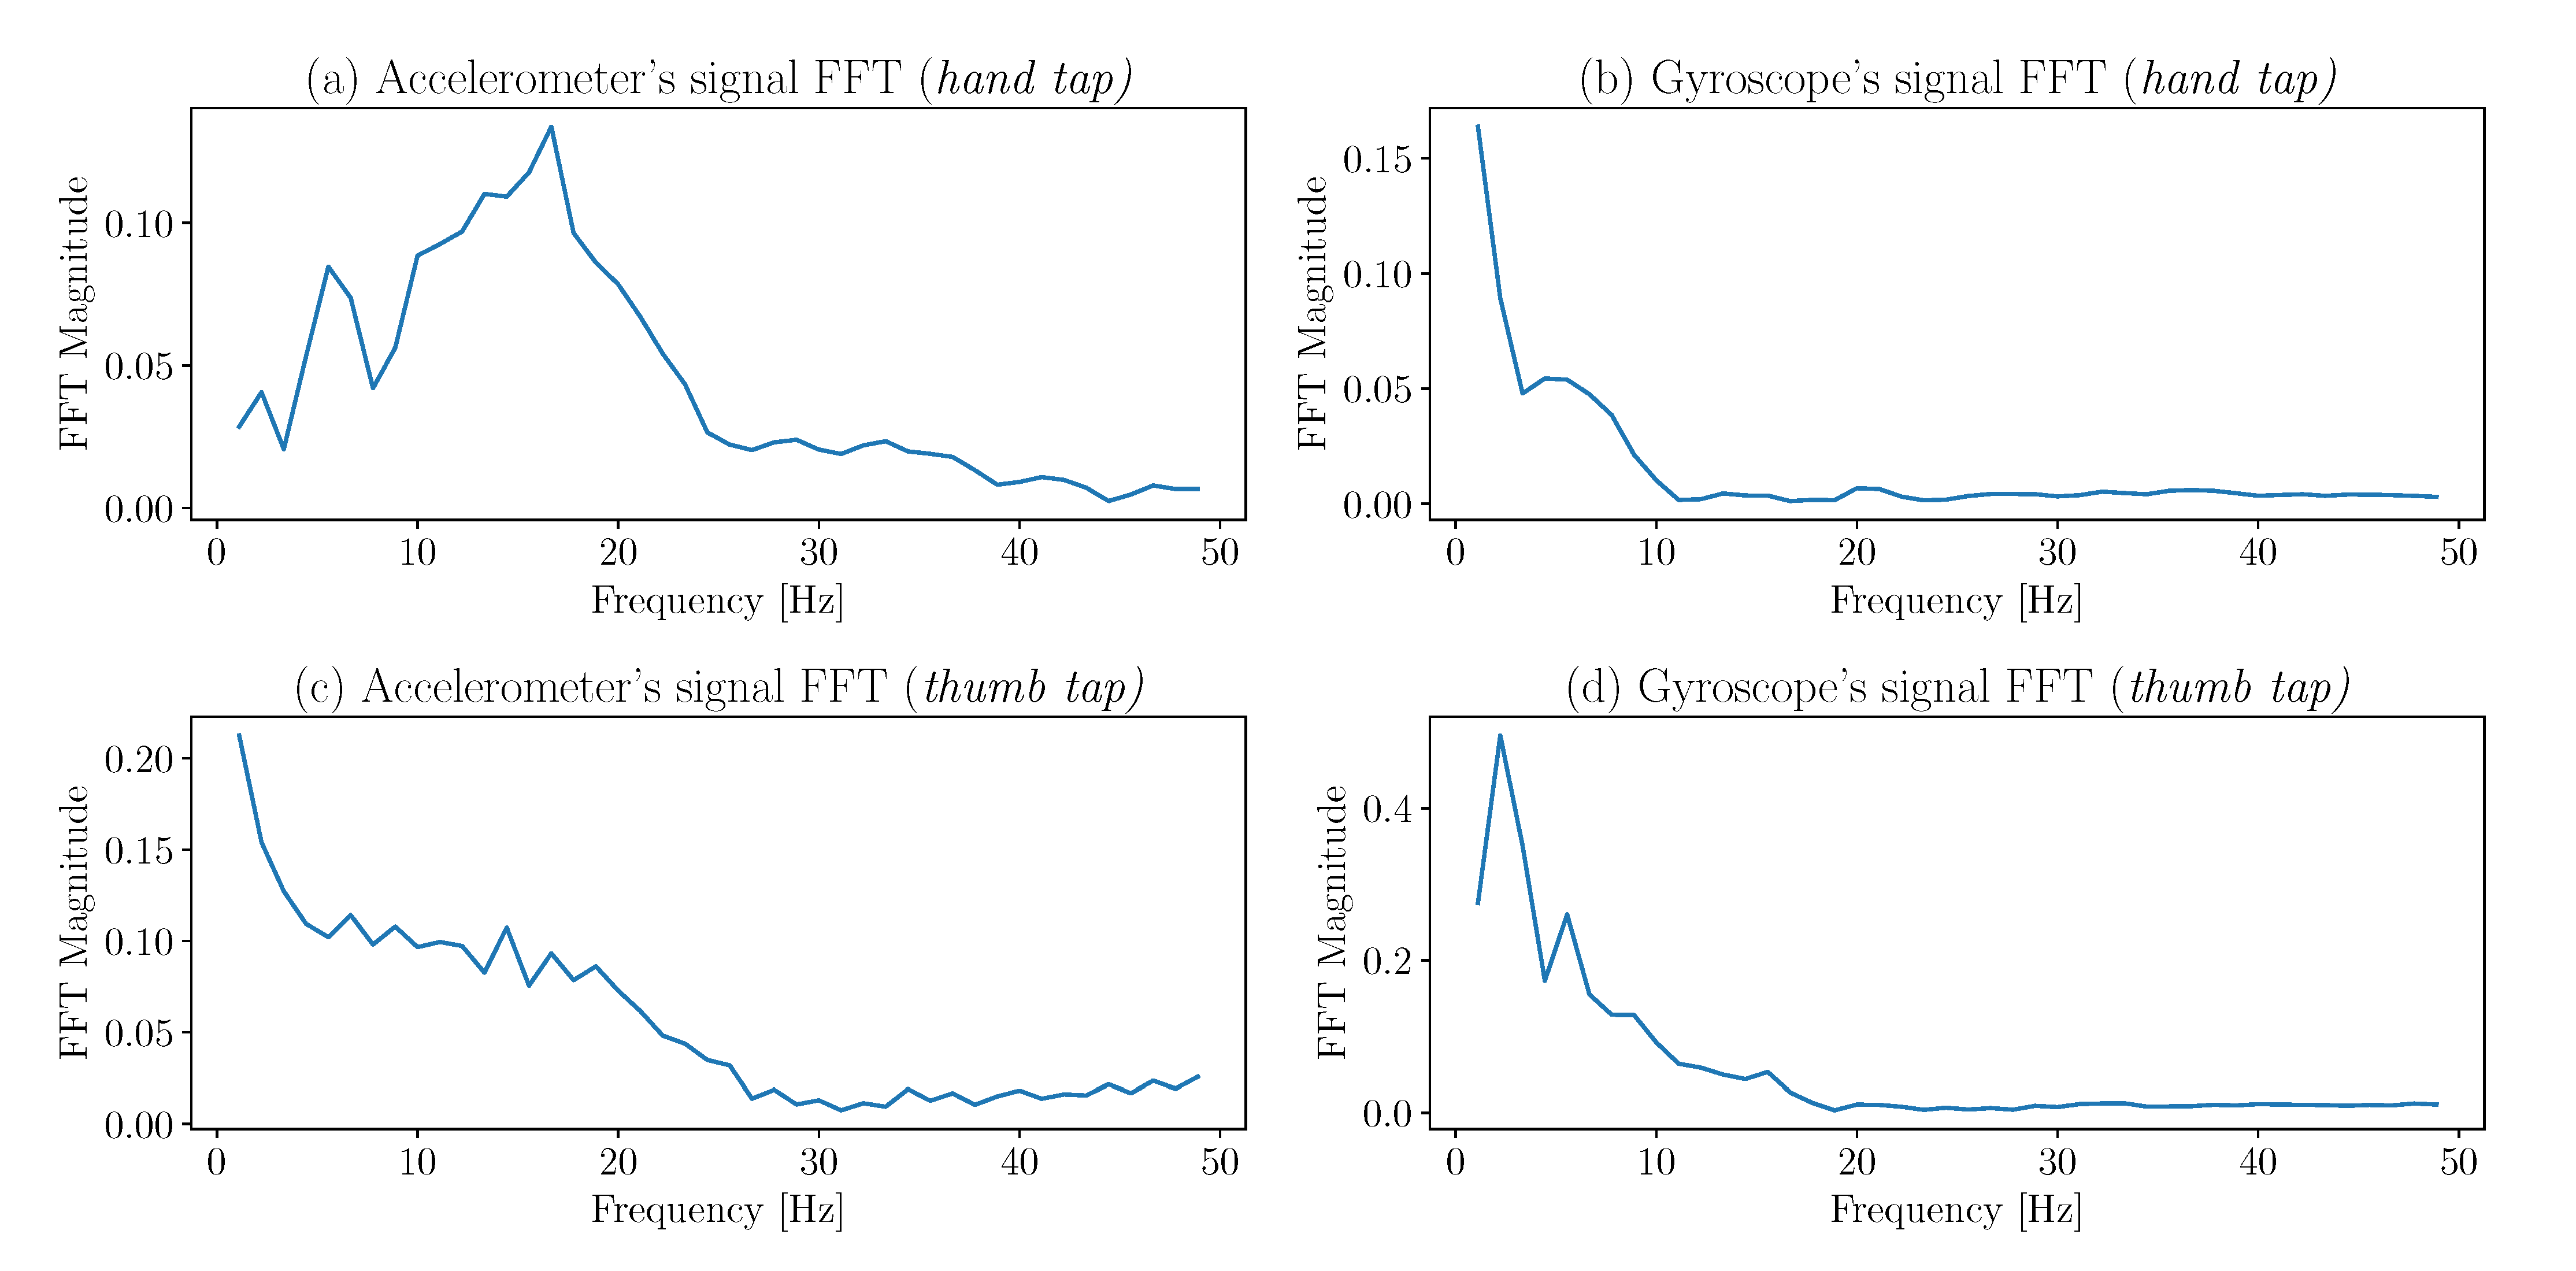
In addition to the metrics in the time domain, others can be extracted from the frequency domain.
Figure 4 shows a fast, Fourier transform of the
Figure 3 time signals. Even though those curves are not the clearest (due to the 100 Hz sample rate), they still offer clear patterns, and the median, maxima, and energy values of the FFTs are valuable for the classifier.
The final metrics extracted from the signals are the coefficients of a third-order, autoregressive model [
33,
34] and the correlation coefficients between the accelerometer and gyroscope signals. Finally, a total of 81 features were extracted, and all of them are scaled in a
range. A summary of all the features extracted is presented in
Table 1.
2.3. Dimensionality Reduction
Let
X be the
n by
d matrix containing all the feature data extracted from the train set, where
n is the sample size (the number of examples) and
d is the dimension (the number of features):
We have:
since
, the columns of
X (the variables for each example) are linearly dependent. This means that
X contains redundant information and unnecessarily increases the dimensionality
d of the dataset. So, most of the dimensions are not needed to describe the dataset. Furthermore,
n is typically small, so the dimensionality must be reduced to avoid issues related to the curse of dimensionality [
35] and maintain the robustness of the system. In order to do so, possible approaches include to either select the most significant features or to compute new features, via the linear projection of
to
, with
, the dimension of the new space. Here, the latter has been employed. The principal component analysis (PCA) offers a deterministic method to compute projected features from
X in a lower-dimension space. The PCA allows reducing
d to
, while keeping most of the significant information. This fact is illustrated in
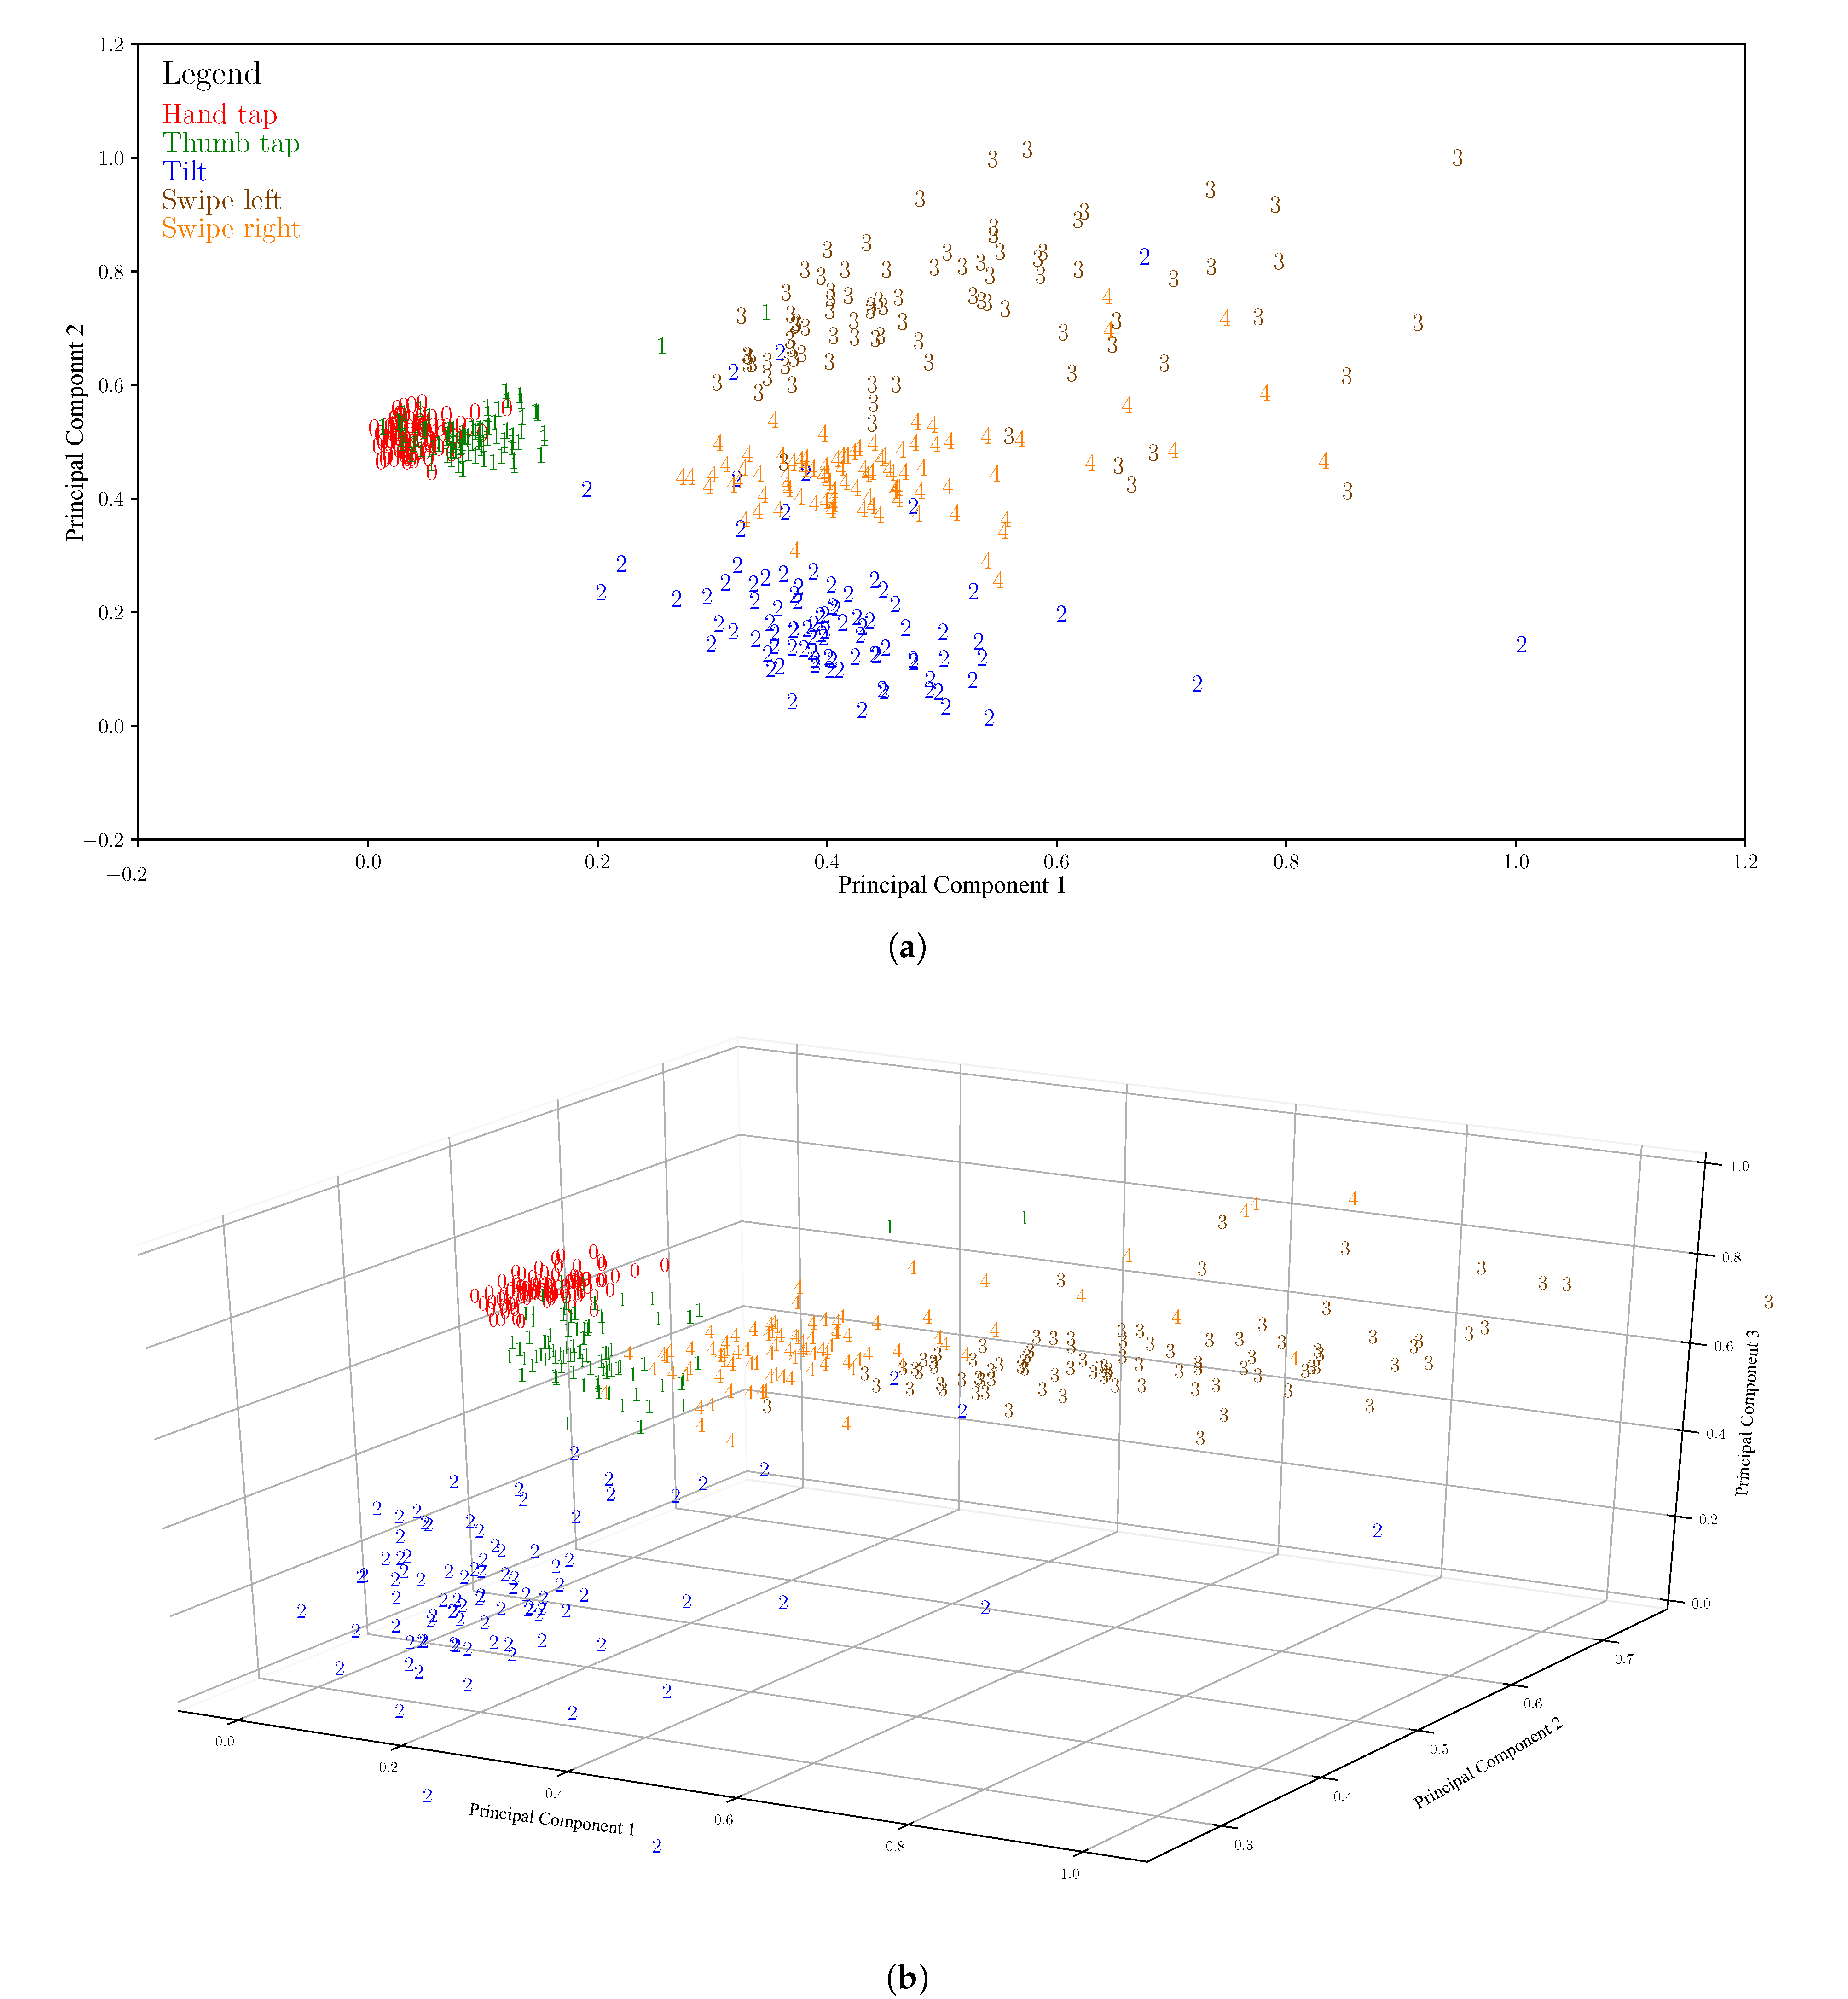
Figure 5. The graphs on the figure are obtained by first applying the PCA to the training set (25 data points, perfectly balanced in five classes). This computes the transformation to apply to what is left of the dataset (the validation set, 450 data points). Thus, the figure shows the distribution of the validation set in the two- and three-dimensional spaces, after the transformation is applied. It is possible to observe that, even with
or
, and with the transformation computed on a very small dataset, the classes are still almost linearly separable, making it clear that most of the relevant information is still present in
. In order to implement the PCA, the target dimension must not be more than
n. In the context of this application,
has been used.
2.4. Classification
The selection of the classification model is the part of the design, where the principal design requirements (fast, lightweight, and robust, with fewer examples) should really be taken into consideration. For the development, and in the framework of this paper,
scikit-learn [
36] was used.
In recent years, deep learning algorithms have received a lot of attention. However, one caveat is in order: they require vast amount of data. In our case, the fact that the quantity of data required to train such an algorithm is limited rules them out, due to the specificity of the applications. Therefore, the selection process focuses on more classic machine learning algorithms.
The studied models for this project are listed in
Table 2, along with their advantages, specific to the design requirements.
In order to test each model (and to optimize them at the same time), the selection process consisted of a grid search with random data selection. Each model was tested on a dataset of 475 data points (95 per class, 5 classes) on
iterations. The models were tested by first tuning their hyper-parameters and then retaining their best performance. For each model, a set of hyper-parameters was determined with a testing range associated with each one. At each iteration (
), five data points of every class were selected (total of 25) to form the training set, and the remaining data constitutes the validation set (450 data points). Each model was trained with this training set and tested with the validation set once for every possible arrangement of hyper-parameters. After the
iterations, the performances were analyzed and the best model with the best arrangement of hyper-parameters was retained. Having the size of the validation test far greater than the size of the training set allows for evaluating how the algorithm succeeds in generalizing and does not overfit on the small set of data it has been given.
Table 3 presents the selected hyper-parameters for each model, the best configuration, and the best prediction score of the models associated with those configurations for
.
The final choice for the prediction model is an SVM with a linear kernel. The satisfactory performance of the linear SVM implies that the data are almost linearly separable in the
dimensions space, even if similar gestures were chosen. This means that it should not be difficult to choose new gestures to add to the system.
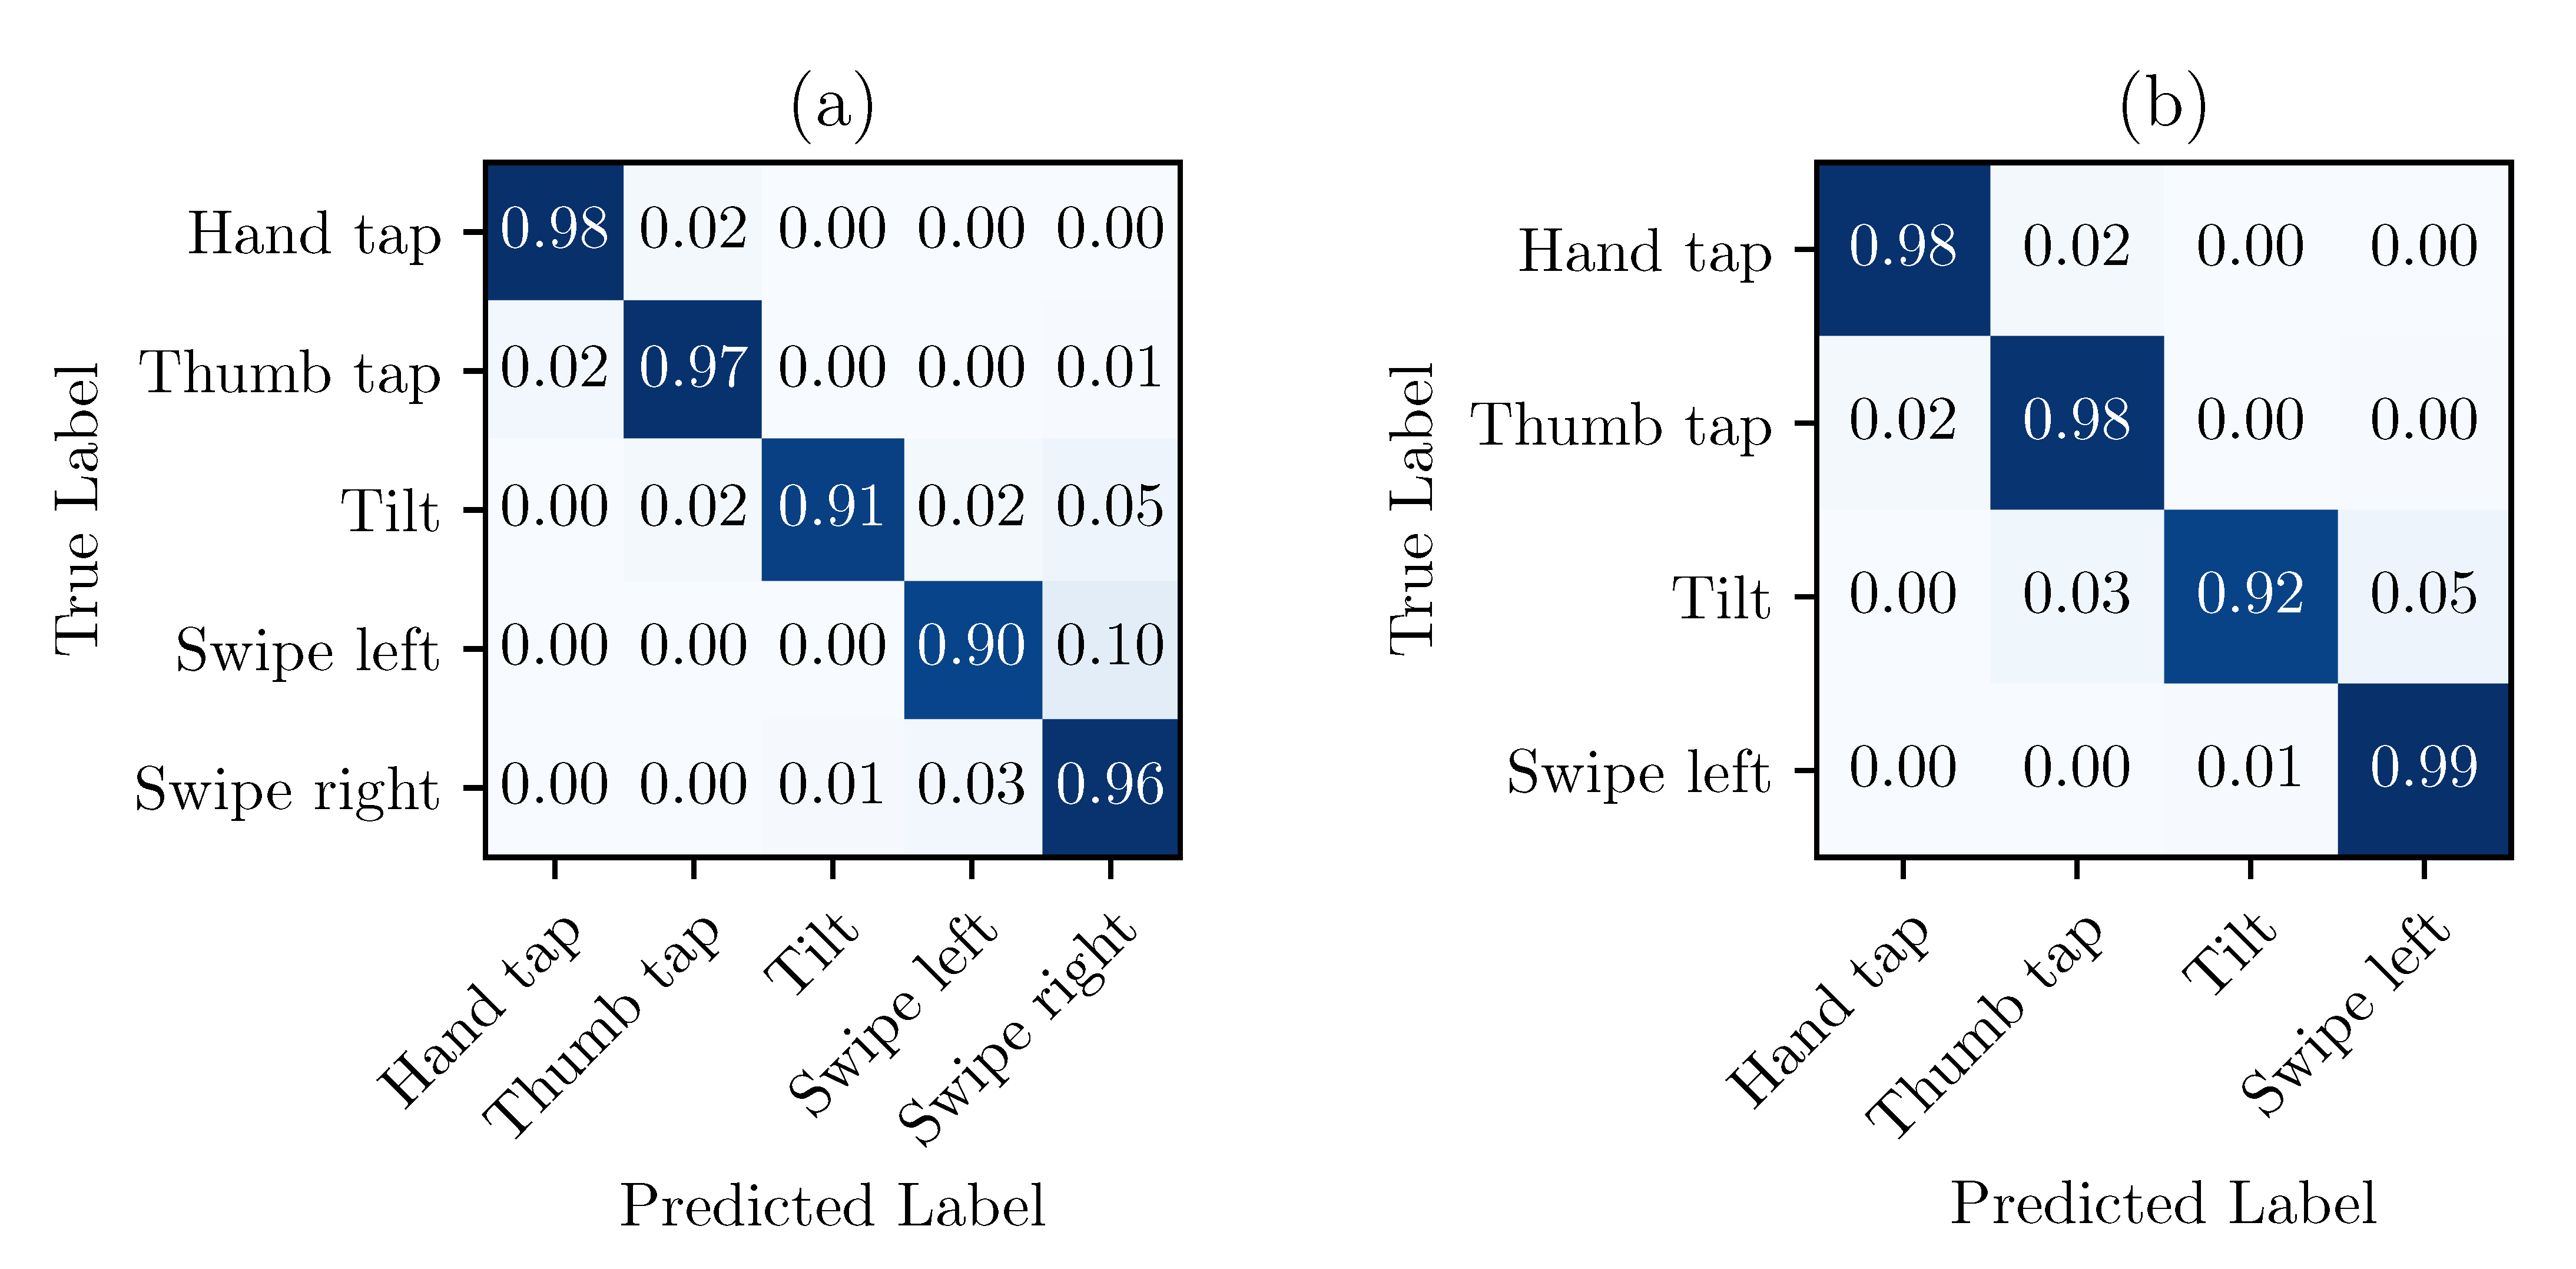
Figure 6a shows the normalized confusion matrices for the optimized SVM, with the dataset previously described.
Such matrices were obtained by choosing a training set at random (composed of 5 data points per class), similar to the optimization process, and by validating with the remaining 450 data points. This process was repeated 50 times. Finally, the results were inputted into the confusion matrix and normalized by row. Since most of the confusion results from the
Swipe-left and
Swipe-right gestures, it was possible to improve the performance of the system by simply removing the gestures that were too similar (and possibly adding some others). The result of this operation is shown in the matrix (b) of
Figure 6. Referring to
Section 4.1, four different gestures, with three gestures per sequence, allows 84 possible sequences, which is fairly sufficient to control an assistive technology.
This process simulates the workflow of a single user. The small random sample, acting as a training set at each iteration, represents the data points of the user. What is left of the dataset represents the gestures that the user will perform while using the system. Some overfitting is expected, but since all of the data are specific to one user, it does not affect the results negatively. The multiple iterations allows to validate the results and to ensure some randomness.
2.5. Final Pipeline
The final classification pipeline is the prediction system that takes IMU signals as inputs and returns predicted gestures. This section establishes its components.
Figure 7 shows the explicit diagram of the classification process.
3. Real-Time Classification
The previous section proposed an offline machine learning model to recognize hand gestures from small fixed windows of IMU signals. To embed the
Figure 7, the classification pipeline in a real-time application, it first needs to be combined with an algorithm that will trigger the classification process. There are (at least) two options to do that. The first option is to have a fixed-size sliding window and repeated classification routines at short, fixed intervals in this window. When tested, this method performed weakly (for multiple reasons). First, different gestures take different lengths of time to complete. Even if the gestures are supposed to be the same, they can be executed at different rates. Additionally, to prevent the classifier from predicting the same given gesture multiple times over the fixed sliding window (or to make an early (and incorrect) prediction), there has to be an algorithm that determines the moment at which the gesture begins and ends (the solution could also be to increase the time lapse between the intervals of classifications, but this would greatly increase the risk of missing significant windows of signals).
The other option is to use a sliding window over the signal (but this time to determine only the moments at which the gesture starts and ends); only then is the classification process triggered and a gesture predicted. As a result, this does not produce a fixed-size snapshot of the signal. Instead, the snapshot begins when the sliding window recognizes the beginning of a gesture and ends when the signal comes back to an idle state. The beginning and end of a gesture are determined for the signals’ variance and instantaneous slope (from the derivative). Indeed, none of the components in
Figure 7 actually requires the input to always be of the same length. This procedure settles the previously stated issues (duplication of the prediction and variable length of the gestures) and allows for the execution of sequences of gestures in a fluid and efficient manner. Algorithm 1 presents the definition of
DetectAction.
| Algorithm 1 Definition of the real-time gesture recognition sub-routine. |
- 1:
functionDetectAction() - 2:
▹ should be 1 - 3:
▹ for the first function call - 4:
▹ slide - 5:
if AND then - 6:
if == NULL then - 7:
- 8:
- 9:
else - 10:
▹ slides with - 11:
end if - 12:
else - 13:
- 14:
if NOT NULL then - 15:
- 16:
- 17:
end if - 18:
end if - 19:
return - 20:
end function
|
The function takes r (a sensor reading) as an input. In the context of the experiments, r has two components, the accelerometer’s magnitude signal and the gyroscope’s magnitude signal. Using the magnitude does not constrain the IMU to be positioned in any specific orientation on the body of the user. The length of r should be 1, meaning it is only a single new point. This assumption simplifies Algorithm 1, but a validation could be added. The window sliding operation is then represented by Line 4, where r is appended to and the first elements of are removed.
To generalize, the
would be a
matrix, where
is the length of the window and each row represents one component. So, the derivatives (computed with first order backward differences):
where
f is the signal sampling frequency, and the variances (
) are computed from the rows of
(
i is an index in a row);
and
are heuristically chosen thresholds on each element of derivative matrix (in absolute value) and variance matrix values, respectively. Those thresholds represent the sensitivity of the algorithm to trigger the classification process. They can be modified manually for each user. Additionally,
is an arbitrary offset on the sliding window to compensate the lag associated with the computation of the derivatives and variances on the tail of
(
, which represents the latest
points of the signals). When an element of
and
crosses the respective thresholds, the condition in Line 5 is satisfied. This offset allows the algorithm to have a slightly larger window, with a few stable points before and after the signals pass the thresholds. It ensures that all significant data are given to the classification pipeline. In other words, it enlarges the signal snapshot by taking a few points before what is initially determined by the sliding window before serving it to the classifier. These newly added data points help catch the beginning of the gesture more clearly. Finally, the
Predict function is the implementation of the pipeline.
6. Experiments
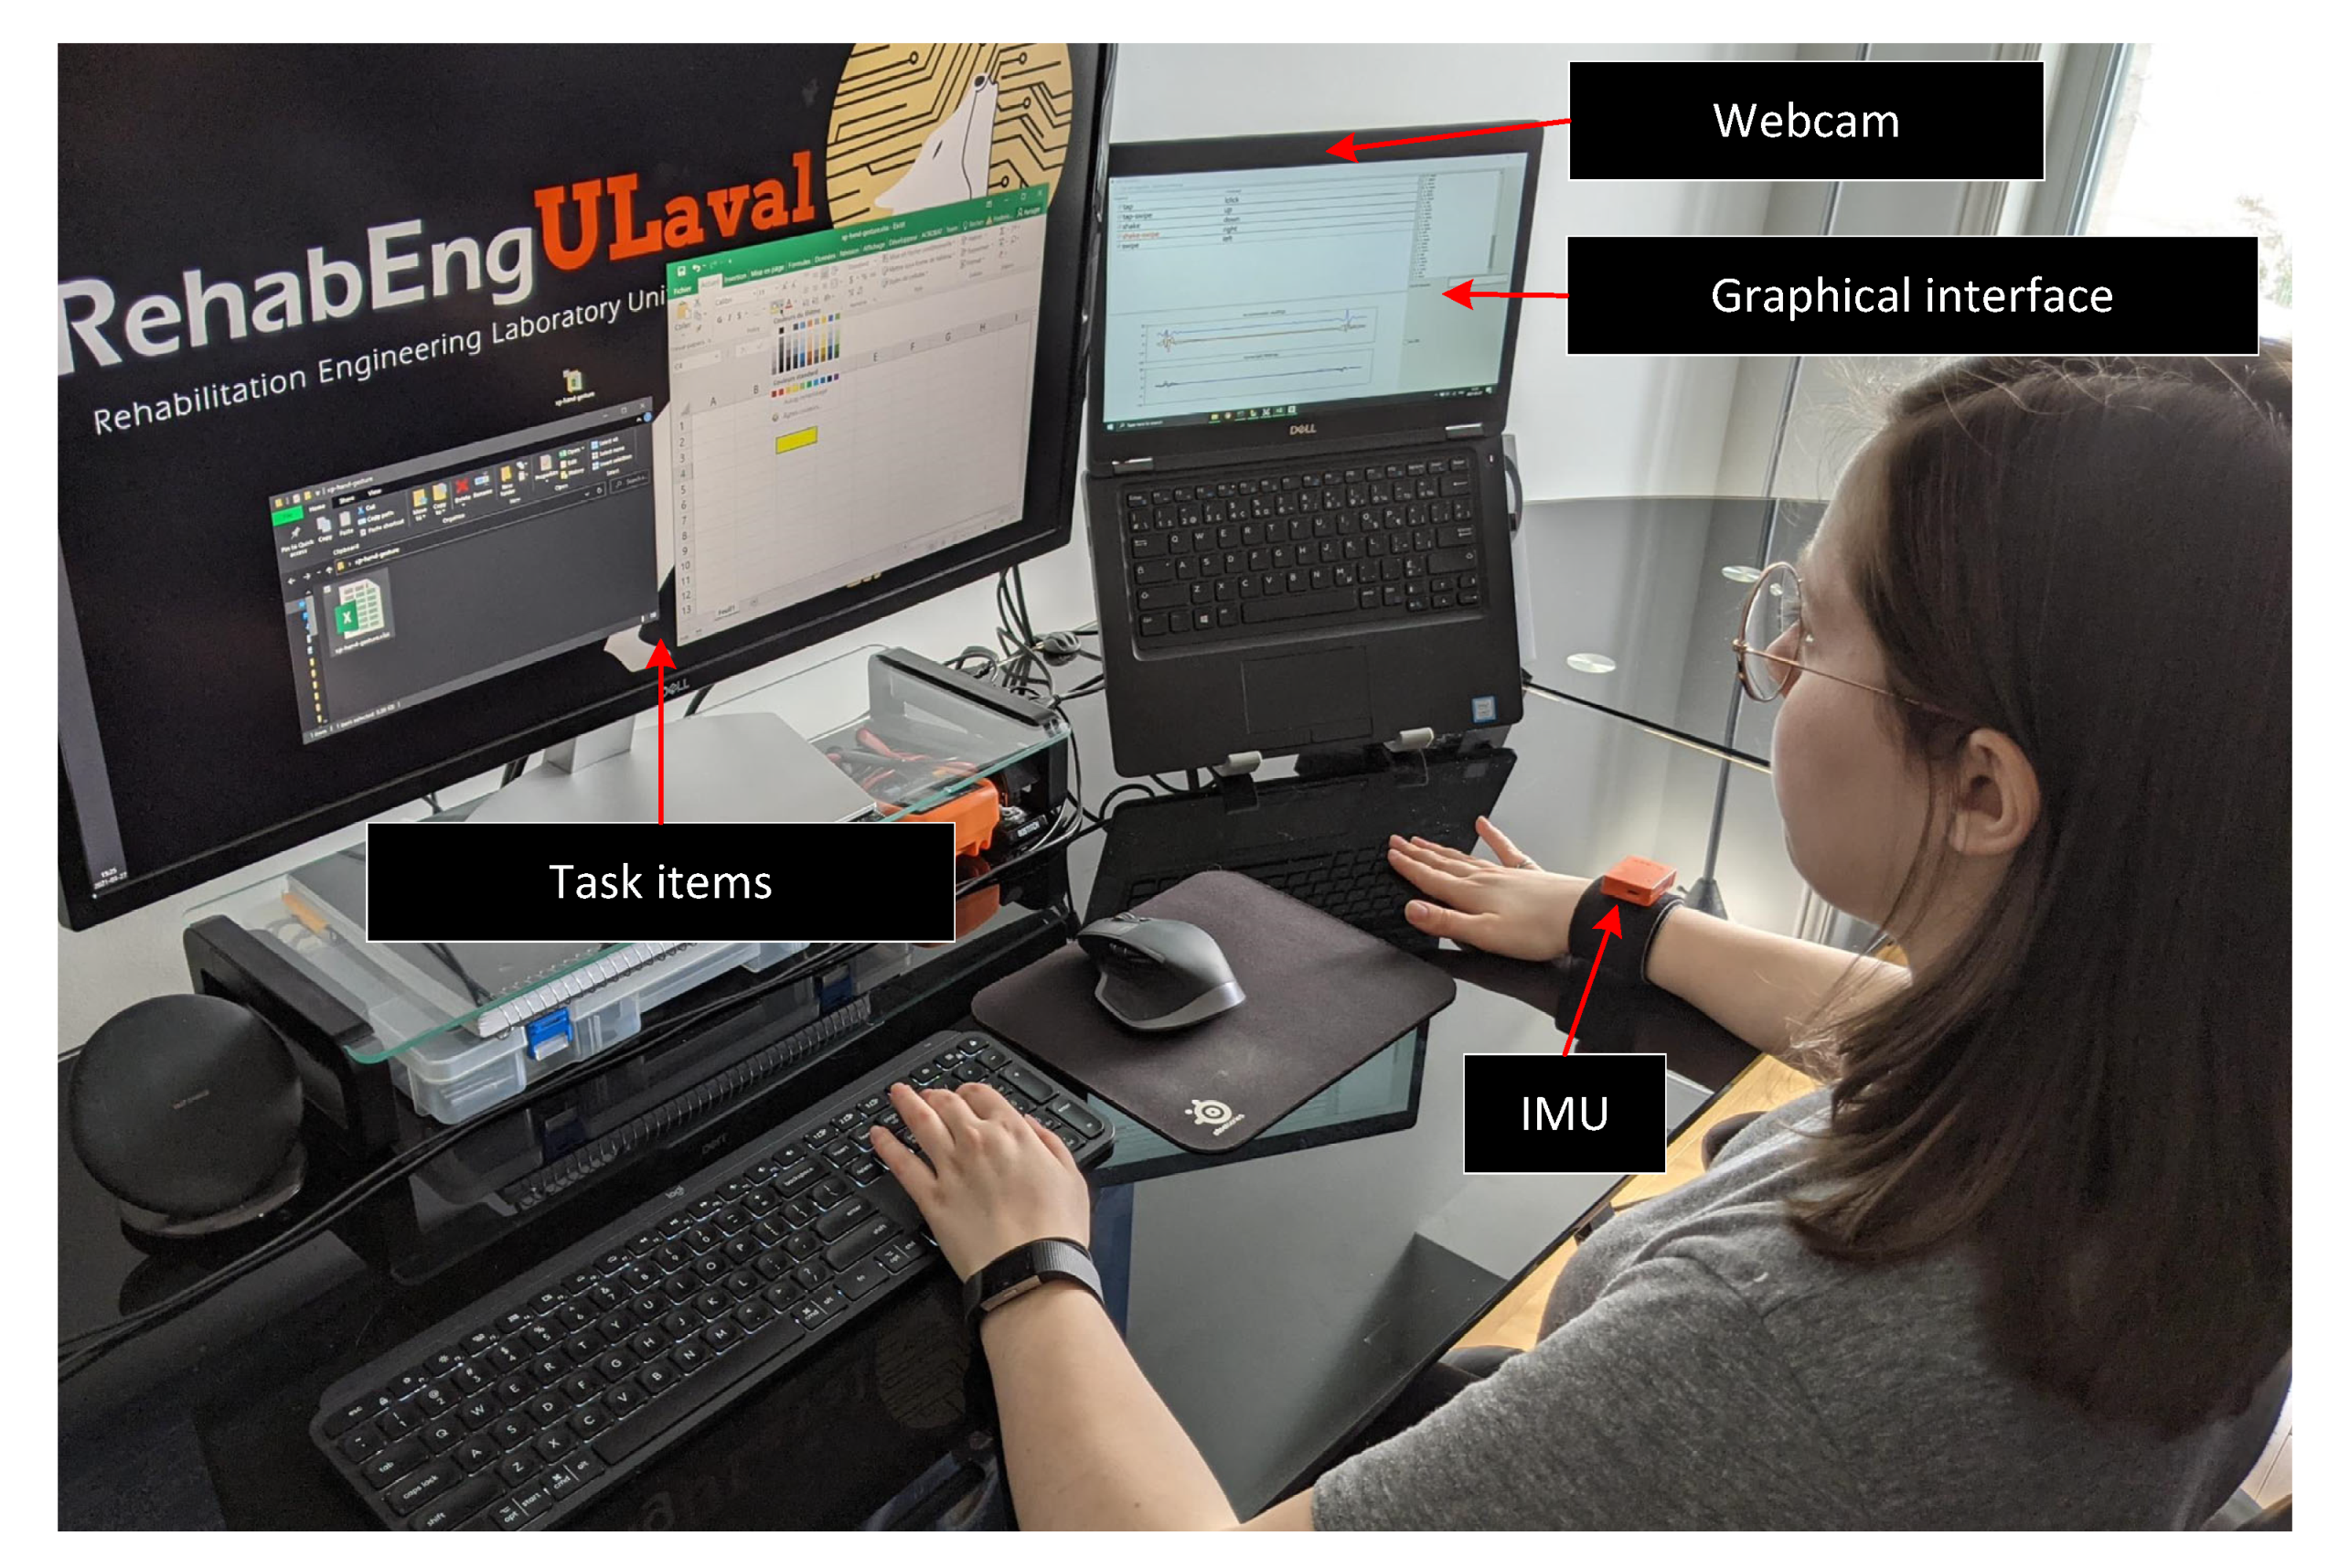
Following the development and the implementation presented in the previous sections, a series of tasks, involving the control of a computer mouse and keyboard, were designed to test the system in a real-life scenario. The hand gesture interface was compared against (and combined with) the AssystMouse [
39], a head movement-based software, to control the mouse using a webcam. The first objective of the tests was to assess the performance of the hand gesture interface by first comparing it to the AssystMouse software. Then, the tests aimed to evaluate the usage of the hand gesture interface, when combined with the AssystMouse software. In this case, AssystMouse was used to control the mouse and the hand gestures, provided quick keyboard shortcuts (e.g.,
Tap to copy and
tap-tap to paste). The experimental setup is presented in
Figure 10. It includes an IMU to input gestures, a webcam required by the AssystMouse, and display monitors showing the graphical interface (displaying the modes, sequences, and options) and the actual workspace where the tasks were performed.
The experiments have been performed by five healthy participants (2 male and 3 female) between 24 and 35 years old. In order to assess the performance of the hand gesture interface, they had to execute two tasks. To set up the experiment, each participant had to record his or her own gestures, then build sequences and map them to specific control modes of the mouse and keyboard. They first recorded three distinct hand gestures:
Tap: a simple tap on the table.
Swipe: a swipe on or above the table.
Shake: wrist shake in the air.
To do so, the participants had to execute each gesture ten times.
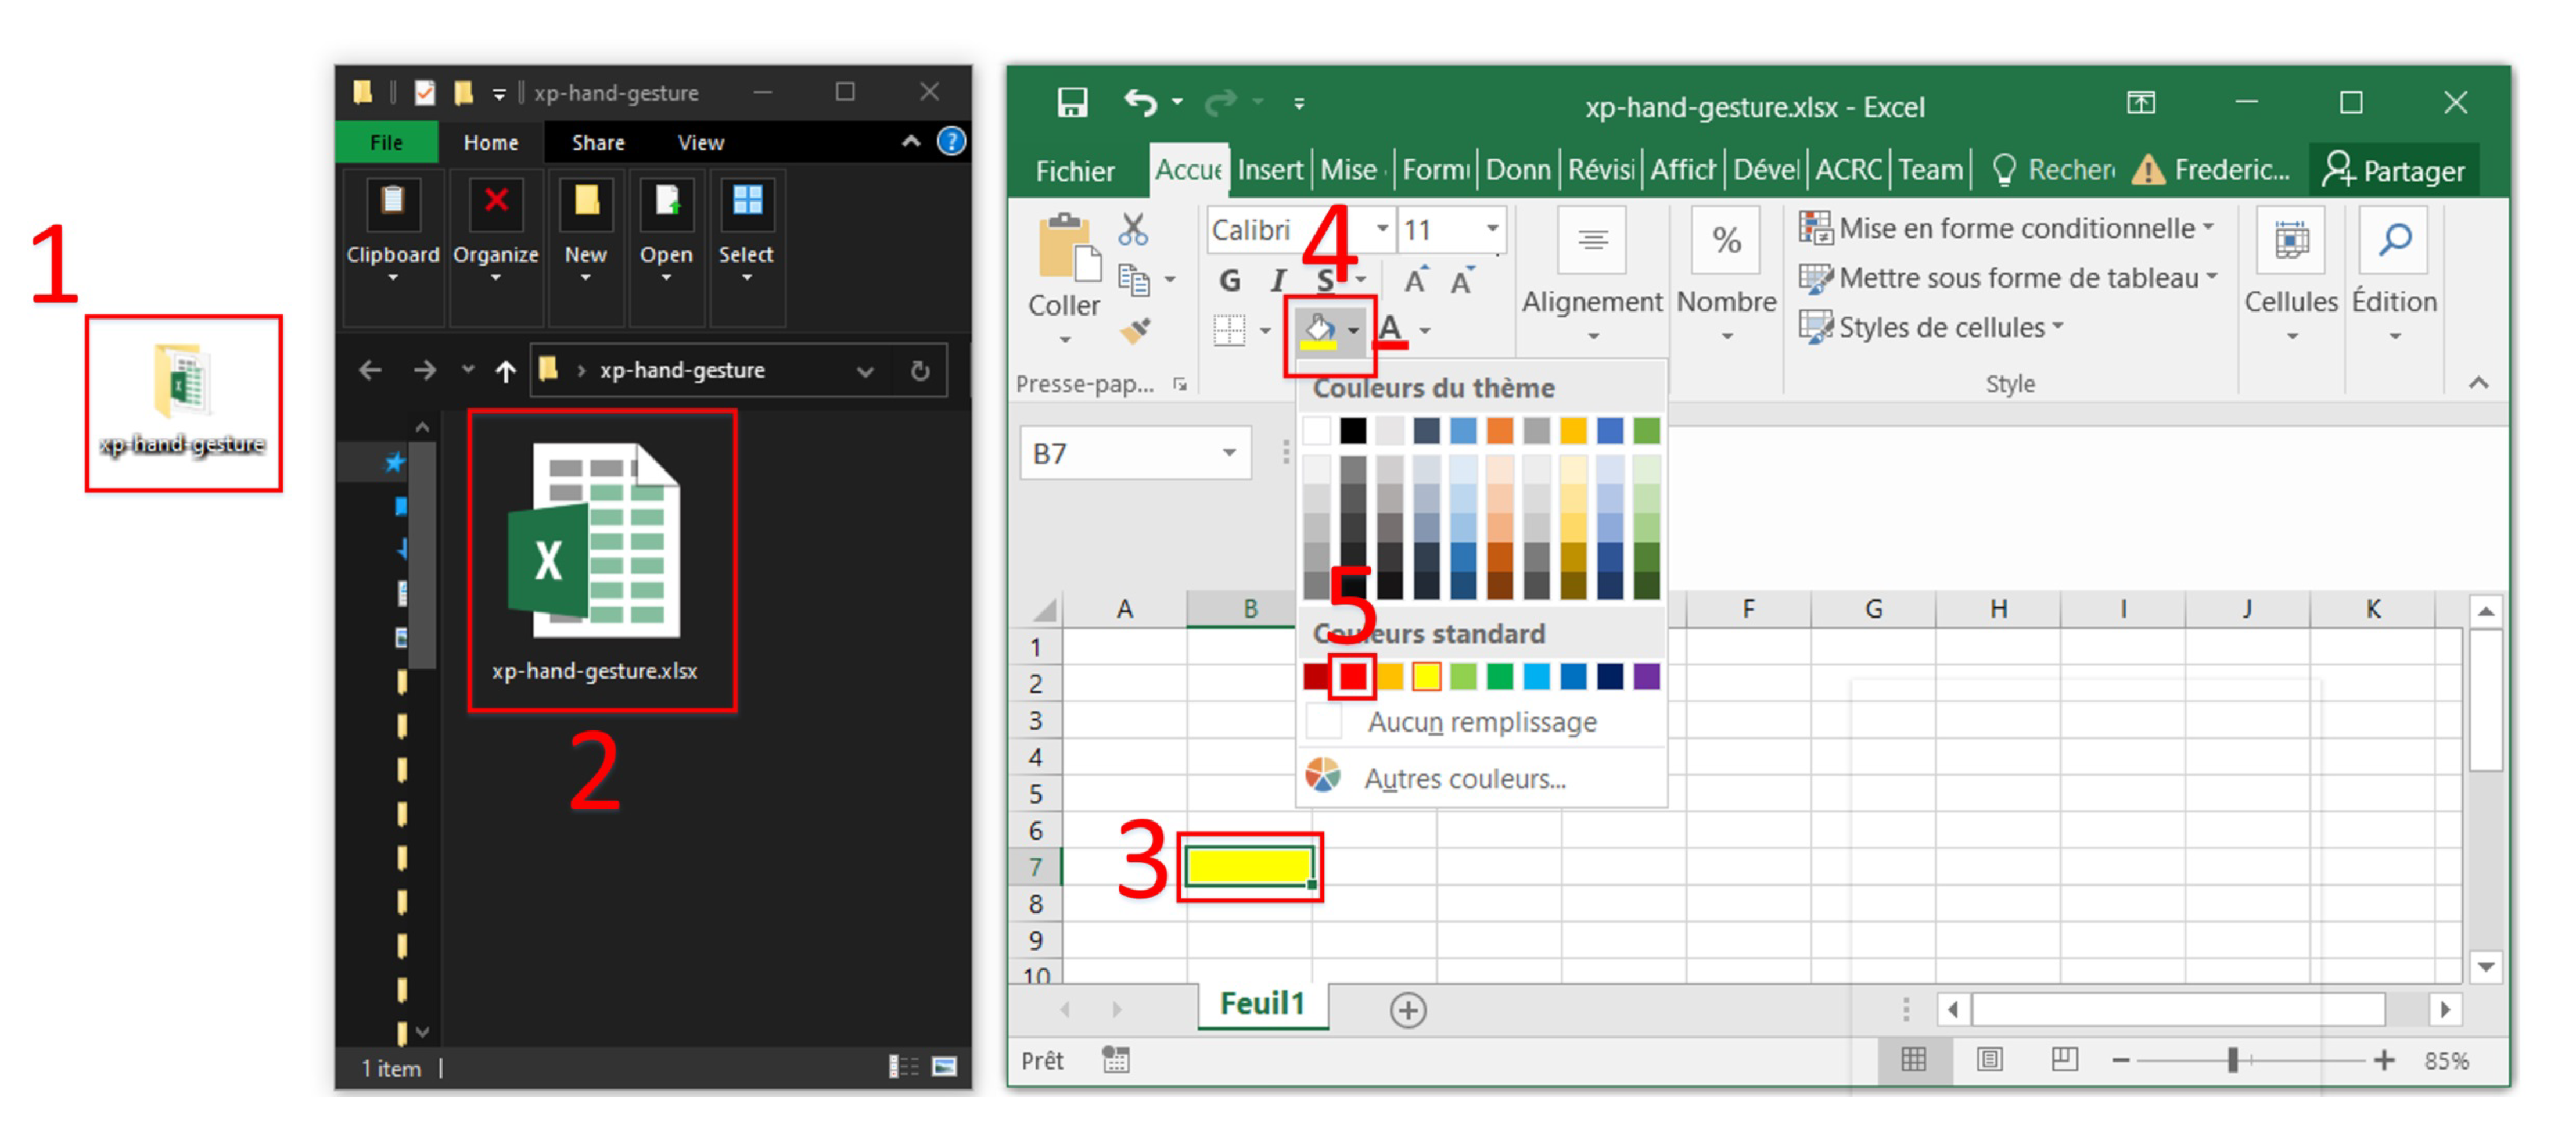
The first task, shown in
Figure 11, was to open a folder on the PC desktop, then open the spreadsheet in the folder and change the color of the yellow cell to red. This task required the participant to be precise with the mouse, as well as to execute single and double clicks. The participants had to complete this task using first the hand gesture interface and then the AssystMouse and they were timed for both interfaces. With the gestures, five sequences were created:
Tap,
Tap-
Swipe,
Shake,
Shake-
Swipe, and
Swipe. Those sequences were mapped to the mouse modes left-click, up, down, left, and right. For this task, a button was used to activate the mode once in it. For instance, if the participant executed
Tap-
Swipe to enter the mouse-up mode, they had to press the button to actually make the cursor go up. Before the experiment, the participants had ten minutes to familiarize themselves with each interface.
The second task was performed in the spreadsheet. The participants first had to copy and paste a cell three times with the AssystMouse only. Then, they had to do the same thing but using both the Assystmouse and the hand gesture interface. The first three sequences were remapped to the modes click, copy, and paste. Thus, the gestures could be used as shortcuts and the mouse was still controlled with the AssystMouse. This aimed to evaluate the suitability of the hand gesture interface when used as a complement to other available AT control systems.
After the tests, the participants were asked to answer a questionnaire (which contained questions adapted from the QUEAD [
40]) and to leave their comments.
7. Results and Discussion
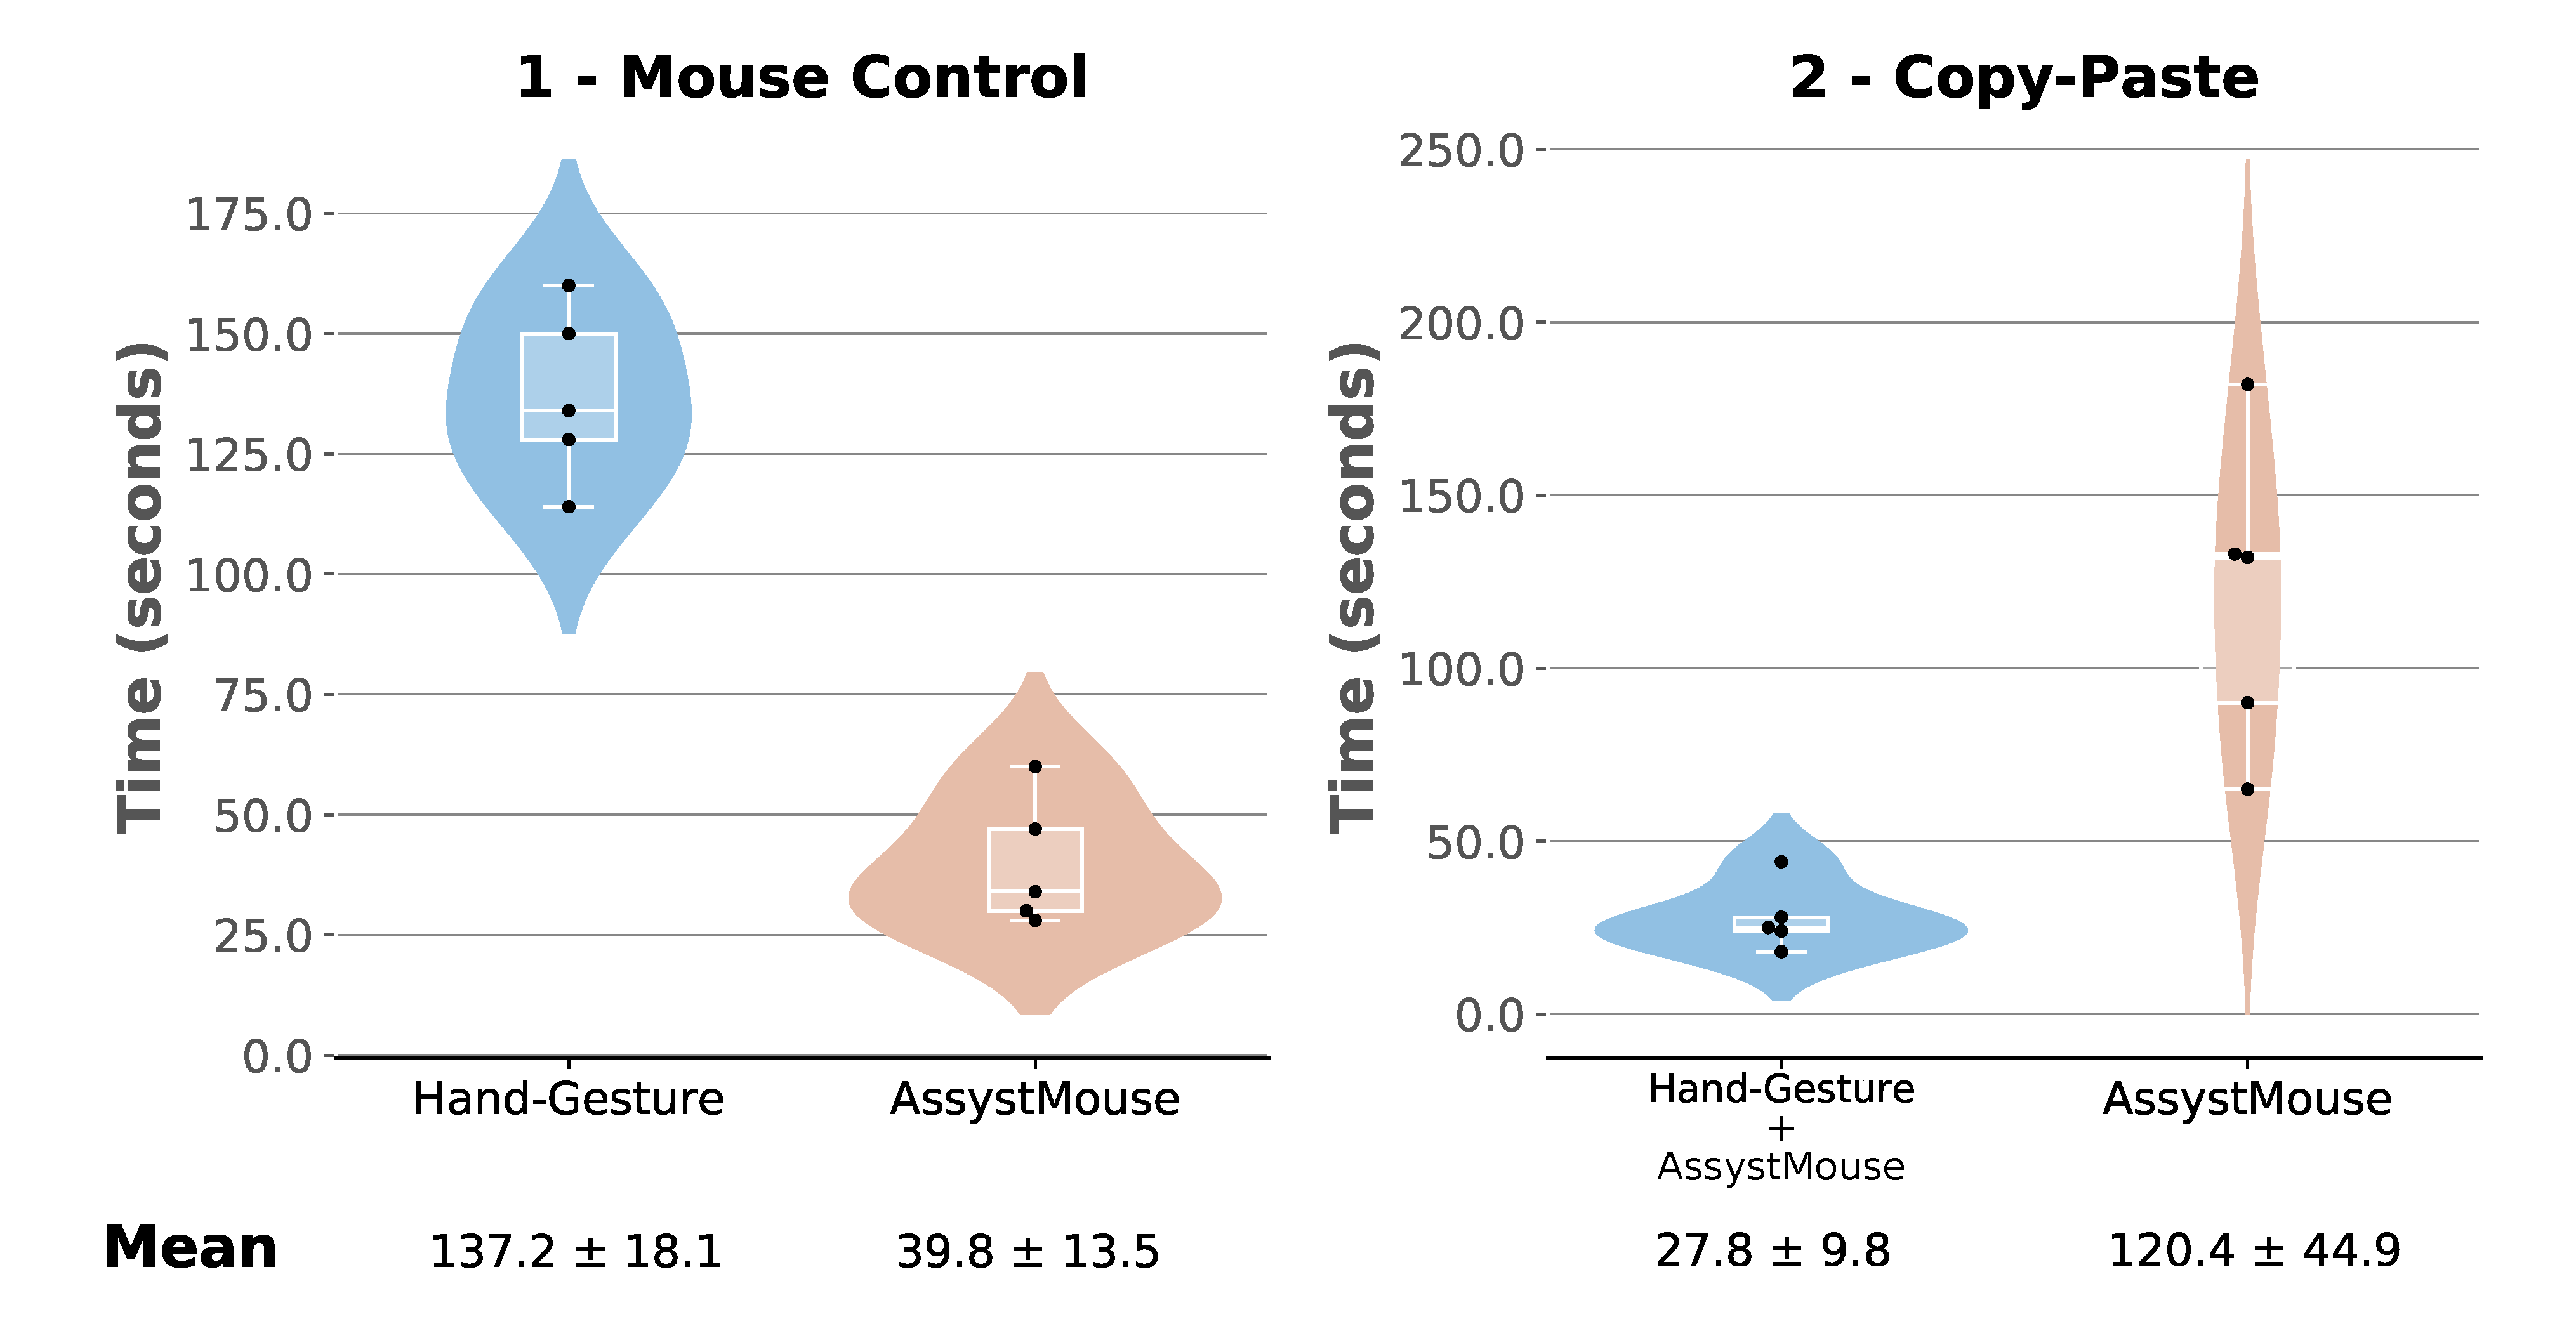
For each task and each interface presented in the previous section, the completion times were noted. The distributions of these data are shown by the plots in
Figure 12.
Figure 12 presents the data by task (mouse control and copy–paste) and interface (hand gesture and AssystMouse), shown in a boxplot. The boxplots are wrapped in a violin-like area that shows the estimated probability densities. The means of the completion times, plus or minus the standard deviations, are also displayed in the figure.
The distributions show that a webcam-based system, for the control of the mouse, is still much faster. However, the standard deviation of the times for the hand gesture mouse control task being relatively low indicates that the system is reliable and robust, since all the participants were able to complete the task in similar times. In other words, it does not seem to require any specific skills to work.
On the other hand, the copy–paste task’s data shows that the integration of the hand gesture interface with the AssystMouse consistently improved the participants’ time by 77%, on average. In addition, a one-tailed, non-parametric Wilcoxon signed-rank test also confirmed that the usage of the hand gesture interface significantly decreases the time to perform the second task (p-value = 0.043 < 0.050).
Another metric to look at for the experiments is the setup time for the first usage of the hand gesture interface. In general, the average time to record the three gestures was 99 s, and the time to set up the five sequences and map them to the five modes was about 69 s. These actions are only executed the first time a participant uses the interface. The participant’s data are then kept in memory. Therefore, it might be cumbersome to use the hand gesture solution the first time. However, because these actions are only required once (at the installation of the hand gesture interface) and are kept in memory from day to day, the payback increases rapidly with time.
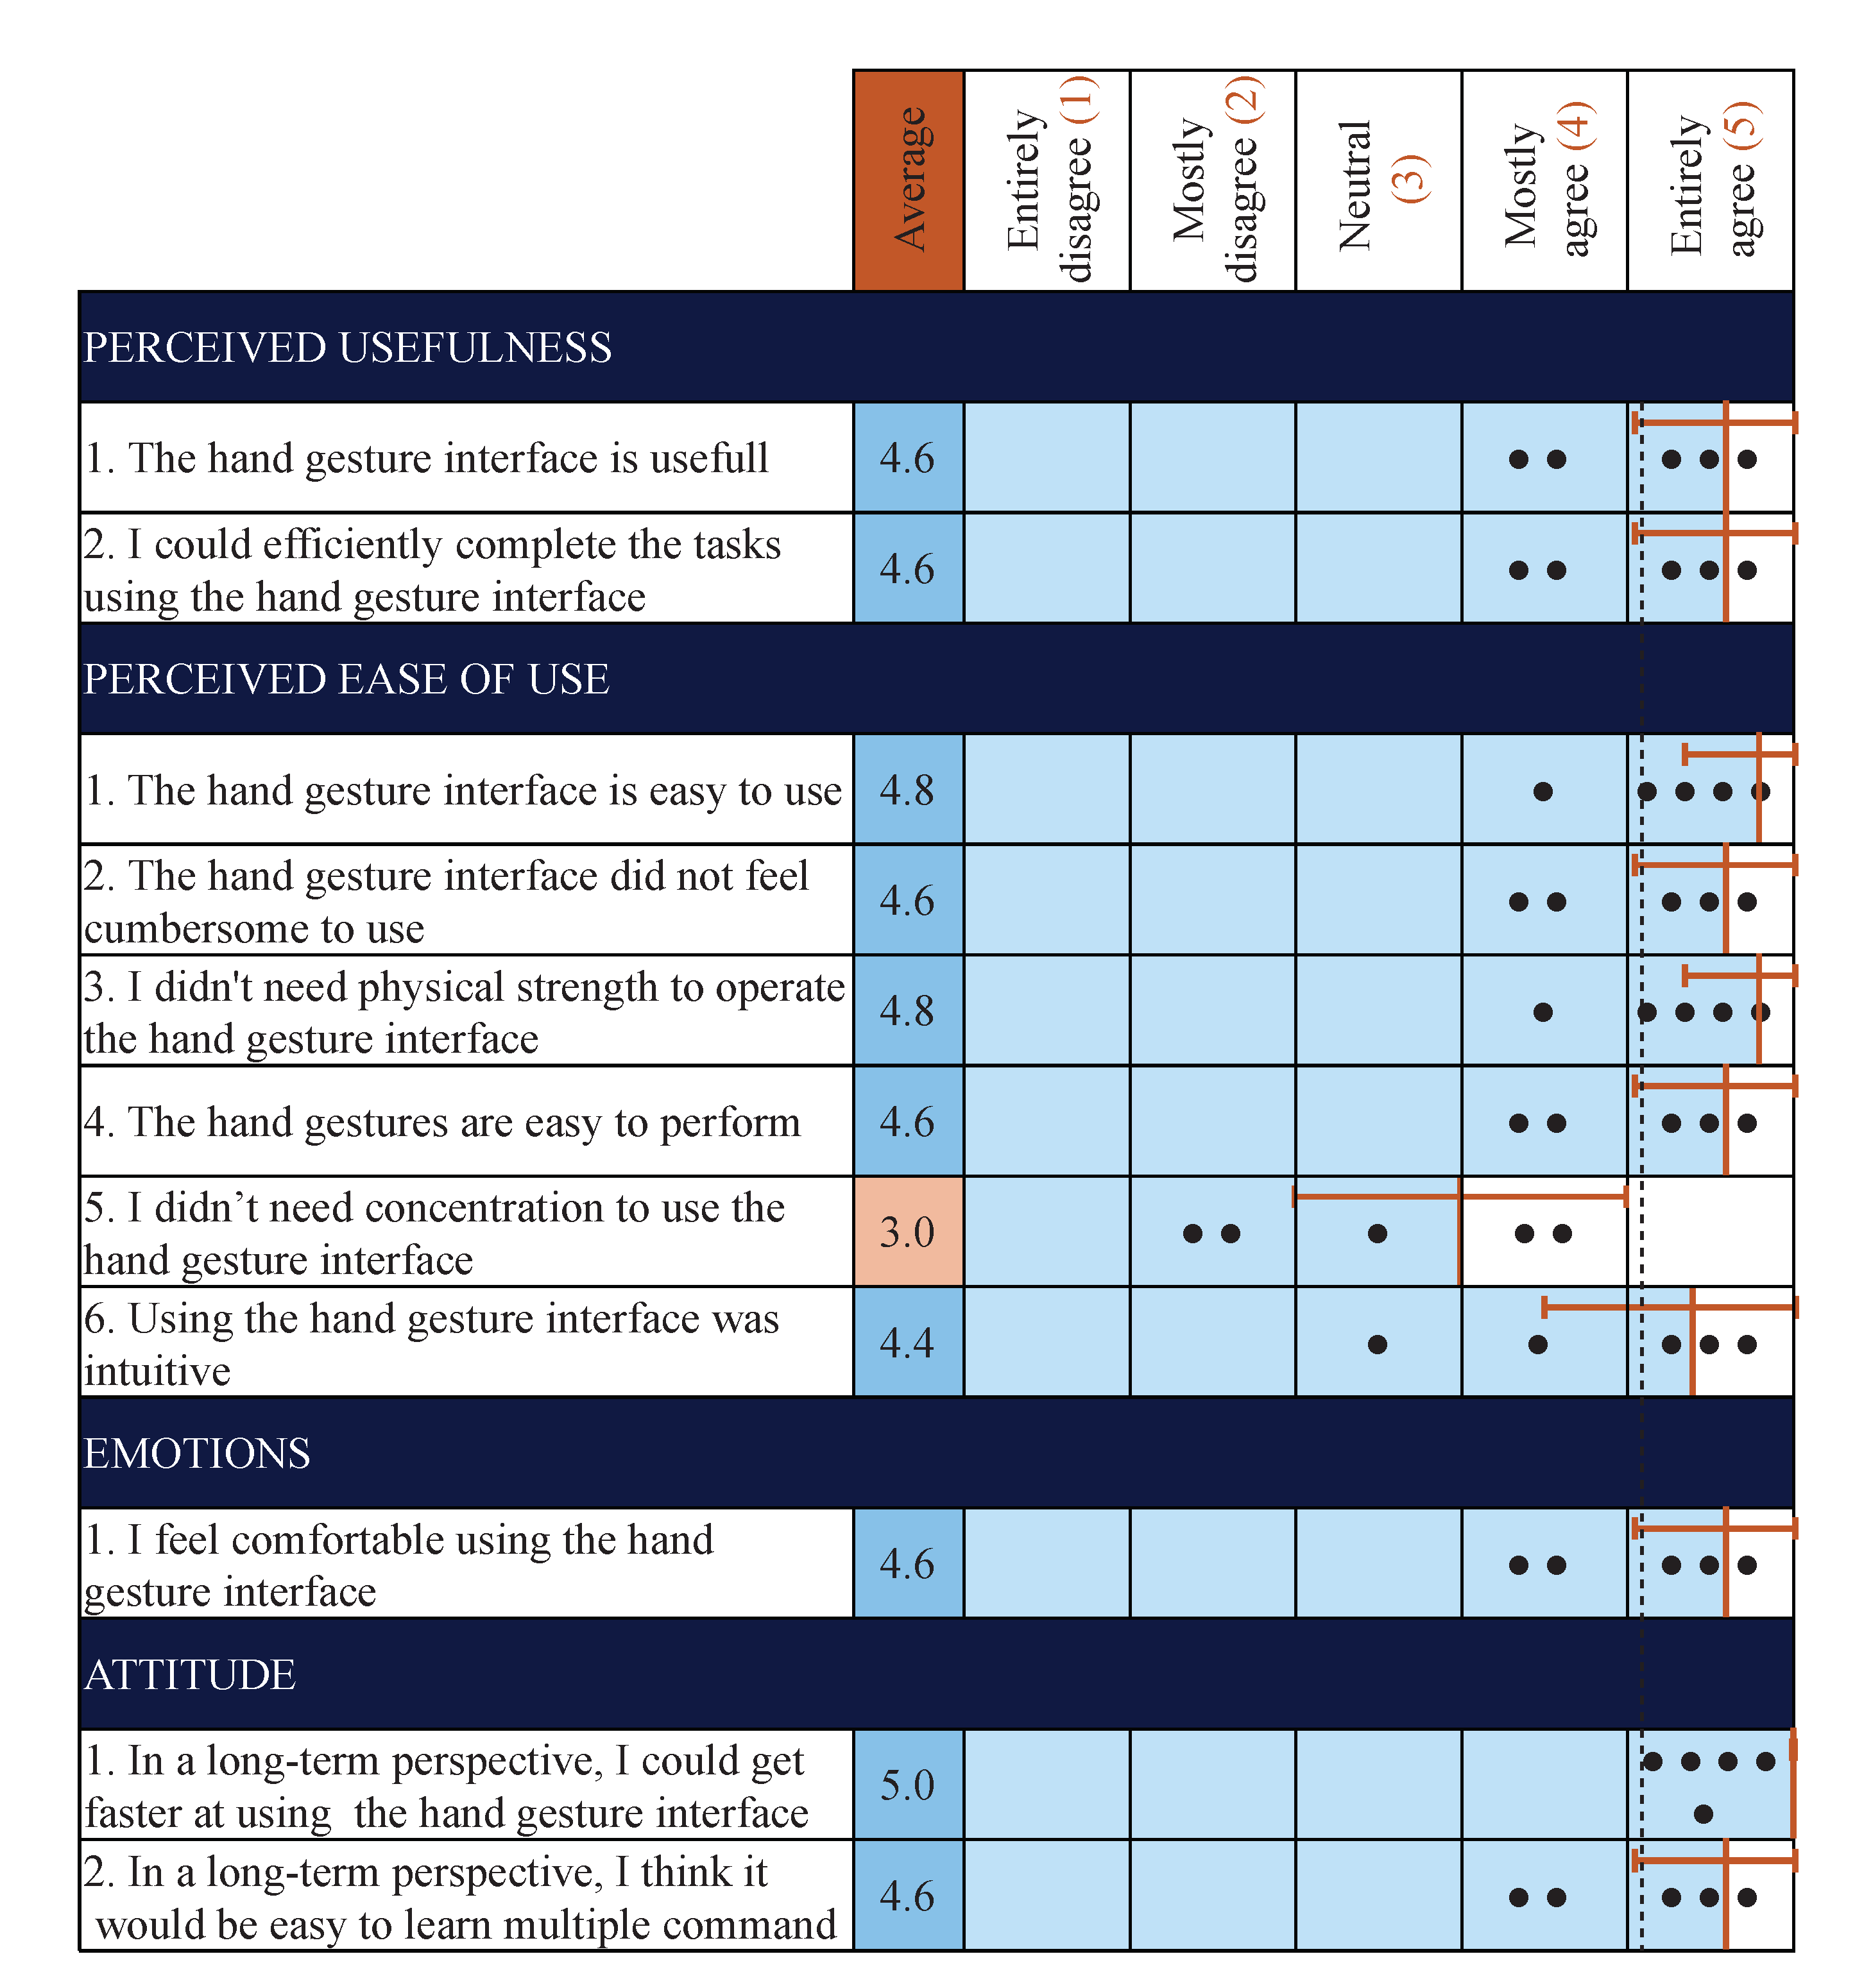
Finally, some qualitative data has been gathered from the experiments, as the participants answered a questionnaire after completing the tasks. This allowed the participants to rate their appreciation of the system. The results of this questionnaire are presented in
Figure 13.
The results show that the participants appreciated using the hand gesture interface. They felt that it would get easier to use with time, but still needed a fair level of concentration when using it. However, they did not find it cumbersome, counterintuitive, or difficult to use. They also noted in the comments that they especially liked using the hand gesture interface in combination with the AssystMouse, as it gave them quick access to shortcuts that were easy to execute.
The tasks chosen for the experiments aimed to evaluate the user’s control over the cursor, while being able to execute various commands (e.g., clicks). Many users living with muscular dystrophy or spinal cord injury, for instance, can move their wrist or fingers. However, they might not be able to move their arm enough to control a mouse, and it is even more difficult to lift the arm to control a keyboard. With the device, they can rest their arm on an armrest and move the wrist so the system can recognize different movement signatures, which can help them to control different shortcuts, such as those tested in the experiments. In a case where they can’t control their arm or wrist, the device can be installed on another body part such as a foot or the head.
The choice to compare the hand gesture interface against the AssystMouse technology also brings interesting results to the experiment. The AssystMouse is used in practice and is easily available; it represents a valid reference point to compare the hand gesture interface, since both interfaces may be used by the same population. The AssystMouse is also the type of interface that makes use of subgroups to organize its commands (e.g., clicks: right, left, and double; triggers: auto and eyebrows). Thus, the user has to go to the home menu of the interface every time he/she wants to switch modes. The SMA allows for bypassing those sub-groups and uses a command directly. This explains why the AssystMouse becomes much faster when combined with the hand gestures.
The main takeaway of this experiment is, perhaps, the efficiency of that combination. The interfaces complement each other very well, showing that the SMA could be combined with other devices, such as joysticks, and perform similarly.
8. Conclusions
This paper has presented the development of an interface to control an assistive technology efficiently and intuitively. The goal was to help people living with upper or lower limb disabilities in their daily tasks. More specifically, the objective was to develop an interface to easily control high-dimensionality ATs with low-dimensionality devices. To do so, a second application of the sequence matching algorithm, presented in [
18], has been developed. The main advantage of the SMA is to navigate quickly among different modes of an AT (without having to cluster them into multiple sub-groups) while maintaining a robust system. The idea of the SMA was to combine simple actions into a sequence similar to Morse code.
For this project, the SMA has been applied to hand gestures recognized from IMU signals. This brought the problem of having to train a model to recognize those gestures with a dataset of a size significantly lower than that of a typical machine learning implementation. To answer the problem, four lightweight, yet robust, classification algorithms have been identified and tested against a five-class dataset. The classifiers were support vector machines, linear discriminant analysis, adaptative boosting, and K-nearest neighbors. The best performing classifier was the linear SVM, with 95% of the predictions correct on the offline data. Since the size of the training dataset was small, this score could be increased by simply having fewer classes (different gestures) or having gestures that are qualitatively more different. Fortunately, this can be done, since it is the principal advantage of the SMA to give many different instructions with limited physical inputs. The SVM algorithm was preceded by the extraction of the features on the raw accelerometer and gyroscope signals, as well as by a PCA to reduce the dimensionality of the features. These components established the classification pipeline that predicts gestures from inputted IMU signals. The pipeline had then been wrapped in a triggering algorithm and implemented in real-time, so that it would output a prediction quickly on any valid input.
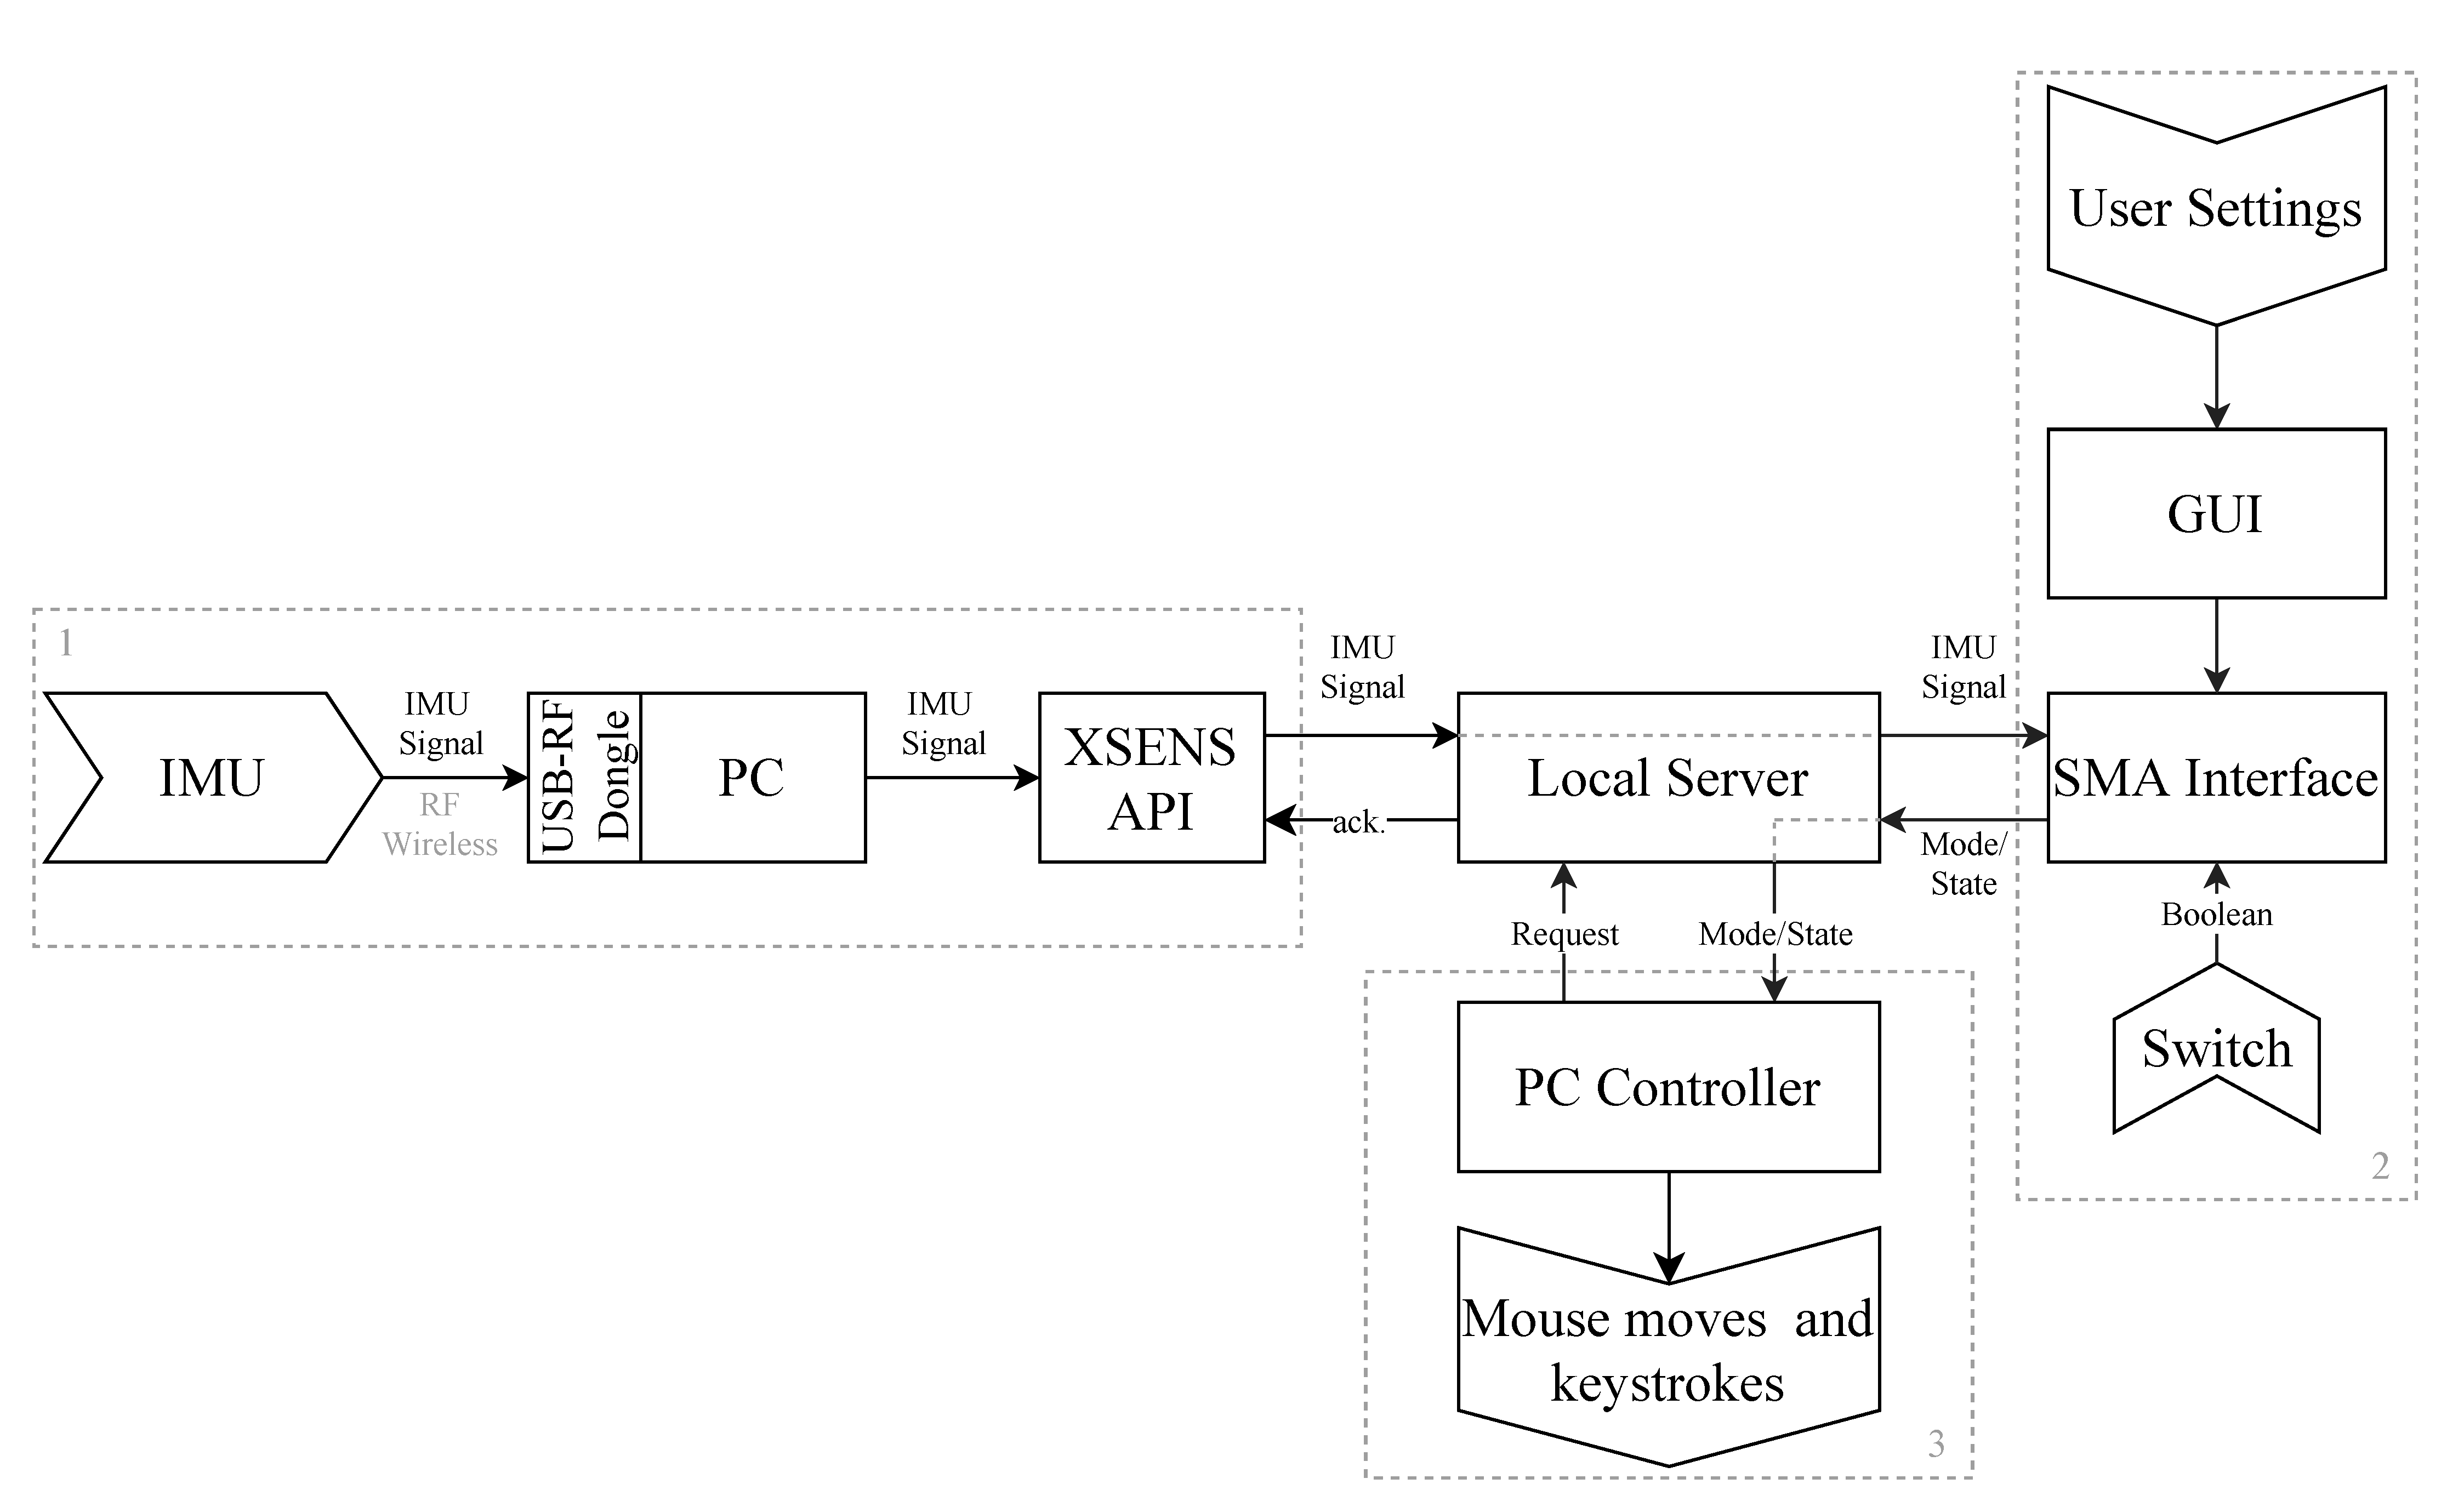
In addition to the elaboration of the gesture recognition routine, a complete, actual application integrating the IMU, the SMA interface, and a controlled device has been developed. The architecture of the system consisted of these three components (sensor, interface, and device), implemented as independent modules and organized together with a local server as a central piece. In the development environment, this configuration has proven versatile and efficient. The sensor module was a wireless commercial IMU and the device was a computer’s mouse and keyboard (moves and shortcuts). Additionally, the user could interact with the system with a GUI to edit settings, gestures, sequences, and mappings, as well as to have visual feedback of the state of the actions performed.
The implementation has been tested in two scenarios. For the control of the computer mouse, when the hand gesture interface was compared against a head movement-based interface using a webcam, the latter seems superior. However, when combined, the hand gestures help participants increase their performance by 77%, by offering quick shortcuts accessible with the gestures’ sequences. Besides, even if the head movement interface offers better performance for the first half of the experiments, both interfaces may be better adapted to different populations and different scenarios.
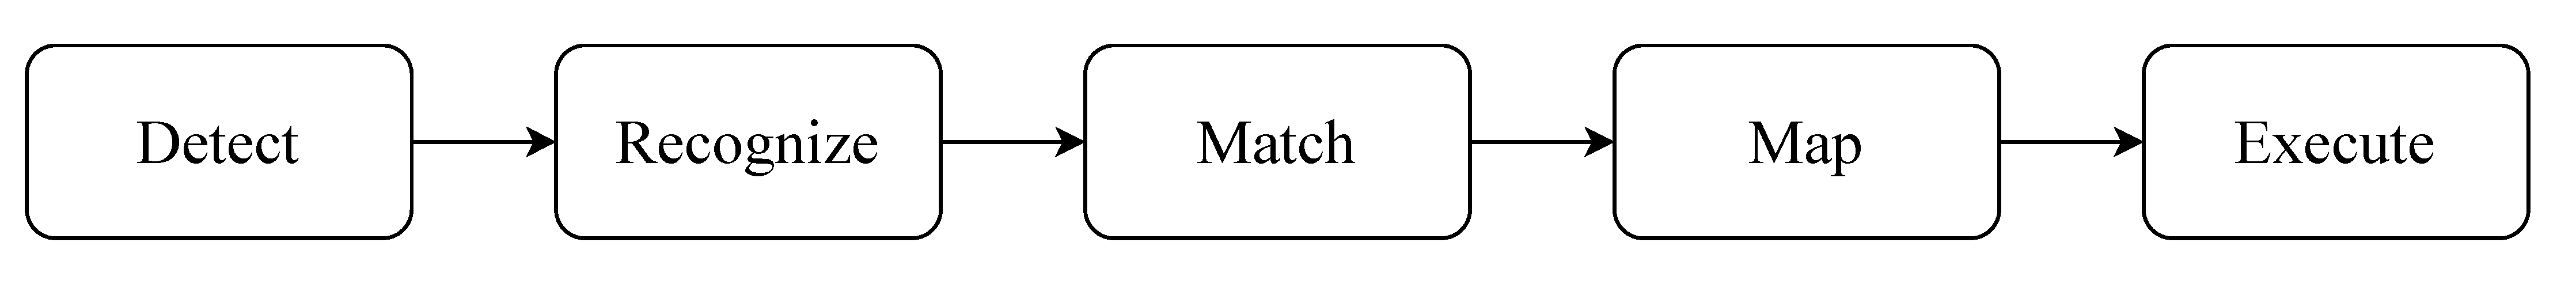
Although the focus here is on an application of SMA with hand gestures, the interface is not limited to hands or to a computer as an AT. It could use head gestures (tilting) or lower limb moves (leg raise and foot stamps), as well. The application would not require any modifications. If the user wanted to control a robotic arm, instead of a computer, only the controlled-device module (
Section 5.1.3) would need to be modified in the system. The control of an assistive robotic arm represents an interesting implementation for the SMA, as well as a useful development for people living with disabilities. Additionally, future work would be to continue to develop more intelligent algorithms, in order to increase the robustness of the system and to test the application with people living with disabilities executing more complex tasks, to further assess the versatility of the interface.


