Technical Note

Case Study: Experimental Study on Enhancing Acoustic Contrast of Personal Sound Zones in a Car Using Headrest Loudspeakers


Key Laboratory of Modern Acoustics and Institute of Acoustics, Nanjing University, 22 Hankou Road, Nanjing 210093, China
*
Author to whom correspondence should be addressed.
Acoustics 2026, 8(3), 52; https://doi.org/10.3390/acoustics8030052
Submission received: 25 May 2026 / Revised: 15 July 2026 / Accepted: 24 July 2026 / Published: 26 July 2026

Abstract

Personal sound zones (PSZs) in cars allow occupants in different seats to enjoy distinct audio content without mutual interference. However, achieving sufficient acoustic isolation in real-world vehicle cabins remains challenging. In-vehicle experiments were conducted to enhance acoustic contrast using four headrest loudspeakers mounted on the rear-right seat to create dark zones at the front seats. Three arrangements of four headrest loudspeakers on a single seat were evaluated: longitudinal horizontal, lateral horizontal and vertical configurations. Compared with distributing four headrest loudspeakers across two seats, concentrating them on one seat yielded better acoustic contrast. When evaluated in the car using control points distributed on a horizontal plane, the vertical configuration exhibited superior performance among the tested arrangements, achieving an overall acoustic contrast of 12.4 dB over the 88–4525 Hz frequency band. This represents improvements of 3.9 dB over the two-loudspeaker setup and 0.9 dB over the two-seat-distributed four-loudspeaker arrangement. These results indicate that the vertical loudspeaker arrays on a single seat provide an effective approach for improving PSZ isolation in automotive environments. However, this enhanced acoustic isolation comes at the cost of increased array effort at low frequencies compared to the two-seat distributed configuration, as quantified in the study.

1. Introduction

Personal sound zones (PSZs) in vehicle cabins enable occupants in different seats to experience distinct audio content without mutual interference, and have been extensively investigated in recent years [1,2]. The underlying principle involves controlling a loudspeaker array using multichannel filters to synthesize the target sound field in the bright zone while suppressing acoustic energy in the dark zones [3]. The performance of PSZs is typically assessed through metrics including acoustic contrast, reproduction error in the bright zone, and perceived sound quality [4,5,6]. The acoustic contrast is defined as the difference in spatially averaged sound pressure level (SPL) between the bright and the dark zones [7], while the reproduction error describes the deviation of the reproduced sound field from the desired one within the bright zone [8], and the sound quality is often associated with the fidelity of the reproduced sound field. In practical applications, acoustic contrast, bright-zone reproduction error, and array effort must be balanced to avoid signal distortion and loudspeaker overload. However, acoustic contrast is the most direct metric for characterizing acoustic isolation between listening zones. Therefore, this study employs acoustic contrast control to evaluate the achievable isolation limits of the PSZ system.
The spatial arrangement of loudspeakers directly affects the acoustic contrast performance of PSZ systems. Existing placement optimization methods typically employ iterative selection strategies to identify favorable positions from a large candidate set [9,10], such as the Gram–Schmidt orthogonalization method [11] and the singular value decomposition method [12]. These methods aim to use computationally efficient iteration methods to avoid exhaustively searching all possible loudspeaker combinations. However, the loudspeaker mounting locations in vehicle cabins are usually limited, typically including the doors [13], headrests [13,14,15], ceiling [16], and trunk [17]. Consequently, the reduced candidate set makes it feasible and more effective to directly enumerate all possible combinations and evaluate the performance accurately.
Headrest loudspeakers have been widely employed to create personal sound zones in vehicle cabins [13,14,15,18,19]. Previous work has demonstrated that using eight headrest loudspeakers distributed across four seats in a car can achieve an acoustic contrast of 15 dB above 200 Hz for the bright zone at the front seats. However, when generating a rear bright zone, the acoustic contrast decreases to less than 10 dB at frequencies above 800 Hz [13]. A remaining challenge is determining how to further enhance the acoustic contrast performance of headrest loudspeaker systems. While increasing the number of headrest loudspeakers mounted on a single seat presents a viable solution, the effects of different practical spatial arrangements of such loudspeakers in real vehicle cabins remain underexplored. Jones and Elliott [20] conducted an early study on headrest-based personal audio, in which two or three loudspeakers were arranged on one side of a headrest and their orientation was optimized within the horizontal plane to control multiple dark zones adjacent to and in front of the bright zone. However, this single-sided configuration differs from bilateral headrest loudspeaker arrangements in an actual vehicle cabin, and the acoustic contrast performance of different bilateral headrest loudspeaker arrangements has not yet been systematically evaluated experimentally in a real vehicle cabin. This research gap motivates the present work, which compares loudspeaker configurations with sources mounted on both sides of the headrest for a rear bright zone.
Considering the radiation directivity of loudspeakers, generating a rear bright zone with high acoustic contrast at high frequencies is more challenging for headrest loudspeakers than creating a front bright zone in car cabins [13]. To address this challenge, this paper presents a case study on enhancing acoustic contrast by creating a rear bright zone using different headrest loudspeaker arrangements. The remainder of this paper is organized as follows. Firstly, the theory of the acoustic contrast control method is introduced. Secondly, off-line simulations based on experimentally measured in-cabin electroacoustic transfer functions are performed to evaluate the acoustic contrast performance of various loudspeaker arrangements, ensuring high real-world validity. Two control point distributions are considered: one with control points on the horizontal plane, and the other based on the AES (Audio Engineering Society) six-microphone configuration [21]. Finally, experiments are conducted to verify the simulation results. The main contributions of this study include: (1) systematic comparison of single-seat headrest loudspeaker arrangements for rear bright PSZs; and (2) experimental verification of the optimal arrangement using in-car measurements.

2. Theoretical Formulation

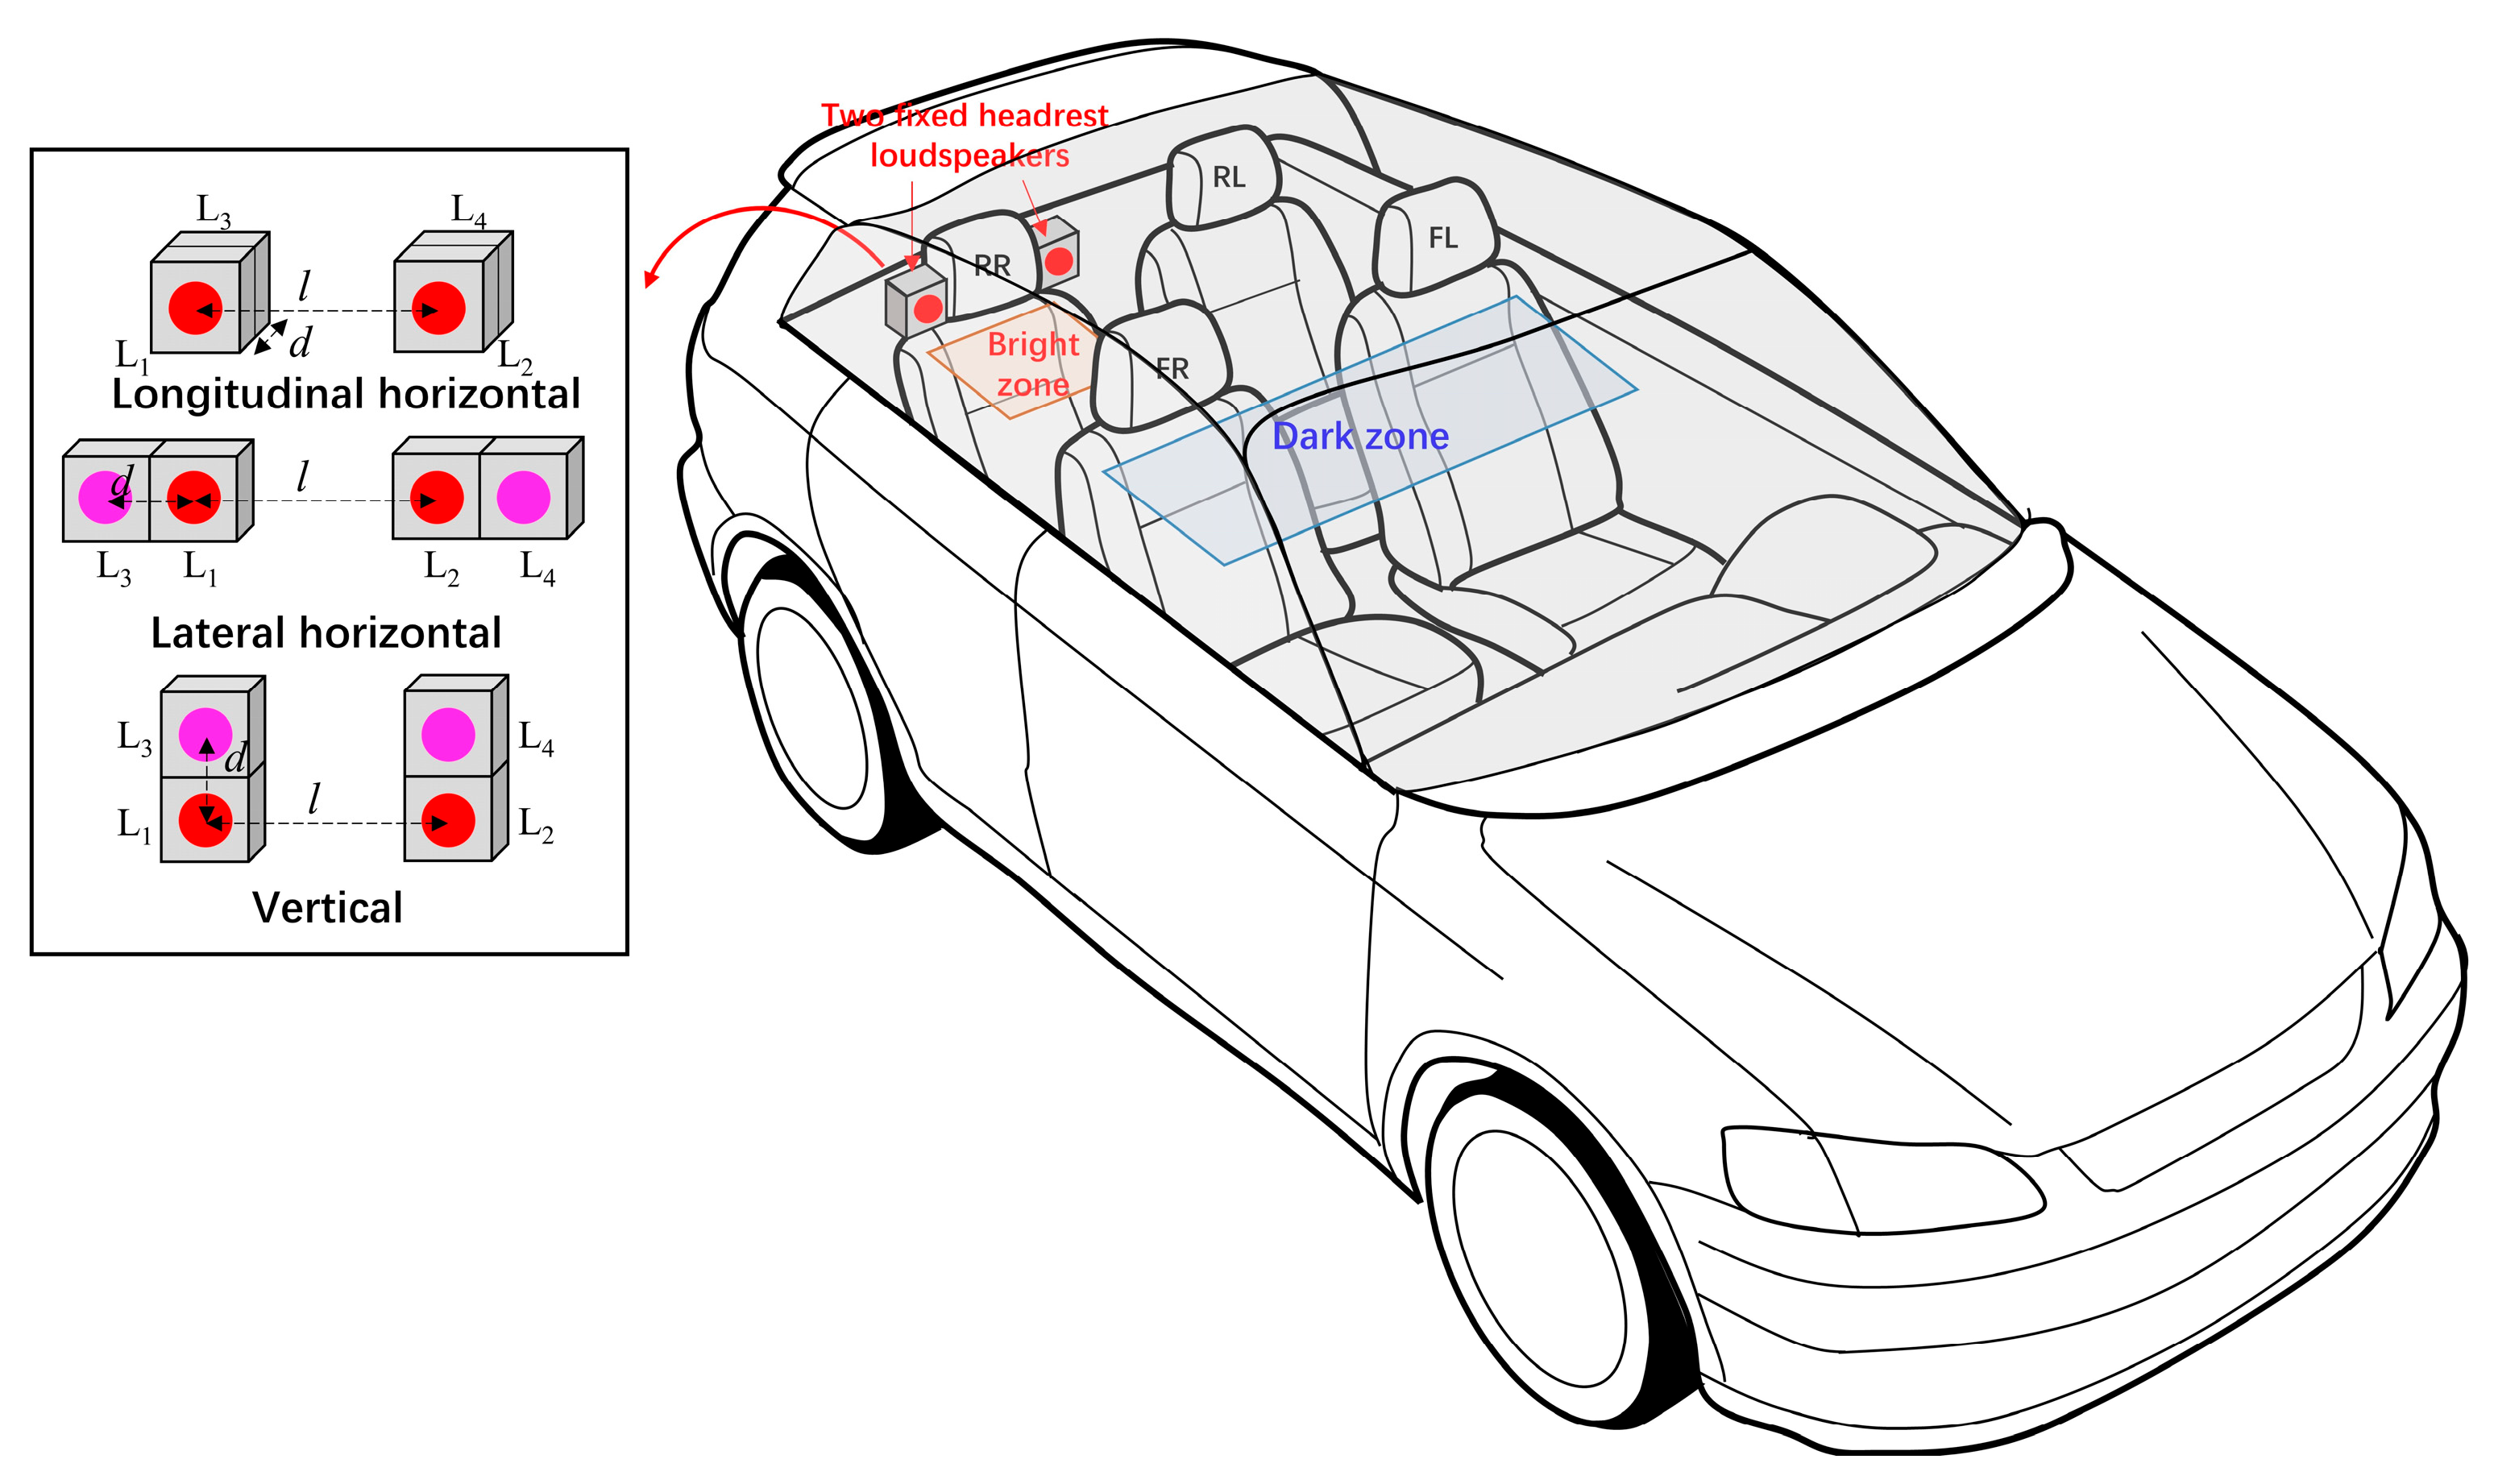
Figure 1 shows the sketch of the PSZ system in the vehicle cabin using headrest loudspeakers, where the rear-right seat is defined as the bright zone and the two front seats are defined as the dark zone. To investigate the influence of headrest loudspeaker arrangements on acoustic contrast, two loudspeakers, separated by a distance l, are first mounted on either side of the headrest of the rear-right seat. These two loudspeakers remain in fixed positions and are labeled L1 and L2. Next, three different single-seat four-loudspeaker arrangements are investigated, designated as “longitudinal horizontal”, “lateral horizontal” and “vertical”. For these arrangements, two additional loudspeakers are placed behind, on the outer sides of, and above the original headrest loudspeakers in the rear-right seat, respectively, each at a distance d from the corresponding original loudspeaker. The two newly added loudspeakers are labeled L3 and L4. For comparison, another four-loudspeaker arrangement is also examined. In this arrangement, L1 and L2 are mounted at the headrest of the rear-right seat, and L3 and L4 are mounted at the headrest of the front-right seat. This arrangement is termed the “two-seat arrangement” in the following discussions.
The vectors of complex sound pressures at the bright and dark zones can be expressed as
p b = Z b q ,   p d = Z d q
where pb, pd are the complex sound pressure vectors at the bright and dark zones, q is an Ns × 1 (where Ns = 4 in this study) vector of source strengths of all headrest loudspeakers, and Zb, Zd are the Nb × Ns, Nd × Ns matrices of acoustic impedances from Ns headrest loudspeakers to the Nb control points in the bright zone and Nd control points in the dark zone. The acoustic contrast between the bright and dark zones is chosen as the performance indicator of the PSZ system, which can be formulated as
AC = p b H p b / N b p d H p d / N d = N d N b q H Z b H Z b q q H Z d H Z d q .
It can be calculated that the acoustic contrast is maximized when q is proportional to the eigenvector corresponding to the maximal eigenvalue of the matrix (ZdHZd)−1ZbHZb [7]. To avoid ill-conditioning when calculating the inverse of ZdHZd in real applications, a regularization parameter λ is added to each diagonal element of ZdHZd. Consequently, the optimal source strength vector is proportional to the eigenvector corresponding to the maximal eigenvalue of the matrix
( Z d H Z d + λ I ) 1 Z b H Z b ,
where I denotes the Ns × Ns identity matrix. In practice, the regularization parameter λ is commonly selected as a scaled value of the maximum eigenvalue of ZdHZd, with the scaling factor chosen to balance acoustic contrast enhancement and the required array effort [22,23]. In real applications, the input energy required for the loudspeaker array to generate a designated average SPL in the bright zone should be taken into consideration. The normalized array effort is defined as
AE = 10 log 10 q H q q ref H q ref ,
where qHq is the array effort required by the headrest loudspeaker array, and qrefHqref is the array effort required by the two fixed headrest loudspeakers driven with the same magnitude and phase to generate the same average SPL in the bright zone.

3. Experiments in a Car

3.1. Experimental Setup

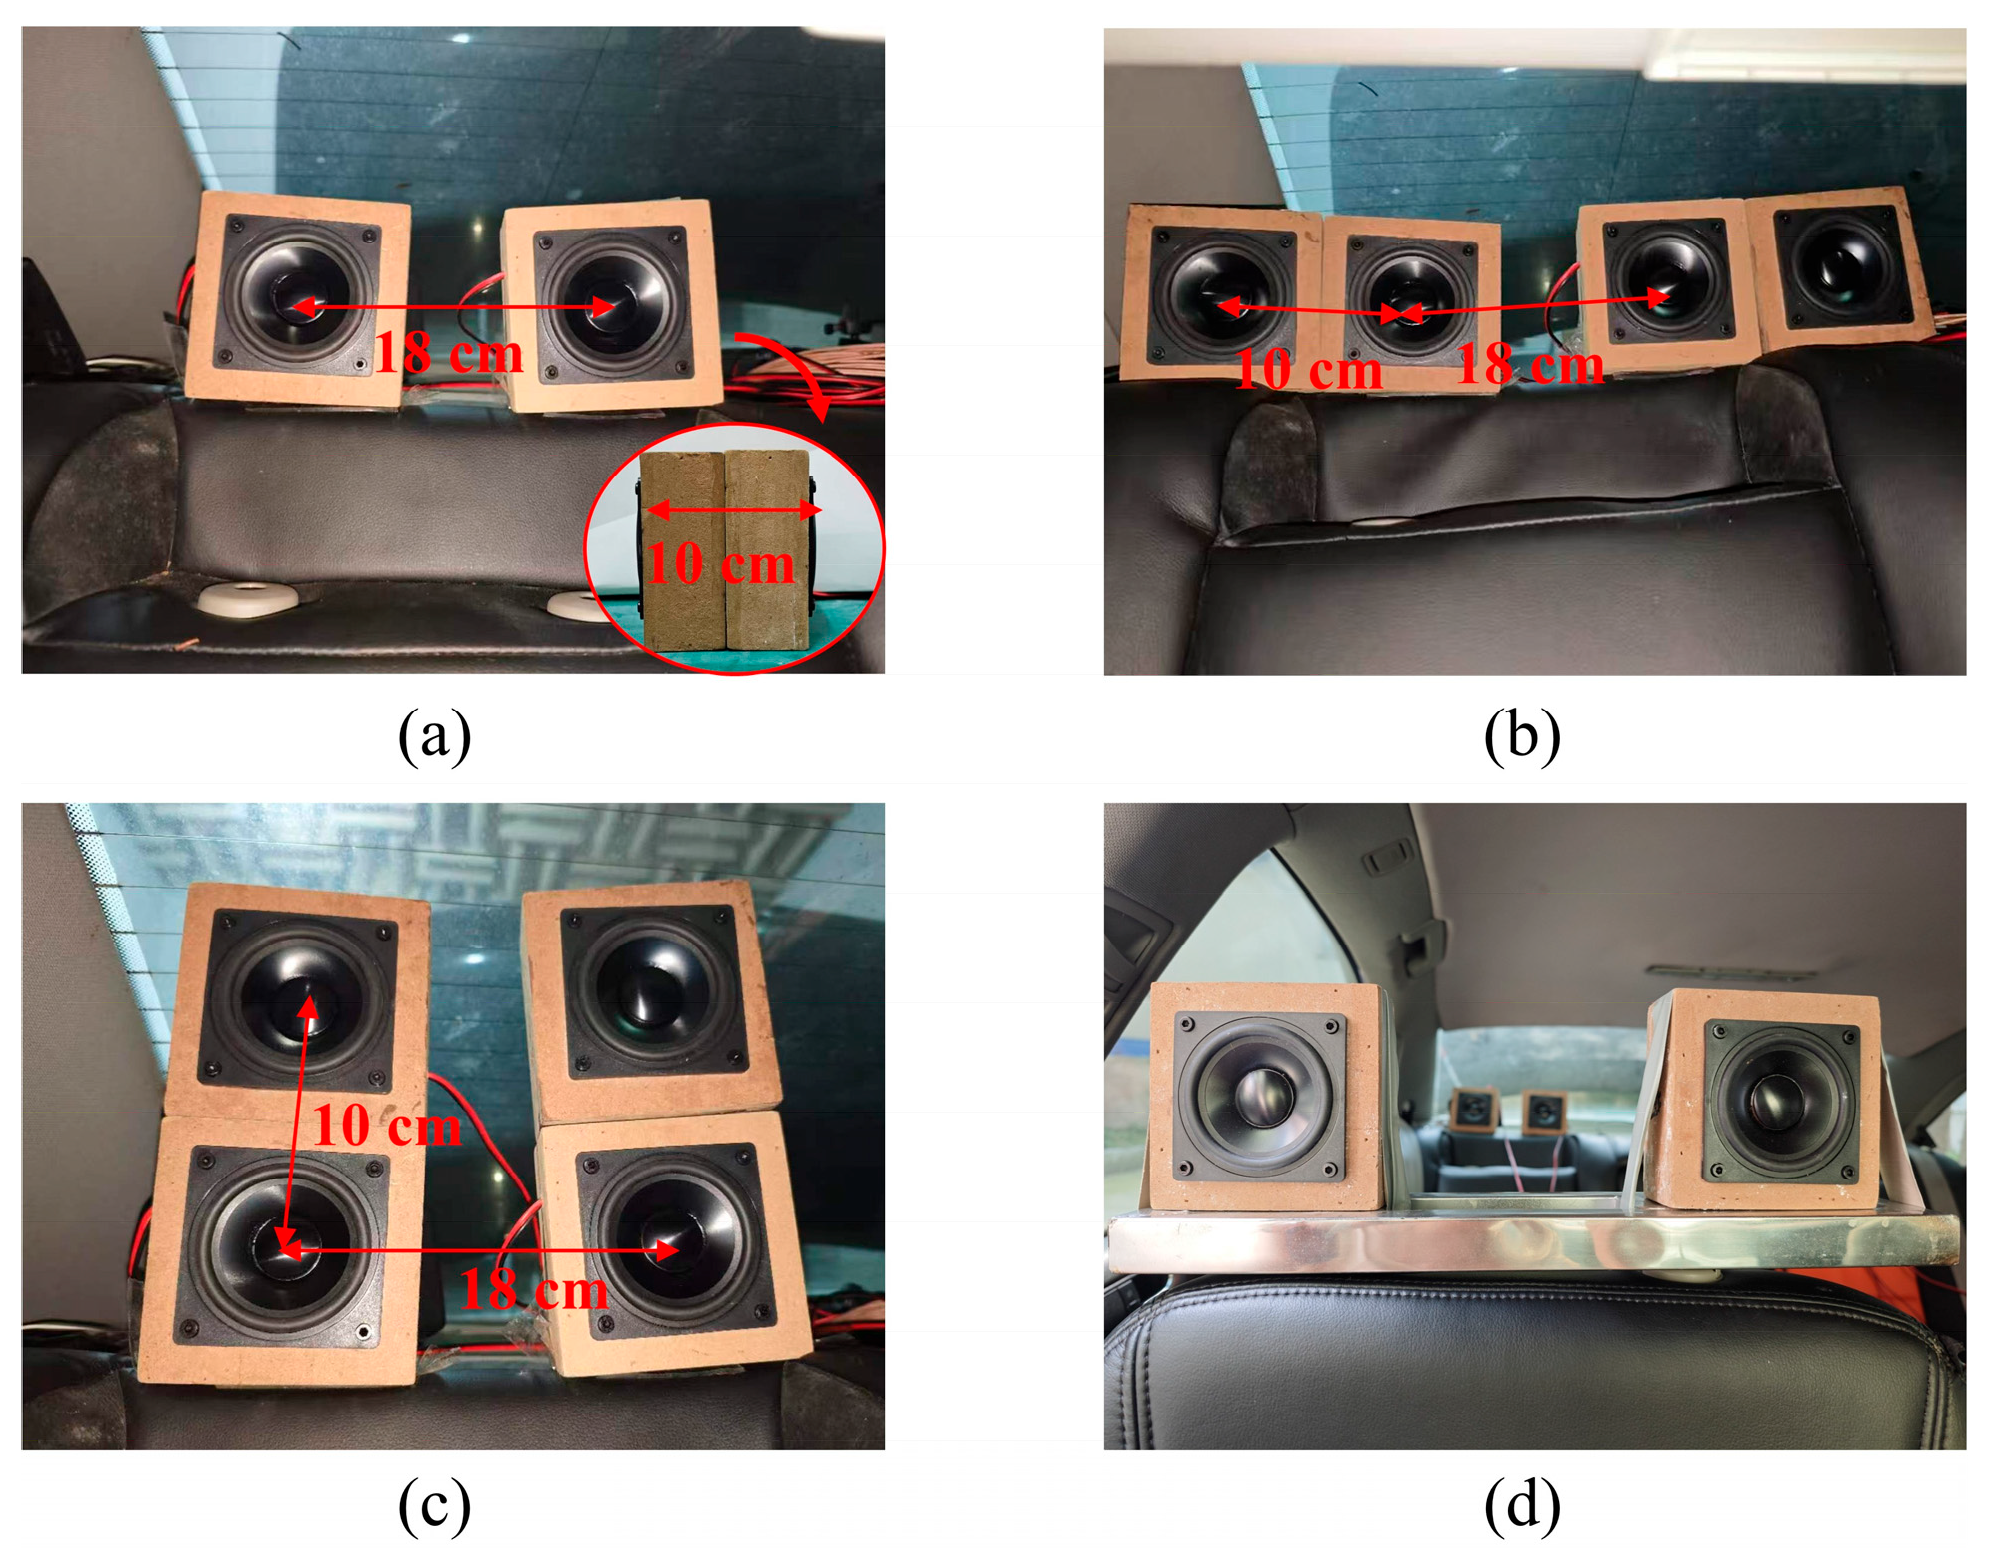
Experiments were conducted in a four-seat car to evaluate the performance of different loudspeaker arrangements. The target frequency range for calculating the acoustic contrast was set to the 1/3-octave bands with center frequencies from 100 to 4000 Hz (88 to 4525 Hz). Figure 2a–c show the experimental setup of three loudspeaker arrangements on the rear-right seat. Each closed-box loudspeaker has dimensions of 10 cm × 10 cm × 5 cm, with a 3-inch loudspeaker driver. The center-to-center spacing of two loudspeakers on one side of the headrest was d = 10 cm, and the spacing between two loudspeakers mounted on different sides of the headrest was l = 18 cm. Figure 2d shows the two-seat arrangement, where the loudspeakers on both the front-right and rear-right seats were oriented toward the front-right seat.
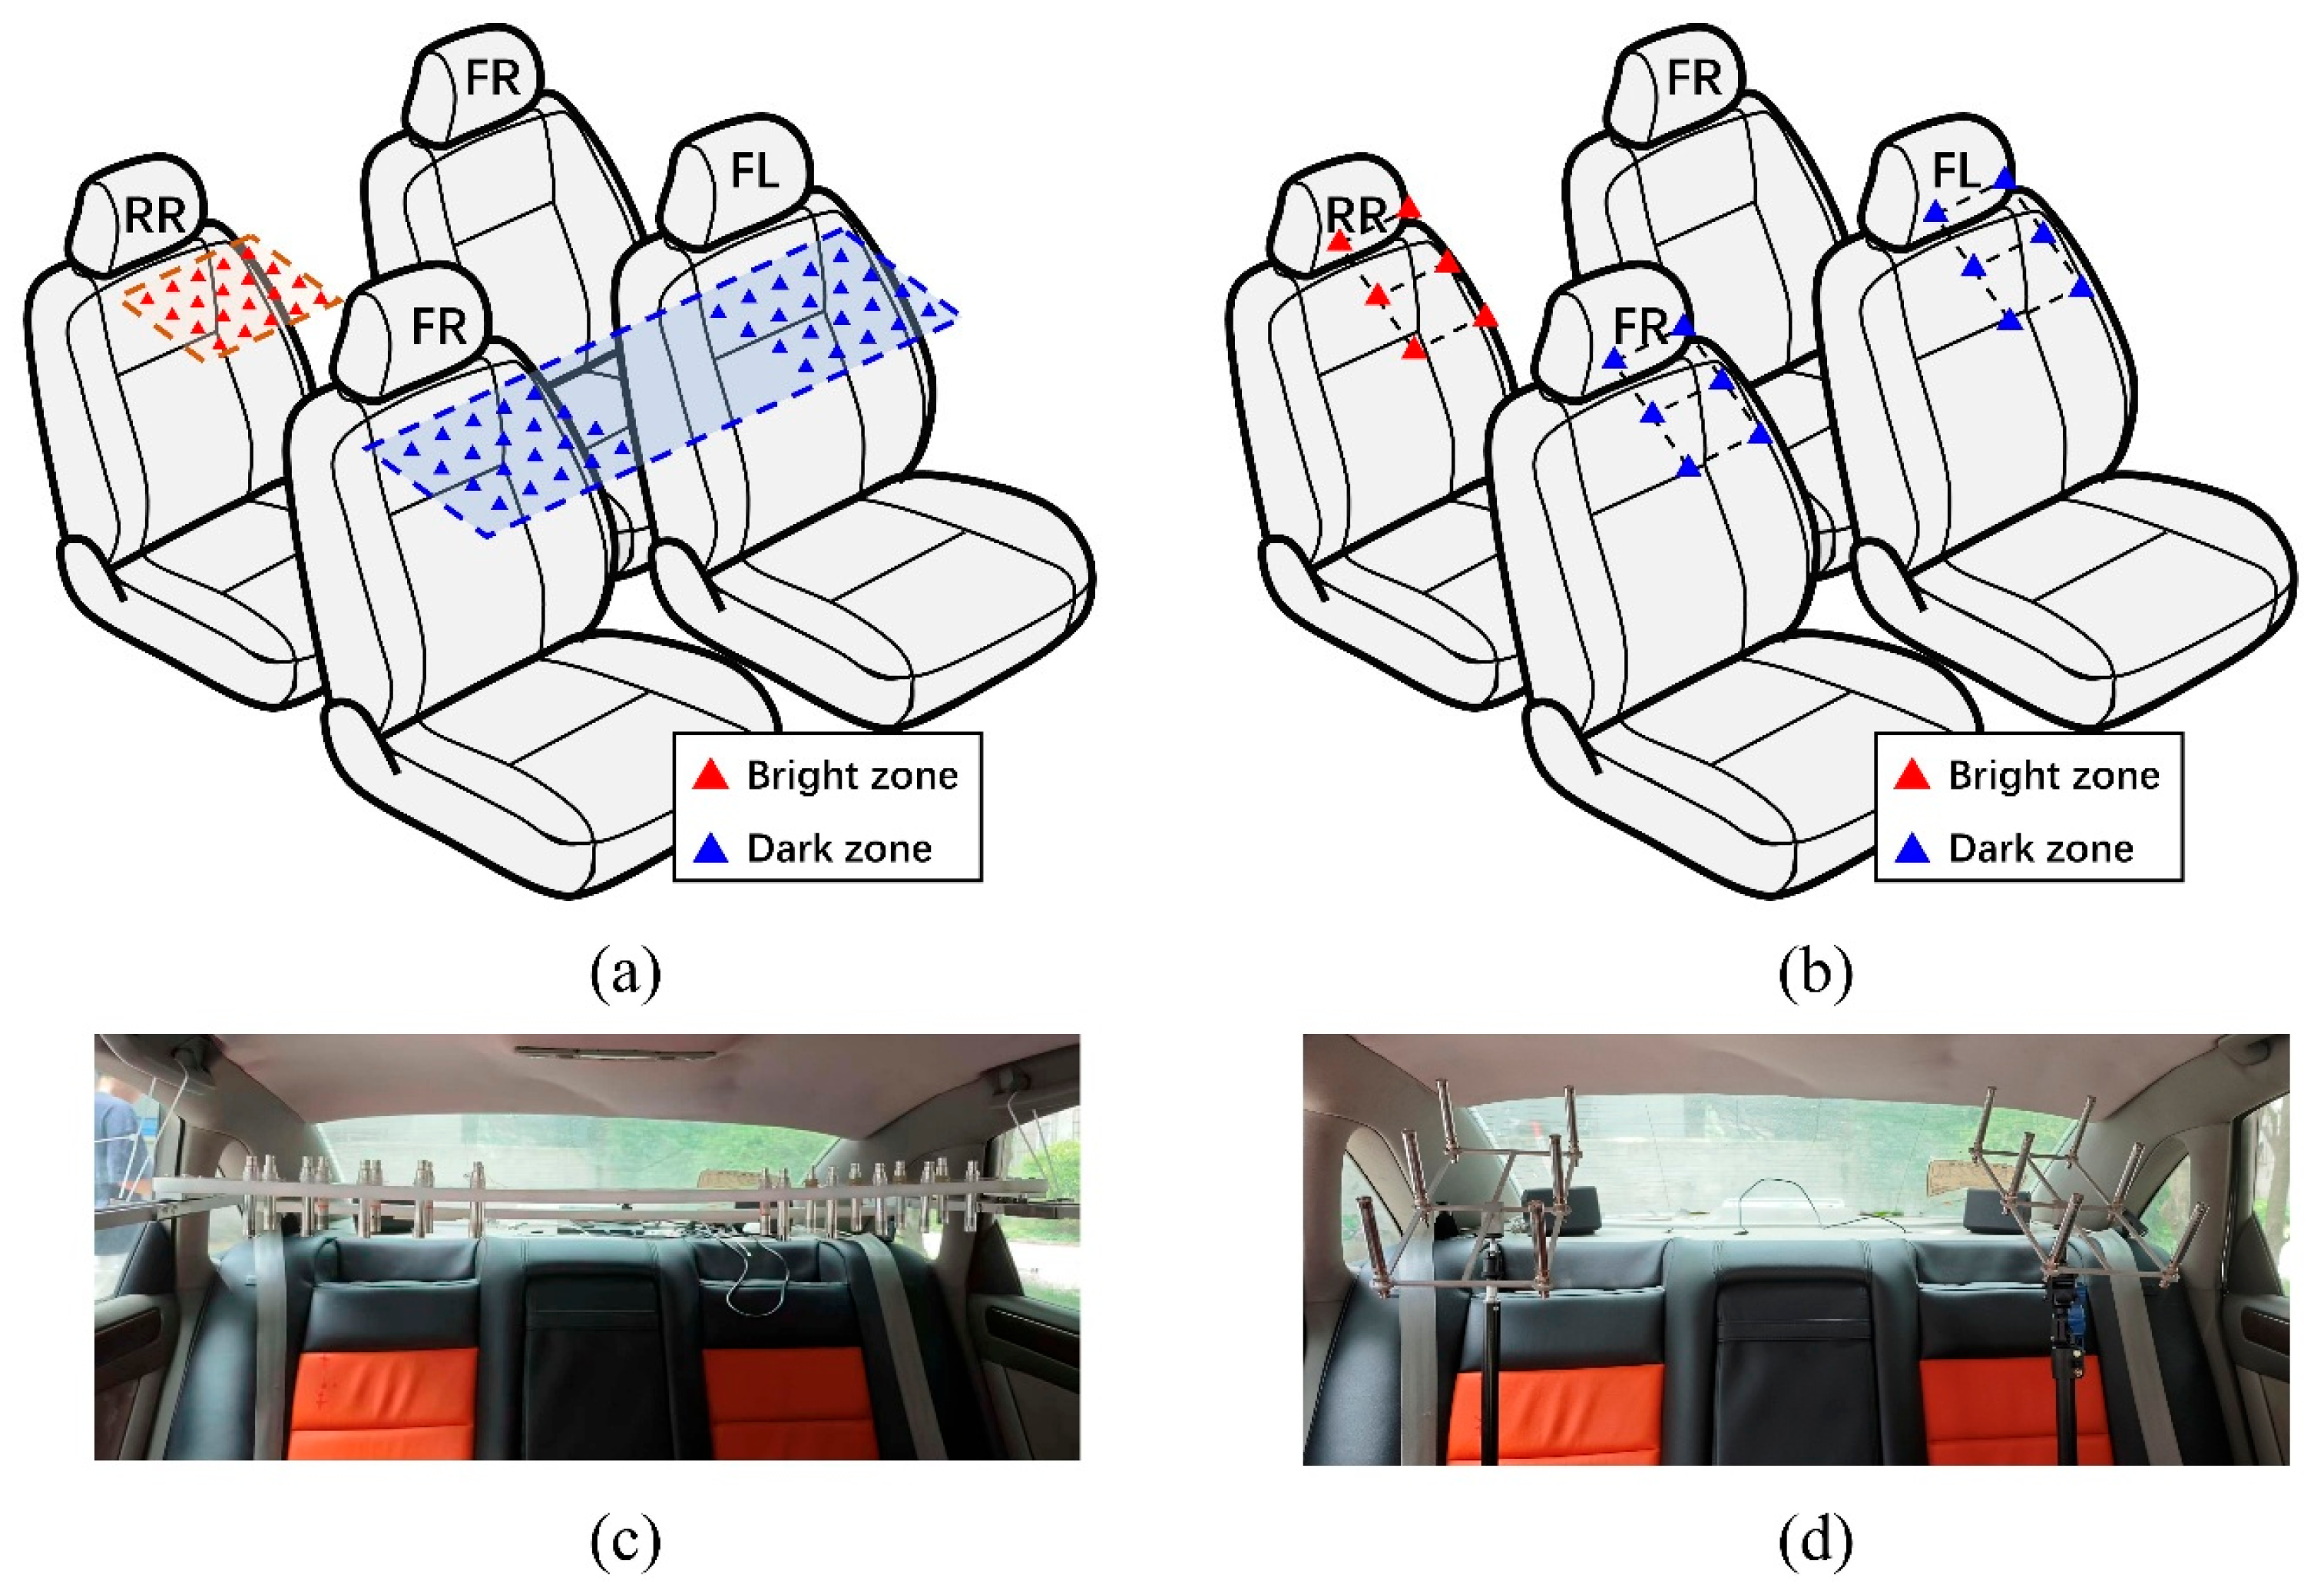
Two control point distributions were considered. As shown in Figure 3a, the first distribution placed all control points on a horizontal plane approximately 20 cm below the roof. The control points in each seat were arranged over a rectangular area of 18 cm × 24 cm, with 20 points spaced 6 cm apart in a grid pattern. Consequently, there were 20 control points in the bright zone (the rear-right seat) and 40 in the dark zone (the front-left seat and the front-right seat). As shown in Figure 3b, the other control point distribution followed the white paper proposed by the Audio Engineering Society for in-car acoustic measurements [21]. In this distribution, a microphone array with 6 microphones was installed in each seat, and there were 6 control points in the bright zone and 12 control points in the dark zone. The electroacoustic transfer functions from the loudspeakers to each control point were measured and used to represent the acoustic impedance. For the horizontal plane distribution, the acoustic impedances of the control points were measured using a linear positioning track equipped with microphones, as shown in Figure 3c. Figure 3d shows the AES six-microphone arrays, where each array was inclined at 30° to the horizontal plane, and the center of each array was 74 cm above the seat cushion.

3.2. Off-Line Simulations

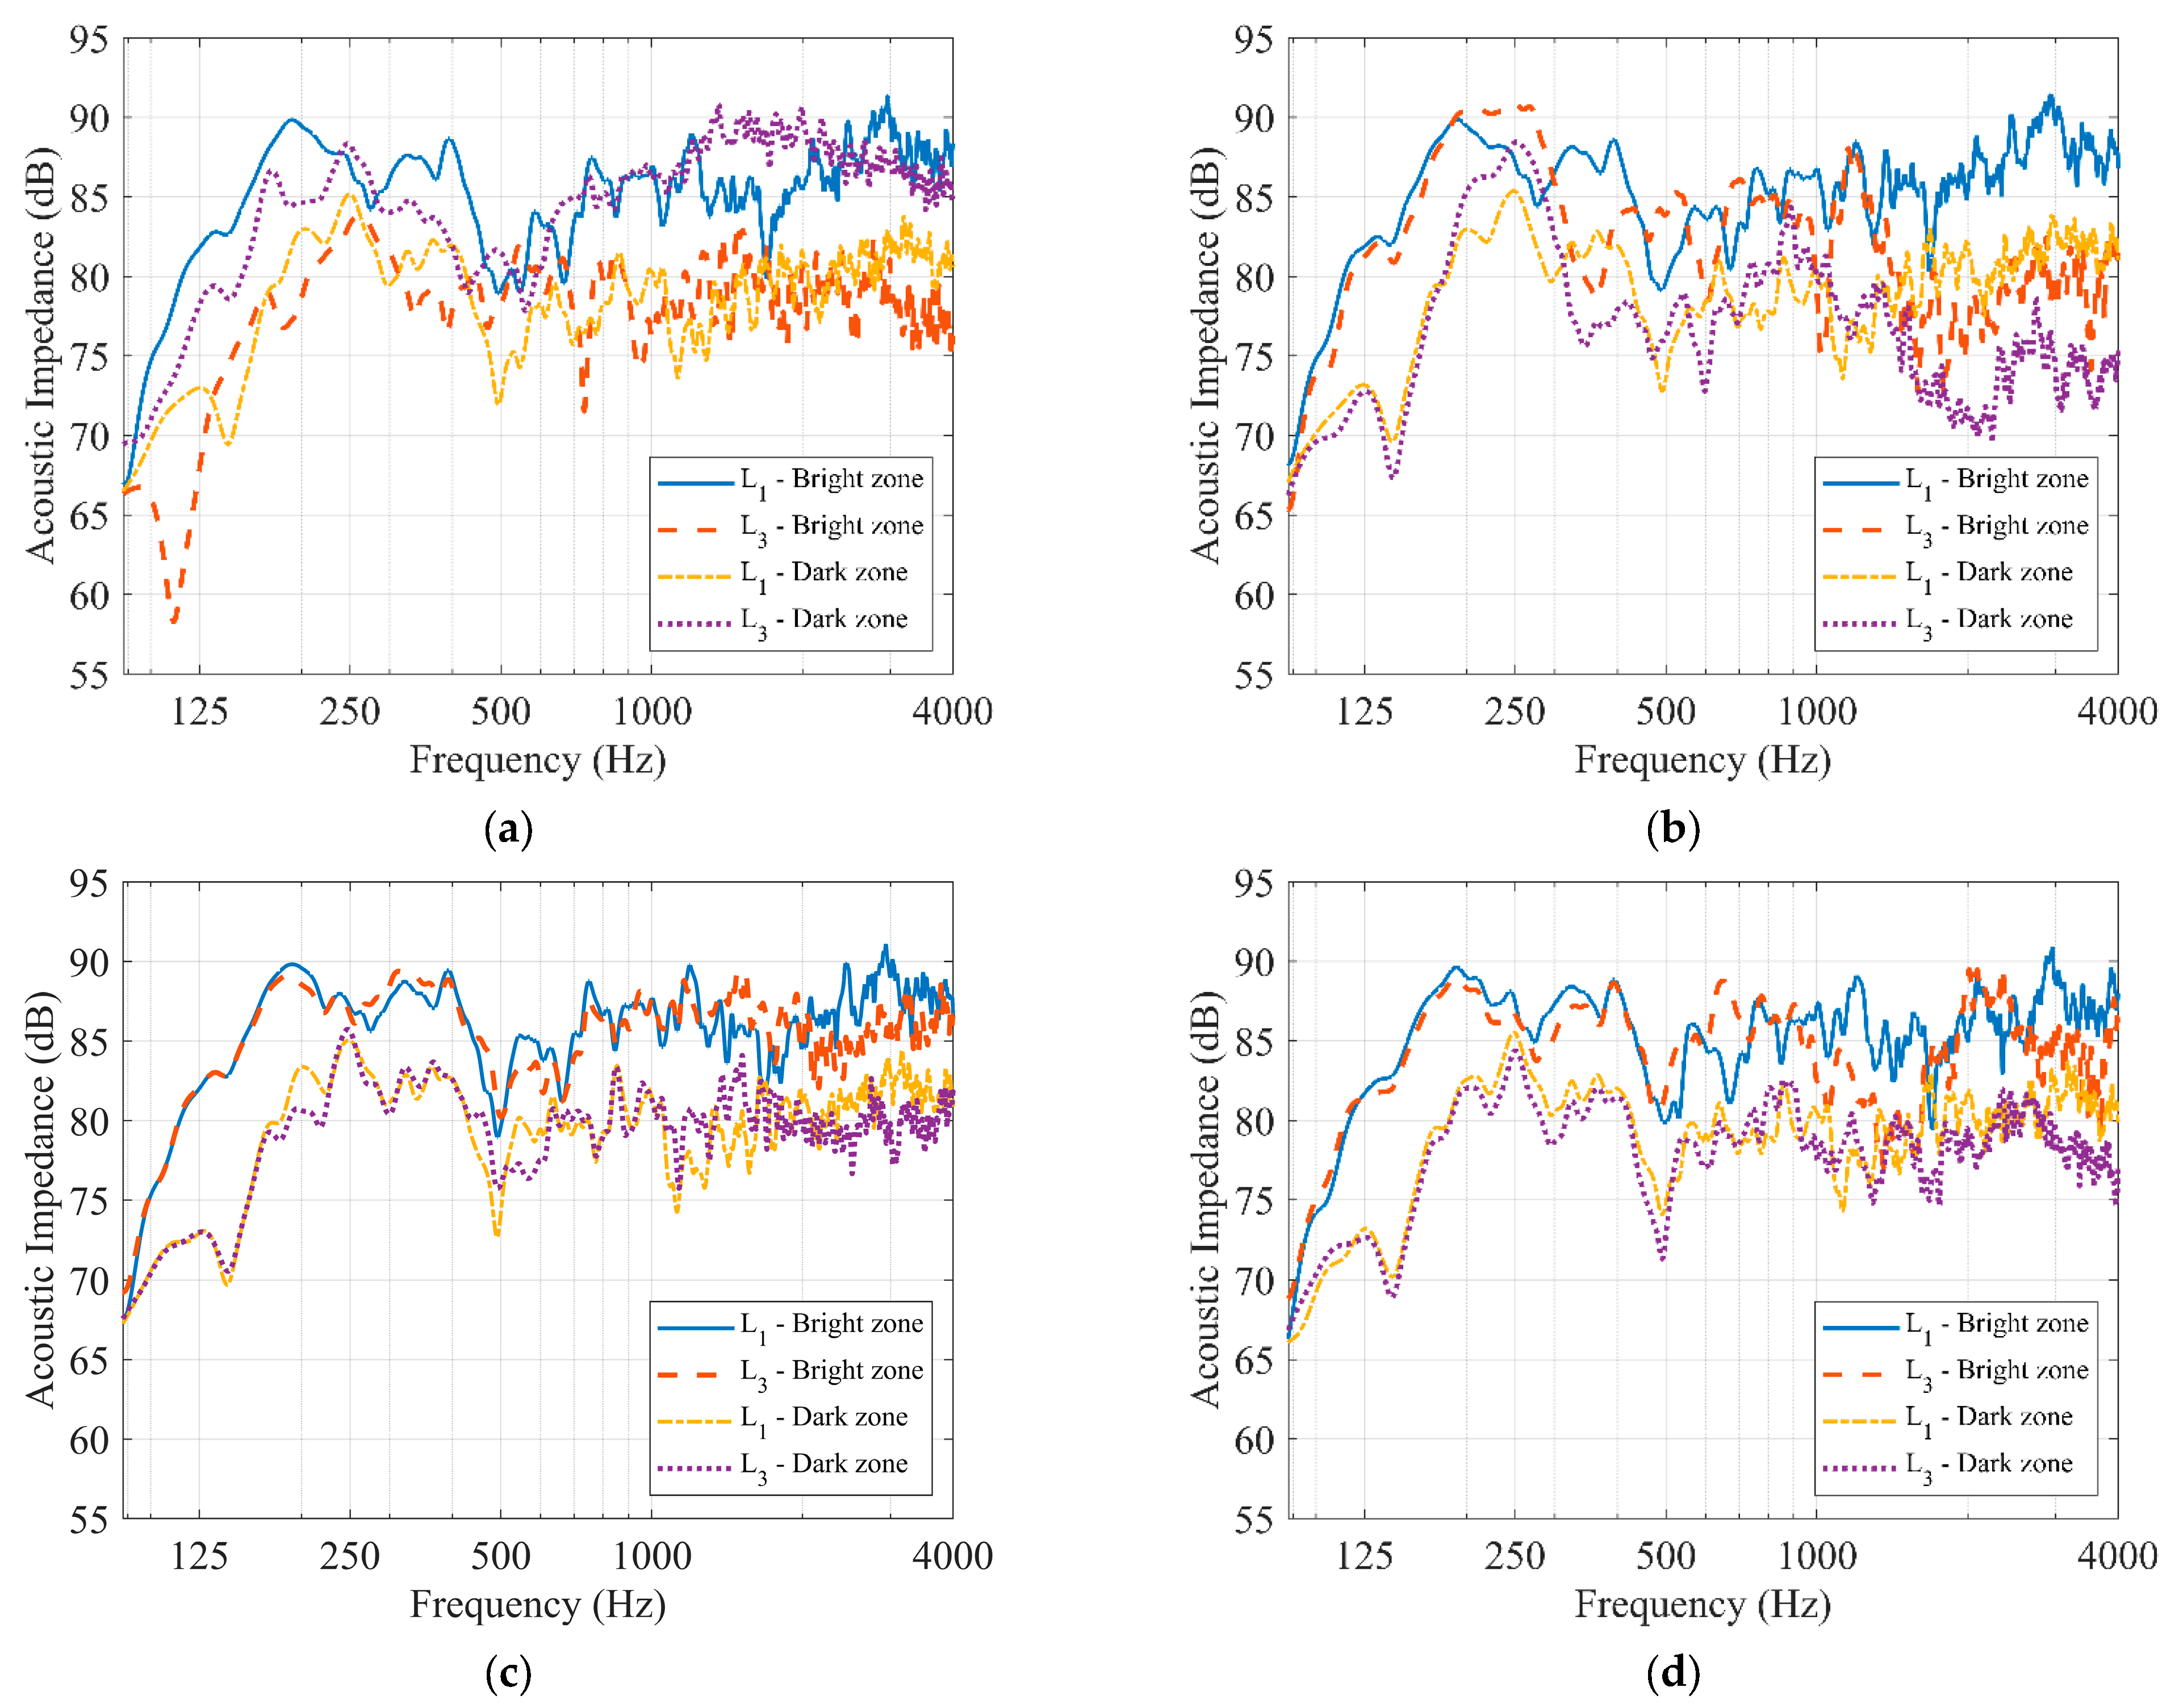
Off-line simulations were conducted based on the measured in-car acoustic impedances. Figure 4 shows the average acoustic impedances from the loudspeakers to the bright and dark zones. For conciseness, only the acoustic impedance curves from loudspeakers L1 and L3 to the horizontal control points are presented. Under the two-seat arrangement, the acoustic impedance from L1 to the bright zone is larger than that from L3, whereas the acoustic impedance from L1 to the dark zone is smaller, because L1 is closer to the bright zone and L3 is closer to the dark zone. When all loudspeakers are distributed in the rear-right seat, the acoustic impedance curves of L1 and L3 are nearly identical below 600 Hz for both the vertical and lateral horizontal arrangements. However, for the longitudinal horizontal arrangement, the curves of L1 and L3 are similar below 200 Hz and exhibit increasing discrepancies with increasing frequency. This can be attributed to the fact that the back-facing loudspeaker L3 faces the rear window, and reflections from the window affect its radiated sound field. Additionally, the measured impedance of the fixed loudspeaker L1 varies slightly across arrangements, presumably due to neighboring loudspeakers and minor variations in placement.
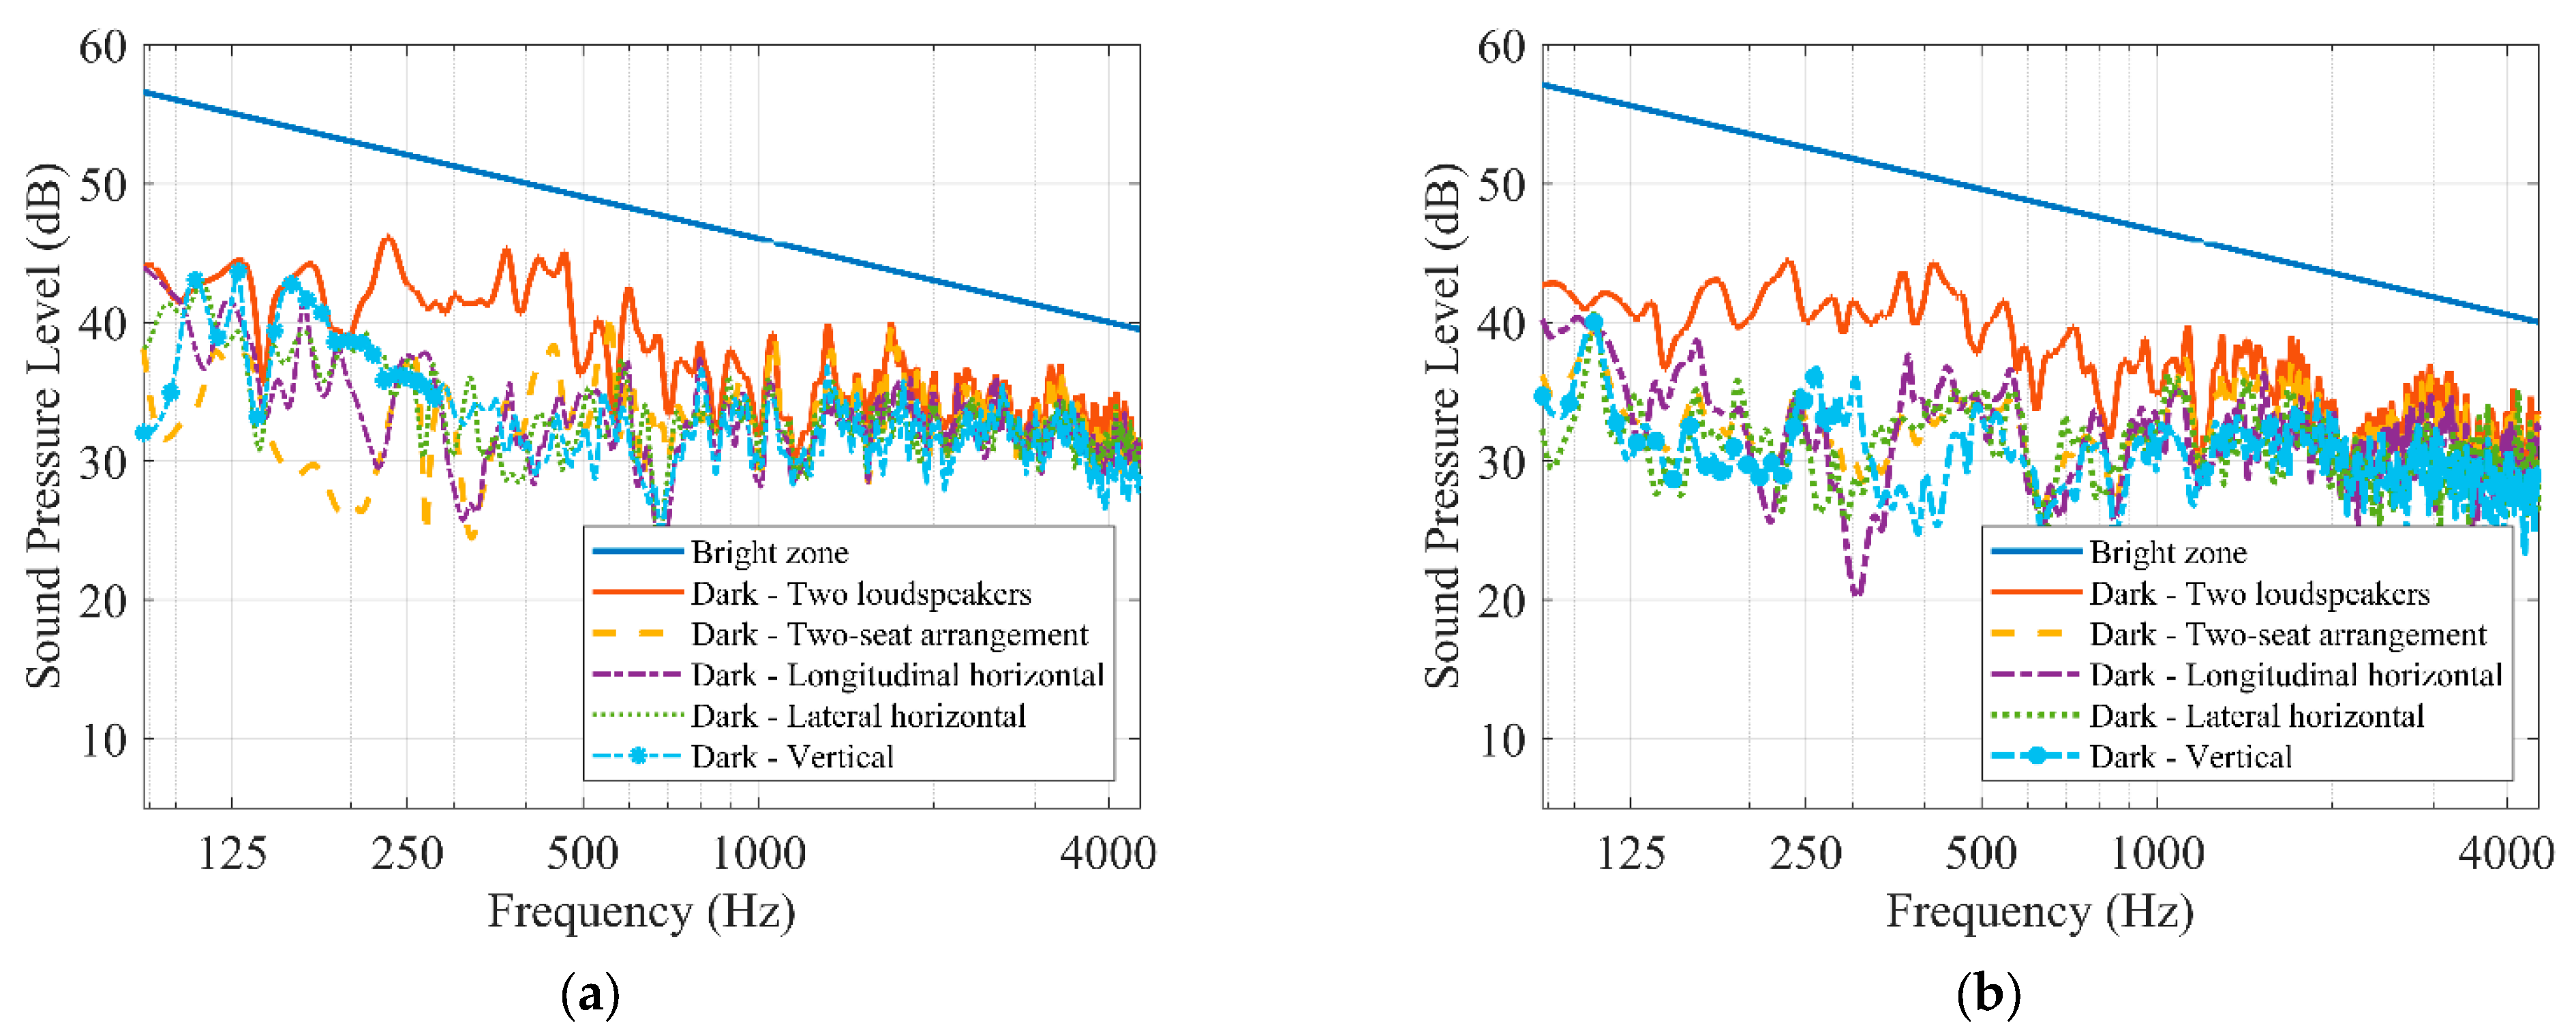
Figure 5 shows the spatially averaged SPL spectra in the bright and dark zones when different loudspeaker arrangements are used. When calculating the optimal source strength vector, the regularization parameter was chosen as 10−5 times the maximum eigenvalue of the matrix ZdHZd in Equation (3). To ensure a fair comparison between different loudspeaker arrangements, the source strengths were adjusted to match a pink-noise spectrum in the bright zone. Figure 5 indicates that, compared with using only two loudspeakers, employing four loudspeakers primarily suppresses the SPL at frequencies below 800 Hz, regardless of the loudspeaker arrangement or control point distribution. Among the different loudspeaker arrangements, the dark-zone SPL spectra for the two-seat arrangement are nearly identical to those of using two loudspeakers at frequencies above 800 Hz, while the three single-seat four-loudspeaker arrangements still exhibit a slight reduction in dark-zone SPL at high frequencies.
Table 1 summarizes the simulated optimal overall acoustic contrast over the 88–4525 Hz band for different loudspeaker arrangements. When control points are distributed on a horizontal plane, the longitudinal horizontal, lateral horizontal, and vertical arrangements achieve an acoustic contrast of 12.6 dB, 12.7 dB, and 13.1 dB, respectively, showing improvements of 3.7 dB, 3.8 dB, and 4.2 dB compared to using two headrest loudspeakers in the rear-right seat. Compared to the two-seat arrangement with four headrest loudspeakers in the rear-right and front-right seats, these three arrangements further improve the overall acoustic contrast by 0.8 dB, 0.9 dB, and 1.3 dB, respectively.
Further observations in Table 1 reveal that when control points are distributed according to the AES six-microphone configuration, the longitudinal horizontal, lateral horizontal, and vertical arrangements achieve an acoustic contrast of 14.4 dB, 15.0 dB, and 15.9 dB, respectively. For each loudspeaker arrangement, the acoustic contrast under the AES six-microphone configuration exceeds that achieved with control points on a horizontal plane. This improvement can be attributed to the reduced number of control points in the dark zone under the AES configuration. Across both configurations, the vertical arrangement still achieves the maximum acoustic contrast of 15.9 dB, which is 5.9 dB and 2.6 dB higher than that achieved using two loudspeakers and the two-seat arrangement, respectively. For simplicity, the following discussion focuses mainly on the acoustic contrast performance when the control points are distributed on a horizontal plane.
It should be noted that, in the two-seat arrangement considered in the main comparison, the front-seat loudspeakers were oriented forward, which was selected as a practical baseline configuration and is consistent with common forward-facing loudspeaker mounting practice. However, the acoustic contrast of the two-seat arrangement can be further affected by the orientation of the front-seat loudspeakers. To examine this effect, additional measurements were conducted, in which the electroacoustic transfer functions were measured for different front-seat loudspeaker orientations while the rear-seat loudspeakers were kept unchanged. The results showed that orienting the two front-seat loudspeakers backward increased the overall acoustic contrast by 1.1 dB compared with the baseline forward-facing configuration. Therefore, the comparison in this study should be interpreted relative to the practical two-seat baseline configuration, rather than to all possible optimized two-seat configurations. Nevertheless, the single-seat arrangement remains a compact and effective solution under the investigated real vehicle constraints.
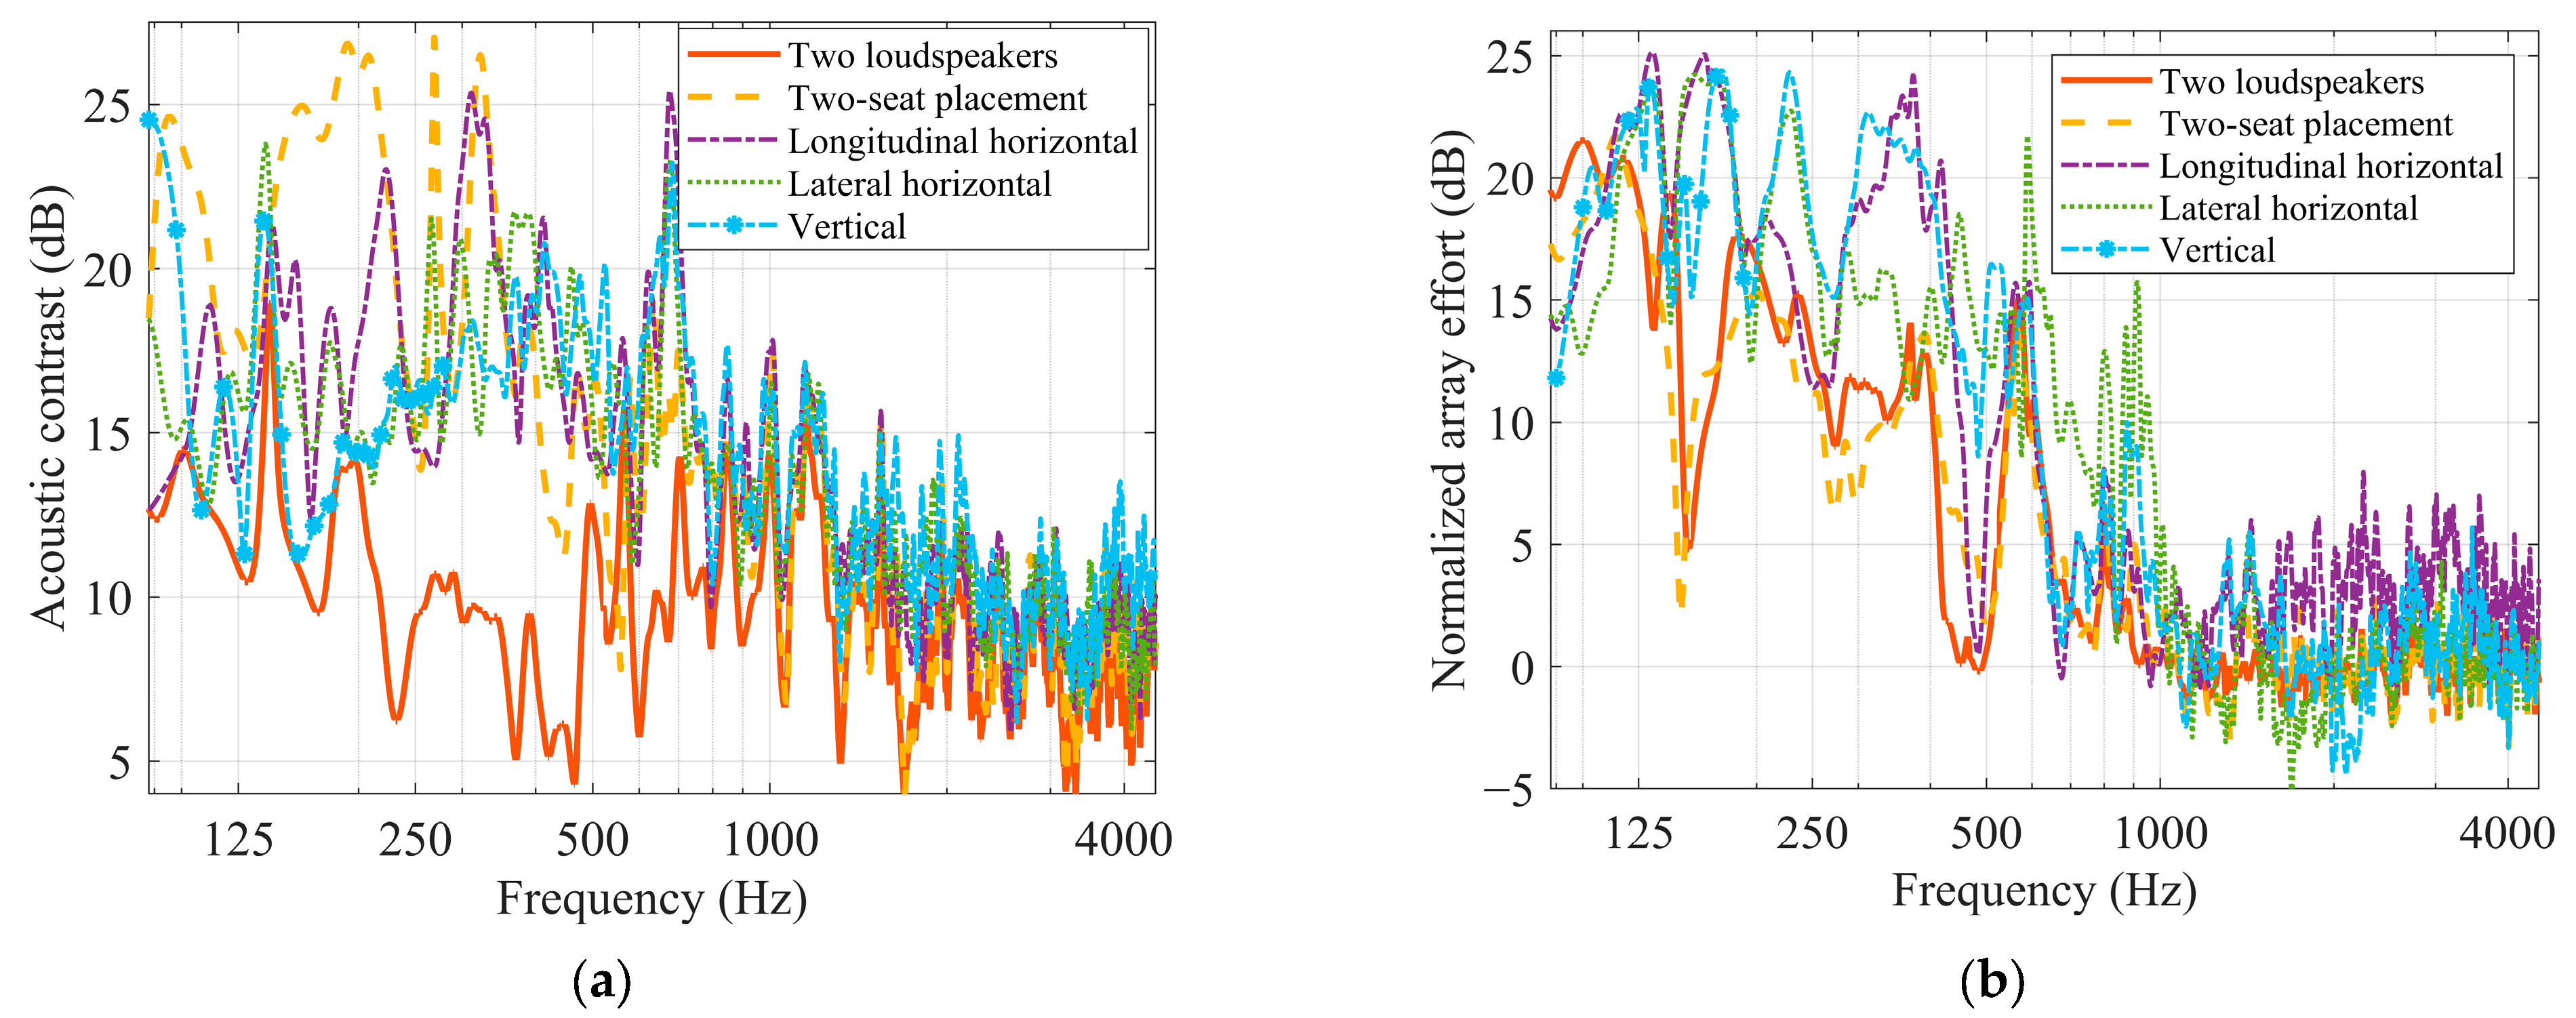
Figure 6 shows the acoustic contrast spectra and the required array effort for different loudspeaker arrangements. Below 800 Hz, all three single-seat arrangements and the two-seat arrangement achieve an average acoustic contrast enhancement of approximately 6 dB over that achieved using only two loudspeakers. Above 800 Hz, the acoustic contrast of the two-seat arrangement is nearly identical to that of the two-loudspeaker case, whereas the single-seat four-loudspeaker arrangements still yield a slight improvement of 2–3 dB compared to the two-loudspeaker case. As a trade-off, the three single-seat four-loudspeaker arrangements require higher array effort at most frequencies compared to the two-loudspeaker configuration, whereas the array effort required by the two-seat arrangement is nearly the same as that of using only two loudspeakers.
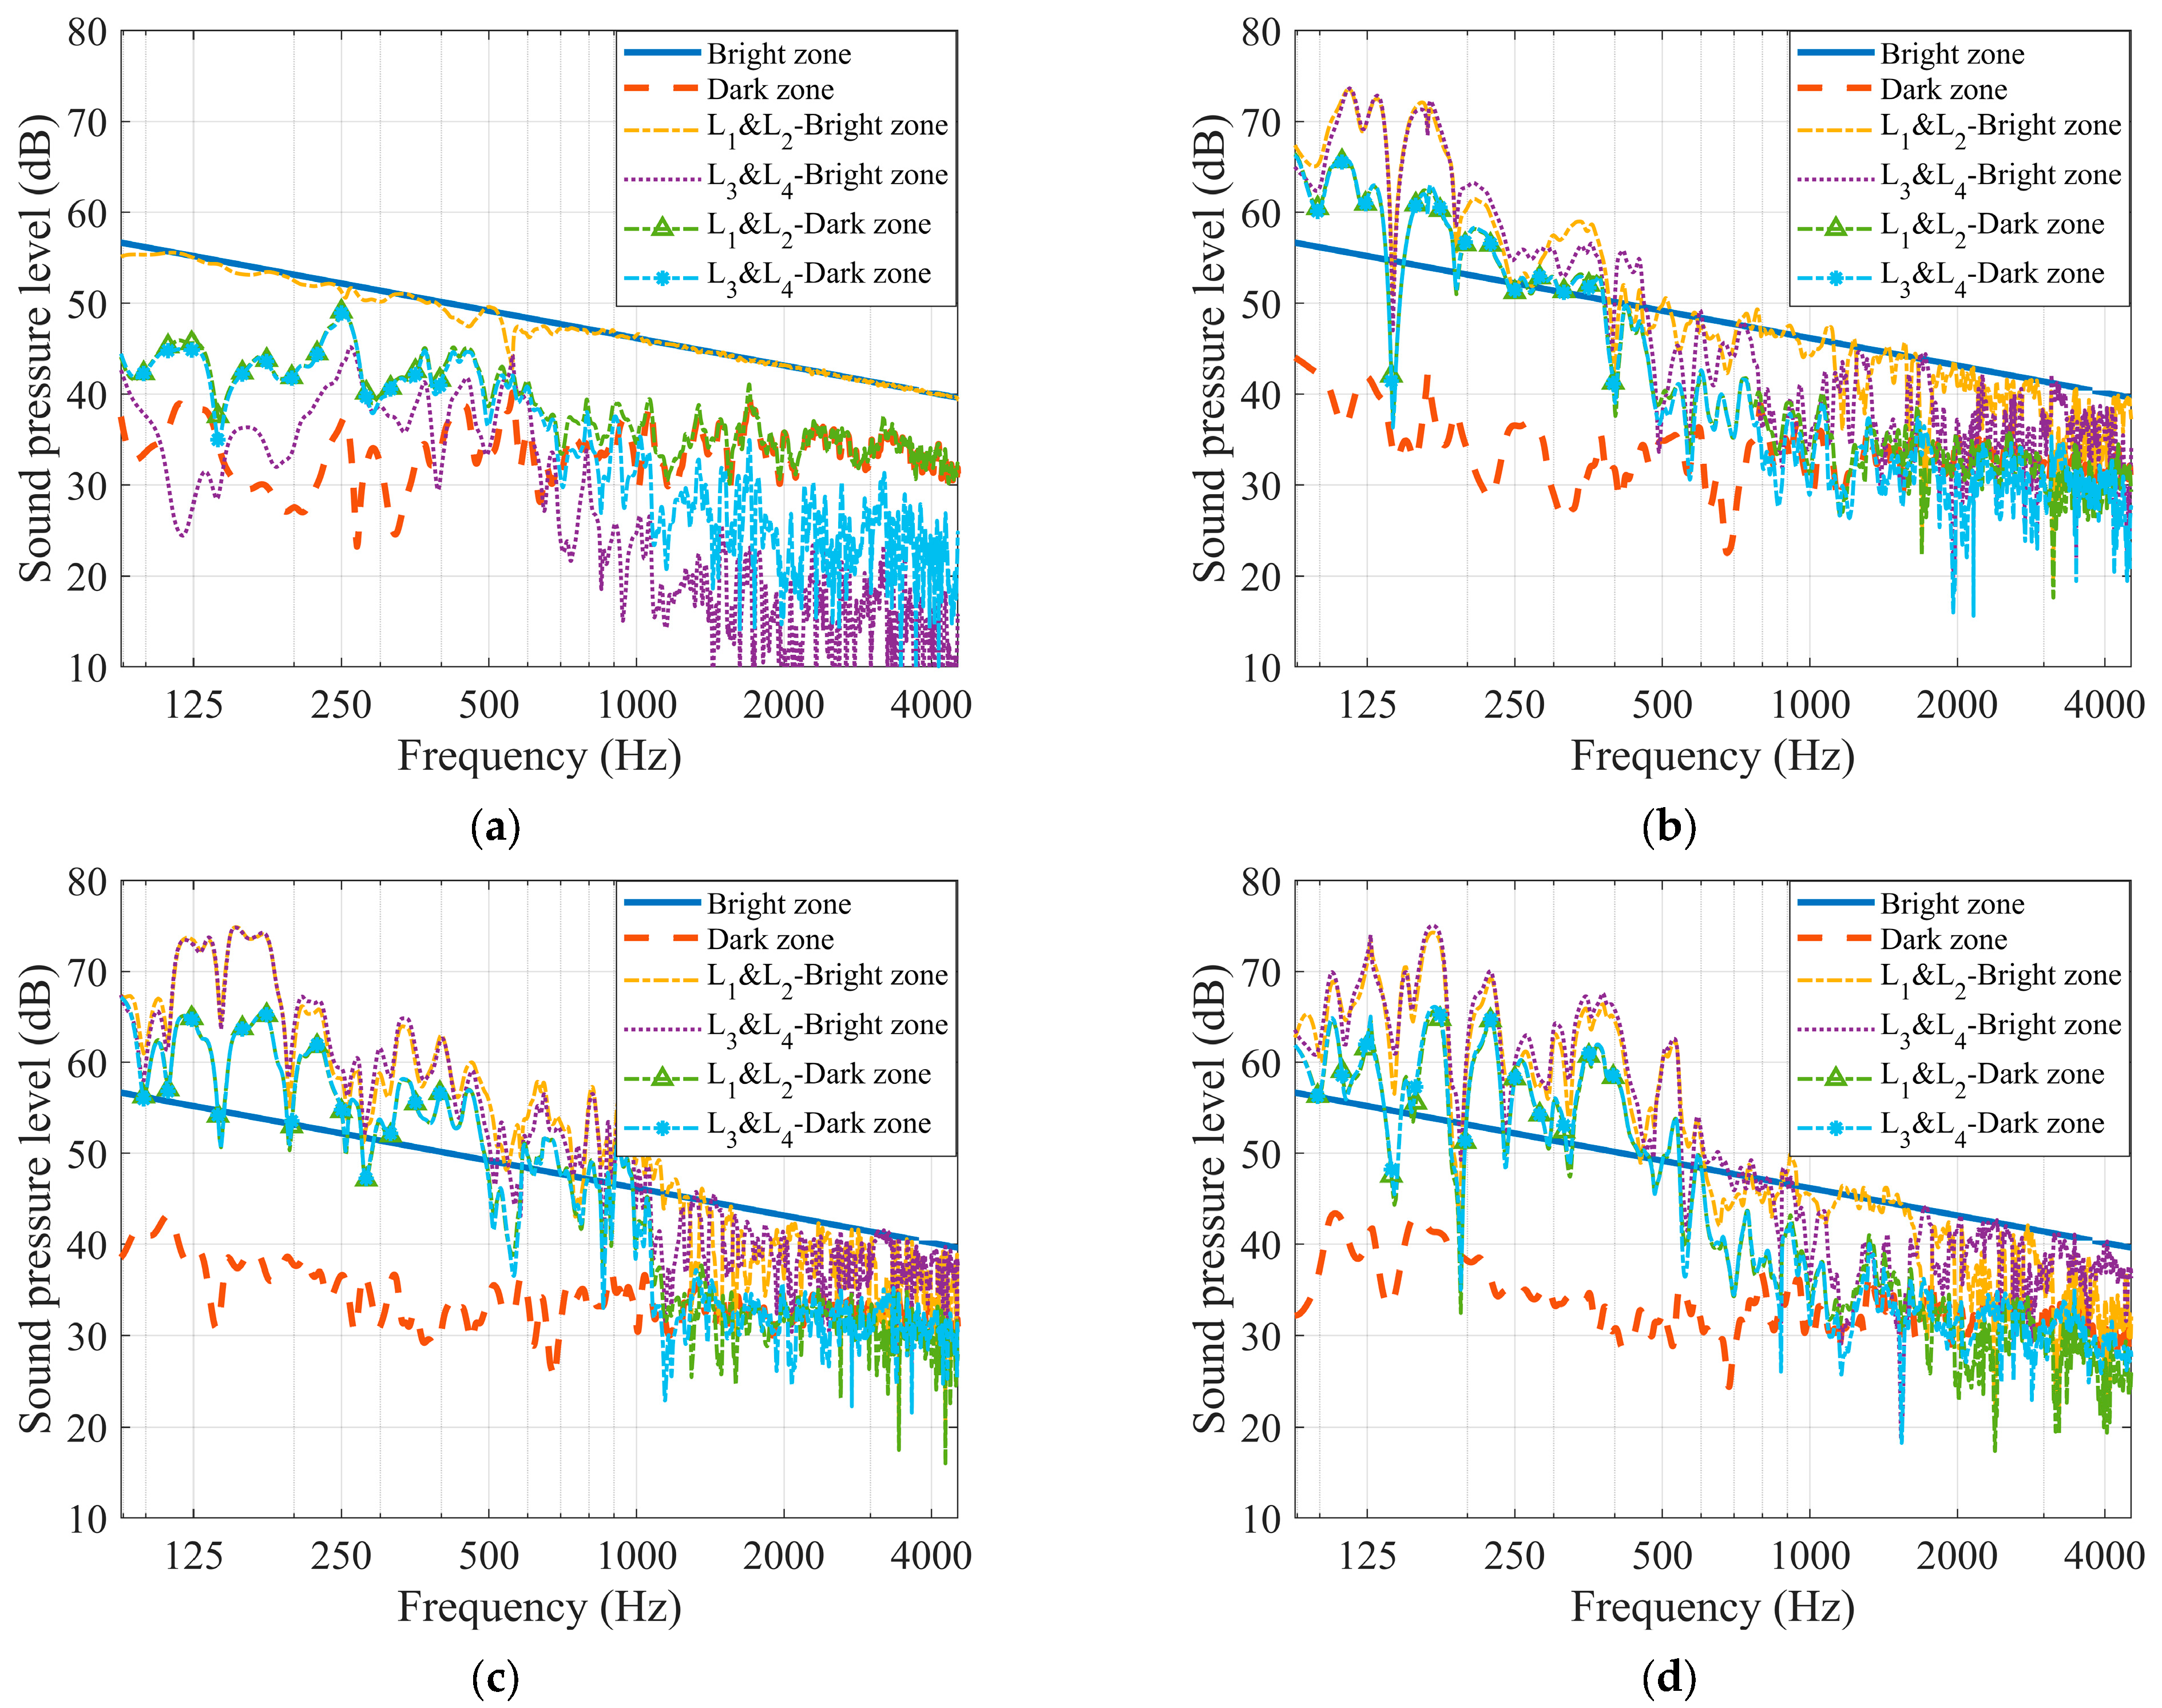
To explain the reasons for the different array effort requirements between the single-seat arrangements and the two-seat arrangement, the individual contributions of the four headrest loudspeakers grouped in pairs are analyzed. As shown in Figure 7a, for the two-seat arrangement, the SPL radiated by L1 and L2 in the bright zone is almost identical to the total SPL of the bright zone, and notably exceeds that radiated by L3 and L4. At frequencies below 800 Hz, the SPL radiated by L1 and L2 in the dark zone is nearly the same as that radiated by L3 and L4, while the SPL radiated by L3 and L4 in the dark zone notably decreases as the frequency increases. In this configuration, loudspeakers L1 and L2, mounted on the rear-right seat, primarily provide the SPL for the bright zone, whereas loudspeakers L3 and L4, positioned on the front-right seat, serve to cancel the SPL radiated by L1 and L2 in the dark zone. Therefore, the array effort required by the two-seat arrangement is nearly identical to that required by using only two loudspeakers. This also explains why, above 800 Hz, the two-seat arrangement achieves nearly the same acoustic contrast as the two-loudspeaker configuration, since the reduced contribution of L3 and L4 in the dark zone limits their cancellation effect at higher frequencies.
By contrast, Figure 7b–d show that when using the single-seat four-loudspeaker arrangements, the SPL radiated by L1 and L2 in the bright zone is comparable to that of L3 and L4 at frequencies below 800 Hz, and is higher than the total SPL resulting from the superposition of the two loudspeaker pairs. In the dark zone, the SPL spectra radiated by L1 and L2 and by L3 and L4 are nearly identical, resulting in a pronounced attenuation of the total SPL after superposition. This is attributed to the fact that when all four loudspeakers are installed on the same seat, the newly added L3 and L4 are separated from L1 and L2 by a short distance of 10 cm. At low frequencies where the sound wavelength is considerably longer than this spacing, L3 and L4 can radiate a sound field in the dark zone that is nearly identical to that of L1 and L2, thereby achieving a high acoustic contrast. Above 800 Hz, the radiated sound fields of individual loudspeakers still provide partial mutual cancellation in the dark zone, thereby slightly improving the acoustic contrast performance. Therefore, mounting multiple loudspeakers in close proximity on a single headrest achieves higher acoustic contrast at frequencies above 800 Hz than distributing them across two separated seats, because the reduced spatial separation enables tighter control over the shorter wavelengths and better leverages local cancellation effects in the dark zone. As a trade-off, the sound field radiated by L3 and L4 in the bright zone is also similar to that of L1 and L2. As a result, L1 and L2 have to generate a sufficiently high sound pressure in the bright zone to ensure that, after cancellation with the sound pressure contributed by L3 and L4, the resulting total SPL in the bright zone remains adequately high. Therefore, a higher array effort is required by the single-seat arrangements compared to the two-seat arrangement at low frequencies.
To further clarify the physical mechanism behind the superior performance of the vertical arrangement, additional free-field simulations have been carried out using ideal point sources while retaining the same source arrangements and control point positions. The results show that the vertical arrangement still achieves the highest acoustic contrast among the tested single-seat four-loudspeaker configurations, indicating that its advantage is related to the spatial radiation and cancellation characteristics of the source configuration itself. Compared with the horizontal arrangements, the vertical arrangement introduces an additional out-of-plane control degree of freedom, and the differential radiation between the upper and lower loudspeakers generates a vertical pressure-gradient, or dipole-like, component. Unlike the horizontal arrangements, whose interference patterns mainly develop within the same horizontal plane as the control points, the vertical arrangement provides a more favorable spatial interference pattern that confines the high-SPL region around the bright zone and reduces sound leakage toward the dark zone. However, this improvement is accompanied by increased array effort, particularly at low frequencies.
The acoustic contrast control algorithm is adopted in this study to investigate the achievable acoustic isolation limits of different headrest loudspeaker arrangements. Since this algorithm maximizes the acoustic contrast between the bright and dark zones without imposing any constraint on the bright-zone sound pressures, the bright-zone sound quality is inevitably compromised. The pressure-matching method addresses this limitation by balancing acoustic contrast and bright-zone reproduction, minimizing the error between reproduced and desired sound pressures while suppressing dark-zone pressure [6]. To examine this trade-off, additional simulations were conducted using measured in-cabin transfer functions to evaluate both acoustic contrast and bright-zone reproduction error under the pressure-matching method. The results showed that the three single-seat four-loudspeaker arrangements achieved comparable acoustic contrast, with the vertical arrangement providing slightly lower reproduction error than the horizontal arrangements in some frequency ranges. Moreover, compared with the two-loudspeaker configuration and the two-seat arrangement, the single-seat four-loudspeaker arrangements achieved higher overall acoustic contrast and lower reproduction error below 800 Hz. However, compared with acoustic contrast control, the pressure-matching method reduced the achievable acoustic contrast while balancing the bright-zone reproduction error. These results indicate that concentrating four headrest loudspeakers on a single seat remains beneficial under the pressure-matching framework, although this benefit comes with a trade-off between acoustic isolation and bright-zone reproduction accuracy.

3.3. Measurement Results

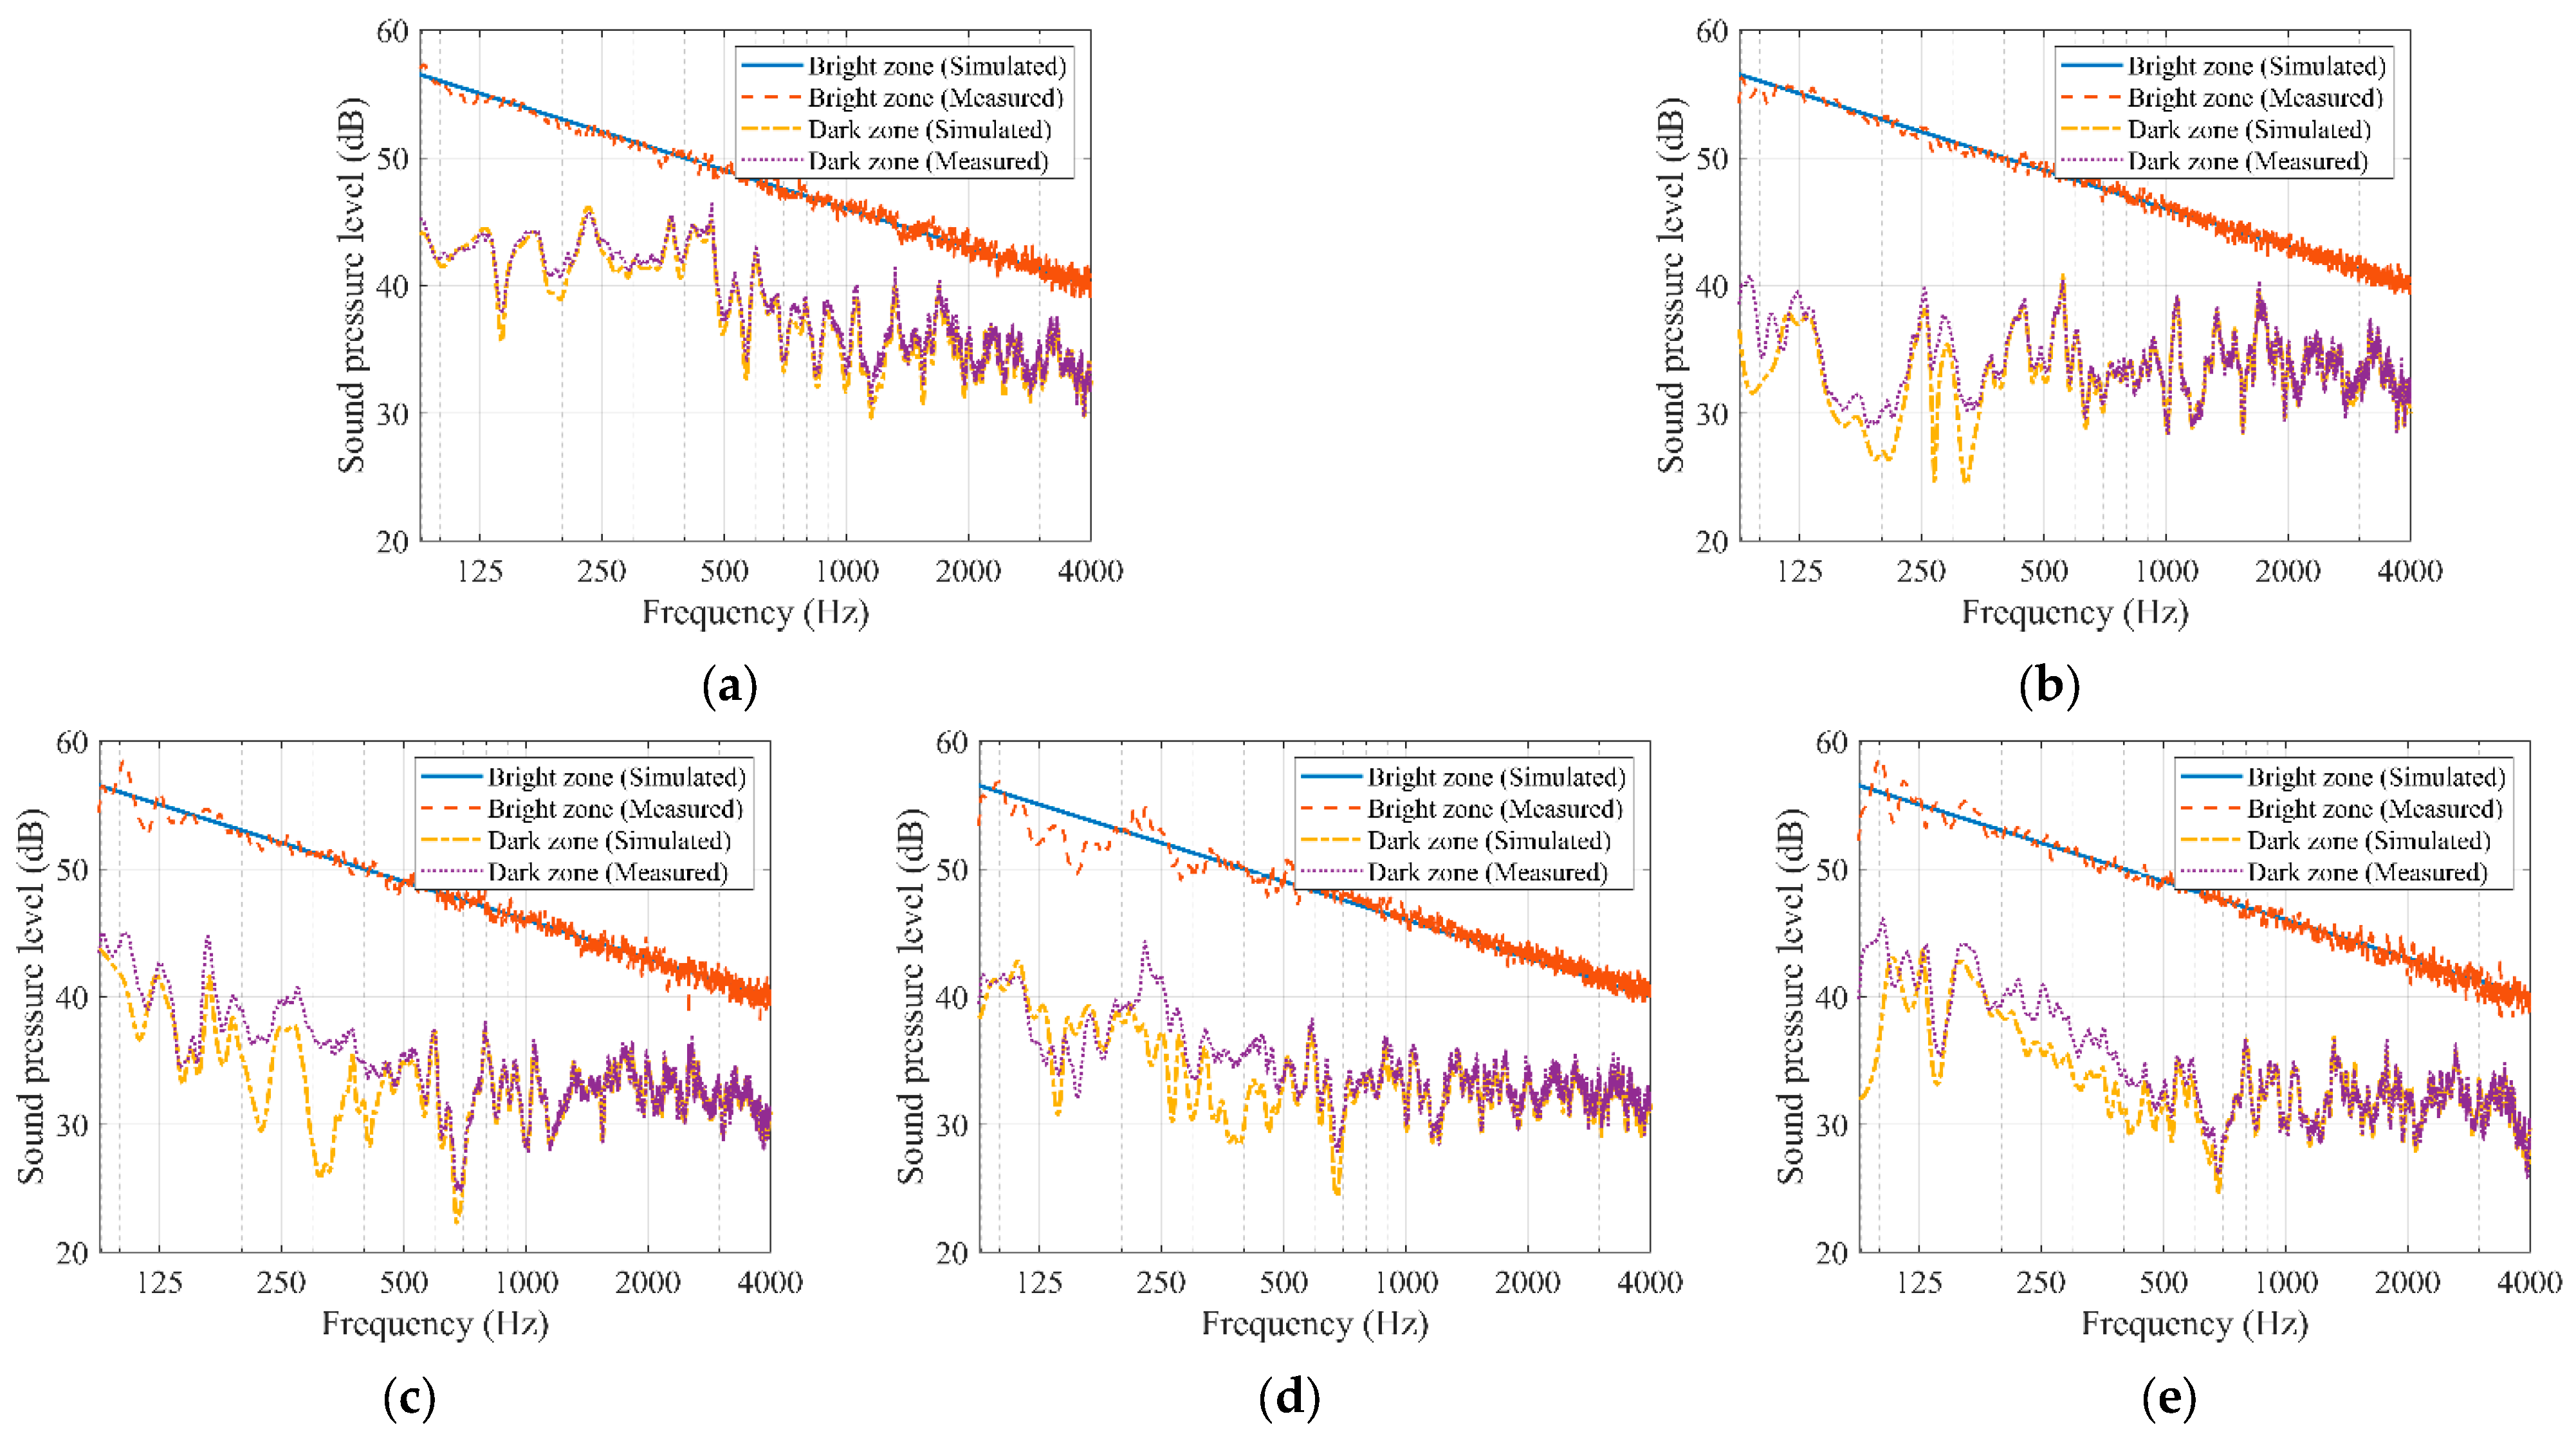
To validate the off-line simulation results, real-time experiments were carried out in the vehicle cabin. The optimal loudspeaker filters were designed using the acoustic contrast control method, and subsequently derived in the time domain via the inverse Fourier transform to enable real-time implementation, yielding 4000-tap FIR filters at a sampling rate of 8000 Hz. Figure 8 shows the measured SPL spectra using different loudspeaker arrangements, together with the simulated results. The experimental results are generally consistent with the simulation results, but there are discrepancies at low frequencies. This may be attributed to the fact that all loudspeaker configurations, especially the three single-seat loudspeaker arrangements, require higher array effort at low frequencies, as shown in Figure 6b, and the mismatch between the loudspeakers’ actual and target outputs significantly affects acoustic contrast performance.
Table 2 shows the measured acoustic contrast in the 88–4525 Hz band in the car. The discrepancy between the experimental and simulated results does not exceed 0.7 dB. In the experiment, the vertical arrangement achieves an acoustic contrast of 12.4 dB, which is 0.4 dB higher than that of the two horizontal placements. Compared with two-loudspeaker and the two-seat arrangements, the vertical arrangement improves the acoustic contrast by 3.9 dB and 0.9 dB, respectively.
It should be noted that the measured differences among some loudspeaker arrangements are relatively small, and practical factors such as window states, temperature variations, and passenger seating positions may affect the acoustic contrast in real applications. Therefore, an additional numerical analysis was conducted using a simplified closed rectangular-cavity model. The optimized source strength vector obtained under the baseline condition was kept unchanged, and the acoustic contrast was recalculated under variations in wall absorption, temperature, and control point positions. The results reproduced the general trend observed in the measurements, and showed that the vertical arrangement maintained the highest acoustic contrast among the tested configurations under the considered perturbations. However, because the model simplifies the actual vehicle geometry and boundary conditions, the results should not be regarded as a universal conclusion for all real-use conditions. Instead, these results suggest that the vertical arrangement is relatively robust within the investigated perturbation range.
Although the experimental results demonstrate that the vertical arrangement provides the highest acoustic contrast among the tested headrest loudspeaker configurations, the optimization of loudspeaker arrangements at other locations and for different vehicle models remains challenging. Across transportation and applied sciences, complex physical parameter prediction is increasingly being addressed by data-driven frameworks, ranging from time–frequency deep learning models [24] to physics-informed neural networks [25] and long-term performance data analysis [26]. While such strategies have been introduced into personal sound zone control [8], their application to loudspeaker arrangement optimization in vehicle cabins remains limited. Future work will explore neural-network-assisted optimization using in-cabin transfer function datasets measured from different vehicle models and candidate loudspeaker locations.

4. Conclusions

This study experimentally investigated the acoustic contrast performance of headrest loudspeaker arrangements for creating rear bright personal sound zones in a vehicle cabin. Three four-loudspeaker arrangements mounted on a single seat were examined and compared against a two-loudspeaker baseline and a four-loudspeaker two-seat distributed configuration. The results demonstrate that all single-seat arrangements achieve overall acoustic contrasts exceeding 12 dB (12.0–12.4 dB) over 88–4525 Hz, improving upon the two-loudspeaker configuration by 3.5–3.9 dB. Furthermore, concentrating four loudspeakers on a single seat enhances acoustic contrast by 0.5–0.9 dB compared to distributing them across two seats. These improvements are attributed to the increased number of control sources and reduced inter-loudspeaker spacing in single-seat arrangements. As a trade-off, the single-seat arrangements require higher array effort than both the two-loudspeaker configuration and the two-seat arrangement. These experimentally validated arrangements are expected to offer practical guidance for automotive headrest loudspeaker design under real vehicle constraints. Future work will investigate acoustic contrast performance enhancement using compact loudspeaker arrays comprising more sound sources.

Author Contributions

Conceptualization, J.T.; methodology, J.T. and R.C.; software, R.C., Z.Z. and Y.Z.; validation, J.T. and R.C.; formal analysis, R.C.; investigation, J.T. and R.C.; resources, J.T.; data curation, R.C., Z.Z. and Y.Z.; writing—original draft preparation, R.C.; writing—review and editing, J.T. and R.C.; visualization, R.C., Z.Z. and Y.Z.; supervision, J.T.; project administration, J.T.; funding acquisition, J.T. All authors have read and agreed to the published version of the manuscript.

Funding

This research is supported by National Natural Science Foundation of China (Grant No. 11874218).

Data Availability Statement

The raw data supporting the conclusions of this article will be made available by the authors on request.

Conflicts of Interest

The authors declare no conflicts of interest.

Abbreviations

The following abbreviations are used in this manuscript:
PSZsPersonal sound zones
SPLSound pressure level

References

  1. Vindrola, L.; Melon, M.; Chamard, J.C.; Gazengel, B. Use of the Filtered-x Least-Mean-Squares Algorithm to Adapt Personal Sound Zones in a Car Cabin. J. Acoust. Soc. Am. 2021, 150, 1779–1793. [Google Scholar] [CrossRef] [Scilit] [PubMed]
  2. Ma, C.; An, Y.; Shen, E.; Yu, D.; Zhang, J. Car Interior Sound Field Zoning Using Optimal Loudspeaker Array and Double Iteration Method. J. Audio Eng. Soc. 2024, 72, 247–256. [Google Scholar] [CrossRef] [Scilit]
  3. Druyvesteyn, W.F.; Aarts, R.M. Personal Sound. J. Acoust. Soc. Am. 1994, 96, 3281. [Google Scholar] [CrossRef] [Scilit]
  4. Lee, T.; Nielsen, J.K.; Christensen, M.G. Towards Perceptually Optimized Sound Zones: A Proof-of-Concept Study. In Proceedings of the 2019 IEEE International Conference on Acoustics, Speech and Signal Processing (ICASSP), Brighton, UK, 12–17 May 2019. [Google Scholar]
  5. Qiao, Y.; Choueiri, E. Performance Optimization of Personal Sound Zones with Crosstalk Cancellation. In Proceedings of the 2023 Immersive and 3D Audio: From Architecture to Automotive (I3DA), Bologna, Italy, 5–7 September 2023. [Google Scholar]
  6. Cheer, J.; Elliott, S.J. A Comparison of Control Strategies for a Car Cabin Personal Audio System. In Proceedings of the Audio Engineering Society 52nd International Conference: Sound Field Control—Engineering and Perception, Guildford, UK, 2–4 September 2013. [Google Scholar]
  7. Choi, J.W.; Kim, Y.H. Generation of an Acoustically Bright Zone with an Illuminated Region Using Multiple Sources. J. Acoust. Soc. Am. 2002, 111, 1695–1700. [Google Scholar] [CrossRef] [Scilit] [PubMed]
  8. Qiao, Y.; Choueiri, E. SANN-PSZ: Spatially Adaptive Neural Network for Head-Tracked Personal Sound Zones. IEEE Trans. Audio Speech Lang. Process. 2025, 33, 2735–2748. [Google Scholar] [CrossRef] [Scilit]
  9. Koyama, S.; Chardon, G.; Daudet, L. Optimizing Source and Sensor Placement for Sound Field Control: An Overview. IEEE/ACM Trans. Audio Speech Lang. Process. 2020, 28, 696–714. [Google Scholar] [CrossRef] [Scilit]
  10. Zhao, S.; Burnett, I.S. Evolutionary Array Optimization for Multizone Sound Field Reproduction. J. Acoust. Soc. Am. 2022, 151, 2791–2801. [Google Scholar] [CrossRef] [Scilit] [PubMed]
  11. Asano, F.; Suzuki, Y.; Swanson, D.C. Optimization of Control Source Configuration in Active Control Systems Using Gram-Schmidt Orthogonalization. IEEE Trans. Speech Audio Process. 1999, 7, 213–220. [Google Scholar] [CrossRef] [Scilit]
  12. Khalilian, H.; Bajić, I.V.; Vaughan, R.G. Towards Optimal Loudspeaker Placement for Sound Field Reproduction. In Proceedings of the 2013 IEEE International Conference on Acoustics, Speech and Signal Processing (ICASSP), Vancouver, BC, Canada, 26–31 May 2013. [Google Scholar]
  13. Cheer, J.; Elliott, S.J.; Simón Gálvez, M.F. Design and Implementation of a Car Cabin Personal Audio System. J. Audio Eng. Soc. 2013, 61, 412–424. [Google Scholar]
  14. Xu, Q.; Wang, S.; Tao, J.; Zou, H.; Qiu, X. Creating Personal Sound Zones in Car Cabins with Active Noise Control. Appl. Acoust. 2025, 235, 110670. [Google Scholar] [CrossRef] [Scilit]
  15. Choi, J.W. Generation of a Near-Field Sound Zone Using Broadside Differential Array. In Proceedings of the 2021 Immersive and 3D Audio: From Architecture to Automotive (I3DA), Bologna, Italy, 8–10 September 2021. [Google Scholar]
  16. Liao, X.; Cheer, J.; Elliott, S.J.; Zheng, S. Design of a Loudspeaker Array for Personal Audio in a Car Cabin. J. Audio Eng. Soc. 2017, 65, 226–238. [Google Scholar] [CrossRef] [Scilit]
  17. Berthilsson, S.; Barkefors, A.; Brännmark, L.J.; Sternad, M. Acoustical Zone Reproduction for Car Interiors Using a MIMO MSE Framework. In Proceedings of the Audio Engineering Society 48th International Conference: Automotive Audio, Munich, Germany, 21–23 September 2012. [Google Scholar]
  18. Elliott, S.J.; Jones, M. An Active Headrest for Personal Audio. J. Acoust. Soc. Am. 2006, 119, 2702–2709. [Google Scholar] [CrossRef] [Scilit] [PubMed]
  19. Chen, R.; Gu, W.; Wang, S.; Tao, J.; Qiu, X. A Method to Design Compound Sound Sources for Low-Frequency Local Sound Control in Car Cabins. Appl. Acoust. 2026, 242, 111091. [Google Scholar] [CrossRef] [Scilit]
  20. Jones, M.; Elliott, S.J. Personal audio with multiple dark zones. J. Acoust. Soc. Am. 2008, 124, 3497–3506. [Google Scholar] [CrossRef] [Scilit] [PubMed]
  21. Audio Engineering Society Technical Committee on Automotive Audio. In-Car Acoustic Measurements; White Paper, Version 1.0; Audio Engineering Society: New York, NY, USA, 2023. [Google Scholar]
  22. Elliott, S.J.; Cheer, J.; Choi, J.W.; Kim, Y. Robustness and Regularization of Personal Audio Systems. IEEE Trans. Audio Speech Lang. Process. 2012, 20, 2123–2133. [Google Scholar] [CrossRef] [Scilit]
  23. Ma, X.; Hegarty, P.J.; Pedersen, J.A.; Larsen, J.J. Impact of loudspeaker nonlinear distortion on personal sound zones. J. Acoust. Soc. Am. 2018, 143, 51–59. [Google Scholar] [CrossRef] [Scilit] [PubMed]
  24. Wang, Y.; Tan, S.; Mu, X.; Zhang, J. A deep full-sequence convolutional neural network for 3D sedimentary microfacies prediction using time-frequency seismic data. Geophys. Prospect. Pet. 2026, 65, 469–477. [Google Scholar]
  25. Zhan, W.; Chen, Y.; Liu, Q.; Li, J.; Sacchi, M.D.; Zhuang, M.; Liu, Q.H. Simultaneous prediction of petrophysical properties and formation layered thickness from acoustic logging data using a modular cascading residual neural network (MCARNN) with physical constraints. J. Appl. Geophys. 2024, 224, 105362. [Google Scholar] [CrossRef] [Scilit]
  26. Li, R.; Prozzi, J.A.; Hong, F. Quantification of Post-Rainfall Moisture Content in Pavement Unbound Layers Using Long-Term Pavement Performance Data. Transp. Res. Rec. 2026, 2680, 660–672. [Google Scholar]
Figure 1. The sketch of the PSZ system in the vehicle cabin using headrest loudspeakers. (The abbreviations “RR”, “RL”, “FR”, and “FL” represent the rear-right seat, the rear-left seat, the front-right seat, and the front-left seat, respectively. The "Bright zone" refers to the target listening area where the acoustic energy is concentrated, whereas the "Dark zone" refers to the quiet area with suppressed sound).
Acoustics 08 00052 g001
Figure 2. Different loudspeaker arrangements in the car cabin: (a) longitudinal horizontal; (b) lateral horizontal; (c) vertical; (d) two-seat arrangement.
Acoustics 08 00052 g002
Figure 3. Two control point distributions and experimental setups: (a) control points on a horizontal plane; (b) AES six-microphone configuration; (c) horizontally movable track with microphones; (d) six-microphone array. (The abbreviations “RR”, “RL”, “FR”, and “FL” represent the rear-right seat, the rear-left seat, the front-right seat, and the front-left seat, respectively).
Acoustics 08 00052 g003
Figure 4. The average acoustic impedance from the loudspeakers to the bright and dark zones when control points are distributed on a horizontal plane: (a) two-seat arrangement, (b) longitudinal horizontal arrangement, (c) lateral horizontal arrangement, and (d) vertical arrangement.
Acoustics 08 00052 g004
Figure 5. The SPL spectra using different loudspeaker arrangements with (a) control points on a horizontal plane and (b) control points distributed according to the AES six-microphone configuration.
Acoustics 08 00052 g005
Figure 6. (a) Acoustic contrast spectrum and (b) array effort spectrum for different loudspeaker arrangements when control points are distributed on a horizontal plane.
Acoustics 08 00052 g006
Figure 7. The radiated SPL by two loudspeaker pairs under the (a) two-seat arrangement, (b) longitudinal horizontal arrangement, (c) lateral horizontal arrangement and (d) vertical arrangement.
Acoustics 08 00052 g007
Figure 8. Simulated and measured SPL spectra for (a) two loudspeakers, (b) two-seat arrangement, (c) longitudinal horizontal arrangement, (d) lateral horizontal arrangement and (e) vertical arrangement.
Acoustics 08 00052 g008
Table 1. Simulated optimal acoustic contrast in the 88–4525 Hz band in the car cabin (dB).
Loudspeaker ArrangementsControl Points on a Horizontal PlaneAES Six-Microphone Configuration
Two loudspeakers8.910.0
Four loudspeakersTwo-seat arrangement11.813.3
Longitudinal horizontal12.614.4
Lateral horizontal12.715.0
Vertical13.115.9
Table 2. Measured and simulated optimal acoustic contrast within the 88–4525 Hz band in the car cabin (dB).
Loudspeaker ArrangementsMeasurementsOff-Line SimulationsError
Two loudspeakers8.58.9−0.4
Four loudspeakersTwo-seat arrangement11.511.8−0.3
Longitudinal horizontal12.012.6−0.6
Lateral horizontal12.012.7−0.7
Vertical12.413.1−0.7
Disclaimer/Publisher’s Note: The statements, opinions and data contained in all publications are solely those of the individual author(s) and contributor(s) and not of MDPI and/or the editor(s). MDPI and/or the editor(s) disclaim responsibility for any injury to people or property resulting from any ideas, methods, instructions or products referred to in the content.