Article

Broadband Acoustic Modal Identification by Combined Sensor Array Measurements

1
College of Logistics Engineering, Shanghai Maritime University, Shanghai 201306, China
2
Key Laboratory of Aerodynamic Noise Control, China Aerodynamic Research and Development Center, Mianyang 621000, China
3
School of Power and Energy, Northwestern Polytechnical University, Xi’an 710072, China
4
School of Civil Aviation, Northwestern Polytechnical University, Xi’an 710072, China
*
Authors to whom correspondence should be addressed.
Acoustics 2025, 7(4), 60; https://doi.org/10.3390/acoustics7040060
Submission received: 20 August 2025 / Revised: 16 September 2025 / Accepted: 22 September 2025 / Published: 23 September 2025

Abstract

This paper proposes a synchronous measurement method for broadband acoustic modal identification based on a combined microphone array, which is capable of overcoming the acoustic modal aliasing issue arising from a limited number of microphones. In the proposed method, the cross-correlation combination of axial and circumferential arrays is performed by utilizing the relevant characteristics of turbulent noise modes, thereby realizing modal identification of turbulent noise in a wide range with a small number of acoustic measurement points. For fast iteration, the modal cross terms are optimized by leveraging the relevant characteristics of turbulent noise modes. This method can effectively distinguish the distribution information of forward- and backward-propagating acoustic modes. The accuracy of the identified acoustic modes is verified through numerical simulations, and the method is experimentally validated using experimental results from an axial flow compressor. The results show that this method can effectively suppress the aliasing problem. Compared with the traditional rotating axial array method, it has higher testing efficiency in circumferential and radial modal identification, requires fewer sound-pressure measurement points, and is more suitable for rapid evaluation of noise reduction designs.

1. Introduction

Ducted broadband noise has gained growing significance in noise reduction strategies for modern civil aviation, particularly as advanced passive absorbers in engine inlets and bypass sections, contemporary fan blade designs, and cut-off arrangements for fan rotors and stators have become standard. To assess and measure broadband noise within ducts, investigating the multi-mode propagation characteristics and the coherence functions between pairwise modes is highly valuable [1,2,3].
Owing to the intricate generation mechanism of broadband noise sources within aero-engines, the measurement and identification of acoustic modes present greater challenges compared to those of tonal noise [4]. Unlike tonal noise—where acoustic energy is primarily concentrated in a handful of dominant modes—the sound energy of turbomachinery turbulent noise is dispersed across all cut-on modes. Consequently, investigating turbulent broadband noise requires identifying all propagating modes and measuring their distribution characteristics. Sijtsma [5] hypothesized that the acoustic field of turbomachines is dominated by a finite set of acoustic modes, and accordingly proposed an acoustic mode identification method based on a non-uniformly spaced microphone array. In this study, a deconvolution algorithm was employed to expand the dynamic response range, thereby mitigating the mutual interference between multiple modes. Compared with the conventional beamforming approach, this method increased the dynamic response range by 10 dB. For the assessment and measurement of broadband noise, it is essential to conduct in-depth investigations into the propagation characteristics and coherence functions of modes within flow ducts, as well as to analyze the error transfer properties during modal identification. Enghardt [6] considered that the turbulent broadband noise still propagates in the form of statistically averaged modal waves inside the turbine duct, and proposed a reference correlation method to identify the broadband acoustic mode [7]. This method leverages measured cross-spectral vectors to derive the amplitude spectra of acoustic modes propagating both downstream and upstream within the duct. It is worth noting that the approach employed by DLR in numerous applications necessitates the deployment of multiple microphone rings, where the number of sensors is proportional to the total count of propagating modes in the duct. As the target frequency rises, a corresponding increase in the number of microphones becomes necessary to achieve accurate decomposition of broadband noise. This needs either an array consisting of a large number of fixed sensors, as employed by Ganz [8] for example, or an array with a smaller number of microphones rotating around the duct axis [9]. Kopiev [10] employed a sparse array comprising 100 microphones to identify and measure the acoustic modes of a turbofan engine. The experiment was conducted in the anechoic chamber of the Russian State University of Technology, and the findings demonstrate that such a sparse microphone array is viable for testing the circumferential modal distribution of next-generation turbofan engines. Bu [11], building on prior research into circumferential modal recognition, proposed a compressive sensing technique tailored for radial modal identification of turbomachines. Notably, even when the number of microphones is drastically reduced, the tonal noise modal distribution measured via this compressive sensing approach maintains high accuracy and can effectively suppress background noise interference [12].
To illustrate how measured modal coherence functions facilitate understanding of spatial noise source distribution, Jürgens [13] presented a refined methodology for broadband noise measurement. When discussing the coherence between the duct sound field and its internal modes, Dyer [14] argued that acoustic modes excited by monopole mass sources at random positions exhibit no statistical correlation., In contrast to Dyer’s conclusion, Michalke [15] pointed out that the sound field produced by random monopoles is fully correlated in the time domain, a property that remains unchanged even in the sound source’s near field. To enable the prediction of such sound field correlation, Michalke put forward an experimental approach relying on cross-spectrum data collected from three microphones. Enghardt [16] and Jürgens [17] used cross-correlation method to investigate the broadband noise modal coherence function in duct with no flow. Researchers artificially constructed a ducted sound field using two rings of loudspeakers, and the resulting data revealed that coherence function values vary significantly across different modal combinations. Tapken [18] developed a duct broadband noise environment by positioning multiple circular arrays of monopole sources on the duct wall. Experiments showed that with 20 rings of monopole sources, the modes in the artificial sound field were entirely incoherent—this observation matches the conclusion drawn by Jürgens [13]. The measured coherence functions between broadband noise modes in flow ducts provide a basis for exploring broadband noise source characteristics—such as the distribution of dominant sources and the properties of each sound source—and enable further research on modal characteristics in airflow ducts with diverse hub ratios [19]. That said, to achieve effective noise reduction in both noise generation and radiation, investigating the coherence of acoustic modes in turbomachinery and the modal distribution of broadband noise is of great significance.
The aim of this study is to provide the modal coherence characteristics measurements of ducted noise in turbomachinery for comparison with models and numerical investigation. Specifically, we examine the modal distribution characteristics of broadband noise and the modal coherence function for sound source distribution models and synthetic sound fields with the broadband modal decomposition. It is anticipated that these findings will enhance the future comprehension of how broadband noise is generated and provide a reference for designing broadband noise reduction strategies in turbomachinery. This paper is structured as follows: Section 2 focuses on measurement theory, including content related to the modal coherence coefficient, specifics of synthetic sound fields, and ducted sound source distribution models; Section 3 describes the characteristics of the synthetic sound fields; Section 4 presents the experimental facility, experimental setup, and the experimental and theoretical analyses of acoustic modal coherence distribution and broadband modal distribution results; Section 5 offers a summary of the findings and discusses future research directions.

2. Measurement Theory

2.1. Combined Microphone Array Method

The microphone array used in the combined microphone array method consists of a circular array and an axial array [20]. The circular array is composed of N microphones installed at equal circumferential angles, all located at the same axial position, denoted as x = 0 . Their sound pressure can be expressed as:
p x = 0 , r = R , ϕ k = m n A m n + + A m n f m n R e i m ϕ k
Here, m represents the circumferential mode order and n represents the radial mode order. k is the microphone index for the circular array. R denotes the radius of the duct where the microphones are located. A m n + and A m n are the complex amplitudes of the forward- and backward-propagating acoustic modes, respectively, for the m n mode. The function f m n R describes the radial distribution of the sound pressure for the m n mode at radius R , typically involving Bessel functions of the first kind and their derivatives, satisfying the hard-wall boundary conditions of the duct.
To effectively capture the axial variations in the acoustic field and facilitate modal decomposition, another row of measurement points is strategically arranged at equal intervals along the flow direction ( x = c o n s t ). These points are positioned at a consistent circumferential angle, typically denoted as = 0 , thereby forming a dedicated axial microphone array. This specific arrangement allows for the one-dimensional spatial sampling of the sound field, which is crucial for identifying the axial wave components of propagating modes [21]. Consequently, the sound pressure measured by this axial array can be comprehensively expressed as:
p x , r = R , ϕ = 0 = m n A m n + e i k m n + x + A m n e i k m n x f m n R
Cross-correlation processing is performed on the sound-pressure signals measured by the two arrays, i.e., cross-correlating the sound pressure measured by the circular array ( x = 0 ) with that measured by the axial array ( = 0 ), which can be expressed as:
p x = 0 , R , ϕ k p x j , R , ϕ = 0   = m n μ ν   ( p m n + ( p μ ν + ) e i k μ ν + x j                                                                 +   p m n + ( p μ ν ) e i k μ ν x j     +   p m n p μ ν + ) e i k μ ν + x j +   p m n ( p μ ν ) e i k μ ν x j ) e i m ϕ k
Here, an abbreviation is introduced for simplicity P m n ± = A m n ± f m n ( R ) in writing. Inspired by the spatial discrete Fourier transform in the circumferential direction for tonal noise circumferential modal decomposition, the formula can be expressed in the form of circumferential discrete Fourier transform of the m-mode:
p p ( x j ) m   = n   μ   ν     ( p m n + ( p μ ν + ) e i k μ ν + x j + p m n + ( p μ ν ) e i k μ ν x j   + p m n ( p μ ν + ) e i k μ ν + x j + p m n ( p μ ν ) e i k μ ν x j )
For the study of duct broadband noise, using the research conclusion on modal coherence characteristics in [22] modes with different circumferential orders are mutually incoherent, the correlation terms between modal combinations with different circumferential m μ orders can be ignored. Thus, the Formula (5) can be simplified as:
p p ( x j ) m = n     ν     ( p m n + ( p m ν + ) e i k m ν + x j + p m n + ( p m ν ) e i k m ν x j   + p m n ( p m ν + ) e i k m ν + x j + p m n ( p m ν ) e i k m ν x j )
The coherence characteristics between different radial modes are analyzed in detail in Section 4. The influence of partial coherence among a few modes on broadband noise modal identification and duct noise testing can be neglected [22]. Therefore, the coherence terms between modes ( m μ , n v ) can be ignored, and the coherence terms for forward- and backward-propagating waves are also approximately zero, with < A m n + A μ v   >   being less than 0.05 (for example, in the experimental conditions of this study, the maximum value of < A m n + A μ v   > is measured to be around 0.03, which is far closer to zero). The Formula (6) is finally simplified as:
p p x j m = n P m n + 2 e i k m n + x j + P m n 2 e i k m n x j
Modal identification of turbulent broadband noise in flow ducts can be achieved through the system of equations constructed by the formula [23]. Specifically, the modal identification process involves solving a linear system derived from Equation (6) by utilizing measurements from the combined microphone array. This typically employs a least-squares optimization approach to determine the unknown modal amplitudes A m n + and A m n by minimizing the difference between the measured cross-correlation functions and those predicted by the model. Iterative algorithms or direct matrix inversion methods can be used, depending on the complexity and size of the system. The accuracy of the identification relies on the proper selection of mode orders and the quality of the measured cross-correlation data.

2.2. Advantage Analysis of the Combined Microphone Array Method

For modal identification measurement of turbomachine duct noise, the cross-correlation modal identification method has been proven to accurately identify both tonal and broadband noise in ducts [24]. However, this method is greatly limited when applied to medium and high-frequency noise testing, mainly because the cross-correlation method requires synchronous measurement of all measurement points. In contrast, the number of measurement points required by the combined microphone array method is significantly reduced, needing only one circular array and one axial array of microphones. As shown in Figure 1, when the traditional “birdcage” array used by the cross-correlation modal identification method (CC) requires synchronous measurement of sound-pressure data at 64 positions (including N x = 4 arrays, with each N = 16 array consisting of microphones installed at equal angles), the combined microphone array only needs to install 19 ( N t o t a l = N x + N 1 ) measurement points for sound-pressure collection. At high frequencies, the difference in the number of measurement points required by the two arrays becomes more significant. For example, at 6000 Hz, the combined microphone array only needs 85 sensors, which is much lower than the 1800 measurement points required by CC in terms of hardware requirements and spatial installation size, making this method highly practical and of great engineering application value.

3. Numerical Simulation

The main purpose of this section is to conduct numerical verification and error analysis of the combined microphone array method [25]. For numerical simulation, the Finite Element Method (FEM) is used for acoustic field analysis, with the commercial software COMSOL Multiphysics 5.6 and its acoustic module employed to build and solve the acoustic model—this software can handle complex geometric structures and boundary conditions, and supports frequency-domain and time-domain acoustic calculations. During modeling, the geometric models of the duct and sound source are first accurately established in COMSOL based on the experimental setup dimensions; then mesh generation is performed, ensuring each wavelength contains at least 6–10 elements within the target frequency range to guarantee calculation accuracy. Acoustic equations are solved via COMSOL’s built-in solver, which relies on finite element discretization and uses direct solvers (e.g., PARDISO) or iterative solvers (e.g., GMRES) to obtain sound-pressure distribution and modal characteristics. For the artificial duct broadband noise field, the method’s accuracy is verified by comparing calculated modal coherence coefficients and amplitudes with theoretical values, and its error analysis is completed by comparing it with the reference microphone method and cross-correlation method proposed in this paper. All numerical simulations are conducted on a high-performance workstation equipped with an Intel Xeon E5-2690 v4 processor (2.6 GHz, 14 cores, Intel Corporation, Santa Clara, CA, United States) and 128 GB RAM (Samsung Electronics Co., Ltd., Suwon, Republic of Korea), running the CentOS 7 Linux operating system. Multi-core parallel computing of the workstation is utilized for large-scale frequency-domain scans or parameter studies to reduce computation time.
It should be noted that although the Finite Element Method (FEM) has shown good adaptability in the acoustic simulation of this study, we have also noticed its limitations such as high computational cost and challenging accuracy when dealing with high-frequency problems and complex geometric structures. The hybrid numerical strategy combining the Boundary Element Method (BEM) and the Virtual Element Method (VEM) [26], proposed in recent relevant studies in the field of acoustic numerical simulation, provides a new direction for addressing such limitations. In future research, we will focus on the application potential of this type of method in the modal analysis of broadband noise in duct systems.

3.1. Numerical Simulation Analysis of the Combined Microphone Array Method

In the numerical verification study, the duct radius is set to 0.25 m, and the airflow in the duct is set as uniform flow with a Mach number M a = 0.07 of in the simulation, aiming to be consistent with the fan test bench conditions. Figure 2 shows a schematic diagram of the sound source array and microphone array in the artificial broadband noise field. The sound source array consists of S x circular arrays of monopole sound sources arranged at equal angles, with each array containing S monopole sound sources located at   ( x i , r i , i ) . To more accurately simulate the random characteristics of duct broadband noise, the monopoles in the simulation are mutually incoherent, and the displacement velocity of each monopole is q 0 ( x i , r i , i ) . The microphone array consists of N x circular arrays, with each array containing measurement points located at   ( x j , r j , j ) . The sound pressure p 0 ( x j , r j , j ) at each measurement point is generated by the excitation of the sound source array composed of monopole sound sources.
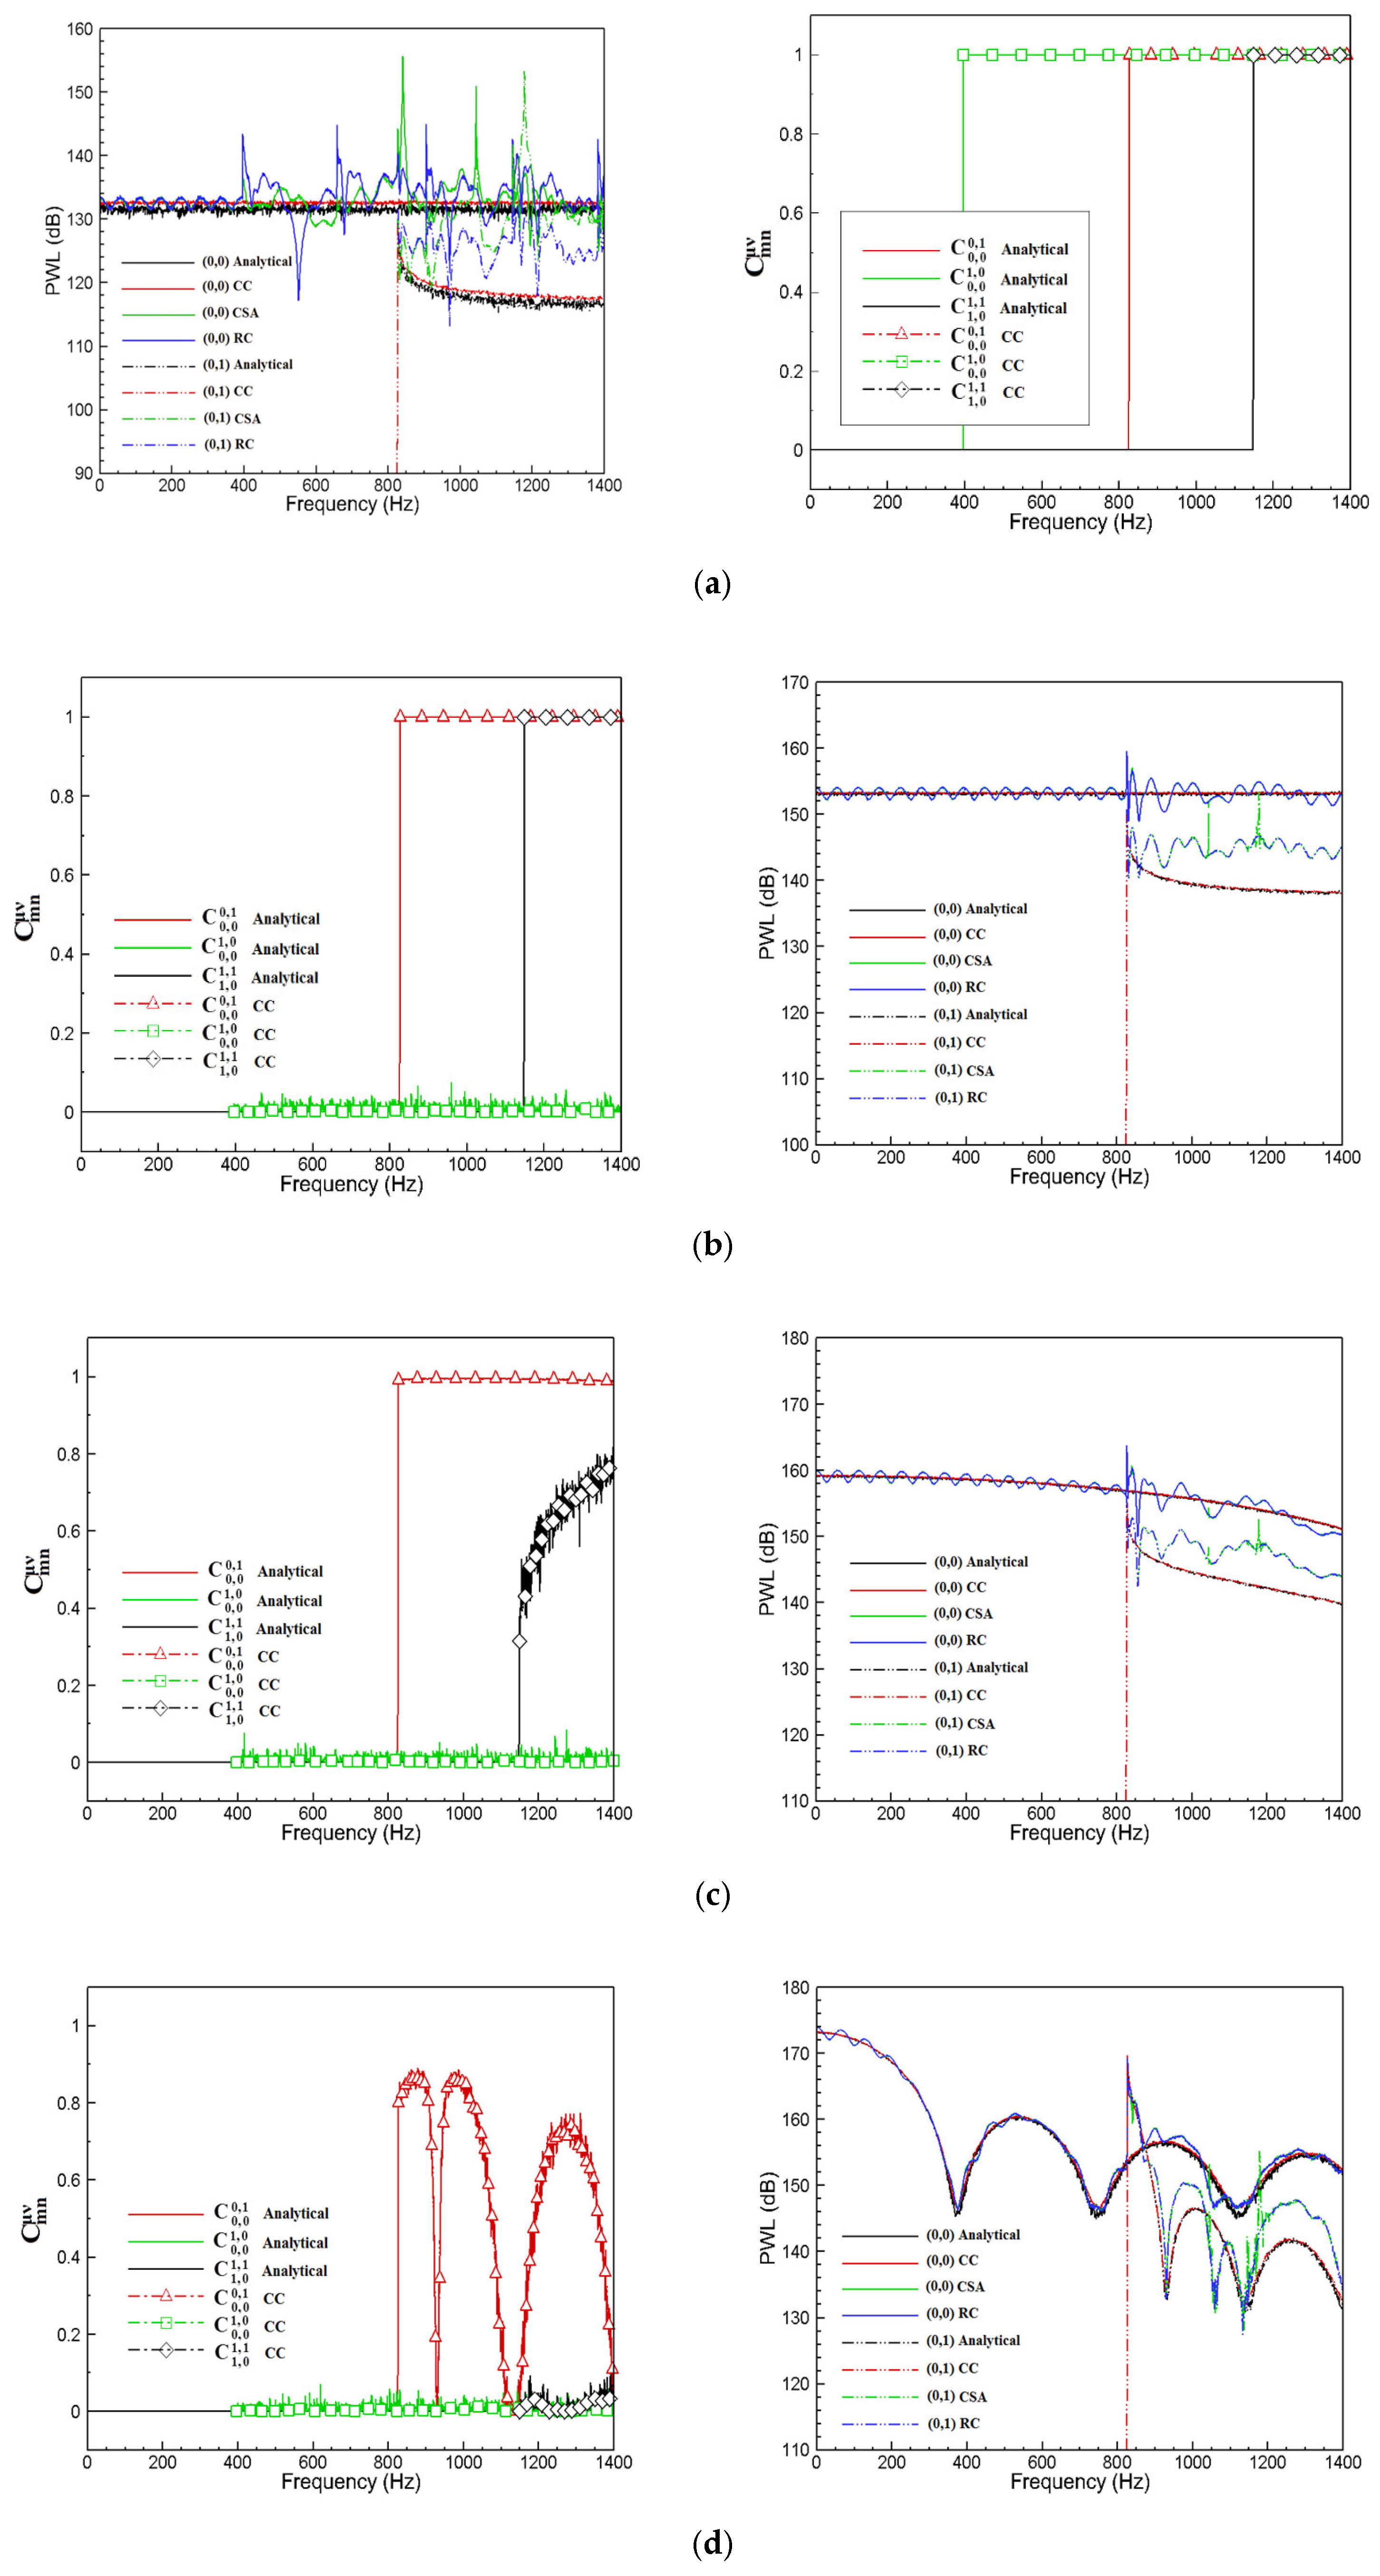
In the entire numerical study, to investigate the influence of the number of monopole sound sources and the arrangement of the sound source array on the coherence characteristics between modes in the artificial sound field, four sound source schemes are studied, as shown in Table 1 ( S x is the number of rows in the sound source array, S is the number of monopoles per row, installed at equal angles on the casing wall).
The main difference between the four design schemes lies in the total number of sound sources, distinguished by Latin letters I–IV in the table. In the entire simulation, the data from all measurement points undergo 700 Fourier transform averages to obtain the statistical characteristics of the sound field.

3.2. Artificial Duct Broadband Noise Field

The relationship between the sound pressure at the measurement point and the sound source is defined as:
p x i , r i , ϕ i x j , r j , ϕ j = q m , n   χ m n f m n r i f m n r j e i m ϕ i ϕ j e i k m n + x j x i
where each mode depends on the mode cut-off factor. Based on the modal propagation characteristics shown in the formula, the amplitude of the mode (m, n) excited by the sound source is defined as:
A m n ± q , x i , ϕ i = q χ m n f m n r j e i m ϕ j e i k m n ± x i
The above formula is only the modal amplitude result excited by a single sound source. In the numerical simulation, the sound source array contains S x rows of monopoles, with each circular sound source array having S monopole sound sources arranged at equal angles. For the convenience of future experimental installation, all monopole sound sources in the numerical simulation are installed on the duct wall, i.e.,   r i = R . Assuming that the monopole sound sources are incoherent and have the same energy, the cross-spectrum of modal amplitudes can be expressed as:
A m n A μ ν = χ m n χ μ ν q q j = 0 N x 1   l = 0 N θ 1   Γ m n x j , R , ϕ l Γ μ ν x j , R , ϕ l
where Γ m n x , R , ϕ l = f m n R e i m ϕ j e i k m n ± x i , the corresponding modal coherence function can be obtained.
In duct noise propagation, acoustic reflections can occur upstream or downstream of the microphone array [27], which can be added to the Green’s function using the method of image sources. For simplicity in numerical calculation, the reflection coefficient is assumed to be independent, unrelated to frequency and modal order (m, n). In this paper, it is set to r c = 0.2 . In this numerical study, the scattering characteristics in modal propagation are ignored, i.e., modes in the propagation model do not scatter into other orders of modal waves. Finally, the modal propagation Green’s function can be expressed as:
p x j , r j , ϕ j = ρ c 4 π R 2 q 0 m , n   f m n ( R ) 2 α m n e i m ϕ ϕ j e i k m n + x j x i + r c e i k m n x j x i

3.3. Numerical Verification and Error Analysis

This section conducts numerical simulation studies on the stability and robustness of the CSA method, with specific research schemes shown in Figure 2 and Table 1, aiming to provide theoretical support for the application of this method in aero-turbomachine noise testing.
The CSA method is studied in the numerical research through the following two aspects: First, by comparing the modal coherence results calculated by the CC method with the theoretical results (Formula (9)), the coherence characteristics of the artificial sound field in the numerical simulation are verified, and the accuracy of the artificially constructed sound field is judged; Second, in terms of modal amplitude calculation, the CSA method (Formula (6)) is compared with CC, RC, and theoretical values (Formula (9)) to explore the reliability of the CSA method and its sensitivity to the statistical coherence characteristics of internal acoustic modes in the sound field, and further investigate whether a significant reduction in the number of measurement points causes instability in numerical solutions.
Figure 3 shows typical incident sound wave results measured by the microphone array located downstream of the duct sound source. The measured characteristics of reflected sound waves (i.e., backward-propagating modal waves) have the same spectral pattern as incident sound waves, so only the incident sound wave results are presented in the figure. The left part shows the coherence coefficient results of modal combinations C 0,0 0 ,     1 , C 0,0 1,0 , C 1,0 1,1 and, marked by red, blue, and black lines, respectively. These modes are selected to divide the study of modal coherence into two parts: first, studying the coherence between different circumferential modes, such as m μ and C 0,0 1,0 ; second, studying the coherence between different radial modes within the same circumferential mode, such as m = μ   n v and C 0,0 0,1   C 1,0 1,1 . The upper frequency limit for acoustic research in the experiment is 1.4 kHz, corresponding to a non-dimensional frequency of kR = 6.47, where the maximum circumferential and radial modal orders cut on in the duct are M m a x = 5 and N m a x = 1 respectively. The non-dimensional kR = 1.83 frequency refers to the frequency boundary between plane waves and higher-order modal waves. When k R < 1.83 , only plane waves (0,0) are cut on in the duct; when k R 1.83 , higher-order non-plane wave modes ( m , n ) ( 0,0 ) begin to be cut on. Theoretical values in the figure are marked by solid lines, and results calculated by the broadband modal decomposition method are marked by dashed lines. The modal coherence coefficient results of the duct acoustic modes excited by the four sound source arrays are in good agreement with theoretical analysis results, confirming the reliability of the artificial duct sound field in this paper. As shown in Figure 3a, when only a single monopole sound source is installed on the duct wall, the resulting duct sound field is completely correlated, i.e., the coherence coefficient of all modes inside the duct is 1, which is basically consistent with the research results in reference [28]. When the number of incoherent monopole sound sources increases to 12, the sound field excited in the duct is partially correlated. When the sound source array increases to 2 rows of circular sound source arrays, the partial correlation characteristics of duct acoustic modes become more obvious. As shown in Figure 3c, the correlation coefficient of modal combinations with different circumferential modal orders C 0,0 1,0 is zero. It should be noted that these modal combinations do not include the special case m μ = ± s N where is an integer, which is basically consistent with the relevant conclusions in reference [15]. When the number of monopole sound sources installed on the duct wall continues to increase, as shown in Figure 3c,d, the coherence degree of acoustic modes begins to decrease significantly. In Figure 3d, the statistical coherence coefficients between all modes are approximately zero, except for C 0,0 0,1 (Reference [3]). The rate of decrease in the results is slow, which may be due to insufficient number of sound sources in the simulation.
In Figure 3 the left side shows the coherence coefficient results, from which it can be seen that modes (0, 0) and (0, 1) are the most difficult to measure in the simulated sound field. Therefore, the right side of Figure 3 shows the (0, 0) and (0, 1) modal sound power results calculated by the CSA method. To verify their accuracy, theoretical values as well as calculation results from the RC and CC methods are presented in the figure. It can be clearly seen from the figure that the CC method can accurately evaluate and determine duct acoustic modes under the four sound source array schemes, and the CSA method can accurately determine acoustic modes within a limited frequency range for Figure 3b–d. For sound source array Figure 3a, when non-plane waves are cut on in the duct, the CSA method cannot accurately identify duct acoustic modes because all acoustic modes in array Figure 3a are completely correlated, which contradicts the premise of the method design. For Figure 3b,c, the CSA method can relatively accurately calculate acoustic modes before the cut-on of mode (0, 1), with systematic oscillations in the estimated results with an amplitude of 1 dB. When the frequency is greater than the cut-on frequency of mode (0, 1), i.e., f > 826   H z , the errors of the values estimated by the combined microphone array method and the reference microphone method increase significantly. This is because both methods simplify modal coherence during design, which is inconsistent with the actual acoustic modal coherence results in Figure 3b,c, where partially coherent modes cause significant deviations in modal amplitude prediction. It can be seen in the figure that the solved amplitude of mode (0, 1) is always larger than its actual value, because the ignored energy < A m n A μ v * > is forced to be added to the identified modal amplitude results in the calculation, leading to overestimation of the prediction results for modes with lower energy, such as (0, 1). It should be noted that these partially coherent modes only have a significant impact on the identification of acoustic modes with lower energy levels. For example, in Figure 3d, although the C 0,0 0,1 results are large, the CSA method can still relatively accurately determine the (0, 0) mode with higher energy, with a maximum error of less than 2 dB. Therefore, it can be reasonably inferred that when there are partially coherent modes in the duct, i.e., the coherence coefficient between a few modes is not zero, the CSA method can still accurately measure modal sound power, which will be studied in subsequent parts of the paper. When the frequency is close to the modal cut-on frequency, the sound power results show high peaks, which is caused by unstable phenomena in numerical solutions. When M a 1 and the frequency is the modal cut-on frequency, the axial wavenumber of the mode approaches 0, i.e., K m n 0 , and the corresponding axial wavelength becomes infinite. Based on the Nyquist sampling theorem, the spacing between measurement points needs to be sufficiently large to accurately measure and sample this specific sound wave.
One of the purposes of the numerical study is to apply the combined microphone array method to broadband noise measurement in turbomachine ducts. Figure 4 shows a comparison of sound power levels calculated by the CSA method with those calculated by the RC and CC methods.
Figure 4 Calculation Results of Incident and Reflected Sound Waves The figure presents the calculation results of incident and reflected sound waves, respectively, showing that the incident sound wave is nearly 15 dB higher than the reflected sound wave. This difference is consistent with the reflection coefficient r c = 0.2 setting of the artificial sound field in Section 3.2, because using the sound-pressure level formula, the sound pressure generated by the reflection coefficient r c = 0.2 is 10 log 10 r c 2 = 13.98 dB. Since the total sound power level in the duct is the combination of various modes, the calculation error of the CSA method becomes complex. The calculation results of incident sound waves are basically consistent with those obtained by the other two methods, with a very consistent sound power spectral shape, especially at the cut-on frequency of mode (0, 1) (826 Hz). Below 826 Hz, the calculation error is less than 1 dB; as the frequency increases, the maximum error in magnitude is less than 3 dB. In the calculation of reflected sound waves, the results calculated by the CSA method and RC are generally larger than the true values, with a maximum error of up to 7 dB in the entire frequency band. Notably, the CSA curve in Figure 4b exhibits several sharp peaks. These peaks are primarily attributed to the amplification of modes with lower energy levels due to the residual modal cross terms < A m n A μ v >   in the sound field during modal identification, which is particularly pronounced in this study since the reflected sound wave is nearly 15 dB lower than the incident sound wave. Furthermore, these sharp peaks often coincide with the cut-on frequencies of higher-order acoustic modes, where new modes become propagative, leading to significant changes in the sound field and potentially causing sharp increases in calculated sound power. The method’s sensitivity to the coherence characteristics of internal modes can also contribute to these pronounced features, especially when assumptions about modal incoherence are challenged or when dealing with weak signals.
In summary, the accuracy of the CSA method in measuring broadband noise modal sound power strongly depends on the coherence characteristics of internal modes in the duct sound field. When the coherence between modes is low, this method can accurately measure the modal sound power results of forward- and backward-propagating waves in the duct, and the modal amplitude calculated by the CSA method is basically consistent with that by RC.

4. Comparative Analysis of Measurement Results of Different Modal Identification Methods

To compare and analyze the differences between different modal identification methods in fan duct turbulent broadband noise testing, two schemes, fixed microphone array and rotating microphone array, are adopted in the experimental tests. The fixed microphone array scheme aims to evaluate the accuracy of the new broadband noise duct acoustic modal identification method developed in this section using the cross-correlation modal decomposition method (CC) and the reference microphone modal decomposition method (RC). The rotating microphone array is designed to compensate for the narrow frequency range limitation of the fixed microphone array scheme in duct noise measurement, enabling comparative analysis of test results of different modal identification methods over a wider frequency range.

4.1. Experimental Test Scheme Design

In this experiment, a single-stage axial-flow fan (NPU-Fan) is used as the test object. This fan consists of 19 rotor blades and 18 stator blades, with a rated speed of 2973 rpm, a designed flow rate of 6.3   k g / s , and is driven by an 18.5 kW AC variable-frequency motor. Its dominant rotor-stator interference modes comply with the Tyler & Sofrin theory. For acoustic measurement, BSWA MPA 401 type 1/4-inch prepolarized capacitive microphones (with a frequency range of 20 Hz–20 kHz, a maximum measurable sound pressure of 168 dB, and stable sensitivity in the 50 Hz–20 kHz range) are adopted. Before the experiment, they are calibrated by a 1000 Hz, 114 dB sound level calibrator with an accuracy of ≤±0.2dB. The signals are collected by the Müeller-BBM PAK Mobile MKII 32-channel system, with a sampling frequency of 16,384 Hz, 32-bit precision, and a single measurement point sampling duration of 12 s. For the fixed array, there are 4 × 8 microphones with Δ x = 0.40   R , and synchronization is achieved through the internal clock of the acquisition system. For the rotating array, there are 2 rows of 14 microphones, spaced 180° apart in the circumferential direction with Δ x = 0.10   R , and phase synchronization is realized by a KEYENCE photoelectric sensor with a phase accuracy of ±2° in cooperation with a stepping motor (4° per step). In terms of the experimental environment, the fan inlet section and measurement section are placed in a semi-anechoic chamber with a cutoff frequency of 120 Hz, and a perforated plate sound-lined pipeline is installed in the exhaust section to reduce interference and ensure the measurement signal-to-noise ratio.

4.1.1. Fixed Microphone Array Scheme

Figure 5 shows a schematic diagram of the fixed microphone array scheme design. The array consists of N x = 4 rows of microphones, with each row containing microphones. The axial spacing of the array installation is x = 0.40   R . It should be noted that in the application of the CSA method, only the sound-pressure signals measured by the first circular array (8 microphones) and one row of microphones (4 microphones) are used; the number of fan rotor and stator is specially designed to ensure that the dominant mode at the Blade Passing Frequency (BPF) is cut on at low frequencies.

4.1.2. Rotating Microphone Array Scheme

The design scheme of the rotating microphone array is shown in Figure 6. To meet the requirements in the method design, the acoustic measurement section (marked by the red box) is divided into two measurement devices A/B: A consists of a fixedly installed circular array (16 microphones) and a row of microphones (15 microphones); the array in device B is installed on a rotating casing, which can rotate 360° circumferentially. Two rows of microphones are installed on the rotating casing at 180° intervals, with 14 measurement points per row and a spacing of between measurement points x = 0.10   R . The axial installation positions of the two measurement devices are the same, and the working state of the fan test bench is also the same in the two acoustic measurements.
In the experimental tests, the two test devices are used to measure the broadband noise of the fan duct operating at the same operating point, with the same axial installation positions of the two devices. To ensure the phase stability of the duct sound field during rotating measurement, a photoelectric phase-locking device is installed near the fan rotor. The sampling frequency of the sound-pressure signal is 16,384 Hz, and the sound-pressure data in the Fourier transform undergoes 60 window truncation processes with a window size of 16,384.

4.2. Comparative Analysis of Experimental Test Results of Fixed Microphone Array Scheme

From the research results in the previous section, it is known that the combined microphone array method is sensitive to the coherence characteristics of duct modes. Therefore, this section measures the fan inlet radiated noise using the experimental test scheme shown in Figure 5. The fixed array is used to experimentally measure the statistical characteristics of the duct modal coherence function and conduct preliminary experimental verification of the CSA method in terms of duct broadband noise modal decomposition and sound power spectrum measurement.
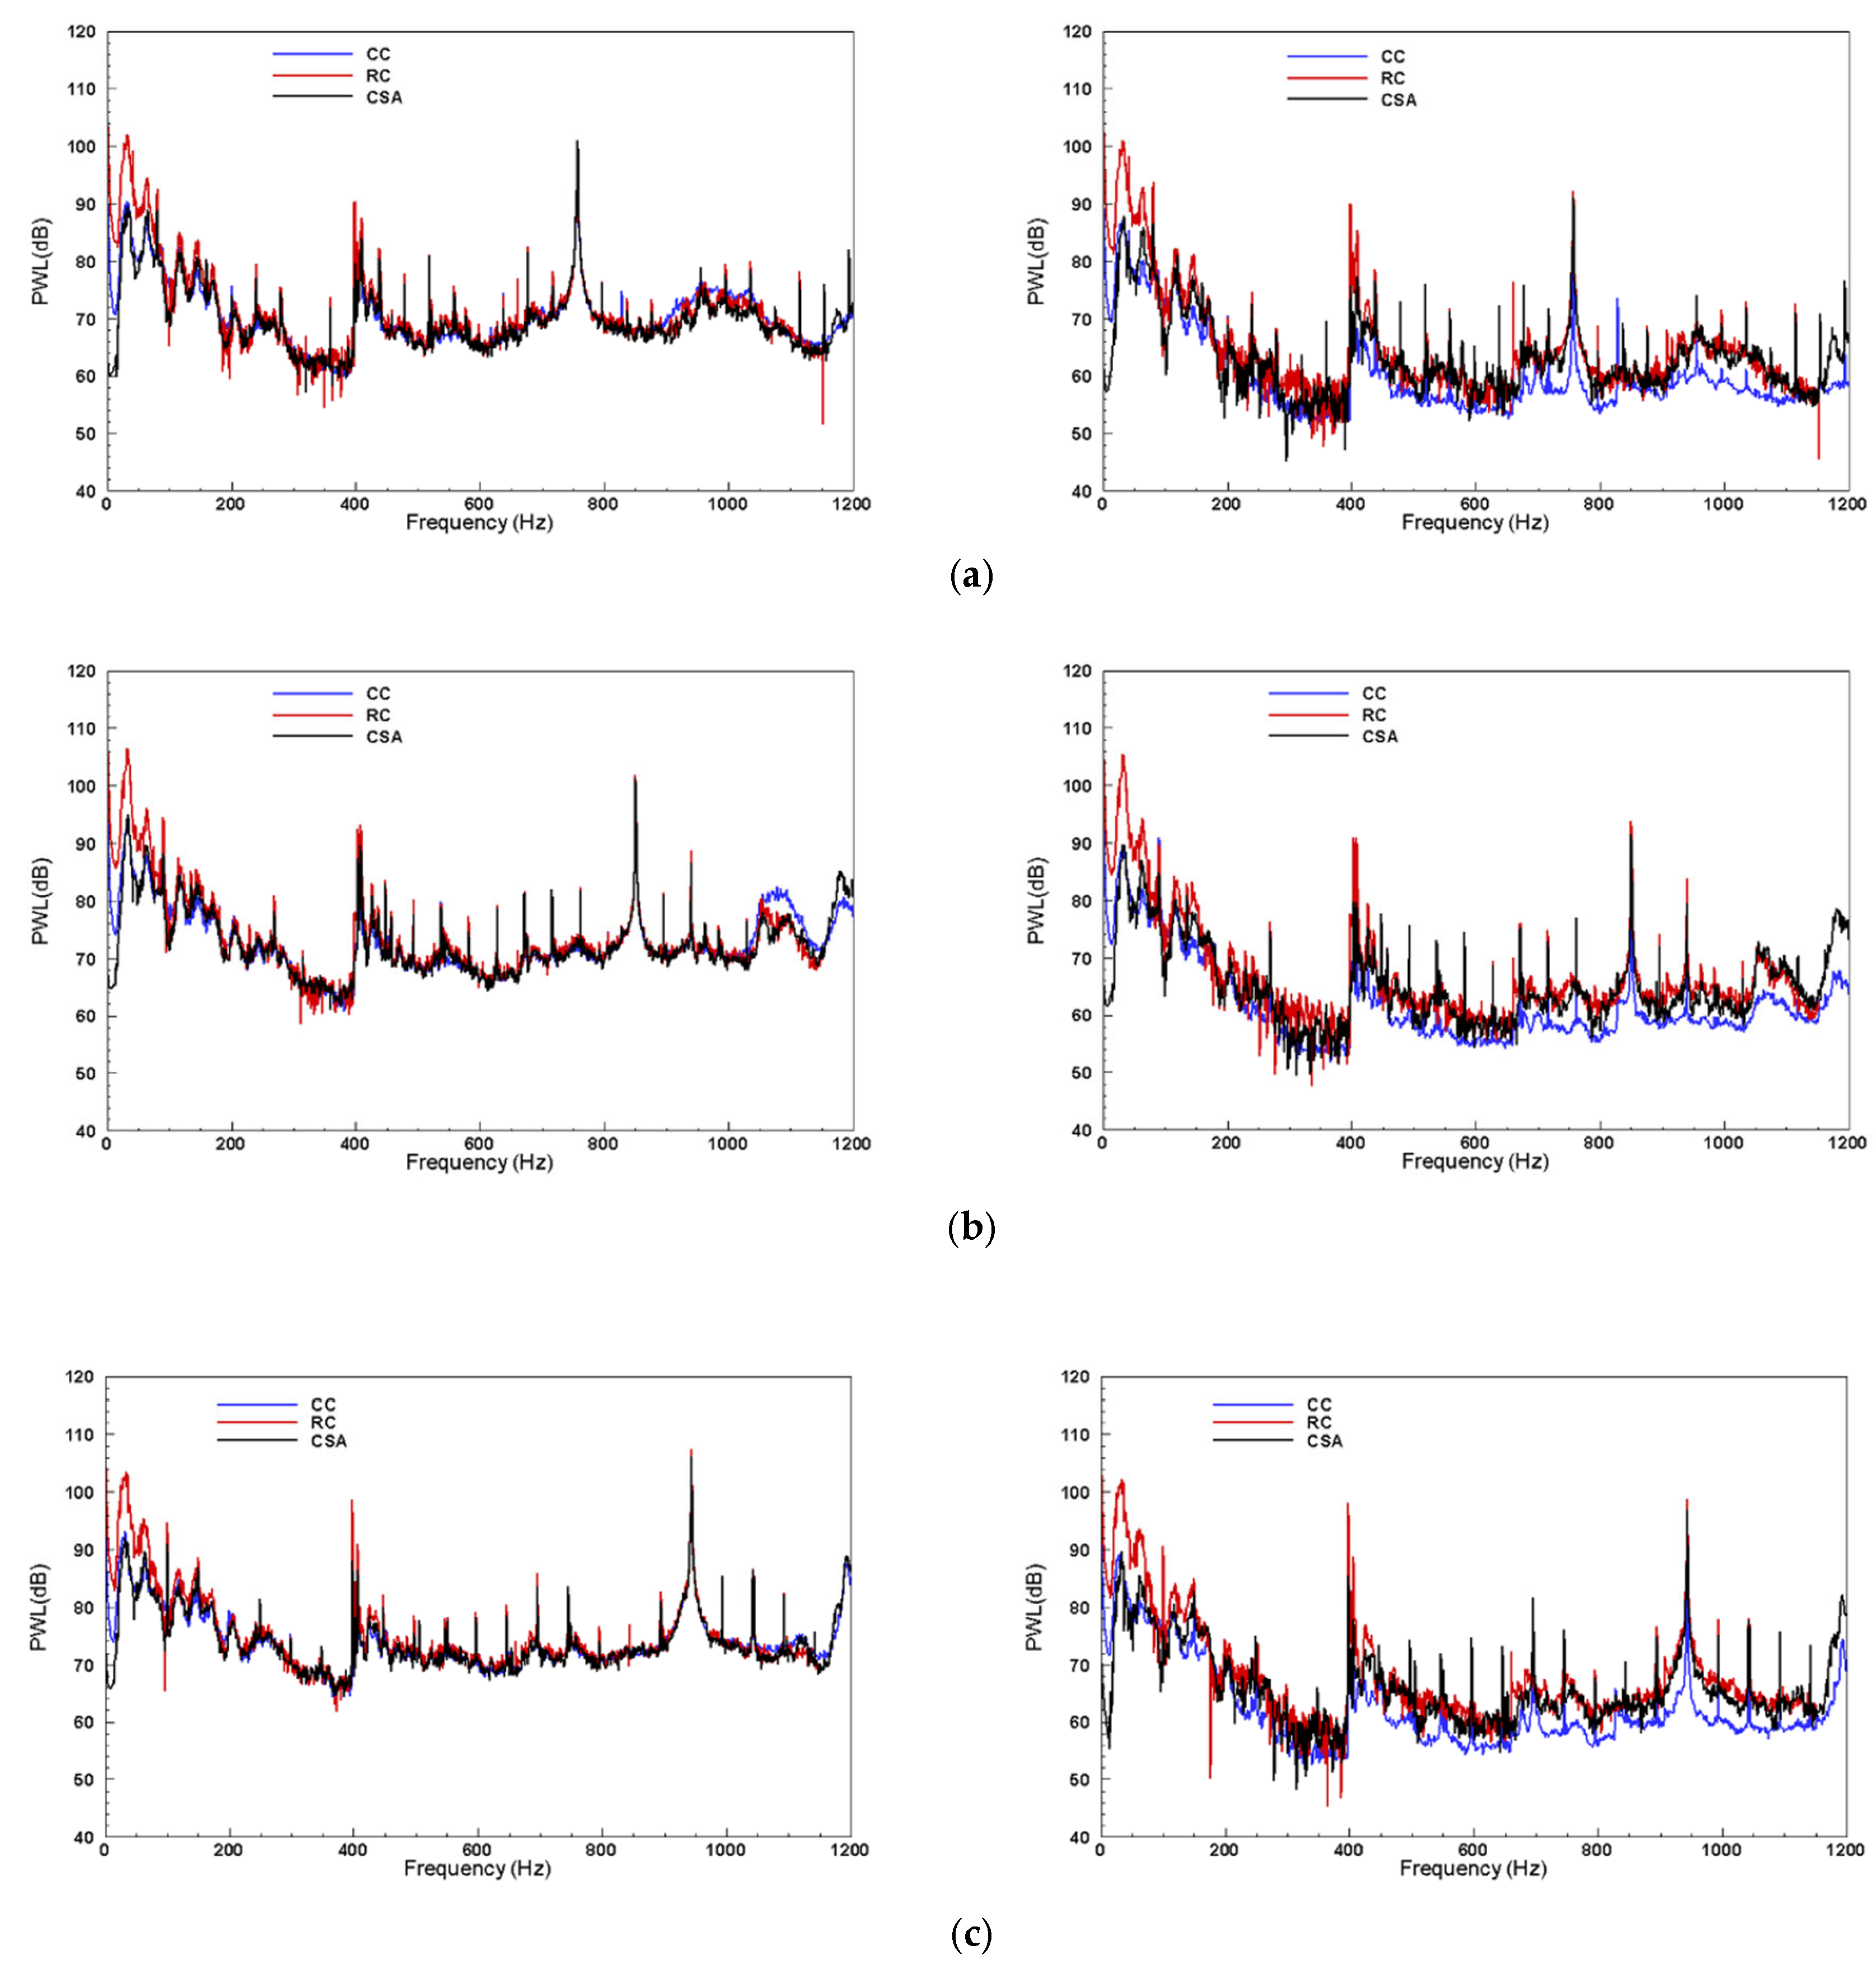
According to Tyler & Sofrin modal decomposition theory, the dominant circumferential order of modes cut on in the fan test bench duct at 1.2 kHz (including 1BPF) is m = n B ± k V = 1 . Figure 7 shows the sound power results of the (1, 0) mode propagating forward and backward in the fan duct, presenting broadband noise modal decomposition results at three rotational speeds (80%, 90%, and 100% of the design speed): the left side shows backward-propagating modal waves, i.e., incident sound waves; the right side shows forward-propagating modal waves, i.e., reflected sound waves. The upper frequency limit is 1.2 kHz, corresponding to a non-dimensional frequency of kR = 5.54, where the maximum circumferential is M m a x = 4 and radial modal orders are N m a x = 1 , respectively. The CC, RC, and CSA methods are marked by blue, red, and black lines, respectively. It is known that the modal results identified by CC can be used as a standard to evaluate other methods. The experimental test results show that the modal results decomposed by the CSA method are basically consistent with those identified by RC and CC established in the paper. The backward-propagating modal waves identified by the CSA method (left part of Figure 7) are in high agreement with the calculation results of the other two methods, with a consistent spectral shape over the entire broadband range and a maximum error of less than 2 dB. A large deviation occurs near the BPF, which belongs to the scope of tonal noise research and will not be discussed in detail here. In the measurement and estimation of forward-propagating modes (right part of Figure 7), both the CSA method and RC calculate values larger than the true values, showing a constant 6 dB deviation over the entire frequency band. The underlying reason for this amplification effect is the same as that in the simulation, i.e., caused by cross terms < A m n A μ v * > between modes. This part of energy is simplified and ignored in the design of RC and CSA methods, so it is forced to be added to the solved modal amplitude squared terms during modal decomposition A m n 2 . Referring to the broadband noise modal coherence function results in [13], the coherence degree between modes of different orders is low over the entire broadband range C m , n μ , v < 0.2 . For duct noise measurement, microphones are inevitably affected by turbulent pressure fluctuations, and this part of “noise” causes the modal coherence coefficient to not be completely zero. Thus, the experimental measurement results confirm that broadband noise modes of different orders are statistically incoherent. However, the coherence coefficient between different radial modes within the same circumferential mode (i.e., m μ , n v ,) is large over the entire frequency range, indicating that these modes are partially coherent, which is the underlying reason for the large deviation in the right part of Figure 7.
In duct broadband noise measurement, people are more interested in incident sound waves (referred to as backward-propagating modal waves in the figure), while sound waves reflected by the test environment and duct walls (forward-propagating modal waves) are not of concern and are directly ignored in many studies. In this experimental measurement, it can be found that the energy of reflected sound waves is approximately 10 dB lower than that of incident sound waves. The experimental measurement results show that the CSA method can accurately decompose and determine modal sound waves. In duct broadband noise measurement, the determination of the total sound power spectrum is very important [29], especially in evaluating the sound absorption effect of sound-absorbing devices (such as acoustic liners) and predicting far-field noise. Figure 8 shows the duct broadband noise sound power spectrum results at three rotational speeds: the left part is the sound power of backward-propagating waves; the right part is the sound power of forward-propagating waves. The left part of Figure 8 shows that the three methods have good consistency in measuring incident sound waves of duct broadband noise at different rotational speeds. The results calculated by the three methods almost overlap into a single curve over a wide frequency range, with a maximum error of the CSA method less than 1 dB. For the measurement of plane waves (i.e., f < 397   H z ,), the accuracy of the CSA method is better than that of the RC established in the paper. It should be noted that the number of measurement points required by the CSA method is significantly reduced compared to the other two methods, making the CSA method more prominent in engineering applications. In the measurement of reflected sound waves, when non-plane modal waves are cut on, both the CSA method and RC show an amplification effect of 4 dB. Compared with the single modal test results, the deviation is reduced. This is because modal cross terms < A m n A μ v * > are in complex form, and phase cancelation occurs when multiple modes are superimposed.

4.3. Comparative Analysis of Experimental Test Results of Rotating Microphone Array Scheme

Based on the fixed microphone array, the previous section studied the practicability and accuracy of the combined microphone array method by comparing and analyzing the test results of different modal identification methods. It should be noted that in the comparative analysis, the upper frequency limit of noise testing is very low. Within this frequency range, only the sound field information at 1BPF can be captured, which is insufficient for turbomachine noise research, and the research conclusions will be limited and cannot be generalized. This section studies the sound field results measured by the rotating microphone array scheme shown in Figure 6. To expand the frequency range of duct broadband noise modal identification, two measurement devices are used in the test scheme: the fixed array measurement device (marked as A in Figure 6), which will be used for CSA method research; the rotating microphone array measurement scheme is marked as B in Figure 6.
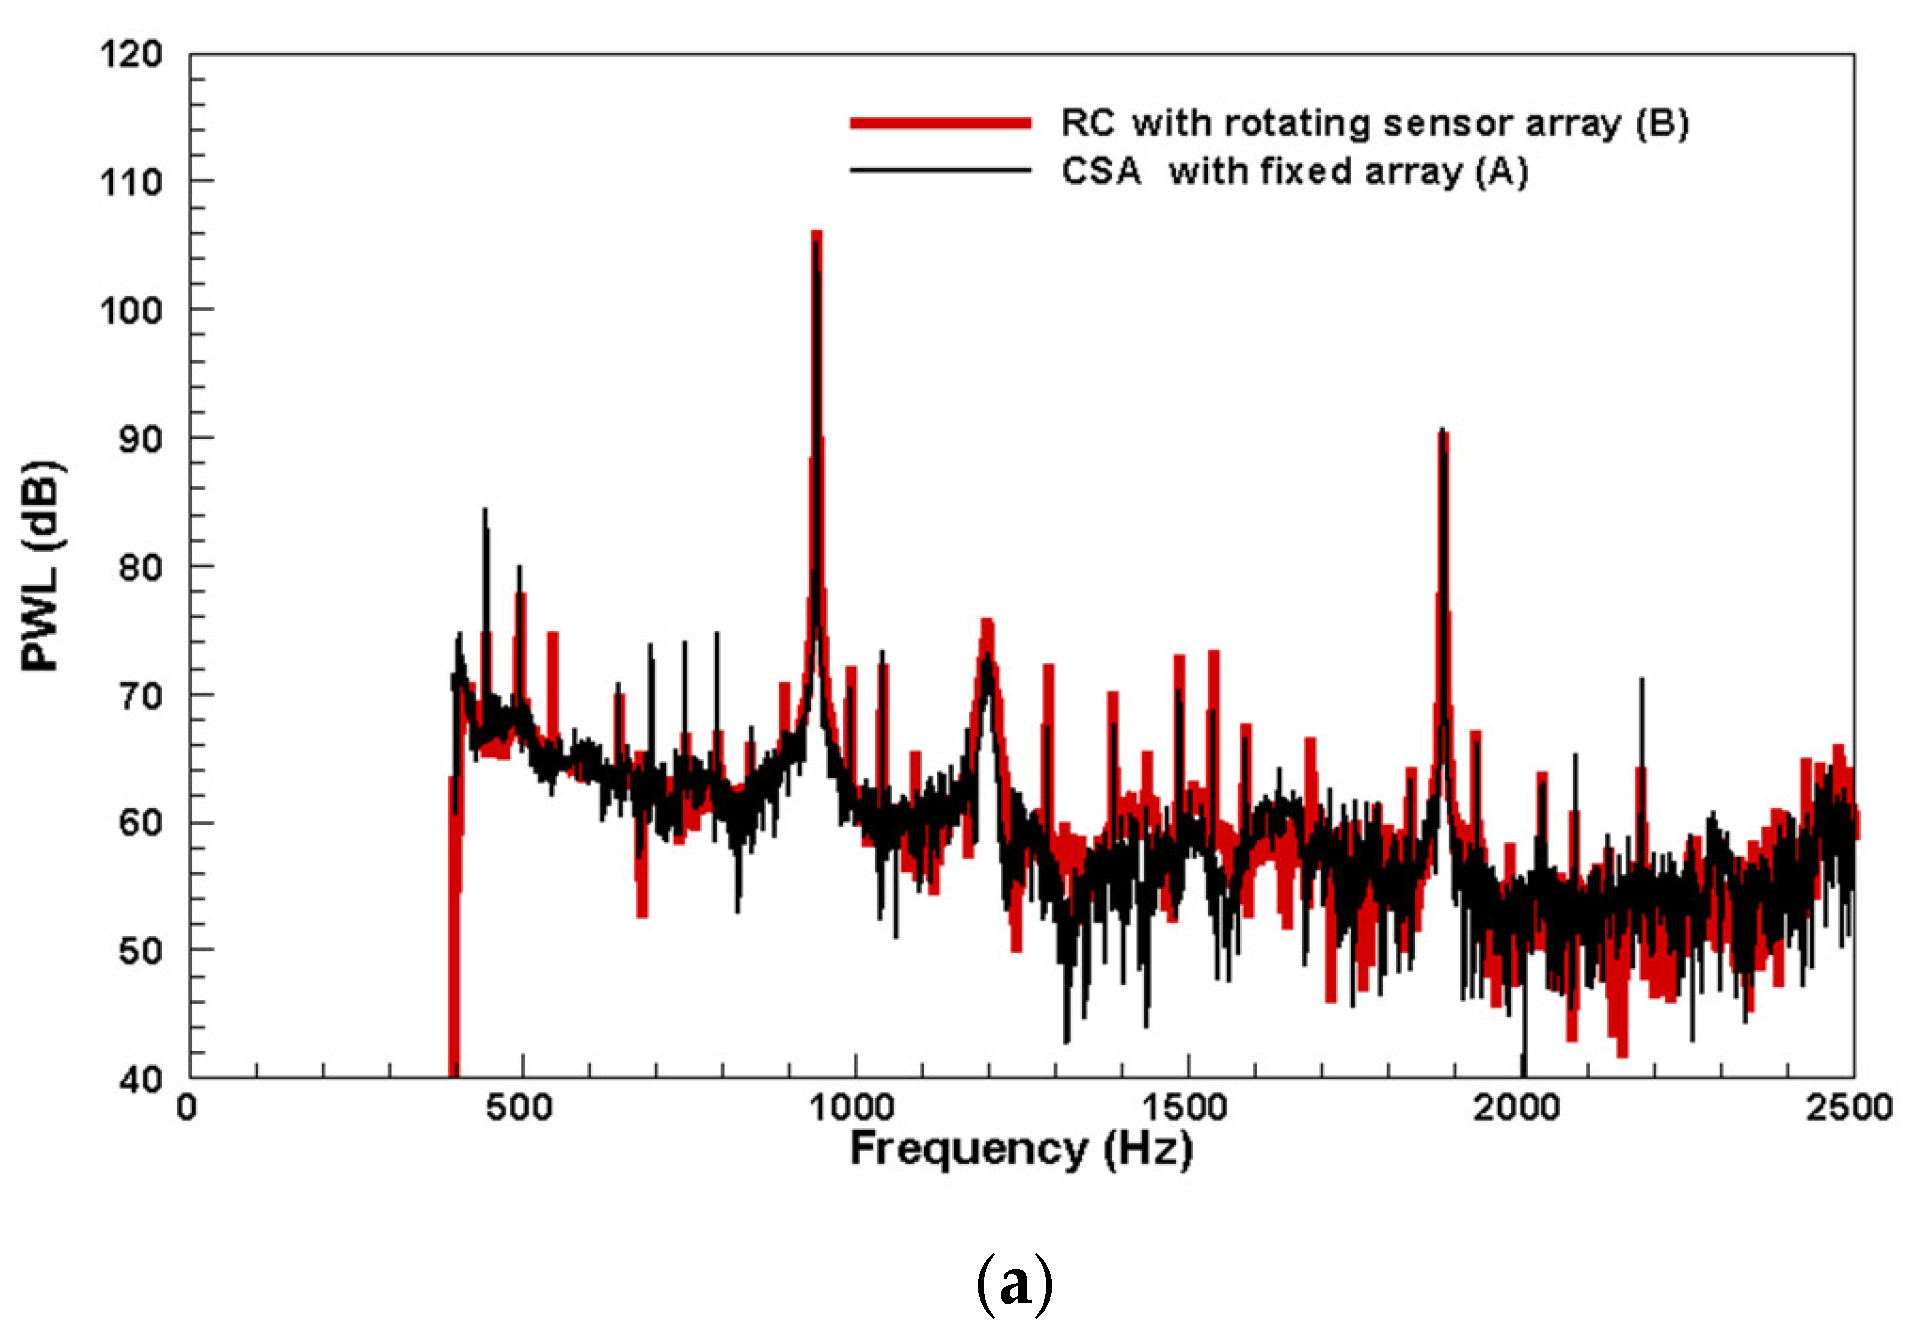
Figure 9 shows the sound power results of the (0, 0) mode propagating backward and forward at 100% of the design speed. The black line represents the results of the CSA method applied to the measurement device in Figure 6 (A), and the red line represents the results of RC applied to the measurement device in Figure 6 (B). Over the entire frequency range, the sound energy of the (0, 0) mode generally decreases as the frequency increases. For both incident and reflected sound waves, the results calculated by the two methods are in good agreement, oscillating slightly around a certain value over the studied frequency range. Compared with the RC method, the results calculated by the CSA method have smaller oscillation amplitudes. This is because, compared with rotating measurement, the results of fixed array measurement have higher synchrony and a more stable measured sound field, thus being less affected by other noises. The research results in [15] show that there is high coherence between radial modes within the m = 0 mode. By comparing the results in Figure 9, it can be found that the influence of this partial modal coherence on modal sound power measurement is very limited. The tonal results at BPF and its harmonics calculated by the two methods are different, which is consistent with the theory. For the reference microphone method, the cross terms between modes are not zeroed but replaced by B m n (refer to the formula in Section 3.1 for details), while the combined microphone method zeros them. Although both methods can accurately measure rotor-stator interaction modes, the (0, 0) mode at BPFs is not the dominant mode and has relatively low energy, so it is more obviously affected by modal cross terms.
Figure 10 shows the sound power results of the (1, 0) mode propagating backward (incident sound wave) and forward (reflected sound wave) at 100% of the design speed, with the same line types and color distinctions as in Figure 9. In the determination of incident sound waves, the results calculated by the two methods are in high agreement, with the sound level decreasing as the frequency increases. The burr phenomenon in the spectrum is mainly caused by the small frequency interval in the calculation. The frequency interval of the results in the figure is only 1 Hz, and this phenomenon can be weakened by appropriately increasing the frequency interval to make the spectral shape smoother. However, to more accurately capture the tonal noise at the blade passing frequency, such as the tonal frequency of 943 Hz at 100% design speed, a 1 Hz interval is still chosen. As shown in Figure 10a, the sound power of tonal noise at BPFs propagating backward calculated by the two methods is basically the same. The sound power of the (1, 0) mode identified by the two methods differs by a maximum of 2 dB over the entire studied frequency range. The identified forward-propagating modal waves, as shown in Figure 10b, are approximately 10 dB lower in magnitude than backward-propagating sound waves. In the calculation of modal sound power of reflected sound waves, the two methods show large differences, especially near 1650 Hz, with a difference of up to 4 dB. The main reason for this difference is that the reference microphone method considers the partial influence of modal cross terms < A m n A μ v * > in its design, while the CSA method completely ignores the influence of these modal cross terms. Therefore, in actual solutions, this part of energy has a significant impact on modal waves with lower energy [30], but limited influence on modes with higher energy levels, such as rotor-stator interaction modes. This conclusion can be confirmed by comparing the results at BPFs in Figure 10 and Figure 9. In the identification and measurement of forward-propagating modal waves, the modal sound power spectrum calculated by the CSA method is slightly higher in magnitude than that identified by RC. In actual measurements, people are more concerned about incident sound waves, indicating that the CSA method performs excellently in broadband noise modal identification tests.
The test needs to be verified. Figure 11 presents the sound power spectra calculated by the two new modal identification methods, along with the sound power spectrum measured by the fixed array shown in Figure 5 The fixed array consists of 4 × 8 microphones, with an upper frequency limit of 1140 Hz for sound level calculation, but it is added to Figure 11 as a reference to assess the stability and accuracy of the rotating measurement device. Overall, the shapes of the sound power spectra of forward- and backward-propagating waves are in good agreement, with very small differences in magnitude. It can be seen that: (1) when f < 1140   H z , with the results measured by the fixed array scheme as the reference standard, both schemes A and B in Figure 6 have high consistency, with a measurement error of incident sound waves less than 2 dB and that of reflected sound waves less than 3 dB; (2) when f > 1140   H z , the sound power frequencies calculated by the CSA and RC methods are in high consistency in both forward and backward directions, with a measurement error of backward-propagating sound power less than 1 dB. The tonal noise results at BPF and its harmonics can be clearly seen in the figure. For both incident and reflected sound waves, the BPF tonal noise decreases with the increase in harmonic order, and the tonal noise results of incident waves are significantly larger than those of reflected waves.
In summary, in comparison with the measurement results of the rotating array, the CSA method performs excellently. Over the entire studied frequency range, the sound power results calculated by the CSA method and the RC method established in the paper have the same spectral shape and small differences in magnitude. In the measurement of incident sound waves, the maximum difference between the two methods is 2 dB, while for reflected sound waves, the maximum difference is 3 dB.

5. Summary

Based on the research conclusions regarding the coherence characteristics of fan broadband noise duct acoustic modes in Section 3, and the error theory and array design method established in Section 4, this section develops two new broadband noise modal identification measurement methods, aiming to realize acoustic modal identification measurement in aero-turbomachine ducts over a wide frequency range. Using the designed and manufactured duct acoustic modal rotation test system, a detailed comparative analysis of the measurement results of different broadband noise modal identification methods is conducted, focusing on the differences in test accuracy between different modal identification methods. The following conclusions are obtained:
(1) Practical and innovative testing methods suitable for engineering applications have been successfully developed, including the rotating microphone array modal identification method and the combined microphone array modal identification method. Compared with the established cross-correlation method and reference microphone method, the number of required measurement points is significantly reduced, making them very suitable for modal identification measurement of medium and high-frequency duct noise.
(2) Based on peak phase-locking technology, a duct acoustic modal rotation test system is designed. This system is used to conduct experimental tests on the noise of a single-stage axial flow fan, and the results are compared with those of mature broadband noise modal identification methods. The experimental results show that: in the measurement of sound power of incident sound waves, the maximum error of the test results of the rotating microphone array modal identification method is less than 1 dB; in the measurement of sound power of reflected sound waves, the rotating microphone array modal identification method is in good agreement with the reference microphone method, with a maximum error of less than 2 dB. The noise results measured by the new rotating test system designed in the paper can be added to the aero-turbomachine noise database as standard data, providing verification criteria for other broadband noise testing methods or numerical simulation algorithms.
(3) The numerical verification results of the combined microphone array method show that: in terms of broadband noise modal sound power measurement, the accuracy of the combined microphone array method strongly depends on the coherence characteristics of duct modes. When the coherence coefficient between modes is low, this method can accurately measure the modal sound power of incident and reflected sound waves in the duct, and the measured modal amplitude is basically consistent with the results calculated by the reference microphone method.
(4) By comparing the measurement results of different modal identification methods, it is found that the sound power results calculated by the modal identification method based on the rotating microphone array and the combined microphone array method are in good agreement. Both methods can accurately measure incident sound waves in the fan duct with an error of less than 1 dB. In the measurement of reflected sound waves, both methods can accurately capture the spectral shape of reflected sound waves.

Author Contributions

Conceptualization, K.X.; methodology, K.X.; validation, D.L.; formal analysis, D.L.; investigation, K.X., D.L. and Z.Z.; data curation, D.L.; writing—original draft preparation, D.L. and Z.Z.; writing—review and editing, K.X., D.L., Z.Z., C.X., W.Q. and L.Y.; supervision, K.X., C.X., W.Q. and L.Y.; funding acquisition, K.X. All authors have read and agreed to the published version of the manuscript.

Funding

This research was funded by National Natural Science Foundation Youth Fund grant number [12002150]; Ministry of Education of China’s Youth Fund for Humanities and Social Sciences grant number [24YJAZH188]; Open Project of the Key Laboratory of Aerodynamic Noise Control grant number [ANCL20230302].

Data Availability Statement

The images supporting Figure 1, Figure 2, Figure 3, Figure 4, Figure 5, Figure 6, Figure 7, Figure 8, Figure 9, Figure 10 and Figure 11 are publicly available in the figshare repository. The data supporting Table 1 have been made public. However, these datasets involve the confidentiality of our institution and thus are not available for public access.

Conflicts of Interest

The authors declare that they have no conflict of interest.

References

  1. Bolleter, U.; Crocker, M.J. Theory and measurement of modal spectra in hard-walled cylindrical ducts. J. Acoust. Soc. Am. 1972, 51, 1439–1447. [Google Scholar] [CrossRef]
  2. Moore, C.J. Measurement of radial and circumferential modes in annular and circular ducts. J. Sound Vib. 1979, 62, 235–256. [Google Scholar] [CrossRef]
  3. Morfey, C. Sound transmission and generation in ducts with flow. J. Sound Vib. 1971, 14, 37–55. [Google Scholar] [CrossRef]
  4. Gjoni, E. Numerical Study on Acoustic Phenomena in Cavities for Aero-engine Applications. Master’s Thesis, Politecnico di Torino, Torino, Italy, 2023. [Google Scholar]
  5. Sijtsma, P.; Brouwer, H. Deconvolution of azimuthal mode detection measurements. J. Sound Vib. 2018, 42, 1–14. [Google Scholar] [CrossRef]
  6. Xu, K.B.; Qiao, W.Y.; Huo, S.Y.; Wei, R.K.; Tong, F. Research of mode identification and error transfer property on fan tonal noise. J. Propuls. Technol. 2018, 39, 185–195. [Google Scholar]
  7. Enghardt, L.; Lowis, C.; Neuhaus, L. Broadband sound power determination in flow ducts. In Proceedings of the 10th AIAA/CEAS Aeroacoustic Conference, Manchester, UK, 10–12 May 2004. AIAA-2004–2940. [Google Scholar]
  8. Ganz, U.W.; Joppa, P.D.; Patten, T.J.; Scharpf, D.F. Boeing 18-Inch Fan Rig Broadband Noise Test; Technical Report CR-1998-208704; NASA: Washington, DC, USA, 1998. [Google Scholar]
  9. Xu, K.B.; Qiao, W.Y.; Huo, S.Y. Experimental of fan broadband noise determination based on rotating axial arrays. J. Acta Aeronaut. Astronaut. Sin. 2017, 38, 121–132. [Google Scholar]
  10. Kopiev, V.F.; Bersenev, Y.V.; Viskova, T.A.; Burdakov, R.V.; Palchikovskiy, V.V.; Belyaev, I.V.; Kustov, O.Y.; Ershov, V.V. Azimuthal modes measurement in an intake duct for a turbofan engine. Procedia Eng. 2017, 176, 273–277. [Google Scholar] [CrossRef]
  11. Bu, H.X.; Huang, X.; Zhang, X. A compressive-sensing-based method for radial mode analysis of aeroengine fan noise. J. Sound Vib. 2020, 464, 114930. [Google Scholar] [CrossRef]
  12. Yu, W.J.; Ma, Z.Y.; Lau, A.S.H.; Huang, X. Analysis and experiment of the compressive sensing approach for duct mode detection. AIAA J. 2018, 56, 648–657. [Google Scholar] [CrossRef]
  13. Jürgens, W.; Pardowitz, B.; Enghardt, L.; Tapken, U. Separation of broadband noise sources in aeroengine ducts with respect to modal decomposition. In Proceedings of the 17th AIAA/CEAS Aeroacoustic Conference, Portland, OR, USA, 5–8 June 2011. AIAA-2011-2879. [Google Scholar]
  14. Dyer, I. Measurement of noise sources in ducts. J. Acoust. Soc. Am. 1958, 30, 833–841. [Google Scholar] [CrossRef]
  15. Michalke, A.; Arnold, F.; Holste, F. On the coherence of the sound field in a circular duct with uniform mean flow. J. Sound Vib. 1996, 190, 261–271. [Google Scholar] [CrossRef]
  16. Enghardt, L.; Holewa, A.; Tapken, U. Comparison of different analysis techniques to decompose a broadband ducted sound field in its mode constituents. In Proceedings of the 13th AIAA/CEAS Aeroacoustics Conference, Rome, Italy, 21–23 May 2007. AIAA-2007-3520. [Google Scholar]
  17. Jürgens, W.; Tapken, U.; Pardowitz, B.; Kausche, P.; Bennett, G.J.; Enghardt, L. Technique to analyse characteristics of turbomachinery broadband noise sources. In Proceedings of the 16th AIAA/CEAS Aeroacoustics Conference, Stockholm, Sweden, 7–9 June 2010. AIAA-2010-3979. [Google Scholar]
  18. Tapken, U.; Gutsche, D.; Enghardt, L. Radial mode analysis of broadband noise in flow ducts using a combined axial and azimuthal sensors array. In Proceedings of the 20th AIAA/CEAS Aeroacoustics Conference, Atanta, GA, USA, 16–20 June 2014. AIAA-2014-3318. [Google Scholar]
  19. Venkateswaran, R.K. Characterization and Source Separation of Turbofan Broadband Noise Using Intra-Stage Measurements. Ph.D. Thesis, University of Southampton, Southampton, UK, 2025. [Google Scholar]
  20. Huang, G.; Jensen, J.R.; Chen, J.; Benesty, J.; Christensen, M.G.; Sugiyama, A.; Elko, G.; Gaensler, T. Advances in microphone array processing and multichannel speech enhancement. In Proceedings of the ICASSP 2025—2025 IEEE International Conference on Acoustics, Speech and Signal Processing (ICASSP), Hyderabad, India, 6–11 April 2025; IEEE: Singapore, 2025; pp. 1–5. [Google Scholar]
  21. Jeong, W.; Lee, S.; Joseph, P. A wall-mounted source array for the excitation of incoherent broadband sound fields with prescribed modal distributions in ducts. J. Sound Vib. 2006, 290, 490–499. [Google Scholar] [CrossRef]
  22. Fauqueux, S.; Mons, V. Microphone array design for the modal analysis of in-duct broadband noise. J. Sound Vib. 2025, 618, 119356. [Google Scholar] [CrossRef]
  23. Du, S.; Dong, H.; Cong, L.; Li, S. Underwater target depth estimation: A shallow-water broadband acoustic source depth estimation method based on corrected warping transformation. PLoS ONE 2025, 20, e0318201. [Google Scholar]
  24. Lokhande, S.; Malarkodi, A.; Latha, G.; Srinivasan, S. Autonomous detection, localization and tracking of ships by underwater acoustic sensing using vector sensor array. Appl. Ocean Res. 2025, 154, 104389. [Google Scholar] [CrossRef]
  25. Yi, H.; Jiao, F.; Cao, H.; Zhang, J.; Zou, Y. Numerical simulations of molten pool dynamics in wire-arc directed energy deposition processes: A review. J. Manuf. Process. 2025, 134, 970–997. [Google Scholar] [CrossRef]
  26. Desiderio, L.; Falletta, S.; Ferrari, M.; Scuderi, L. On the coupling of the curved virtual element method with the one-equation boundary element method for 2D exterior Helmholtz problems. SIAM J. Numer. Anal. 2022, 60, 2099–2124. [Google Scholar] [CrossRef]
  27. Li, W.; Wen, H.; Guo, J. Acoustic Absorption and Radiation Features of Quasi-Periodic Acoustic Black Hole Rib Rings of Overlays. J. Vib. Eng. Technol. 2025, 13, 347. [Google Scholar] [CrossRef]
  28. Goldstein, M.E. Aeroacoustics; McGraw-Hill International Book Company: New York, NY, USA, 1976. [Google Scholar]
  29. Mao, Y.; Yoo, U.; Yao, Y.; Syed, S.N.; Bondi, L.; Francis, J.; Oh, J.; Ichnowski, J. Visuo-Acoustic Hand Pose and Contact Estimation. arXiv 2025, arXiv:2508.00852. [Google Scholar]
  30. Xu, K.; Liu, C.; Tong, F.; Qiao, W. Numerical and Experimental Investigations of Modal Coherence Characteristics for the Determination of Broadband Noise in Flow Ducts. Front. Energy Res. 2022, 10, 873749. [Google Scholar] [CrossRef]
Figure 1. Application Advantages of the Combined Microphone Array Method.
Acoustics 07 00060 g001
Figure 2. Schematic Diagram of Sound Source Array and Microphone Array in Artificial Broadband Noise Field.
Acoustics 07 00060 g002
Figure 3. Comparison Results of Duct Broadband Noise Modal Coherence Coefficients and Modal Sound Power in Artificial Sound Field Environment. (a) Modal Coherence Coefficients and Modal Sound Power of Condition I. (b) Modal Coherence Coefficients and Modal Sound Power of Condition II. (c) Modal Coherence Coefficients and Modal Sound Power of Condition III. (d) Modal Coherence Coefficients and Modal Sound Power of Condition IV.
Acoustics 07 00060 g003
Figure 4. Calculation Results of Incident and Reflected Sound Waves. (a) Sound Power of Incident Sound Waves Calculated by Three Methods. (b) Sound Power of Reflected Sound Waves Calculated by Three Methods.
Acoustics 07 00060 g004
Figure 5. Schematic Diagram of Fixed Microphone Array Scheme Design.
Acoustics 07 00060 g005
Figure 6. Schematic Diagram of Rotating Microphone Array Scheme Design.
Acoustics 07 00060 g006
Figure 7. Sound Power of (1, 0) Mode Propagating Forward and Backward at Three Rotational Speeds. (a) 80% of Design Speed. (b) 90% of Design Speed. (c) 100% of Design Speed.
Acoustics 07 00060 g007aAcoustics 07 00060 g007b
Figure 8. Total Sound Power of Forward- and Backward-Propagating Waves at Three Rotational Speeds. (a) 80% of Design Speed. (b) 90% of Design Speed. (c) 100% of Design Speed.
Acoustics 07 00060 g008
Figure 9. Sound Power of (0, 0) Mode. (a) Sound Power of Backward-Propagating (0, 0) Mode. (b) Sound Power of Forward-Propagating (0, 0) Mode.
Acoustics 07 00060 g009
Figure 10. Sound Power of (1, 0) Mode. (a) Sound Power of Backward-Propagating (1, 0) Mode. (b) Sound Power of Forward-Propagating (1, 0) Mode.
Acoustics 07 00060 g010aAcoustics 07 00060 g010b
Figure 11. Total Broadband Noise Sound Power in Airflow Duct. (a) Total Sound Power of Backward-Propagating Waves. (b) Total Sound Power of Forward-Propagating Waves.
Acoustics 07 00060 g011aAcoustics 07 00060 g011b
Table 1. Sound Source Array Distribution Schemes in Numerical Verification of CSA Method.
Sound Source Array No. S x S f Total Number
Condition I111
Condition II11212
Condition III21224
Condition IV1012120
Disclaimer/Publisher’s Note: The statements, opinions and data contained in all publications are solely those of the individual author(s) and contributor(s) and not of MDPI and/or the editor(s). MDPI and/or the editor(s) disclaim responsibility for any injury to people or property resulting from any ideas, methods, instructions or products referred to in the content.