1. Introduction
In the brake development process of modern cars, investigations focus more and more on the NVH behaviour. Customers not only take safety-relevant issues like brake performance and reliability for granted but are also not willing to accept loss in comfort. An important step towards a more efficient NVH development process is the integration of numerical methods. Virtually evaluating the system’s noise robustness reduces the need for prototypes and therefore accelerates the process and reduces costs.
In contrast to low-frequency brake noise, there is an established simulation method for squeal: complex eigenvalue analysis (CEA) [
1,
2]. CEA identifies the unstable modes of a linearised system. However, due to the linearisation of a nonlinear problem, it is still difficult to predict the squeal behaviour of a brake system with a high degree of certainty. For strongly nonlinear phenomena like low-frequency brake noises, CEA does not offer applicable results [
3]. A profound overview of brake squeal can be found in [
4,
5].
To develop a reliable simulation method, it is crucial to investigate and understand the excitation mechanisms leading to the considered brake noise. As these mechanisms are as manifold as the sounds the system may exhibit, it is important to classify the different brake noises, which is usually performed by frequency [
4]. Below 1000 Hz, we talk about low-frequency brake noise, and above 1000 Hz, they are defined as high-frequency brake noise or squeal. Honk noise, which in some research is also called moan noise, ranges between 200 and 600 Hz. It is strongly influenced by the axle and the wheel, which actually radiates the sound. Like creep groan, which is located from 70 to 100 Hz, this noise issue occurs at vehicle speeds below 1 km/h. Also, wet and cold conditions increase the system’s liability to produce honk noise.
While a variety of research on creep groan and its link to stick–slip has been published [
6,
7], honk noise was not reported to be of interest in the past. But since big and filigree wheel designs, which are in vogue, tend to exhibit more honk noise, this phenomenon comes more and more to the fore. In [
6], the relation between stick–slip and creep groan was proven experimentally. Brecht et al. [
7] developed a minimal model for creep groan based on stick–slip excitation and discussed the influence of the static and dynamic coefficient of friction.
Wang et al. presented a simulation model for honk noise based on stick–slip [
8]. It was found that the stiffness of individual components does not influence the system’s tendency to exhibit moan. Yet in experiments, we observed that, for example, the wheel stiffness as well as the stiffness of bearings influence the system’s behaviour in this frequency range. Kim et al. [
9] investigated the suitability of CEA for predicting a system’s tendency for honk noise. Due to the linearisation of the system, the nonlinear excitation was not considered. Bauer et al. [
10] also proposed CEA to simulate honk noise because in experiments, they observed similarities to squeal. Gugino et al. [
11] built a multi-body model for honk noise, focussing on the trailing arm and analysing the effects of some countermeasures.
However, the mechanisms leading to a change from creep groan to honk noise have not been investigated yet. This paper presents some experimental results which show the strongly nonlinear behaviour of a brake system. We observe a bifurcation behaviour, which leads to sudden jumps between creep groan and honk noise depending on the initial conditions as well as the system and operational parameters. This behaviour is typical for nonlinear systems and can be explained by analysing a one-degree-of-freedom oscillator with harmonic excitation called a Duffing oscillator [
12]. In [
13], the jump frequencies of the Duffing oscillator were approximated analytically, depending on the excitation. Between these jump frequencies, different solutions exist, and the system’s behaviour is strongly dependent on the initial conditions.
Lee et al. [
14] emphasised the influence of nonlinearities on the occurrence of brake noise. On the one hand, the excitation mechanism is required for a system to exhibit brake noise. On the other hand, we can observe that under apparently similar conditions, which also means the same excitation, a system can, for example, squeal or remain quiet. This behaviour is traced to the sensitivity of nonlinear systems to the initial conditions. Popp et al. [
15] proved that the nonlinearity caused by stick–slip excitation can lead to periodic solutions as well as chaos, depending on the system’s damping. Consequently, in addition to the excitation and nonlinearities, the system parameters also play an important role in modelling.
Hetzler et al. [
16] investigated the bifurcation behaviour of a single stick–slip oscillator during slip. It is stated that at least a cubic dependency between the dynamic friction coefficient and the sliding velocity is necessary for bifurcations to occur. The authors related the presented analytical investigations to creep groan.
It is evident that the friction surface is characterised by significant non-homogeneity and elastic properties. An established model representation for the brake pad is that of multiple elastically coupled stick–slip oscillators. It has been demonstrated that these oscillators possess the capacity for self-organisation, resulting in a range of outcomes including harmonic oscillations, chaos, or pattern formation [
15]. This excitation mechanism is referred to as ‘micro stick–slip’, as outlined in [
14].
Based on the experimental results, we developed a nonlinear minimal model of coupled mass oscillators, which demonstrates the mechanisms leading to the onset of honk noise. Firstly, we vary the initial conditions while the excitation mechanism is maintained. Secondly, the normal force and one stiffness term are changed. Based on these results, we show and discuss the applicability of the model to real brake systems.
2. Materials and Methods
2.1. Experimental Method
The system under investigation in the present study consisted of a half axle, a brake, and a wheel, which was driven by a roller test bench. The rotational speed was maintained at a constant value of 0.5 rpm, while the brake pressure was gradually increased until a steady creep groan arose.
Starting from this state, there are two ways to provoke honk noise. The first is slowly decreasing the brake pressure. The second and more reliable method, however, is to keep the brake pressure constant and press firmly in a horizontal direction against the upper control arm. With a light tap on the suspension, creep groan is restored.
In order to gain a more profound understanding of the system’s behaviour, an investigation was carried out on seven pad materials, which varied in the difference between the static and dynamic friction coefficient. .
2.2. Simulation Method
To model the stick–slip excitation in the contact area, the classical mass-on-belt model, as described in [
17], was used. In this model, the belt represents the disc rotating with a velocity
. The pad is modelled by the mass
, and the friction is described by Coulomb’s law.
As we will see in
Section 3.1, all parts of the real system showed a similar amplitude spectrum. Thus, during honk noise, the brake pads also performed a harmonic oscillation under stick–slip conditions. To achieve this kind of self-synchronization in the minimal model, we had to simulate the flexibility of the pad. Ostermeyer described a suitable model in [
18]. To simulate the change between creep groan and honk noise, it is sufficient to strongly simplify this approach. Therefore, we split the pad mass into two masses
and
connected by a spring and introduced the pad stiffness
. The masses were pushed against the belt by the normal force
.
It is evident that the stick–slip oscillator is strongly dependent on the adjacent components. Consequently, it was elastically coupled by the stiffness
to a mass
representing the axle and the wheel. The mass
was coupled to the ground by a spring with a stiffness
. Damping was neglected. The resulting model is pictured in
Figure 1.
The friction force
and the equations of motion
depend on the contact state of the pad mass, which can change between stick and slip. During stick, the relative velocity between the mass and belt is zero, and consequently, the acceleration also becomes zero. The acting force at the contact is the static friction force
. For example, in the event that both pad masses are sticking, the equations of motion simplify to
with the static friction force
In the event of the external restoring force of a pad mass exceeding the static friction force
, the mass will begin to slip, resulting in the dynamic friction force
acting within the contact area. In the event of both pad masses slipping, the equations of motion become
with the dynamic friction forces
and the relative velocity between the mass and belt being
.
Of course, it is also possible that one mass is slipping while the other one is sticking. In this case, the equations of motion result in the corresponding combination of equations explicitly described in Equations (
2) and (
3) as well as Equations (
4) and (
5), respectively.
The chosen values for the parameters of the model are listed in
Table 1.
To investigate the stability of the system, we considered the state space representation
with
:
In order to calculate the eigenvalues
by
we linearised the system during slip. Thus, additional stiffness terms
were produced, whereby
describes the the displacements of the equilibrium during slip. With the parameters in
Table 1, we obtained the complex eigenvalues of the linearised system listed in
Table 2. The imaginary part of the eigenvalues corresponds to the eigenfrequency, stated as the angular velocity
. The real part provides information on the stability behaviour of the natural oscillation. A negative real part indicates a stable oscillation, whilst a positive real part denotes an unstable oscillation. It can thus be concluded that the natural oscillations of the first pad mass and the axle mass are unstable, whilst the natural oscillation of the second pad mass is stable.
3. Results
3.1. Experimental Results
Figure 2 shows the spectrogram of the pad acceleration during braking at
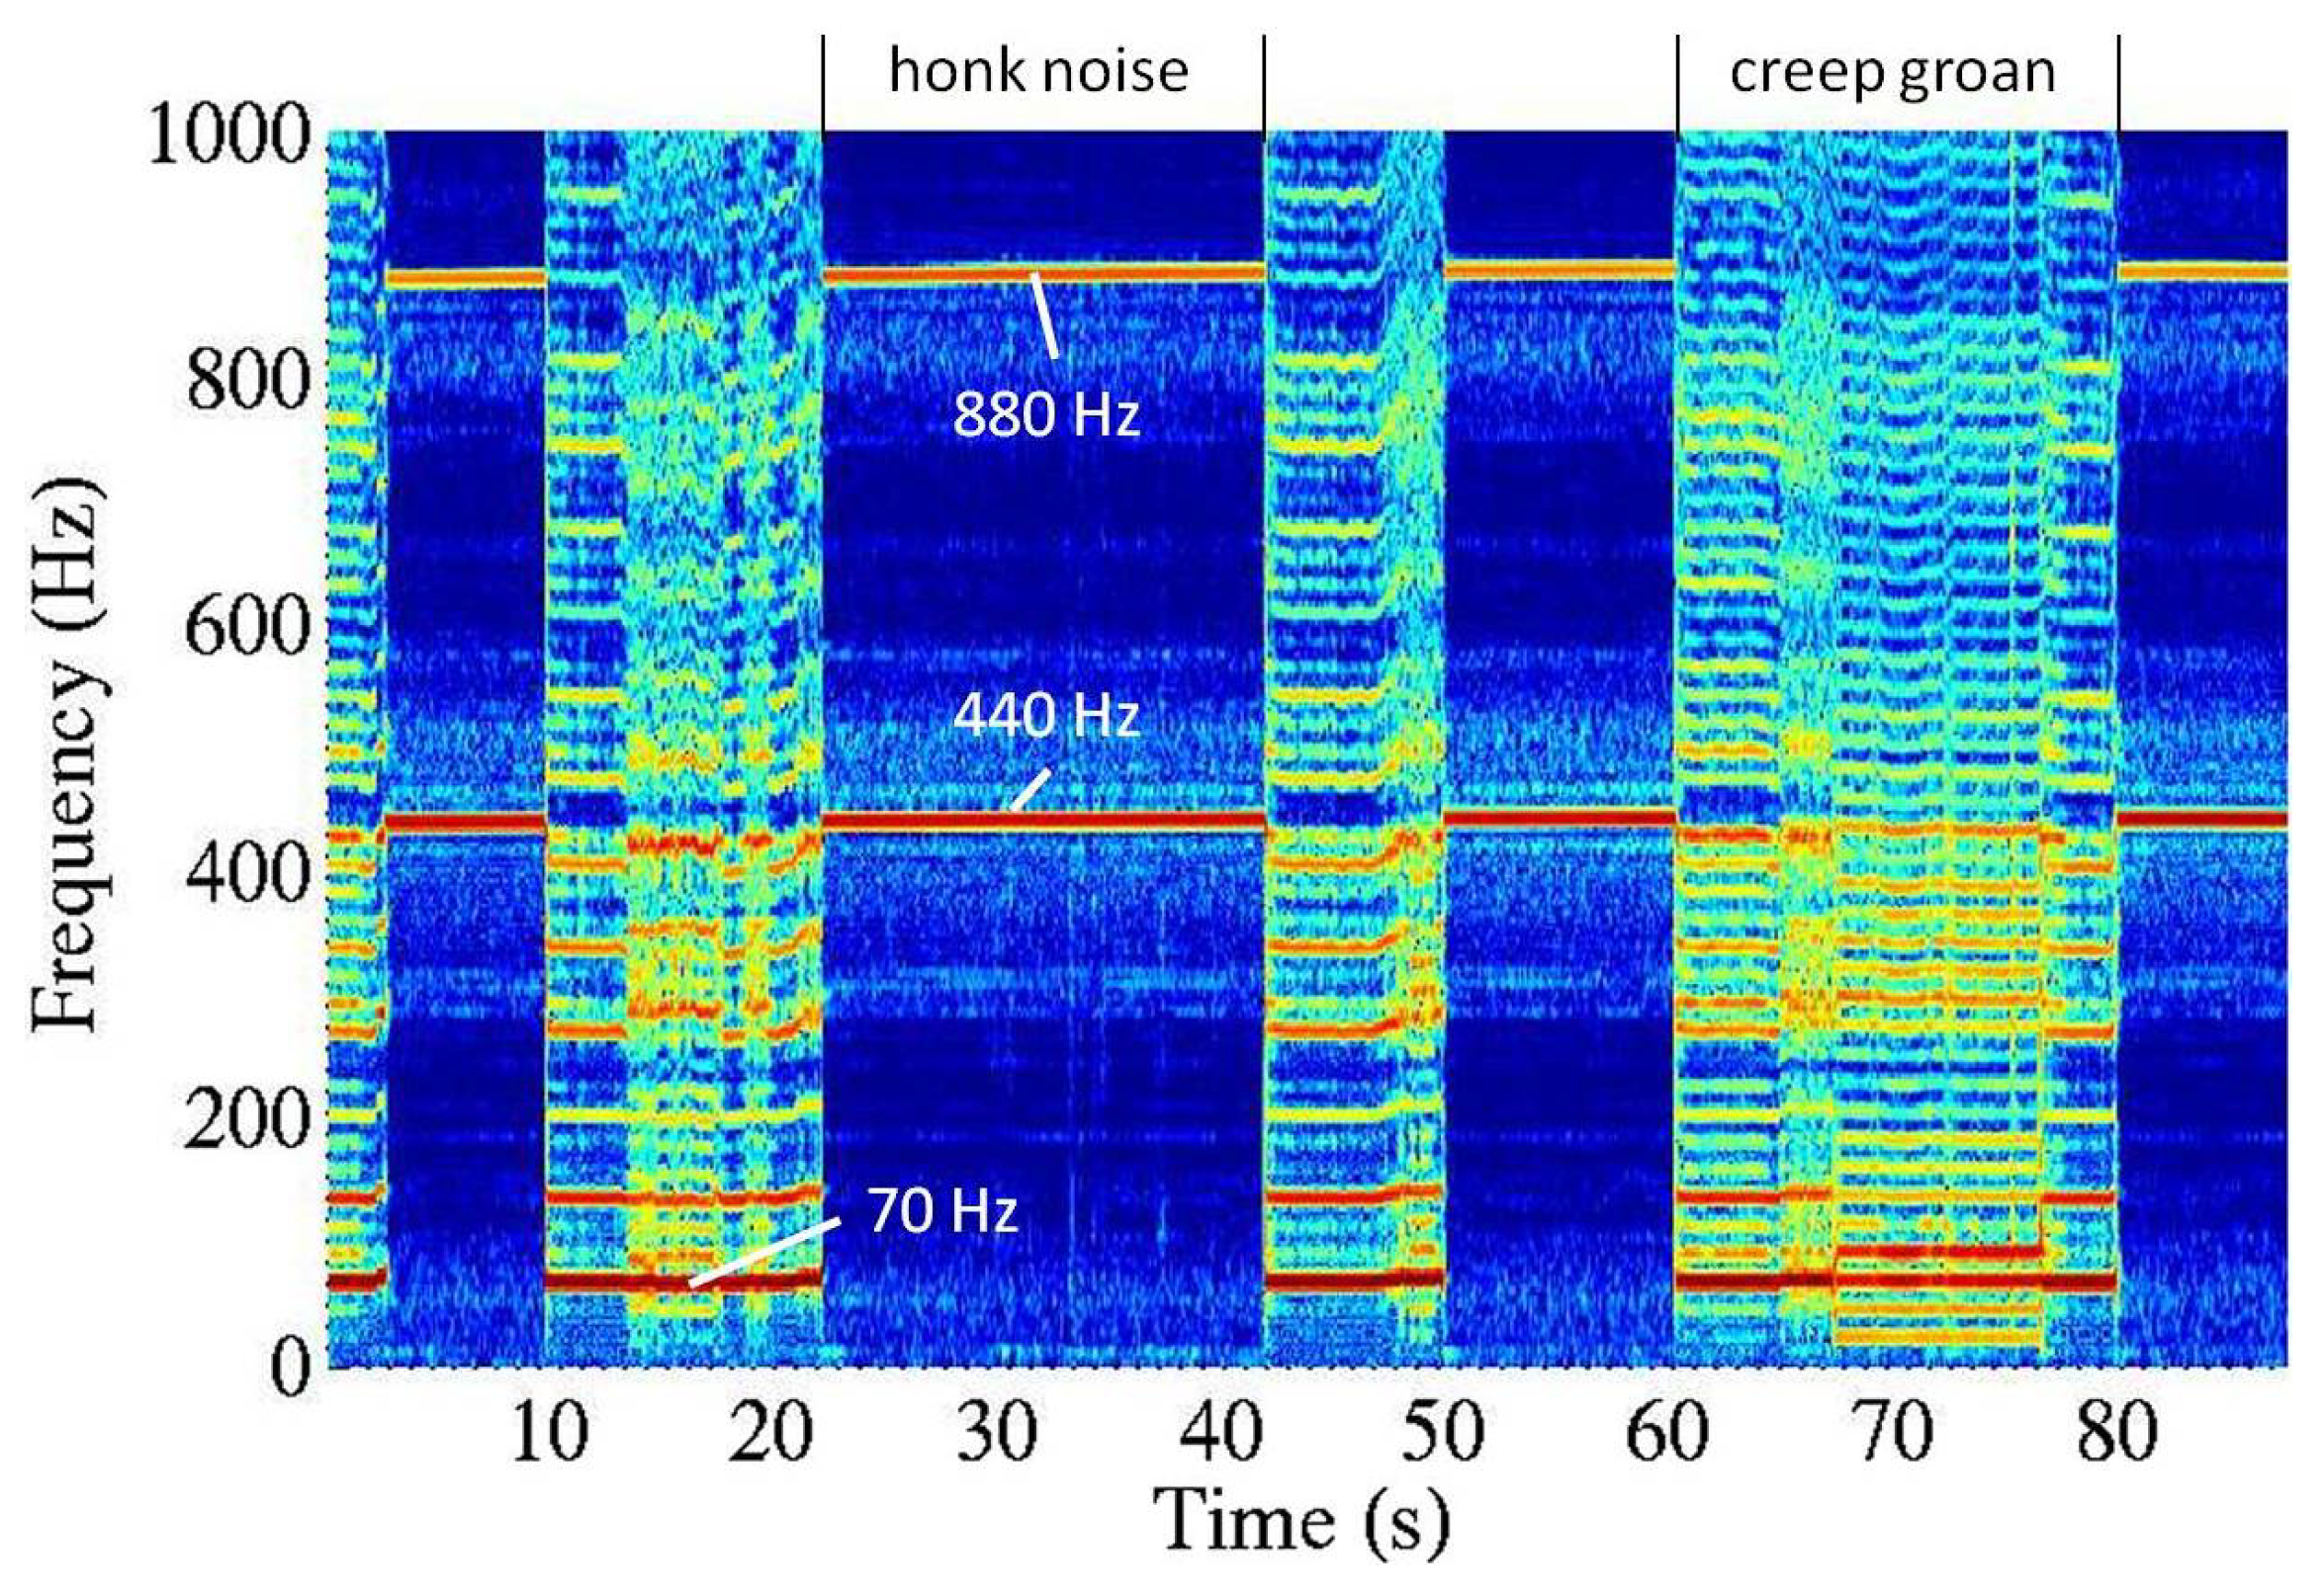
. We observed alternating periods of periodic and quasi-periodic oscillations. During honk noise, the oscillation was periodic, with a fundamental frequency of approximately 440 Hz. During the quasi-periodic intervals, the system exhibited creep groan, with a fundamental frequency of approximately 70 Hz. The signals at other measuring points, e.g., at the caliper or at the axle, qualitatively showed the same behaviour in the frequency domain. Therefore,
Figure 2 is representative of the system’s overall behaviour, and the spectrograms of other measuring points were not illustrated separately.
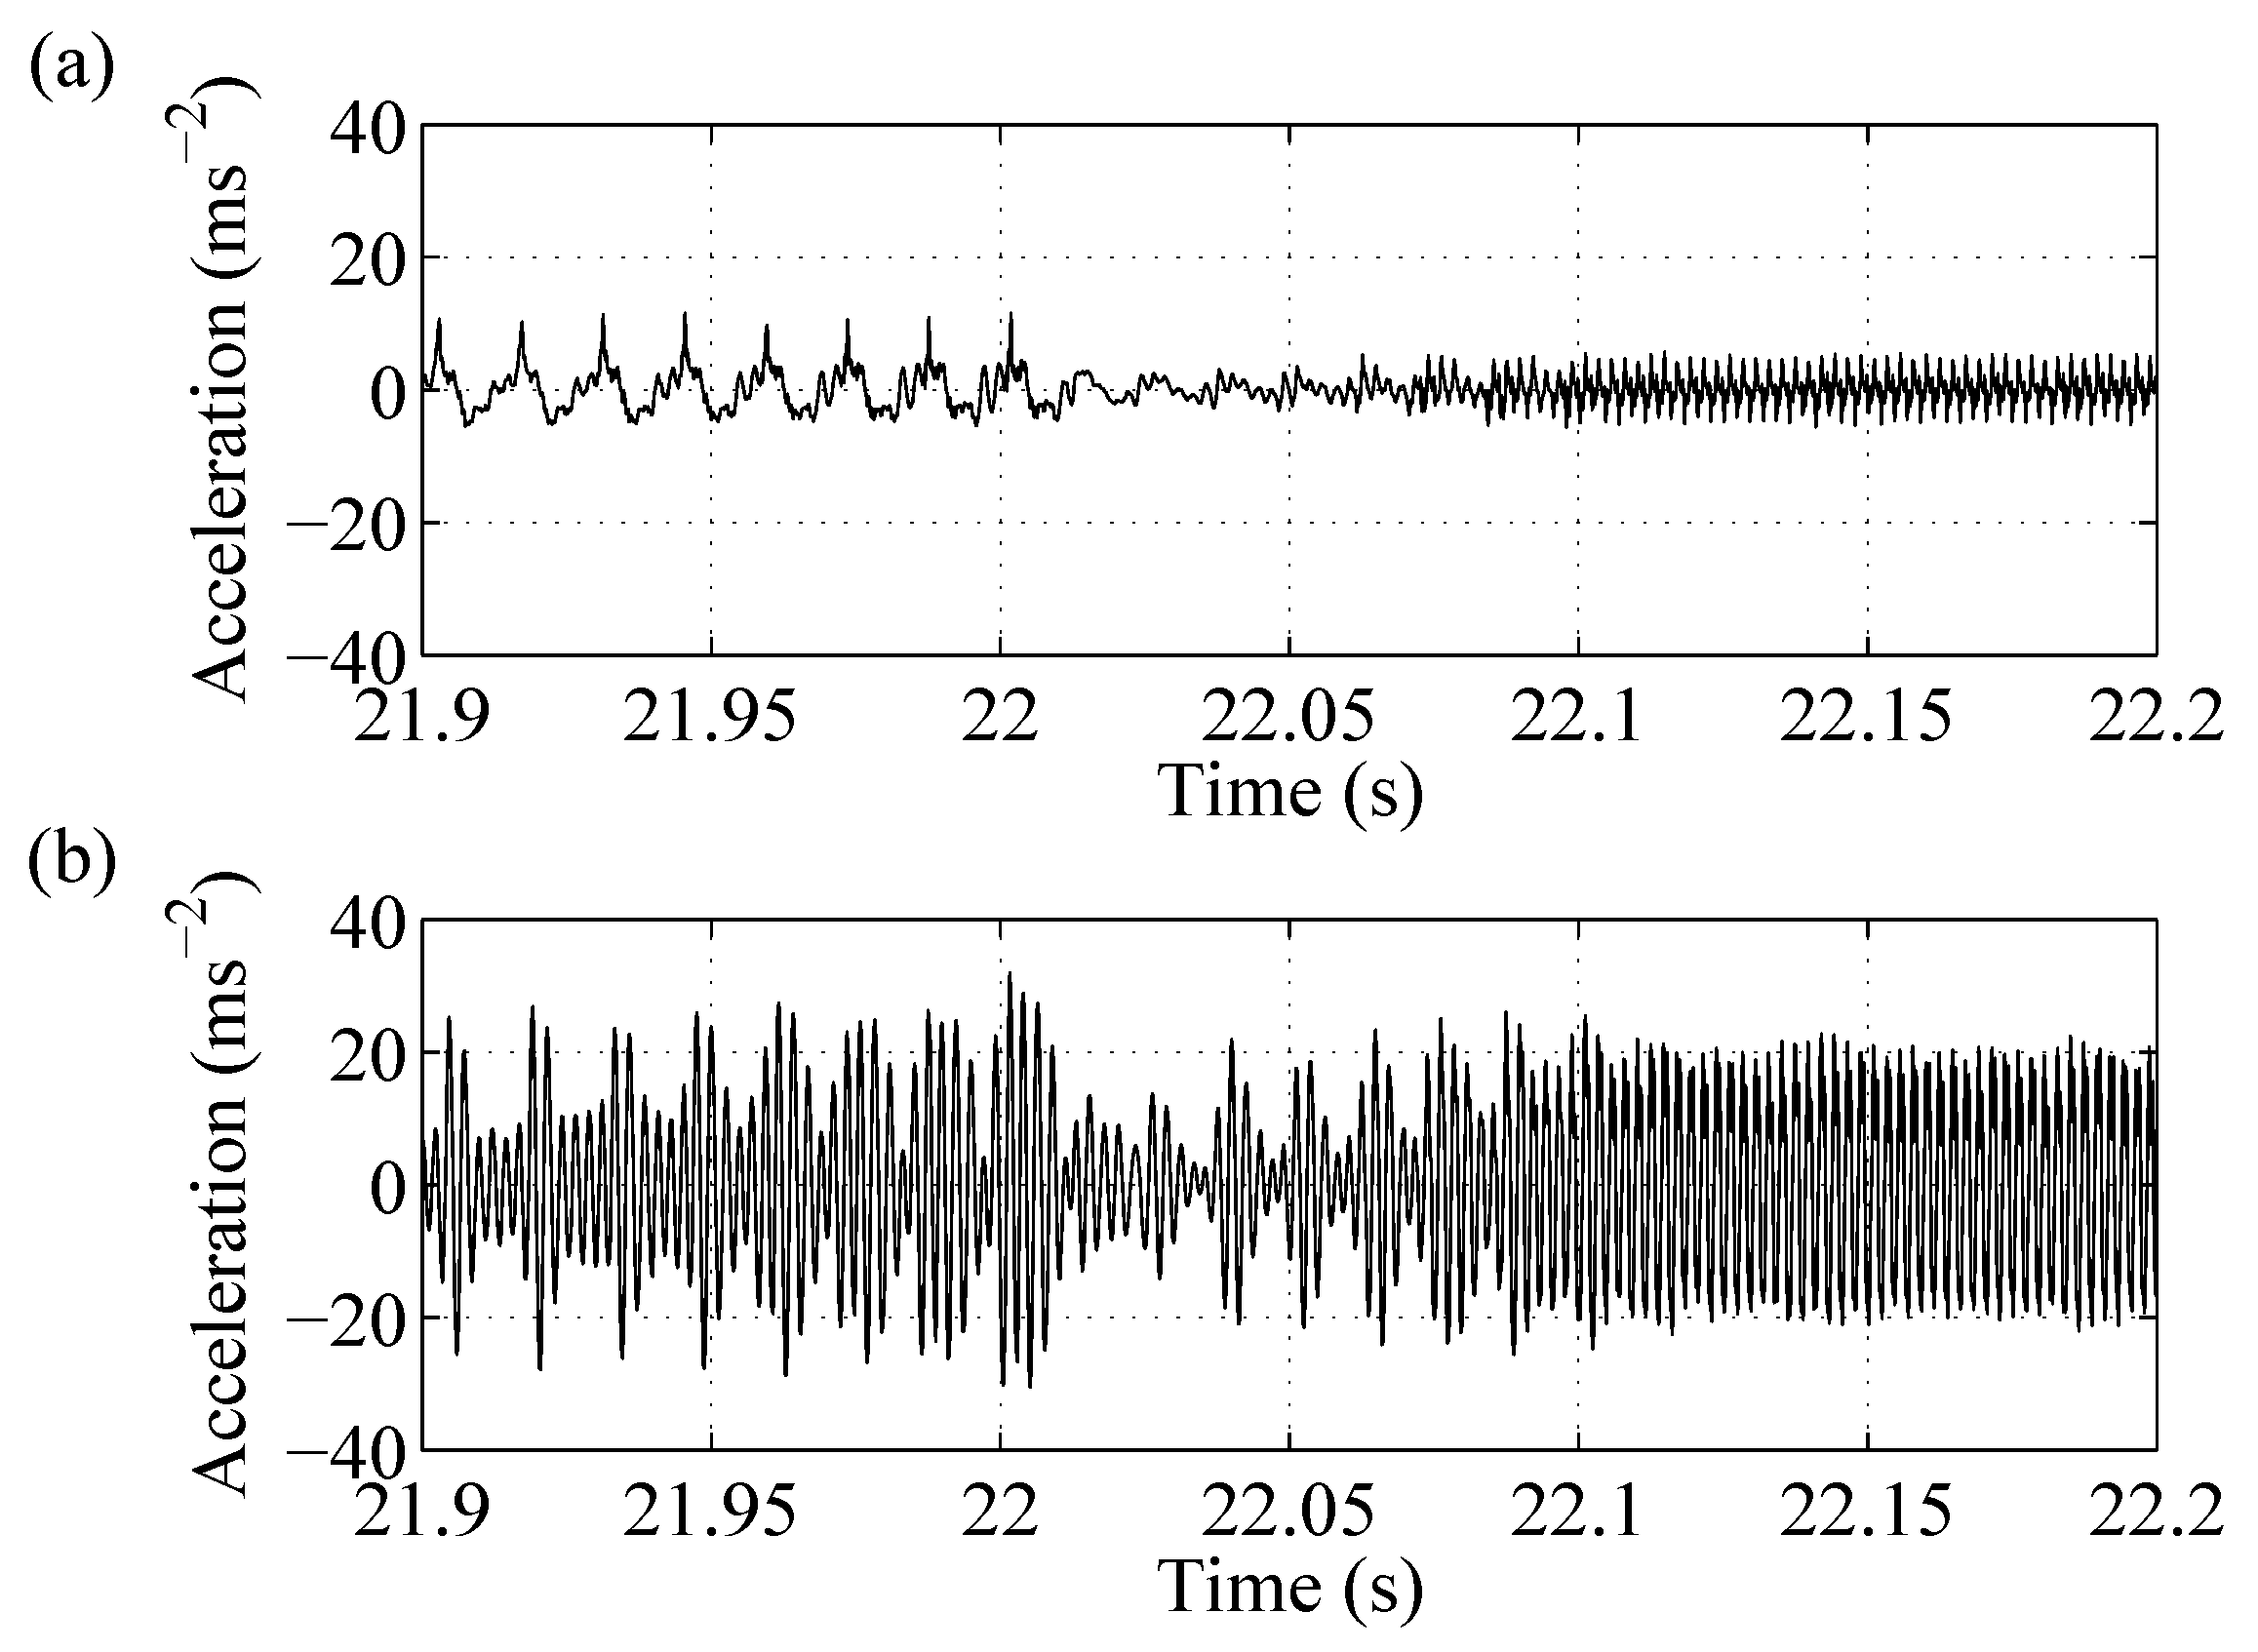
Figure 3 illustrates the time signals of the brake pad and the upper control arm accelerations during the change from creep groan to honk noise in detail. Looking at the pad acceleration during creep groan, we observed a sawtooth characteristic, which is typical for stick–slip. The sawtooth characteristic was superimposed by higher-frequency oscillations. After pushing against the upper control arm at approximately 22 s, the pad movement slowly turned into a harmonic oscillation with half of the amplitude. The excitation affected the whole axle, which was demonstrated well by the acceleration signal of the upper control arm. Resonance emerged, and three to four times higher acceleration amplitudes than the pad were shown.
In the course of the experiments, a subjective evaluation was conducted to rate the propensity of the pad for generating honk noise, alongside the reproducibility of the noise. The rating was influenced by a number of factors. One factor was how easily the honk noise could be produced, and another was whether the honk noise stabilised or quickly reverted to creep groan. The brake pressure range in which the moaning noise occurred also influenced the rating. The intensity of the creep groan was also evaluated.
The results for the subjective ratings are shown in
Table 3, alongside the
value.
It is striking that the creep groan intensity did not correlate directly with the value. The values were laboratory values measured on a tribometer. They did not take into account the influences of the pad geometry or environmental influences (humidity or temperature). However, it is noticeable that the two pad materials with the highest values exhibited a high creep groan intensity. With the pad material with the lowest value, it was not possible to induce creep groan in the system.
From this, we can conclude that a minimum is required for the system to generate creep groan. Additionally, the system’s capability to exhibit creep groan is a necessary condition for honk noise to arise. On the other hand, brake pads having an extremely high value tended to exhibit creep groan with high amplitudes but were quite robust against honk noise. During our experiments, we also stiffened the axle by installing rubber bearings at the upper control arms that were twice as stiff as the ones for the reference system. Through this, the whole system became more liable to honk noise. The rating for pad variant 3, for example, was increased from − − to ++. The wheel design influences the robustness against honk noise and the honk frequency.
3.2. Simulation Results
The equations of motion were integrated using the Euler method with a step size of . For a clearer visualisation, and as the pad masses and behave in qualitatively the same way, in the following figures, only the displacement signals and spectrograms of the first pad mass are illustrated.
Figure 4 shows the results for the initial conditions
and
. Looking at the friction force, we can clearly identify the alternating periods of sticking and slipping. In the slip period, the dynamic friction force of
was in action. During sticking, the friction force reached
. For a pure stick–slip excitation, we would expect the typical sawtooth characteristic. Due to the coupling of the masses in the described case, the pad movement corresponded to a sawtooth characteristic superimposed by higher-frequency oscillations and therefore complied with the measured signals during creep groan, as explained in
Section 3.1. Compared with the pad oscillation, the axle displacement showed a qualitatively similar time signal, but the amplitudes were more irregular and about 100 times smaller.
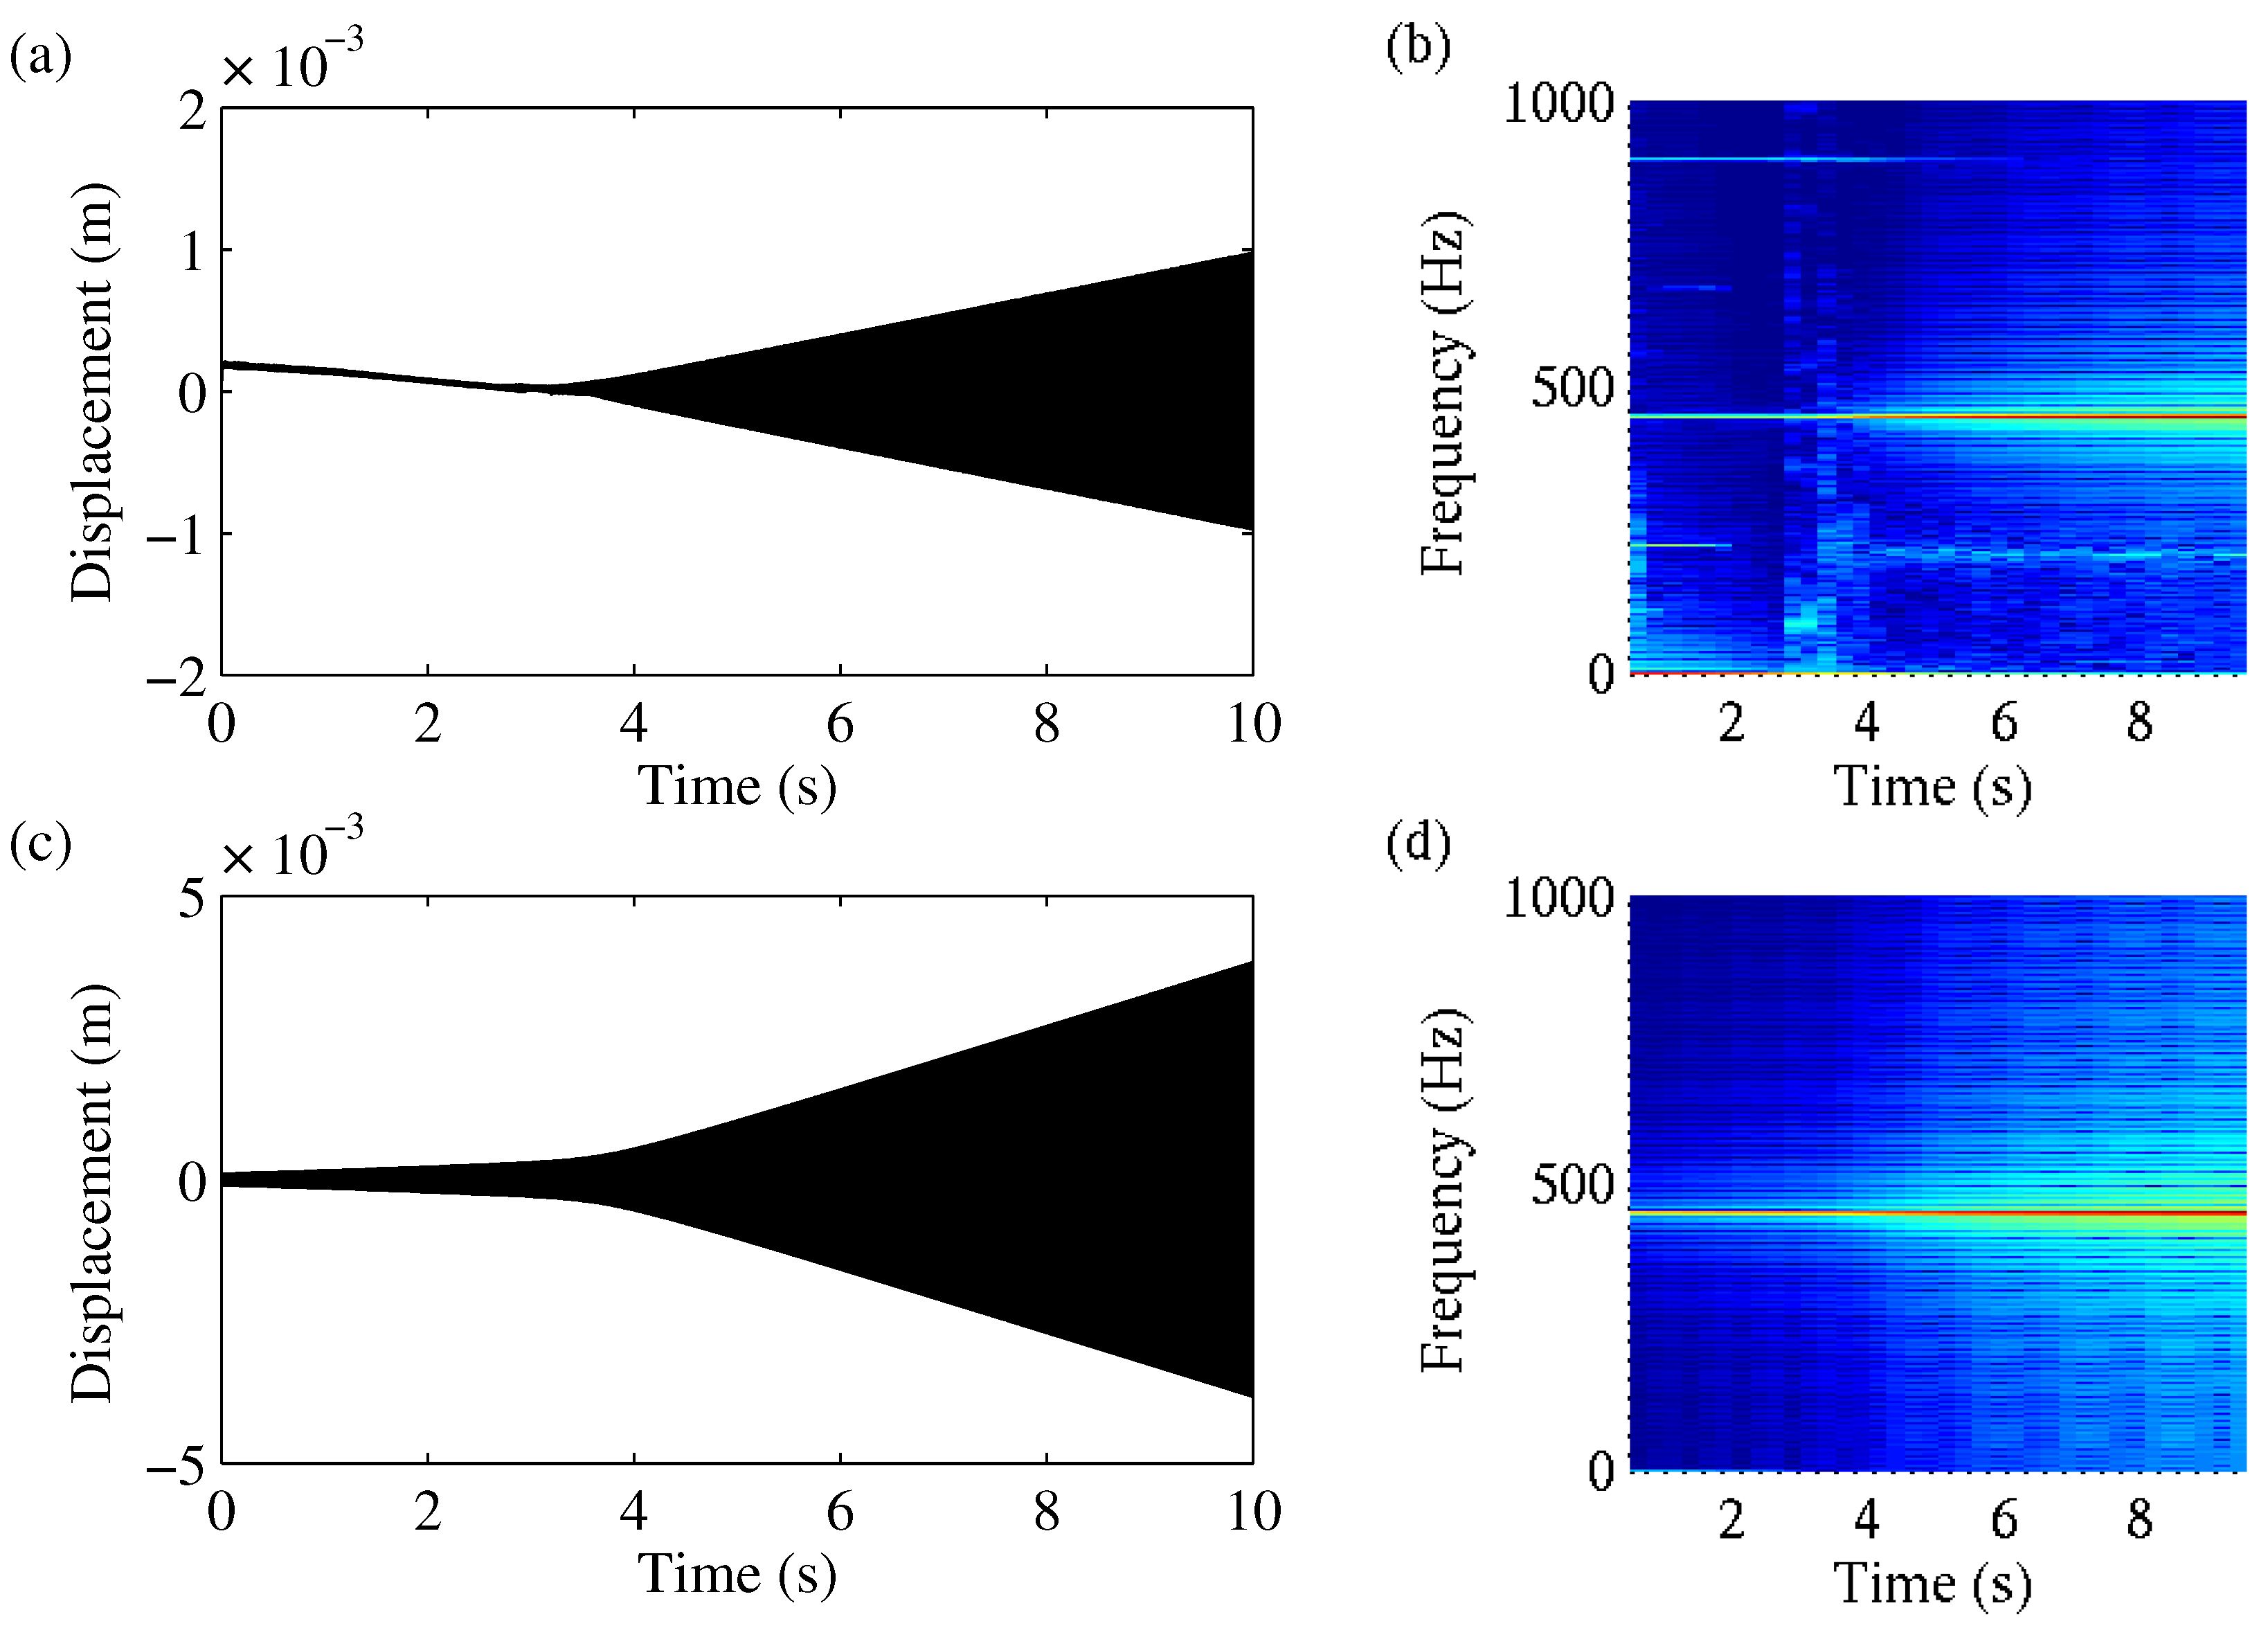
Figure 5 presents the system behaviour in the frequency domain over time. The pad oscillation resulted in a broadband amplitude spectrum with additional clear peaks at
and corresponding higher harmonics. The spectrogram of the axle movement showed less noise, but we observed the same harmonic frequencies and an additional clear peak at the eigenfrequency of the axle at 450 Hz.
By changing the initial conditions to
,
, and
, the system behaviour changed drastically, as illustrated in
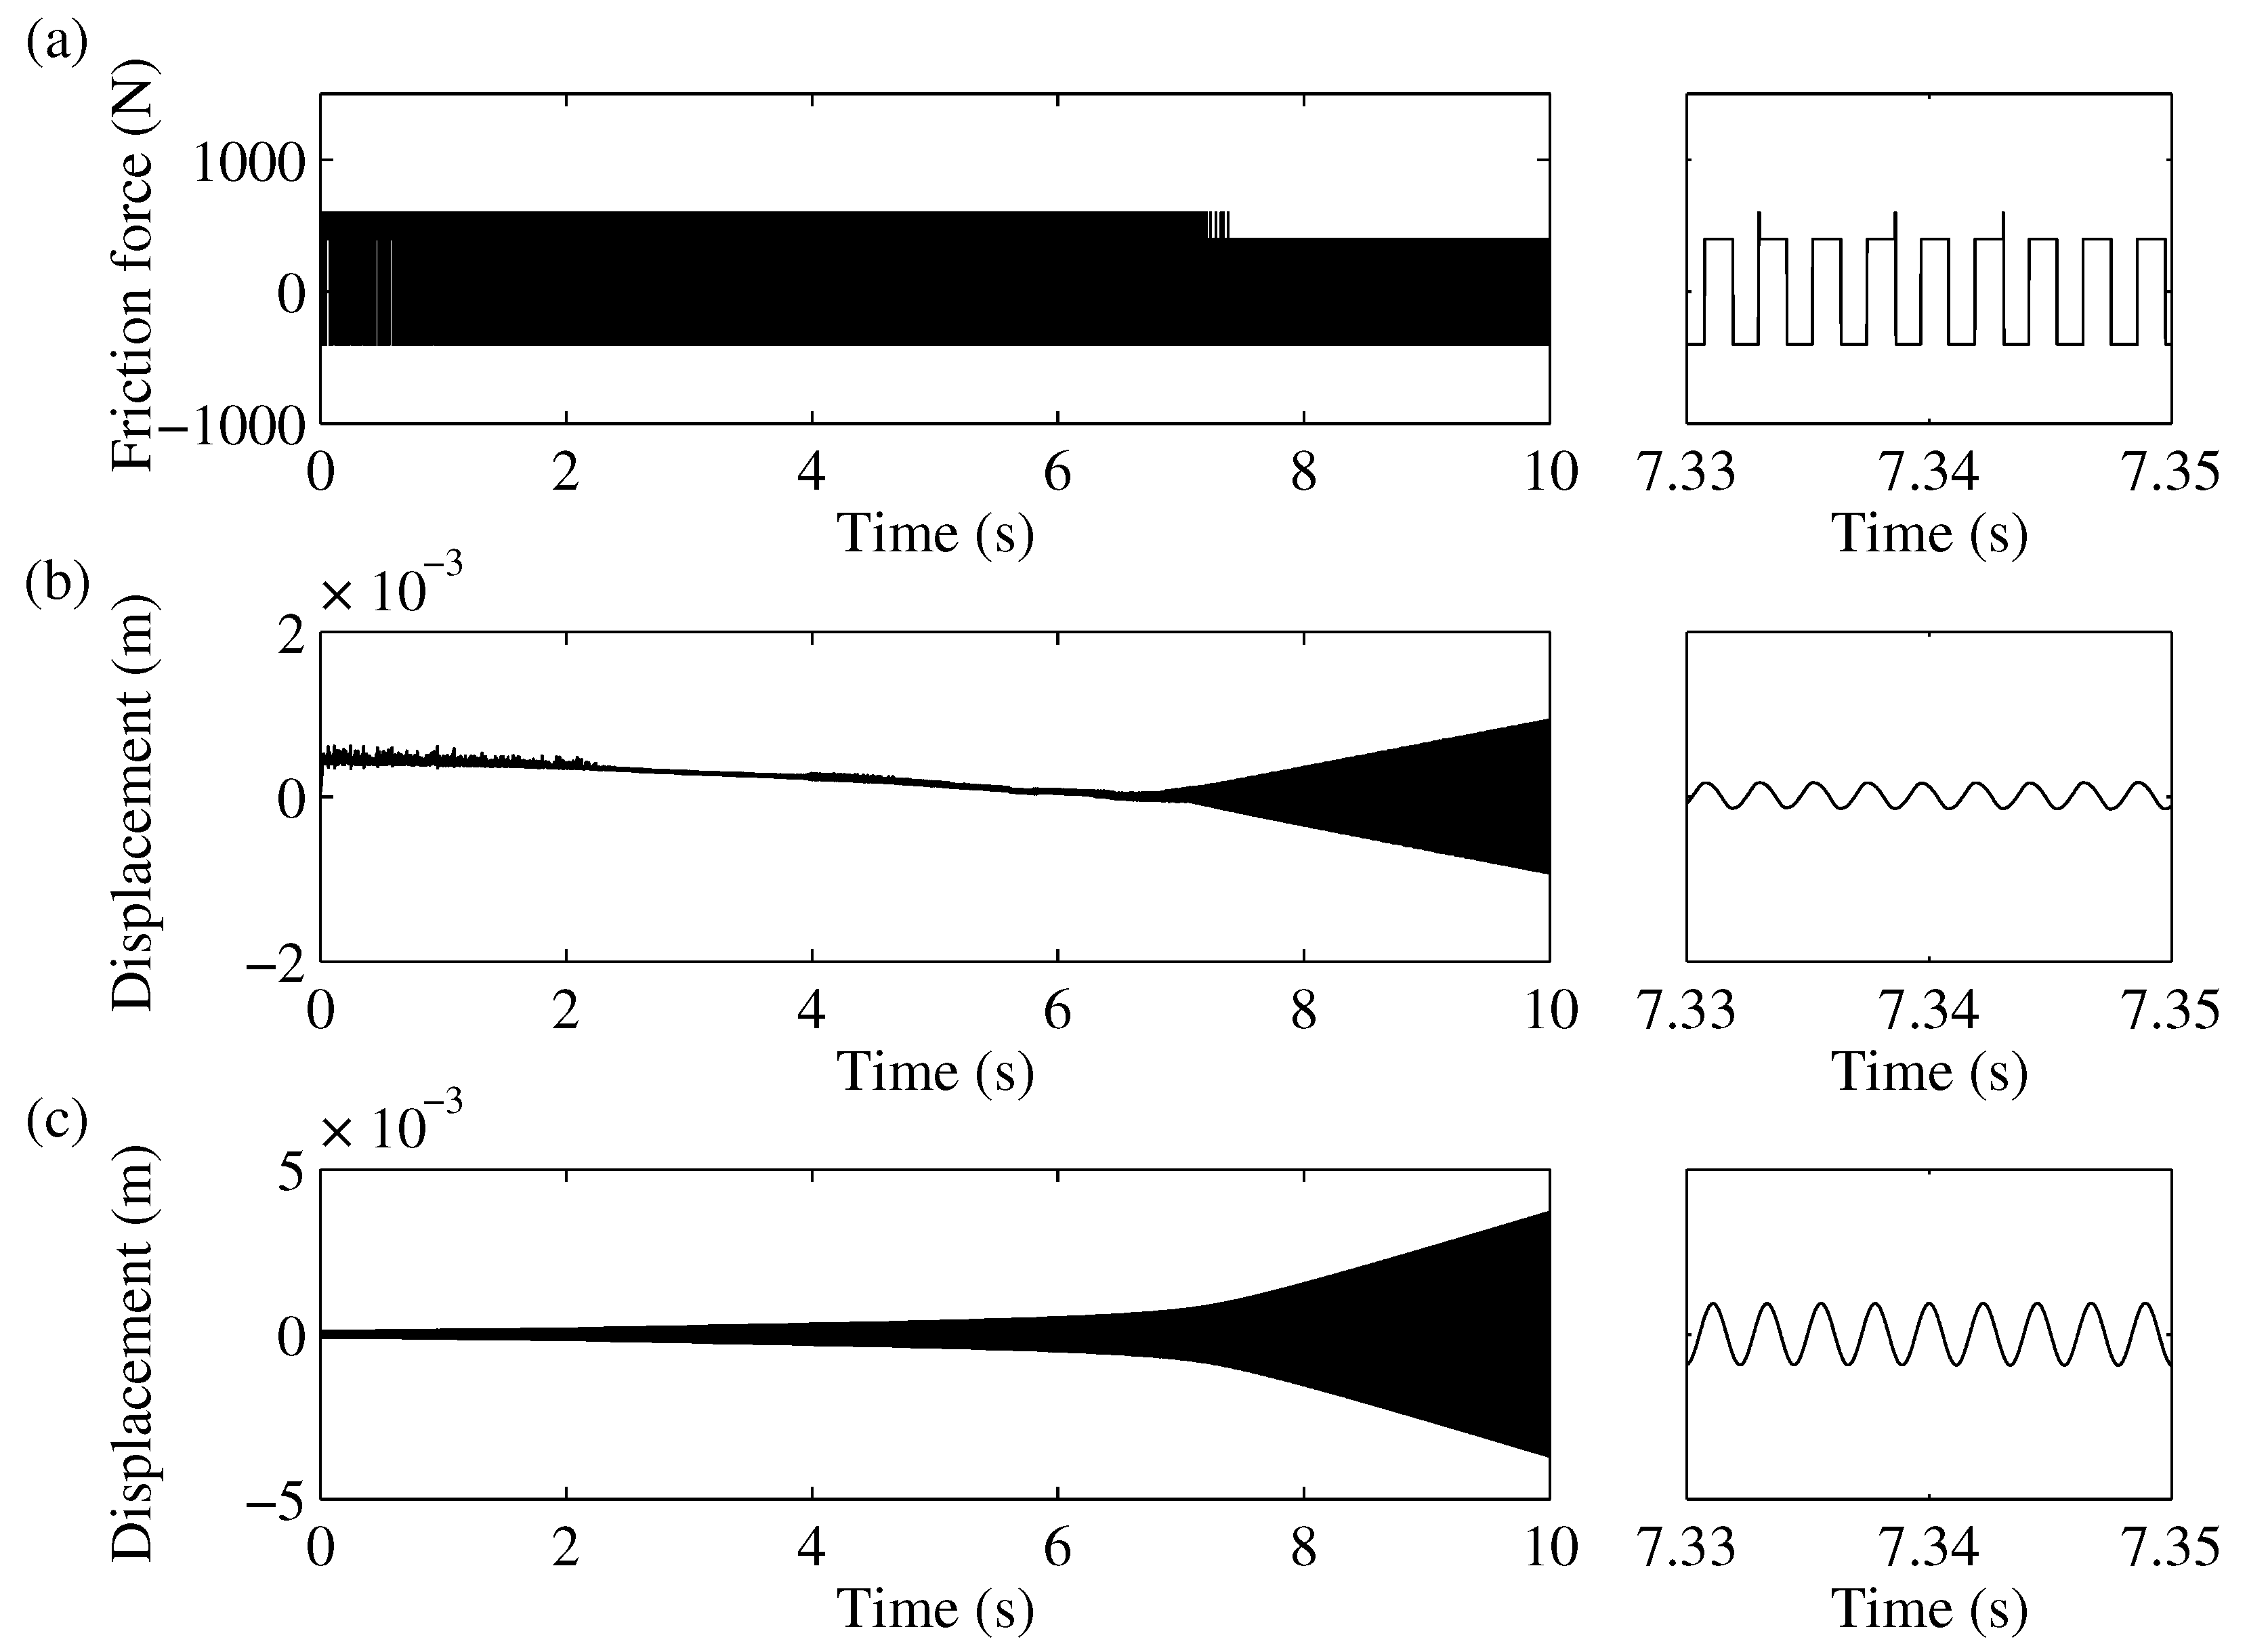
Figure 6. The amplitudes of the pad as well as the axle displacement rose continuously. The amplitudes of the axle were twice the amplitudes of the pad. At a certain state, after approximately
s, the amplitudes of the pad exceeded a certain value, and thus the pad masses did not stick but rather slid continually. Thus, from this point on, the friction force alternated between
and
.
Figure 7 shows the related spectrogram of the pad and axle displacements. The axle mass oscillated harmonically with a frequency of 450 Hz. After a transient phase with a broadband characteristic, the pad also oscillated harmonically with the same frequency. The results obtained after the small initial perturbation of the axle mass are comparable with the measured signals during honk noise, as described in
Section 3.1.
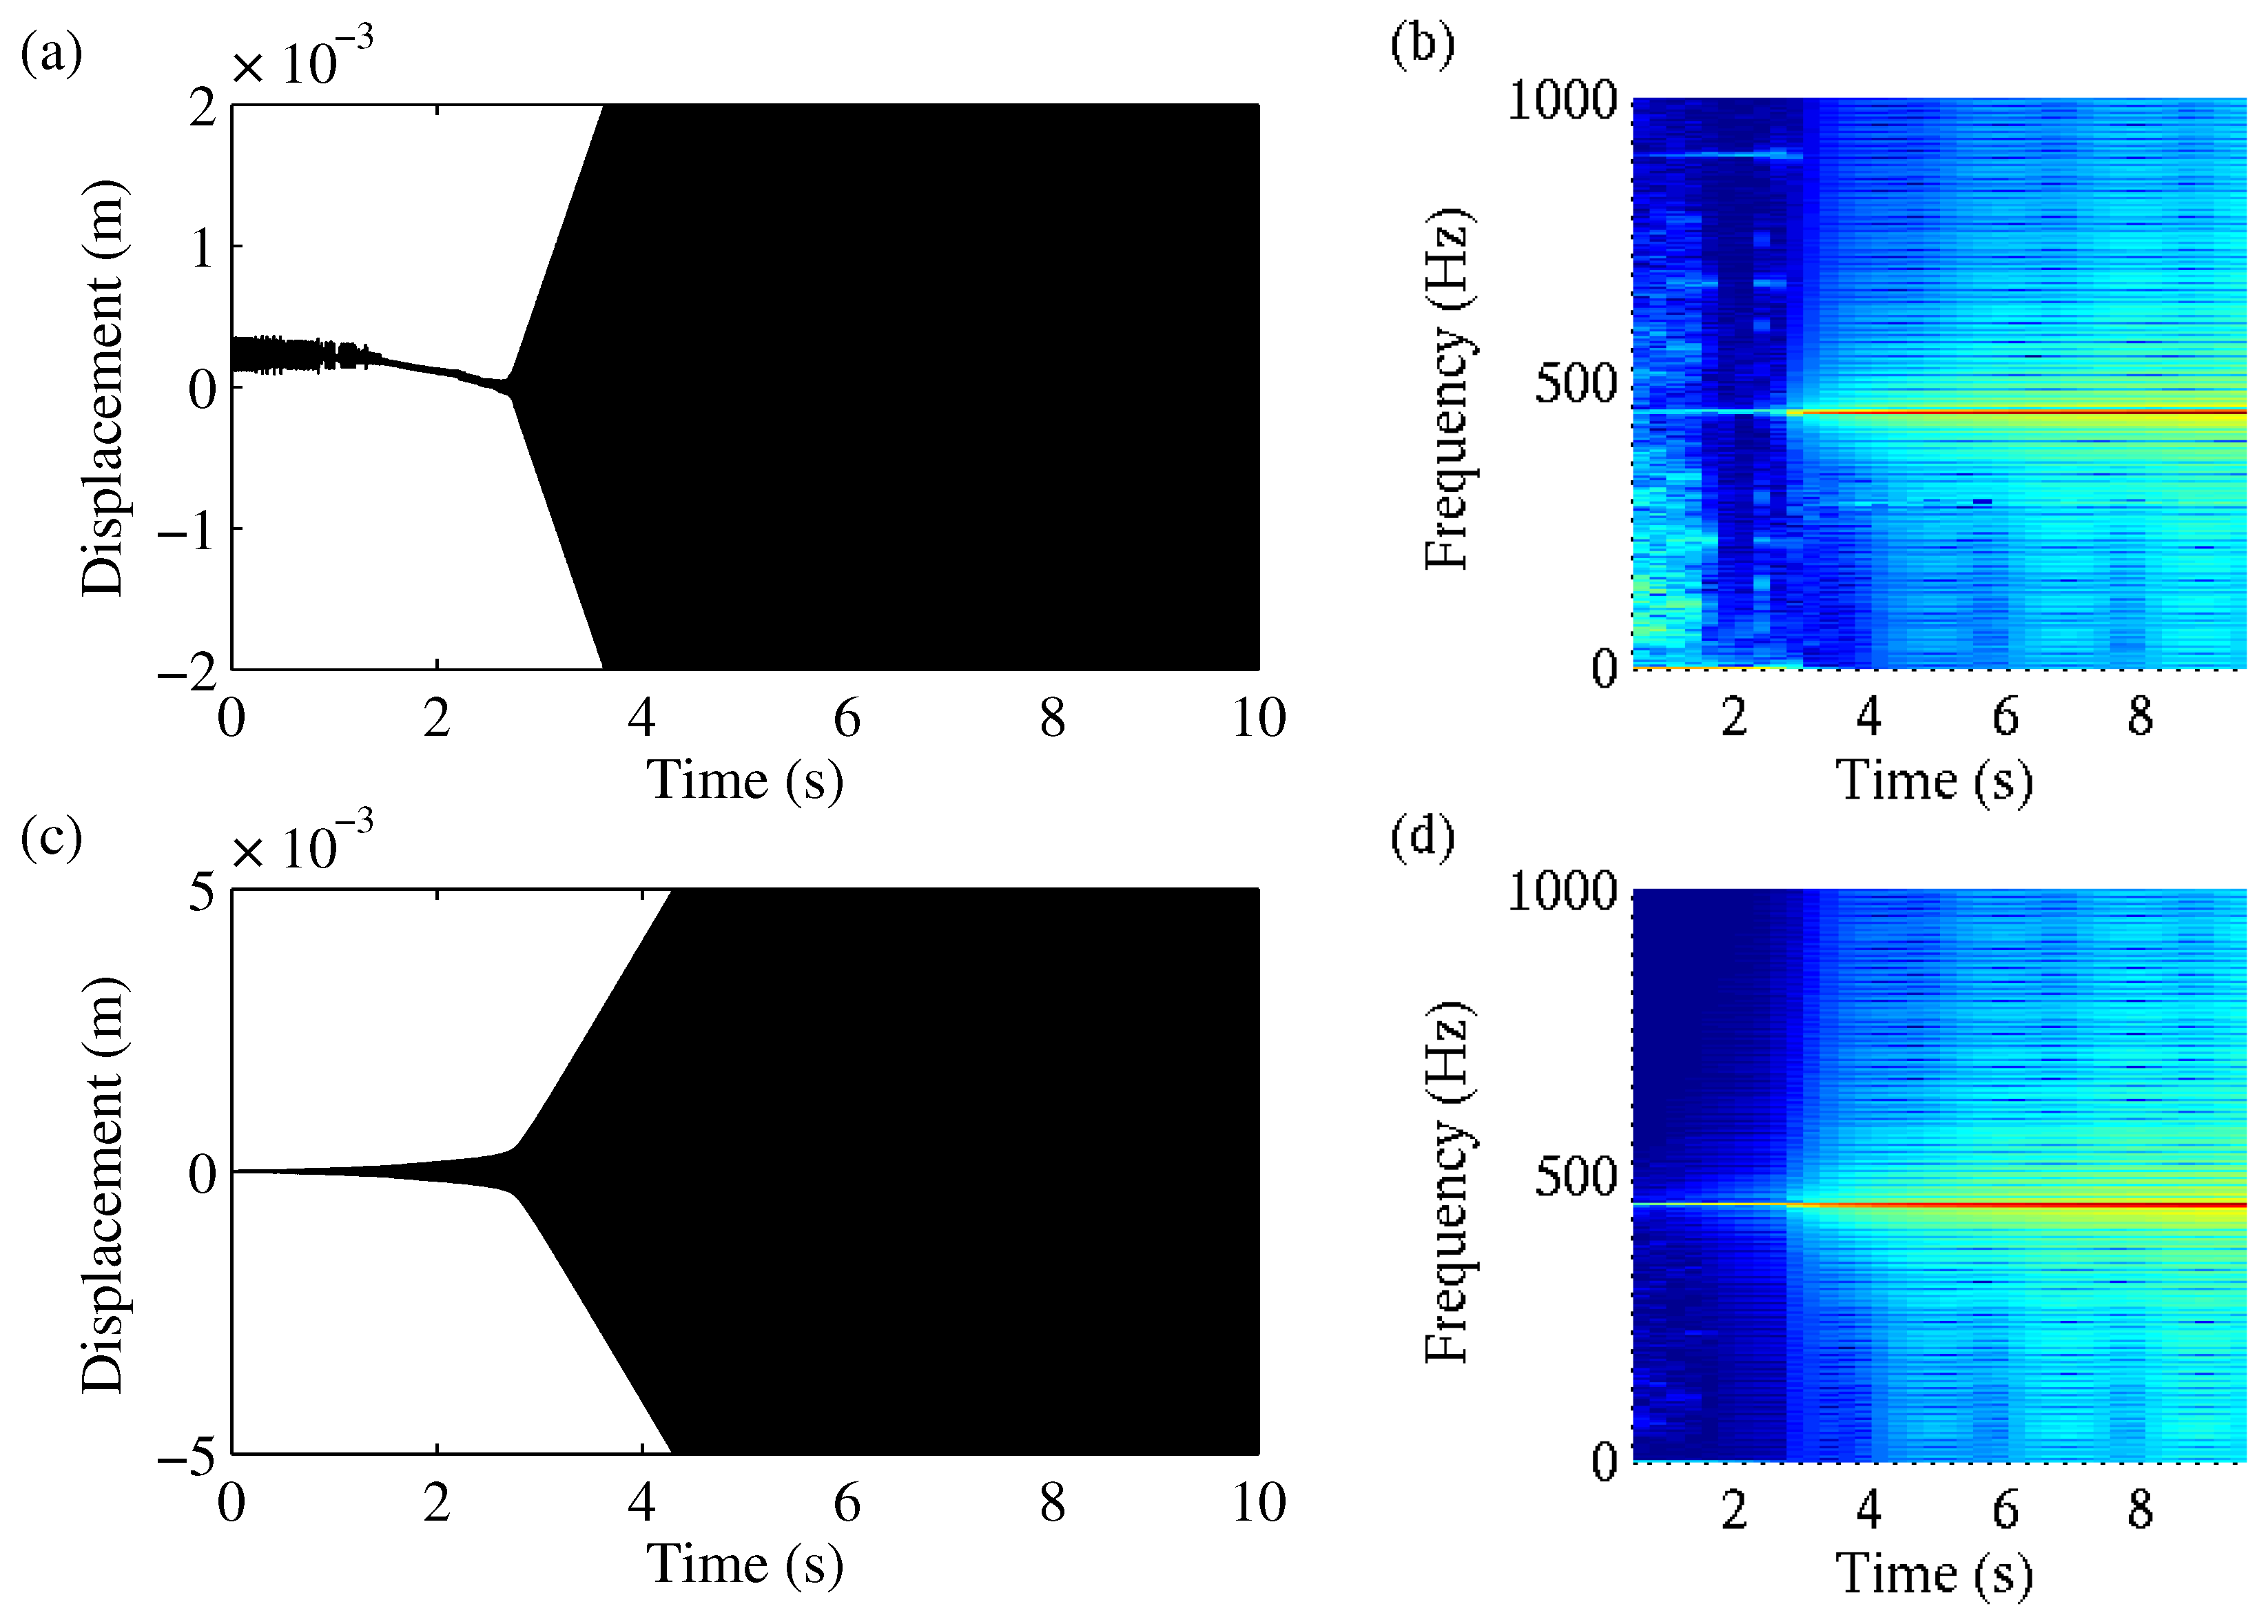
As the simulated results seemed to be in good agreement with the experimental observations, we performed further simulations with parameter variations comparable to those of the experimental investigations. To highlight the differences and the impact on the system behaviour, we changed the parameters considerably. In the demonstrated cases, each parameter was increased and decreased by a factor of two.
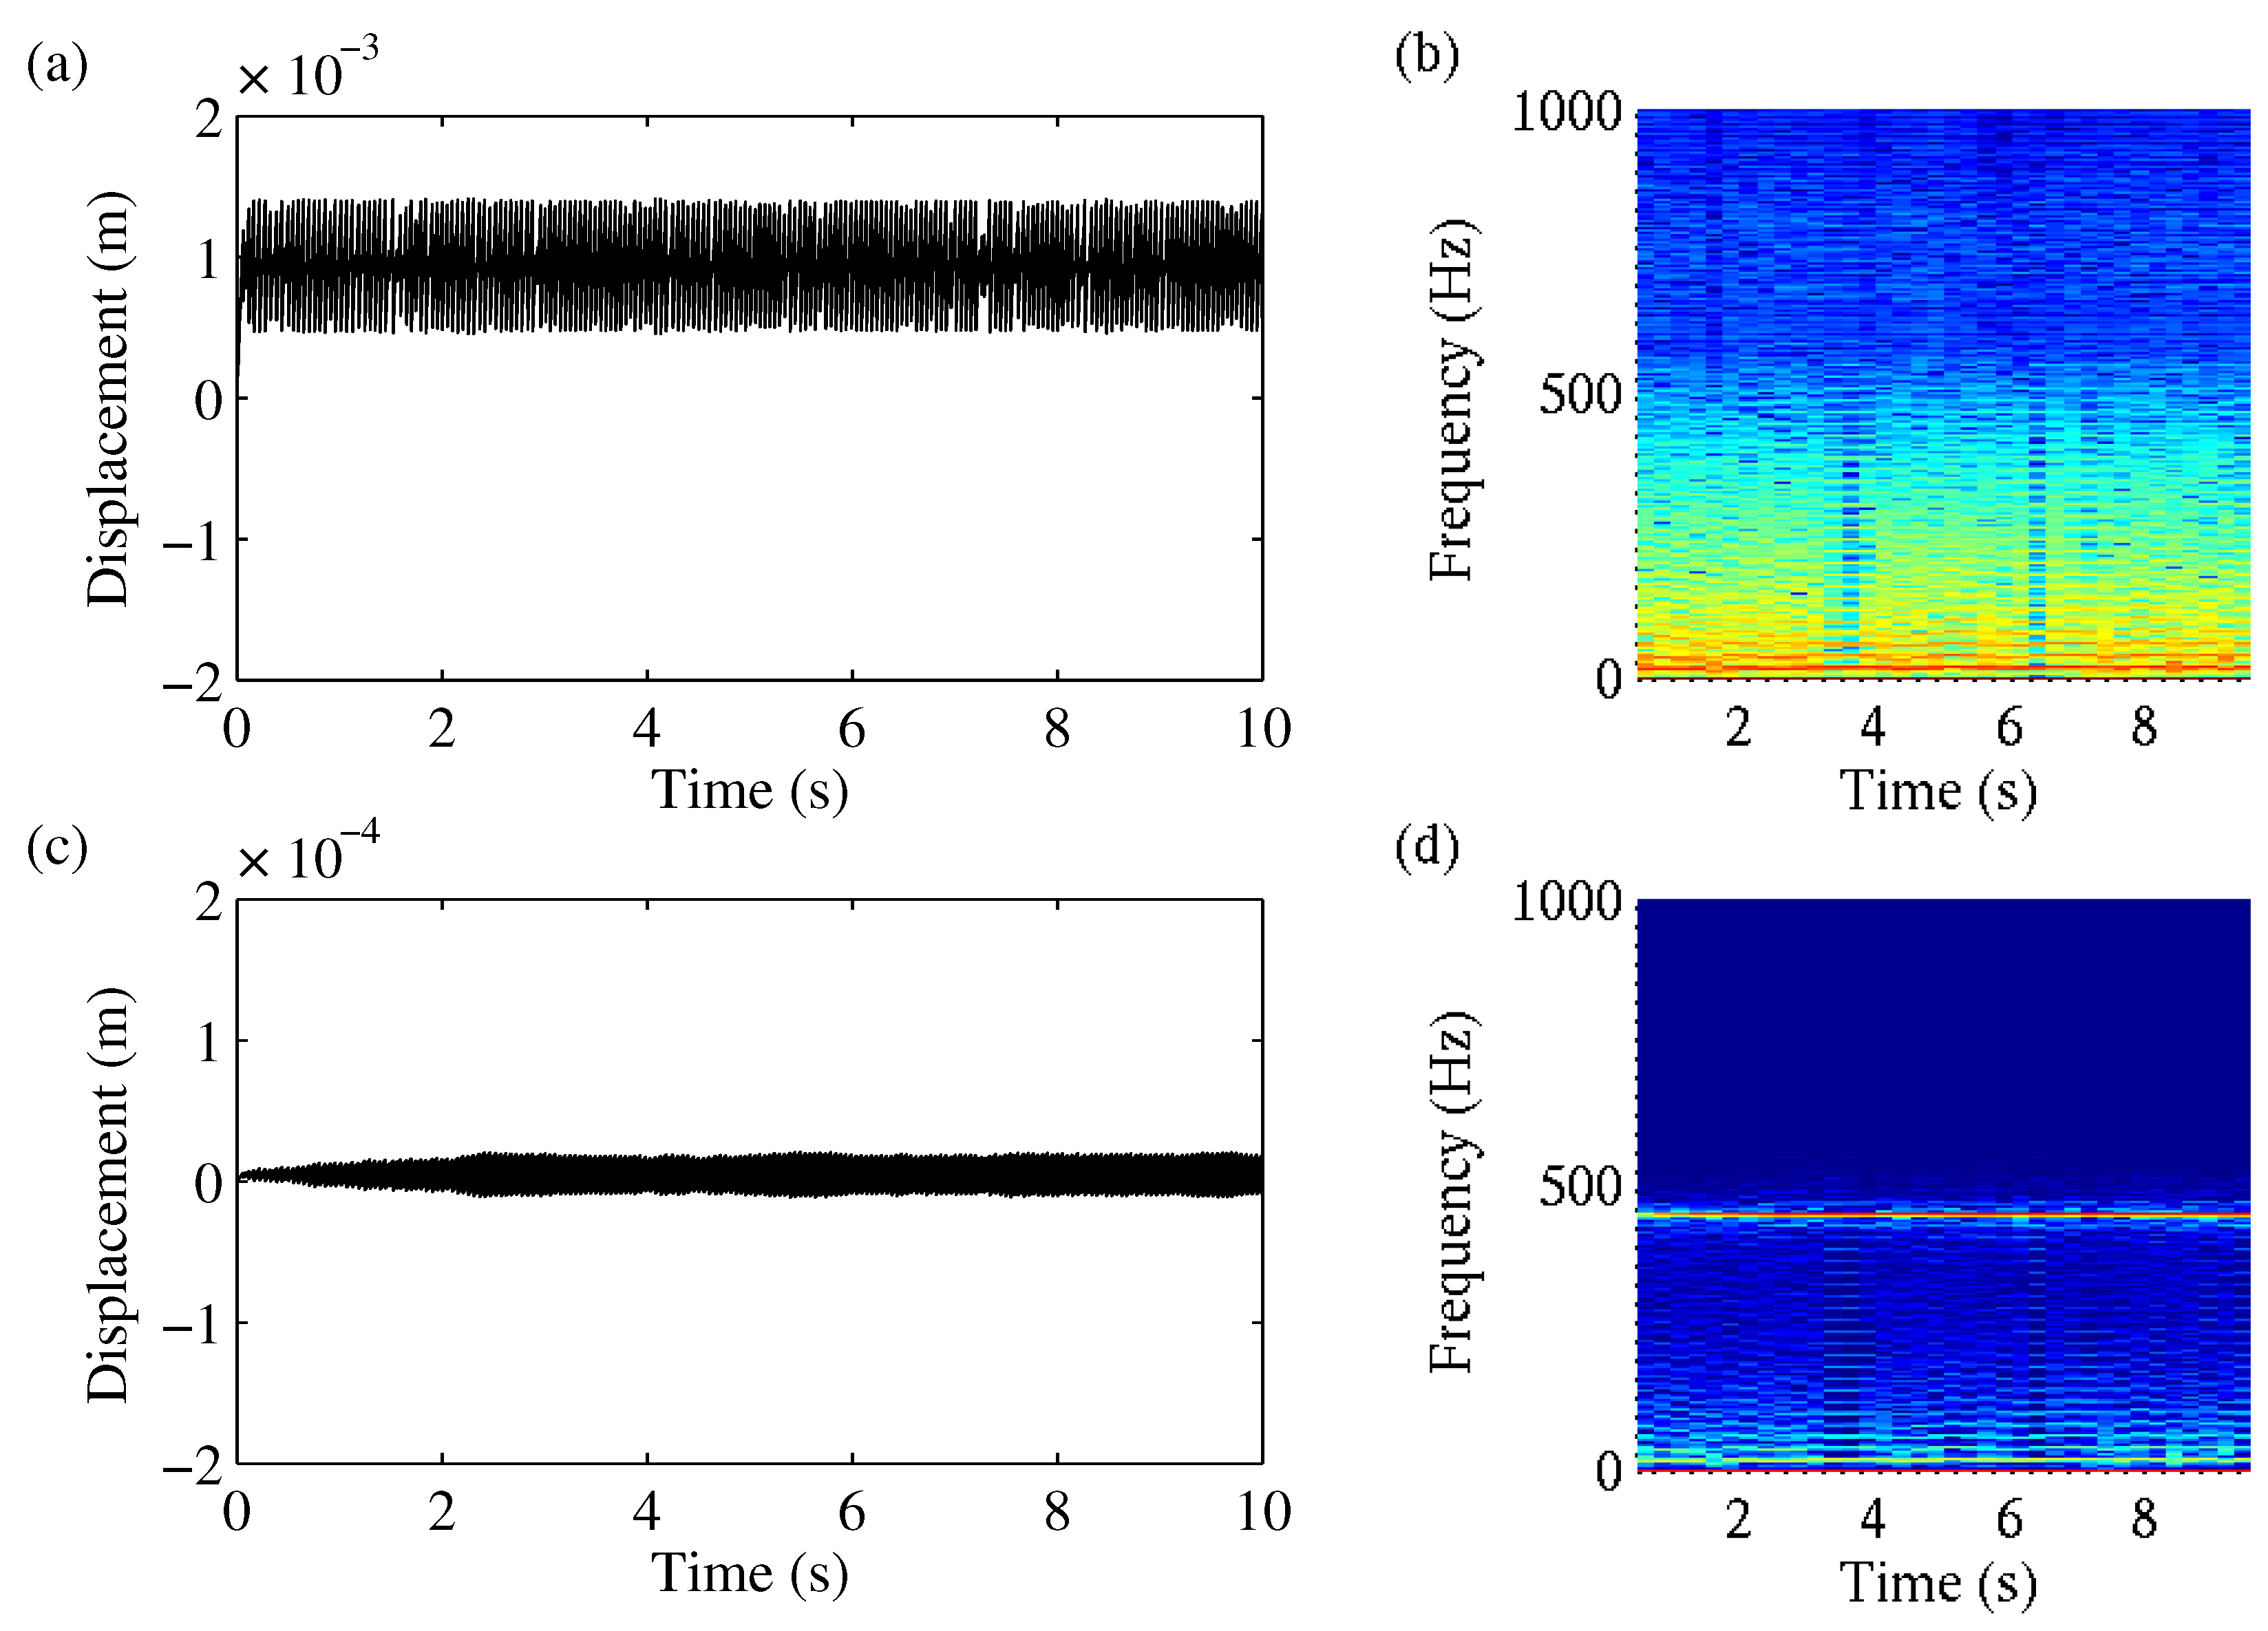
As expected, by doubling the normal force, the stick–slip amplitude clearly increased (see
Figure 8). In
Figure 9, we can observe that a small change in the initial condition did not lead to a harmonic oscillation. The system still performed a stick–slip movement and therefore showed a broadband spectrum. In contrast to the calculation with a normal force of
, the axle amplitudes showed a steady decay.
As we can see in
Figure 10, decreasing the normal force to
led to the opposite effect. Even starting at
and
led to a harmonic oscillation after
. When calculating with a small initial perturbation of the axle mass
, this led to a faster rise in the displacement amplitudes compared with the calculation with
(see
Figure 11).
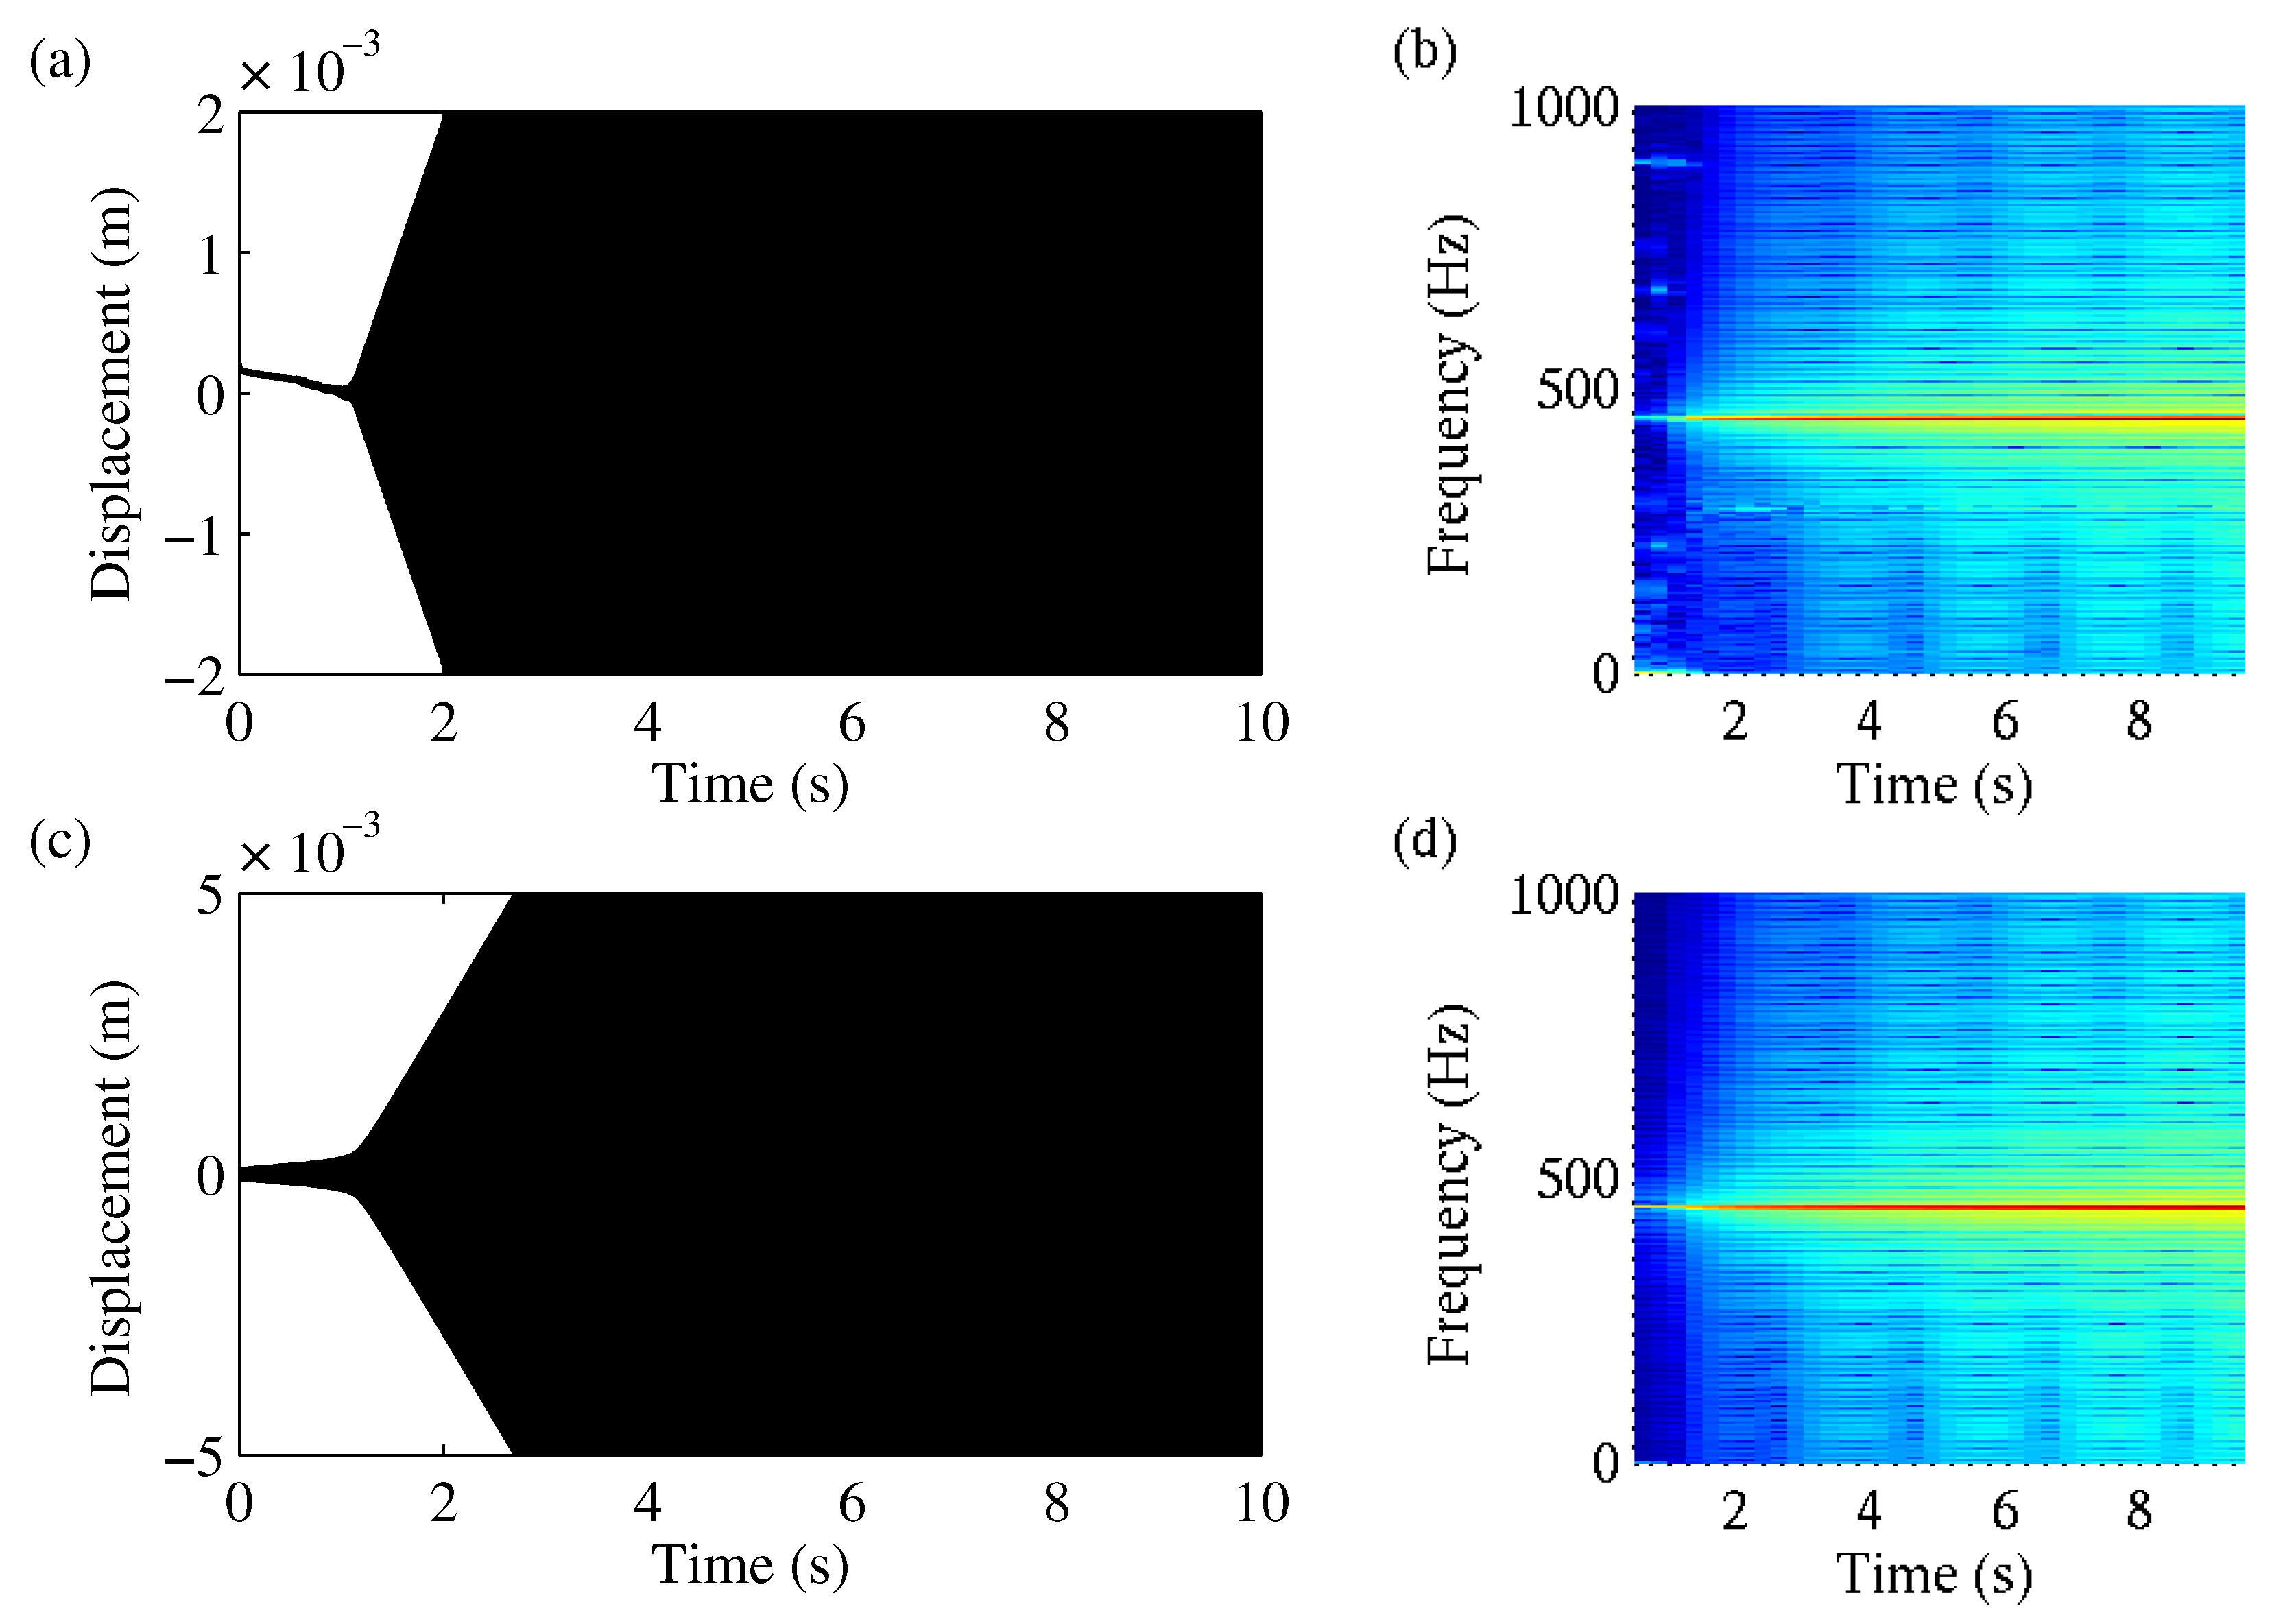
Next, the calculation results for an increase and decrease in the stiffness
that coupled the first pad mass to the axle mass are compared. As we can see in
Figure 12 and
Figure 13, increasing
by a factor two led to a fast rise in the pad and axle mass displacements under both initial conditions. With a small perturbation of the axle mass, this rise took place even faster. Here, the spectrograms again showed a harmonic oscillation at 450 Hz in both cases.
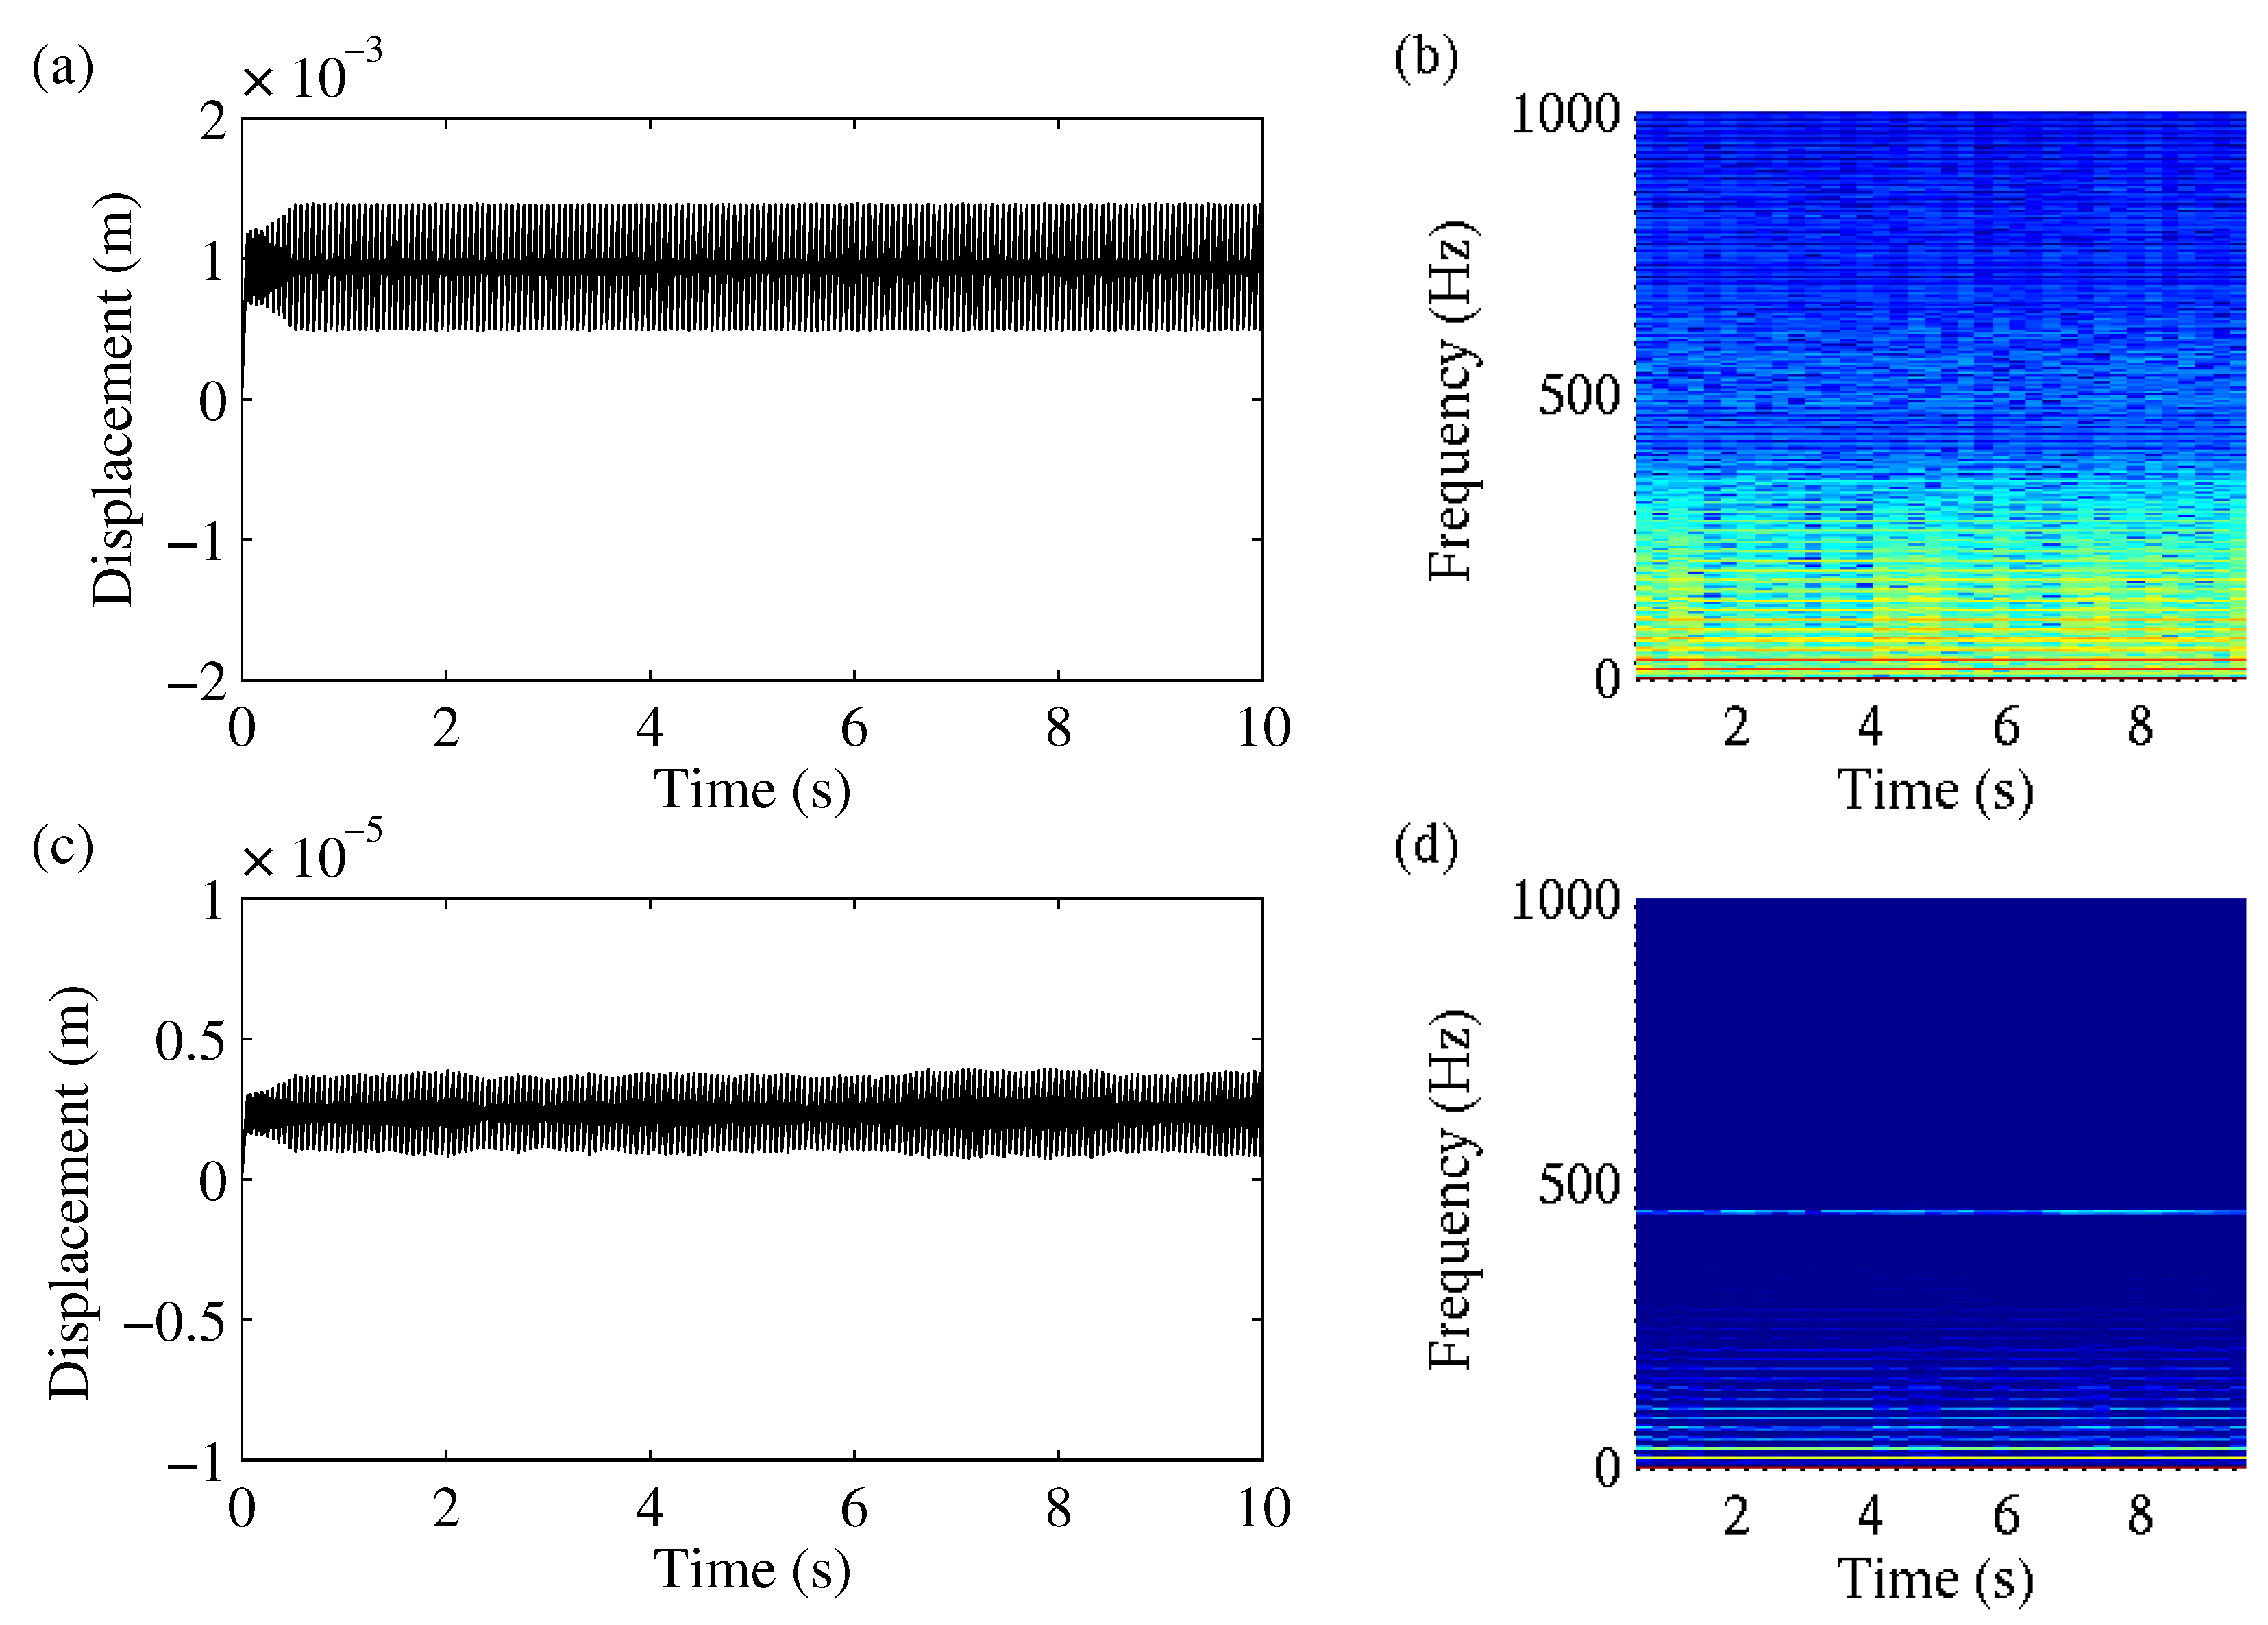
After decreasing
to
, the system became more liable to broadband behaviour under both initial conditions (see
Figure 14 and
Figure 15). The small perturbation of the axle mass did not lead to a characteristic change in the system behaviour, and the axle mass did not show a rise in amplitude.
Changes in the axle stiffness did not lead to a qualitatively different system behaviour but strongly influenced the frequency of the harmonic oscillation and therefore seemed to have the same influence as the wheel in the real system.
4. Discussion
The investigated model shows the dependency of the solution in the initial condition. Small perturbations of the axle mass led to qualitatively different system behaviour. With this model, we achieved a good description of the real system’s bifurcation behaviour. Depending on the initial condition, the system switches between two coexisting states. If the initial perturbation of the axle mass was zero, then stick–slip dominated the system behaviour, and we observed a broadband characteristic, which is typical for creep groan.
A small perturbation of the axle mass, which can be achieved in a real system by pushing against the upper control arm, led to a totally different behaviour. The unstable eigenvalue of the axle mass was excited and dominated the oscillation of the system. In the spectrogram, we observed a harmonic oscillation which is associated with honk noise. At first, the oscillation was supported by the change between stick and slip in the contact area. When the displacement amplitudes exceeded a certain value, the pad masses were constantly sliding, and the system was in resonance. An unlimited rise in the amplitudes could not be observed in the real system. This can be explained by the damping and limit stops of the real system, which are neglected in the minimal model.
The simulations show that during creep groan, the amplitudes of the axle movement were significantly smaller than the displacement amplitudes of the pad. In the experiments, however, we observed exactly the opposite. This discrepancy between the model and the real system can be attributed to the strong simplifications in the model. The real system consisted of many more parts and therefore had more elasticities. Thus, the axle or parts of the axle could resonate during creep groan and show larger amplitudes.
An increase in the normal force led to a larger difference between the static and dynamic friction force and therefore promoted stick–slip, leading to creep groan. As the system was dominated by the stick–slip vibration, it tended to exhibit less of a harmonic oscillation and therefore honk noise. To achieve a harmonic oscillation, significantly bigger initial perturbations are necessary. This finding is in compliance with the experimental observations.
By doubling the stiffness between the pad and axle
, we obtained the eigenvalues listed in
Table 4. In this case, we saw a strong tendency for the system to exhibit a harmonic oscillation at 448 Hz, regardless of the initial condition. In both cases, the amplitudes showed fast growth, and the unstable natural oscillation of the axle was excited. In our experiments, we also observed that a stiffer axle, achieved with stiffer rubber bearings at the upper control arm, led to a higher liability to honk.
With a decreasing
, the eigenvalue of the axle mass remained unstable. The corresponding eigenvalues can be found in
Table 5. In this case, larger perturbations were necessary to achieve a harmonic oscillation with a rise in amplitudes, and therefore, the system was more robust against honk noise.
The exemplary variations in the coupling stiffness emphasise the effects of the system’s nonlinearities on its qualitative behaviour. We can see that in both cases, the stability of the system remained the same, but the sensibility to small perturbations clearly differed. The stiffer system tended to oscillate harmonically with rising amplitudes, whereas with a reduction in stiffness, the system was more liable to broadband behaviour. We can see that on the one hand, investigation of the linearised system can provide basic information, such as that regarding the honk frequency. On the other hand, it is becoming clear that only by considering the nonlinear behaviour can we gain knowledge on the system’s liability to create honk noise.
Due to the high complexity of the real system investigated in the experiments, the applicability of the minimal model is limited. The model cannot replicate a real system in a quantitative manner. Thus, the presented method is not suitable for comparing different brake designs or rating concrete countermeasures in a quantitative way. The model neglects damping influences and the complex geometries of the components as well as their interaction. Both the mass-on-belt representation and the reduction in the axle components are significant simplifications that make it impossible to draw conclusions about individual axle models. In fact, the model provides deeper insight in the underlying mechanisms and offers findings on the influencing parameters and the general tendencies of how they affect the system.
By means of this minimal model, we can explain the onset of honk noise. The honk frequency is an instability in a system determined by the stiffness and in a real system mainly by the torsional stiffness of the wheel. Yet, whether the system exhibits noise at this frequency depends on many factors: the initial conditions, the operating state which is, for example, the brake pressure and the driving velocity, the stiffness of the adjacent components, as well as the excitation in the contact area. Additionally, the behaviour of the contact area and therefore the excitation is directly influenced by environmental conditions like the temperature, humidity, and load history. The influence of these factors on the brake system is hard to quantify and therefore not considered in the minimal model. The only way to evaluate such influences with the present model is to compare the measurements of the delta mu value between unconditioned and conditioned friction partners.
5. Conclusions
During our experimental investigations, we figured out that the change between creep groan and honk noise can be explained by the bifurcation behaviour of the nonlinear system. We successfully developed a minimal model to simulate and explain the observed phenomena. The system’s behaviour is not only dependent on its specific properties but is highly influenced by the system and operational conditions and its initial state. Extremely small perturbations can lead to a sudden change in the qualitative system behaviour. Thus, under the same external conditions, the system can switch between broadband characteristics dominated by stick–slip and harmonic oscillation. Those two states relate to creep groan and honk noise in a real system.
With this model, we can obtain a deeper understanding of the system’s sensitivity to parameter variations. These findings are an important step towards more realistic models for transient simulations. Thus far, unknown impacts on the liability to honk can be estimated. By increasing the number of pad masses, for example, it is possible to make a statement on the impact of the pad’s normal force distribution on the onset of honk noise. In addition, we learned that the excitation mechanism is just as important as the system’s specific properties and therefore an important aspect for a virtual evaluation of the system’s robustness against honk noise. This fact might explain why CEA, which neglects nonlinearities in the excitation, is not suitable to predict the liability of honk noise.
The following factors affecting the behaviour of a brake system with regard to honk noise can be demonstrated with the presented model:
A high favours creep groan but reduces the reproducibility of honk noise.
Creep groan is also favoured by a higher normal force, but the reproducibility of honk noise is reduced.
The reproducibility of honk noise is dependent to a great extent on the stiffness of the neighbouring axle parts.
Furthermore, the described minimal model offers many approaches for the development and improvement of new FEM or MBD simulation methods.
Many findings can thus be transferred to the development of a more complex model. The first important finding is that the friction behaviour must be modelled in the time domain, and the system must not be linearised in order to be able to map the bifurcation behaviour of the system during operation. Additionally, the friction surface must be modelled in such a way that different areas can exhibit different friction conditions (stick or slip), and the elasticity of the brake pad must be taken into account. The adjacent axle components must be represented with their stiffness values, as they significantly influence the honk noise behaviour of the system. In addition, damping effects must be taken into account. Since the highly nonlinear system reacts rather sensitively to small changes in the initial conditions and external influencing factors, broad parameter variations must be carried out in order to comprehensively evaluate a system.
Author Contributions
Conceptualization, F.G., D.W., M.F. and D.A.; methodology, D.A. and D.W.; software, D.A.; validation, D.A.; formal analysis, D.A.; investigation, D.A.; resources, D.A. and D.W.; data curation, D.A.; writing—original draft preparation, D.A.; writing—review and editing, M.F. and D.W.; visualization, D.A.; supervision, F.G.; project administration, D.A. and D.W.; funding acquisition, D.W. All authors have read and agreed to the published version of the manuscript.
Funding
This research received no external funding.
Institutional Review Board Statement
Not applicable.
Data Availability Statement
The datasets presented in this article are not readily available because the data is part of an ongoing study and subject to operational confidentiality. Requests to access the datasets should be directed to the authors.
Conflicts of Interest
Author Deborah Audretsch and Daniel Wallner were employed by the company Dr. Ing. h.c. F. Porsche AG. The remaining authors declare that the research was conducted in the absence of any commercial or financial relationships that could be construed as a potential conflict of interest.
References
- AbuBakar, A.R.; Ouyang, H. A prediction methodology of disk brake squeal using complex eigenvalue analysis. Int. J. Veh. Des. 2008, 46, 416. [Google Scholar] [CrossRef]
- Ouyang, H.; Nack, W.; Yuan, Y.; Chen, F. Numerical analysis of automotive disc brake squeal: A review. Int. J. Veh. Noise Vib. 2005, 1, 207–230. [Google Scholar] [CrossRef]
- Huemer-Kals, S.; Pürscher, M.; Fischer, P. Application Limits of the Complex Eigenvalue Analysis for Low-Frequency Vibrations of Disk Brake Systems. SAE Technical Paper Series 2017-01-2494 2017. Available online: https://saemobilus.sae.org/papers/application-limits-complex-eigenvalue-analysis-low-frequency-vibrations-disk-brake-systems-2017-01-2494 (accessed on 14 July 2025).
- Cantoni, C.; Cesarini, R.; Mastinu, G.; Rocca, G.; Sicigliano, R. Brake comfort—A review. Veh. Syst. Dyn. 2009, 47, 901–947. [Google Scholar] [CrossRef]
- Papinniemi, A.; Lai, J.; Zhao, J.; Loader, L. Brake squeal: A literature review. Appl. Acoust. 2002, 63, 391–400. [Google Scholar] [CrossRef]
- Neis, P.; Ferreira, N.; Poletto, J.; Matozo, L.; Masotti, D. Quantification of brake creep groan in vehicle tests and its relation with stick-slip obtained in laboratory tests. J. Sound Vib. 2016, 369, 63–76. [Google Scholar] [CrossRef]
- Brecht, J.; Schiffner, K. Influence of Friction Law on Brake Creep-Groan. SAE Trans. 2001, 110, 2440–2450. [Google Scholar]
- Wang, A.; Zhang, L.; Jaber, N.; Rieker, J. On Brake Moan Mechanism from the Modeling Perspective. SAE Trans. 2003, 112, 810–816. [Google Scholar]
- Kim, J.T.; Park, K.H. Brake moan simulation using Complex Eigenvalue Analysis. In Proceedings of the Abaqus Users’ Conference, Cambridge, MA, USA, 23–25 May 2006. [Google Scholar]
- Bauer, J.; Koerner, M.; Pfaff, A. Moan Noise—The Phenomenon And Solution Approaches. In Proceedings of the Euro Brake, Dresden, Germany, 2–4 May 2017. [Google Scholar]
- Gugino, A.; Janevic, J.; Fecske, L. Brake Moan Simulation using Flexible Methods in Multibody Dynamics. In Proceedings of the 18th Annual Brake Colloquium and Engineering Display, San Diego, CA, USA, 1–4 October 2000. [Google Scholar]
- Kalmár-Nagy, T.; Balachandran, B. Forced Harmonic Vibration of a Duffing Oscillator with Linear Viscous Damping. In The Duffing Equation; John Wiley & Sons, Ltd.: Hoboken, NJ, USA, 2011; pp. 139–174. [Google Scholar]
- Brennan, M.; Kovacic, I.; Carrella, A.; Waters, T. On the jump-up and jump-down frequencies of the Duffing oscillator. J. Sound Vib. 2008, 318, 1250–1261. [Google Scholar] [CrossRef]
- Lee, L.; Gesch, E. Discussions on Squeal Triggering Mechanisms—A Look beyond Structural Stability. In Proceedings of the SAE 2009 Brake Colloquium and Exhibition, Tampa, FL, USA, 11–14 October 2009. [Google Scholar]
- Popp, K.; Stelter, P. Stick-Slip Vibrations and Chaos. Philos. Trans. R. Soc. A Math. Phys. Eng. Sci. 1990, 332, 89–105. [Google Scholar]
- Hetzler, H.; Schwarzer, D.; Seemann, W. Steady-state stability and bifurcations of friction oscillators due to velocity-dependent friction characteristics. Proc. Inst. Mech. Eng. Part K J. Multi-Body Dyn. 2007, 221, 401–412. [Google Scholar] [CrossRef]
- Ostermeyer, G. Dynamic Friction Laws and Their Impact on Friction Induced Vibrations. In Proceedings of the SAE 2010 Annual Brake Colloquium and Engineering Display, Phoenix, AZ, USA, 10–13 October 2010. [Google Scholar]
- Ostermeyer, G.P. On Tangential Friction Induced Vibrations in Brake Systems. SAE Int. J. Passeng. Cars—Mech. Syst. 2008, 1, 1251–1257. [Google Scholar] [CrossRef]
Figure 1.
Investigated minimal model.
Figure 1.
Investigated minimal model.
Figure 2.
Measured pad acceleration during sequences of quasi-periodic, low-frequency creep groan and periodic higher-frequency honk noise. Amplitude spectrum over time.
Figure 2.
Measured pad acceleration during sequences of quasi-periodic, low-frequency creep groan and periodic higher-frequency honk noise. Amplitude spectrum over time.
Figure 3.
Change from creep groan to honk noise in the time domain after pushing against the upper control arm at approximately 22 s: (a) pad acceleration and (b) acceleration at the upper control arm.
Figure 3.
Change from creep groan to honk noise in the time domain after pushing against the upper control arm at approximately 22 s: (a) pad acceleration and (b) acceleration at the upper control arm.
Figure 4.
Simulated time signals for initial conditions : (a) friction force acting between the pad mass and belt, (b) displacement of the first pad mass, and (c) displacement of the axle mass.
Figure 4.
Simulated time signals for initial conditions : (a) friction force acting between the pad mass and belt, (b) displacement of the first pad mass, and (c) displacement of the axle mass.
Figure 5.
Spectrograms of the system displacements for the initial conditions : (a) pad mass and (b) axle mass.
Figure 5.
Spectrograms of the system displacements for the initial conditions : (a) pad mass and (b) axle mass.
Figure 6.
Simulated time signals for the initial conditions and : (a) friction force acting between the pad mass and belt, (b) displacement of the first pad mass, and (c) displacement of the axle mass.
Figure 6.
Simulated time signals for the initial conditions and : (a) friction force acting between the pad mass and belt, (b) displacement of the first pad mass, and (c) displacement of the axle mass.
Figure 7.
Spectrograms of the system displacements for the initial conditions and : (a) pad mass and (b) axle mass.
Figure 7.
Spectrograms of the system displacements for the initial conditions and : (a) pad mass and (b) axle mass.
Figure 8.
Results with at the initial conditions : (a) time signal and (b) spectrogram of the first pad mass displacement and (c) time signal and (d) spectrogram of the axle mass displacement .
Figure 8.
Results with at the initial conditions : (a) time signal and (b) spectrogram of the first pad mass displacement and (c) time signal and (d) spectrogram of the axle mass displacement .
Figure 9.
Results with at the initial conditions and : (a) time signal and (b) spectrogram of the first pad mass displacement and (c) time signal and (d) spectrogram of the axle mass displacement .
Figure 9.
Results with at the initial conditions and : (a) time signal and (b) spectrogram of the first pad mass displacement and (c) time signal and (d) spectrogram of the axle mass displacement .
Figure 10.
Results with at the initial conditions : (a) time signal and (b) spectrogram of the first pad mass displacement and (c) time signal and (d) spectrogram of the axle mass displacement .
Figure 10.
Results with at the initial conditions : (a) time signal and (b) spectrogram of the first pad mass displacement and (c) time signal and (d) spectrogram of the axle mass displacement .
Figure 11.
Results with at the initial conditions and : (a) time signal and (b) spectrogram of the first pad mass displacement and (c) time signal and (d) spectrogram of the axle mass displacement .
Figure 11.
Results with at the initial conditions and : (a) time signal and (b) spectrogram of the first pad mass displacement and (c) time signal and (d) spectrogram of the axle mass displacement .
Figure 12.
Results with at the initial conditions : (a) time signal and (b) spectrogram of the first pad mass displacement and (c) time signal and (d) spectrogram of the axle mass displacement .
Figure 12.
Results with at the initial conditions : (a) time signal and (b) spectrogram of the first pad mass displacement and (c) time signal and (d) spectrogram of the axle mass displacement .
Figure 13.
Results with at the initial conditions and : (a) time signal and (b) spectrogram of the first pad mass displacement and (c) time signal and (d) spectrogram of the axle mass displacement .
Figure 13.
Results with at the initial conditions and : (a) time signal and (b) spectrogram of the first pad mass displacement and (c) time signal and (d) spectrogram of the axle mass displacement .
Figure 14.
Results with at the initial conditions : (a) time signal and (b) spectrogram of the first pad mass displacement and (c) time signal and (d) spectrogram of the axle mass displacement .
Figure 14.
Results with at the initial conditions : (a) time signal and (b) spectrogram of the first pad mass displacement and (c) time signal and (d) spectrogram of the axle mass displacement .
Figure 15.
Results with at the initial conditions and : (a) time signal and (b) spectrogram of the first pad mass displacement and (c) time signal and (d) spectrogram of the axle mass displacement .
Figure 15.
Results with at the initial conditions and : (a) time signal and (b) spectrogram of the first pad mass displacement and (c) time signal and (d) spectrogram of the axle mass displacement .
Table 1.
Parameters for the minimal model.
Table 1.
Parameters for the minimal model.
| Parameter | Value | Description |
|---|
| 0.5 kg | Masses representing brake pad |
| 43 kg | Mass representing axle |
| | Stiffness between and |
| | Stiffness between and |
| | Stiffness between and ground |
| | Normal force |
| 0.6 | Static friction coefficient |
| 0.4 | Dynamic friction coefficient |
| | Belt velocity |
Table 2.
Eigenvalues of the minimal model.
Table 2.
Eigenvalues of the minimal model.
| Eigenvalue | Eigenfrequency | Stability |
|---|
| | unstable |
| | stable |
| | unstable |
Table 3.
Experimental results for different brake pad materials.
Table 3.
Experimental results for different brake pad materials.
| | | Honk Noise Reproducibility | Creep Groan Intensity |
|---|
| Pad material 1 | 0.09 | + | + |
| Pad material 2 | 0.07 | + | + |
| Pad material 3 | 0.13 | 0 | ++ |
| Pad material 4 | 0.08 | − | − |
| Pad material 5 | 0.17 | 0 | ++ |
| Pad material 6 | 0.02 | − − | − − |
| Pad material 7 | 0.11 | + | 0 |
Table 4.
Eigenvalues of the minimal model with increased stiffness .
Table 4.
Eigenvalues of the minimal model with increased stiffness .
| Eigenvalue | Eigenfrequency | Stability |
|---|
| | unstable |
| | stable |
| | unstable |
Table 5.
Eigenvalues of the minimal model with decreased stiffness .
Table 5.
Eigenvalues of the minimal model with decreased stiffness .
| Eigenvalue | Eigenfrequency | Stability |
|---|
| | unstable |
| | stable |
| | unstable |
| Disclaimer/Publisher’s Note: The statements, opinions and data contained in all publications are solely those of the individual author(s) and contributor(s) and not of MDPI and/or the editor(s). MDPI and/or the editor(s) disclaim responsibility for any injury to people or property resulting from any ideas, methods, instructions or products referred to in the content. |
© 2025 by the authors. Licensee MDPI, Basel, Switzerland. This article is an open access article distributed under the terms and conditions of the Creative Commons Attribution (CC BY) license (https://creativecommons.org/licenses/by/4.0/).

