1. Introduction
Underwater archeological research is conducted in several stages after the comprehensive collection and analysis of historical data. These stages include regional preliminary surveys, potential area assessments, detailed investigations of key sites, and the excavation, restoration, and preservation of sites [
1]. In recent years, the application of geophysical survey techniques in underwater archeology has developed into a systematic framework, demonstrating significant technological advantages and innovative potential. Compared to traditional marine geophysical surveys, underwater archeology places greater emphasis on determining the orientation, preservation state, and burial conditions of underwater remains, thereby imposing higher demands on the interpretative accuracy and reliability of detection technologies.
Current underwater archeological survey technologies primarily encompass three major systems: acoustic, electromagnetic, and optical methods. These technologies enable the localization and characterization of archeological sites through the integration of multi-source data [
2,
3]. Acoustic techniques dominate the field. Imaging sonar systems, including multi-beam bathymetry, side-scan imaging, and three-dimensional imaging sonar, can provide high-resolution data on seabed morphology and the characteristics of underwater structures, revealing archeological remains such as shipwrecks that are mostly exposed or partially buried. However, they cannot detect fully buried objects. Sub-bottom profiling is an effective method for discovering buried objects on the seafloor and there are many successful cases [
4,
5,
6,
7,
8,
9,
10,
11,
12]. The case study results show that the emission signal of the seismic source, the design of the source receiver geometry and the signal processing may directly affect the application effect of the sub-bottom profiler in underwater archeology. However, the biggest problem with sub-bottom profiler is the inefficiency of detection. Electromagnetic methods, centered around magnetometers, can be used to detect iron artifacts by identifying magnetic anomalies but limited by its probing principle. Laser and optical imaging are of great significance for the advancement of underwater archeological research since they can facilitate high-precision modeling of archeological remains [
13,
14,
15]. Furthermore, the incorporation of intelligent detection platforms, artificial intelligence algorithms (e.g., YOLOv5), and the utilization of satellite measurement data have significantly expanded the scope and efficiency of underwater archeological investigations [
16,
17,
18,
19].
Conducting comprehensive geophysical surveys and assessments can reveal the structural characteristics and environmental changes in shipwreck sites, providing detailed base maps for divers and assisting researchers in exploring the formation processes of these sites. This, in turn, offers a scientific basis for the management and protection of marine archeological sites [
20,
21]. Additionally, the integration of geophysical techniques with other disciplines also represents an important direction for underwater archeological research, such as the combined use of sediment analysis and seismic exploration methods [
22,
23].
Despite significant advancements in geophysical survey technologies, challenges remain, including low identification rates for small-sized underwater artifacts, limited penetration capabilities in complex sedimentary environments (i.e., estuarine sandy bottom), and delays in real-time data processing for deep-sea sites. Future efforts should focus on further promoting multi-sensor integration, deploying autonomous platforms, optimizing machine learning algorithms, and establishing interdisciplinary collaboration mechanisms [
24,
25]. The key to methodological integration is approaching it from the perspective of underwater archeology.
Existing geophysical survey technologies face limitations in applicability due to the complexities of marine environments and the precision required for detecting small artifacts. While acoustic technologies dominate underwater archeology, prior studies have primarily focused on large shipwrecks or metallic artifacts [
2,
4]. Few address the detection limits of small (<30 cm) non-metallic relics in dynamic environments. This study bridges the gap through a series of offshore controlled model experiments. From the perspective of acoustic detection principles, both large shipwreck remains and the cargo aboard these vessels are considered anomalies relative to the naturally settled seabed sediments. These anomalies may present significant contours or characteristic features on acoustic profiles, but they can also be misinterpreted as general anomalous signals and overlooked by interpreters. Therefore, establishing an objective correlation through model deployment and field detection experiments is necessary. This study focuses on Xiamen Bay as the experimental site. Through model deployment experiments, we systematically evaluate the detection efficacy of multibeam bathymetry systems and side-scan sonar technologies for small underwater artifacts. The aim is to provide a basis for technical optimization in underwater archeological survey. By comparing the characteristics of different marine environments and geophysical detection parameters, we propose specific detection techniques for non-metallic artifacts, such as pottery.
Section 1 outlines the role of geophysical techniques in underwater archeology and identifies knowledge gaps in detecting small non-metallic artifacts.
Section 2 details the key acoustic principles of MBES, SSS, and SBP systems, and describes the controlled field experiment in Xiamen Bay, including model deployment and data acquisition protocols.
Section 3 presents empirical findings on the detection capabilities of MBES (terrain anomalies), SSS (acoustic shadows/intensity), and SBP (buried target limitations) for ceramic artifacts.
Section 4 analyzes operational constraints, environmental impacts (e.g., biofouling), and proposes the integrated workflow “MBES screening → SSS fine mapping → SBP validation”.
Section 5 summarizes applicability boundaries of traditional acoustics and recommends future integration with AI/optical technologies.
2. Materials and Methods
2.1. Principle of MBES, SSS and SBP
It is essential to follow a systematic workflow that progresses from general surveys to detailed examinations when conducting investigations of submarine targets. This paper focuses on the workflow and key considerations involved in detecting small submarine targets using integrated acoustic technologies, exemplified by three commonly used acoustic detection systems: multibeam bathymetry, side-scan imaging, and sub-bottom profiling sonar.
Multi-beam echosounder systems (MBESs) simultaneously emit dozens to hundreds of independent acoustic beams (arranged in a fan shape) toward the seafloor using an array of transducers, and receive the echoes with another array of transducers. The area illuminated by each beam on the seafloor is referred to as the “beam footprint,” which is usually elliptical in shape. The size of the beam footprint
depends on the beam’s opening angle (in radians) and the water depth (in meters):
The side-scan sonar (SSS) system emits a fan-shaped wide beam to the sides, with beam angles reaching several tens of degrees. The beamwidth is narrow (1–2°) along-track and wide (typically between 30 and 60°) across-track. The receiver records the intensity of backscattered signals from the seafloor, producing acoustic images. The along-track resolution is high and appears as a narrow strip. The across-track resolution decreases with increasing distance. Near-field resolution can reach the centimeter level, while far-field resolution decreases to several meters. Small targets are identified through the shadow zone, which is the area behind the target that lacks echo returns.
Sub-bottom profiler (SBP) usually emits low-frequency acoustic wave pulses (typically between 1 and 15 kHz) vertically or nearly vertically, creating a wide conical beam (with an opening angle generally ranging from 10° to 30°). The acoustic waves penetrate the seabed and are reflected at different acoustic impedance interfaces, revealing the stratigraphic structure. The beam footprint of the SBP appears circular or elliptical on the seabed, with its size increasing with water depth (similar to the formula used in MBESs). The vertical resolution is determined by the pulse length (optimally reaching 10 cm), while the horizontal resolution is constrained by the beam footprint.
MBES systems offer the advantage of high-precision three-dimensional localization of exposed small targets. However, as water depth increases, the beam footprint also enlarges, leading to a dispersion of the target’s reflected energy. An SSS can provide high-resolution imaging of the morphology of exposed small targets, but it lacks depth information and exhibits low resolution at greater distances. SBPs have the potential to detect buried targets and ascertain their depths; however, they suffer from low horizontal resolution, and current technologies face challenges in effectively identifying small targets. The spatial resolution of the three acoustic detection technologies is closely related to the beam footprint.
Theoretically, the lateral dimensions of a geological body or target must exceed the diameter of the Fresnel zone to be resolvable. In the field of seismic exploration, it is generally accepted that layers with a thickness less than
λ/4 may be inadequately imaged due to the interference effects associated with the Fresnel zone.
In fact, all three types of acoustic detection technologies are influenced by both the beam footprint and the Fresnel zone, although the nature and extent of these influences differ. Even though MBES reduces the geometric beam footprint through a narrow beam (typically between 0.5° and 2°), if the spacing between detection targets is smaller than the diameter of the Fresnel zone, their reflected signals can interfere with one another, preventing the system from distinguishing between adjacent targets. For isolated small targets, such as rocks or shipwreck debris, if their dimensions are smaller than the Fresnel zone, the echo energy may be “averaged out” by the surrounding seabed background, leading to a decreased signal-to-noise ratio and a lower probability of identification. These understandings are important prerequisites for obtaining high-quality raw data and data post processing.
2.2. Field Experiment
2.2.1. Experimental Sea Area
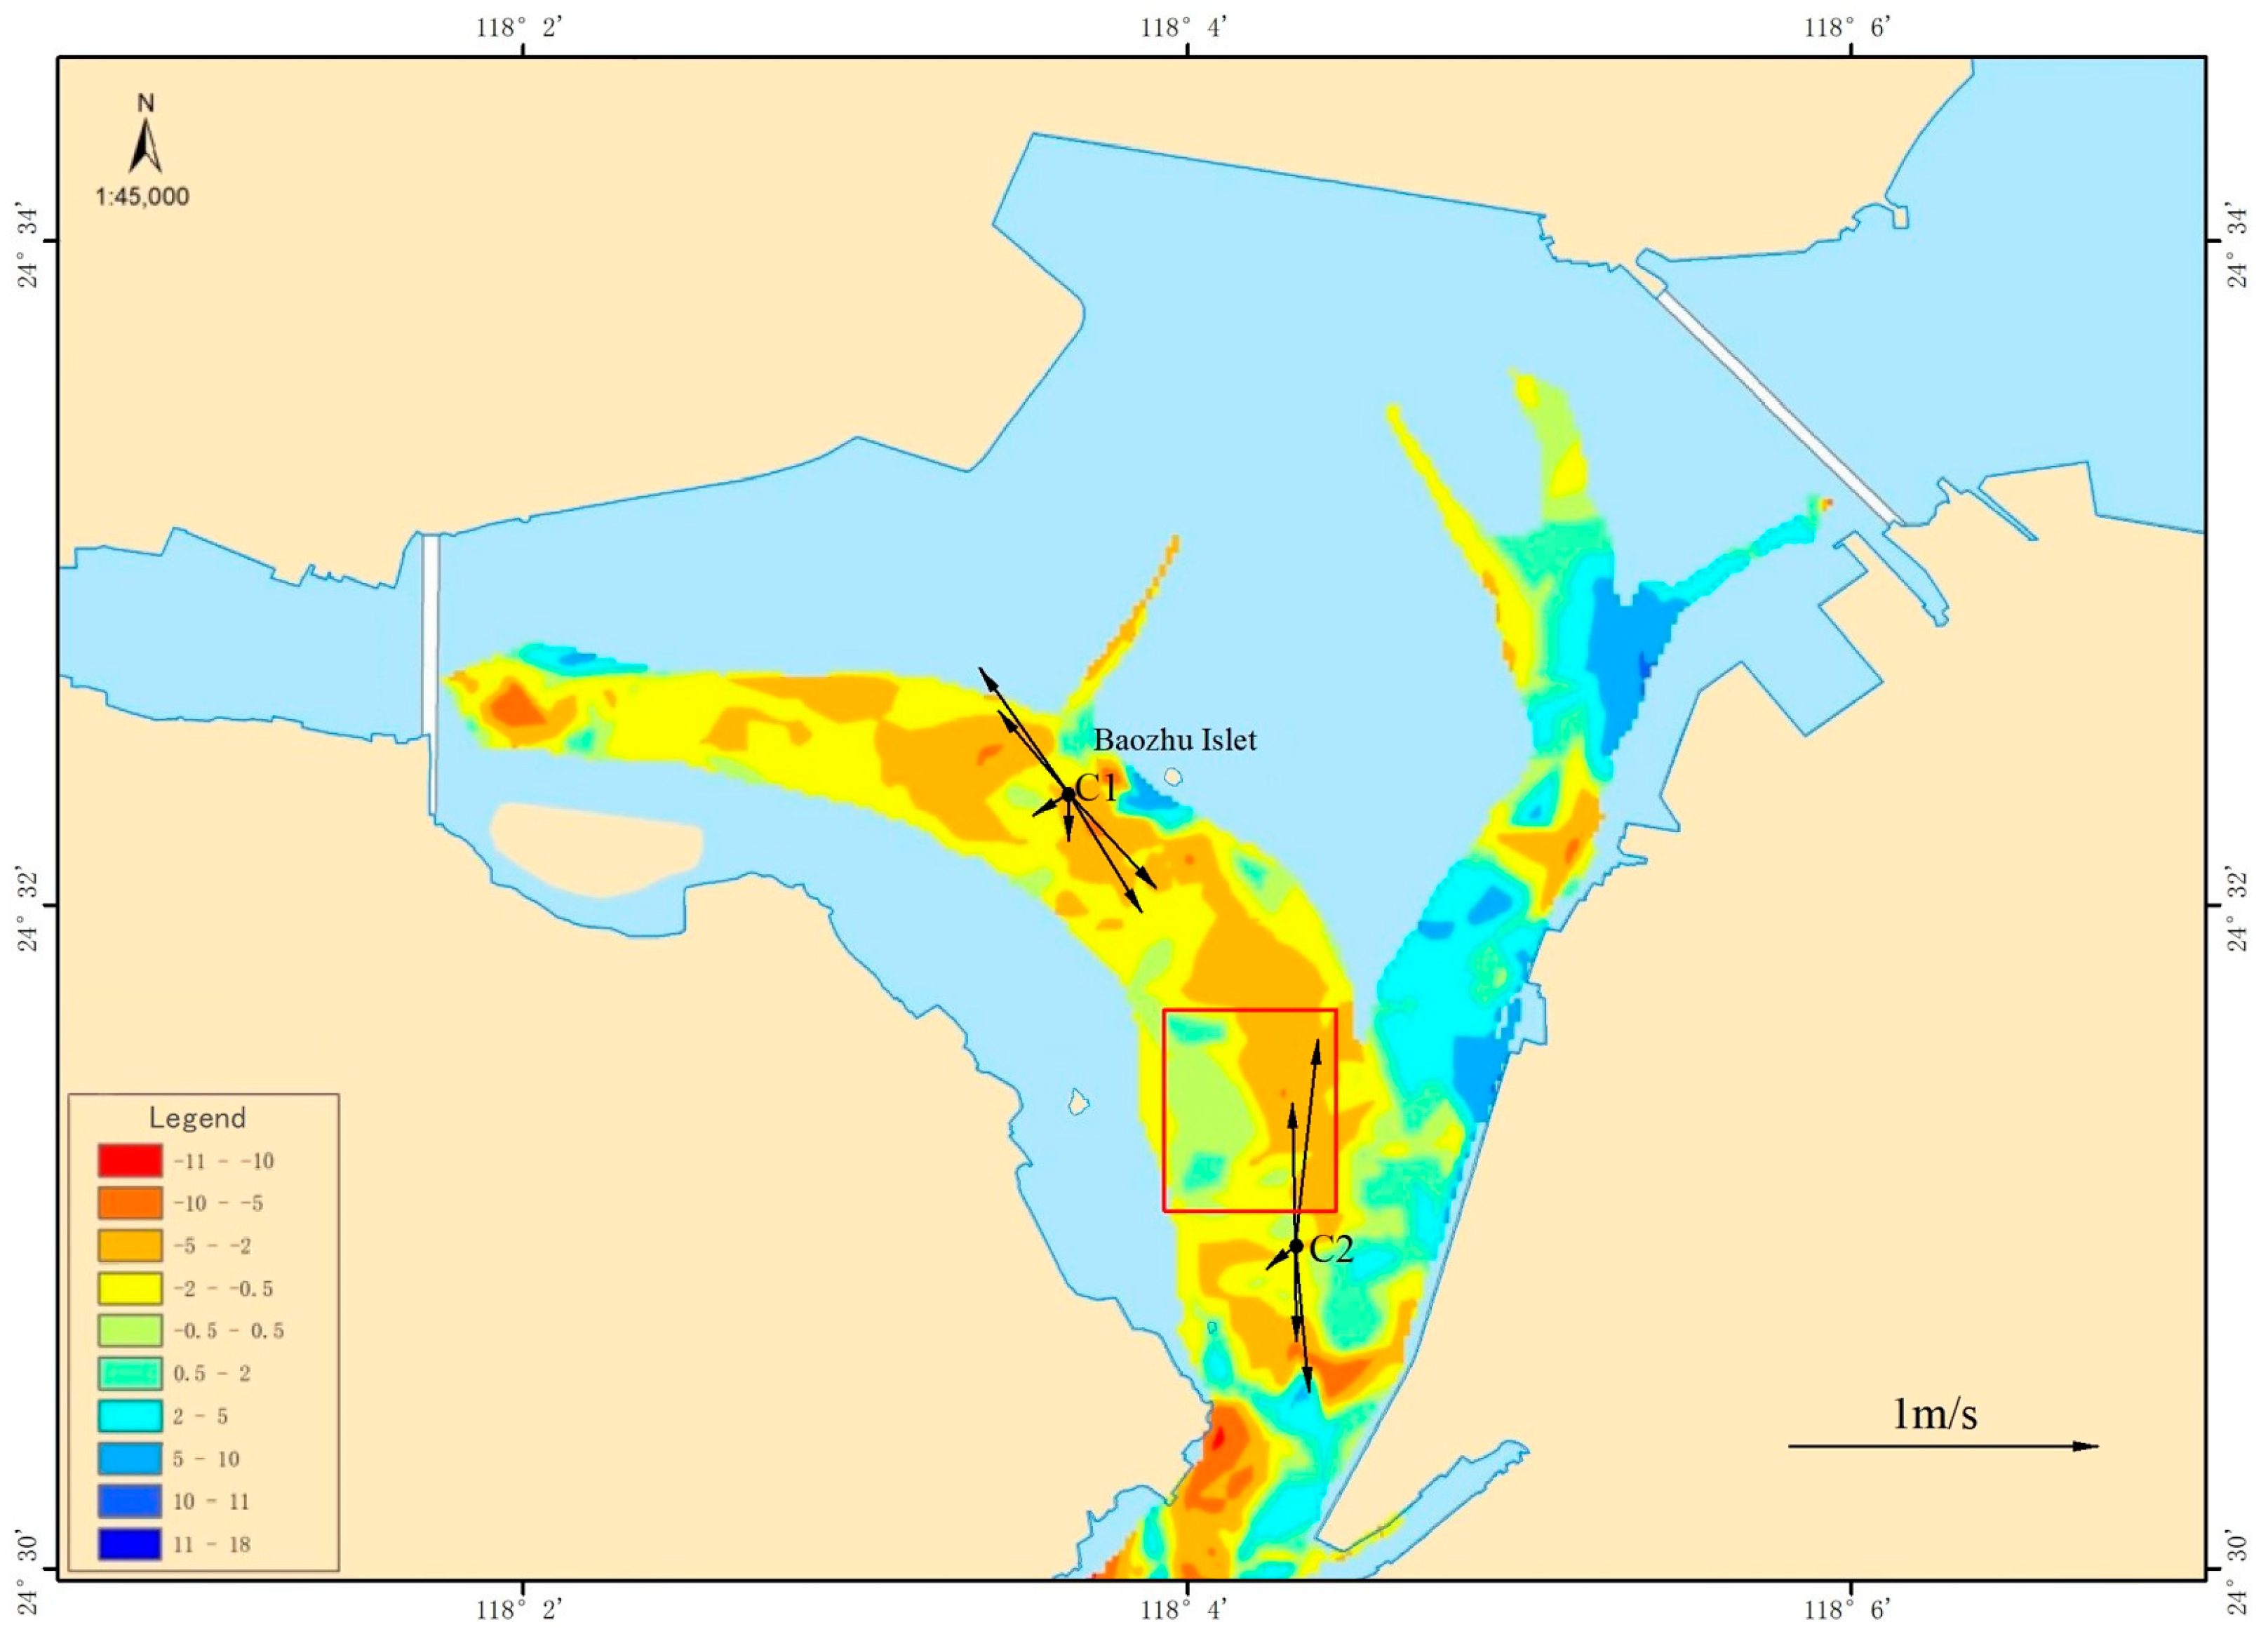
Underwater archeology is significantly restricted by three core categories of conditions: the submarine natural environment, technical adaptability, and external interference factors. The submarine natural environment is the most fundamental restricting factor. Baozhu Islet, located inside of Xiamen Bay, historically served as a crucial waterway for external communication for ancient Tong’an City. The research team selected the maritime area near Baozhu Islet as the experimental zone (as shown in
Figure 1). This experimental zone is situated approximately 2000 m south of Baozhu Islet. Within the experimental zone, there exists a group of reefs with a distribution radius of about 300 m, which includes several submerged rocks. The water depth in the experimental zone ranges from 5 to 10 m, with some rocks exposed during low tide. During high tide, tidal waves from the open sea propagate towards the ends of various bays through the channels in the eastern and western waters of Xiamen; conversely, during low tide, the water generally flows in the opposite direction of the incoming tide. The maximum measured flow velocities during rising and falling tides were 71 cm/s and 66 cm/s, respectively, exhibiting a pronounced reciprocating flow characteristic due to the confinement of the waterway. The distribution of surface sediment types is relatively simple, primarily consisting of clayey silt (with silt content ranging from 60% to 75%), and the seabed exhibits good stability.
2.2.2. Model Deployment
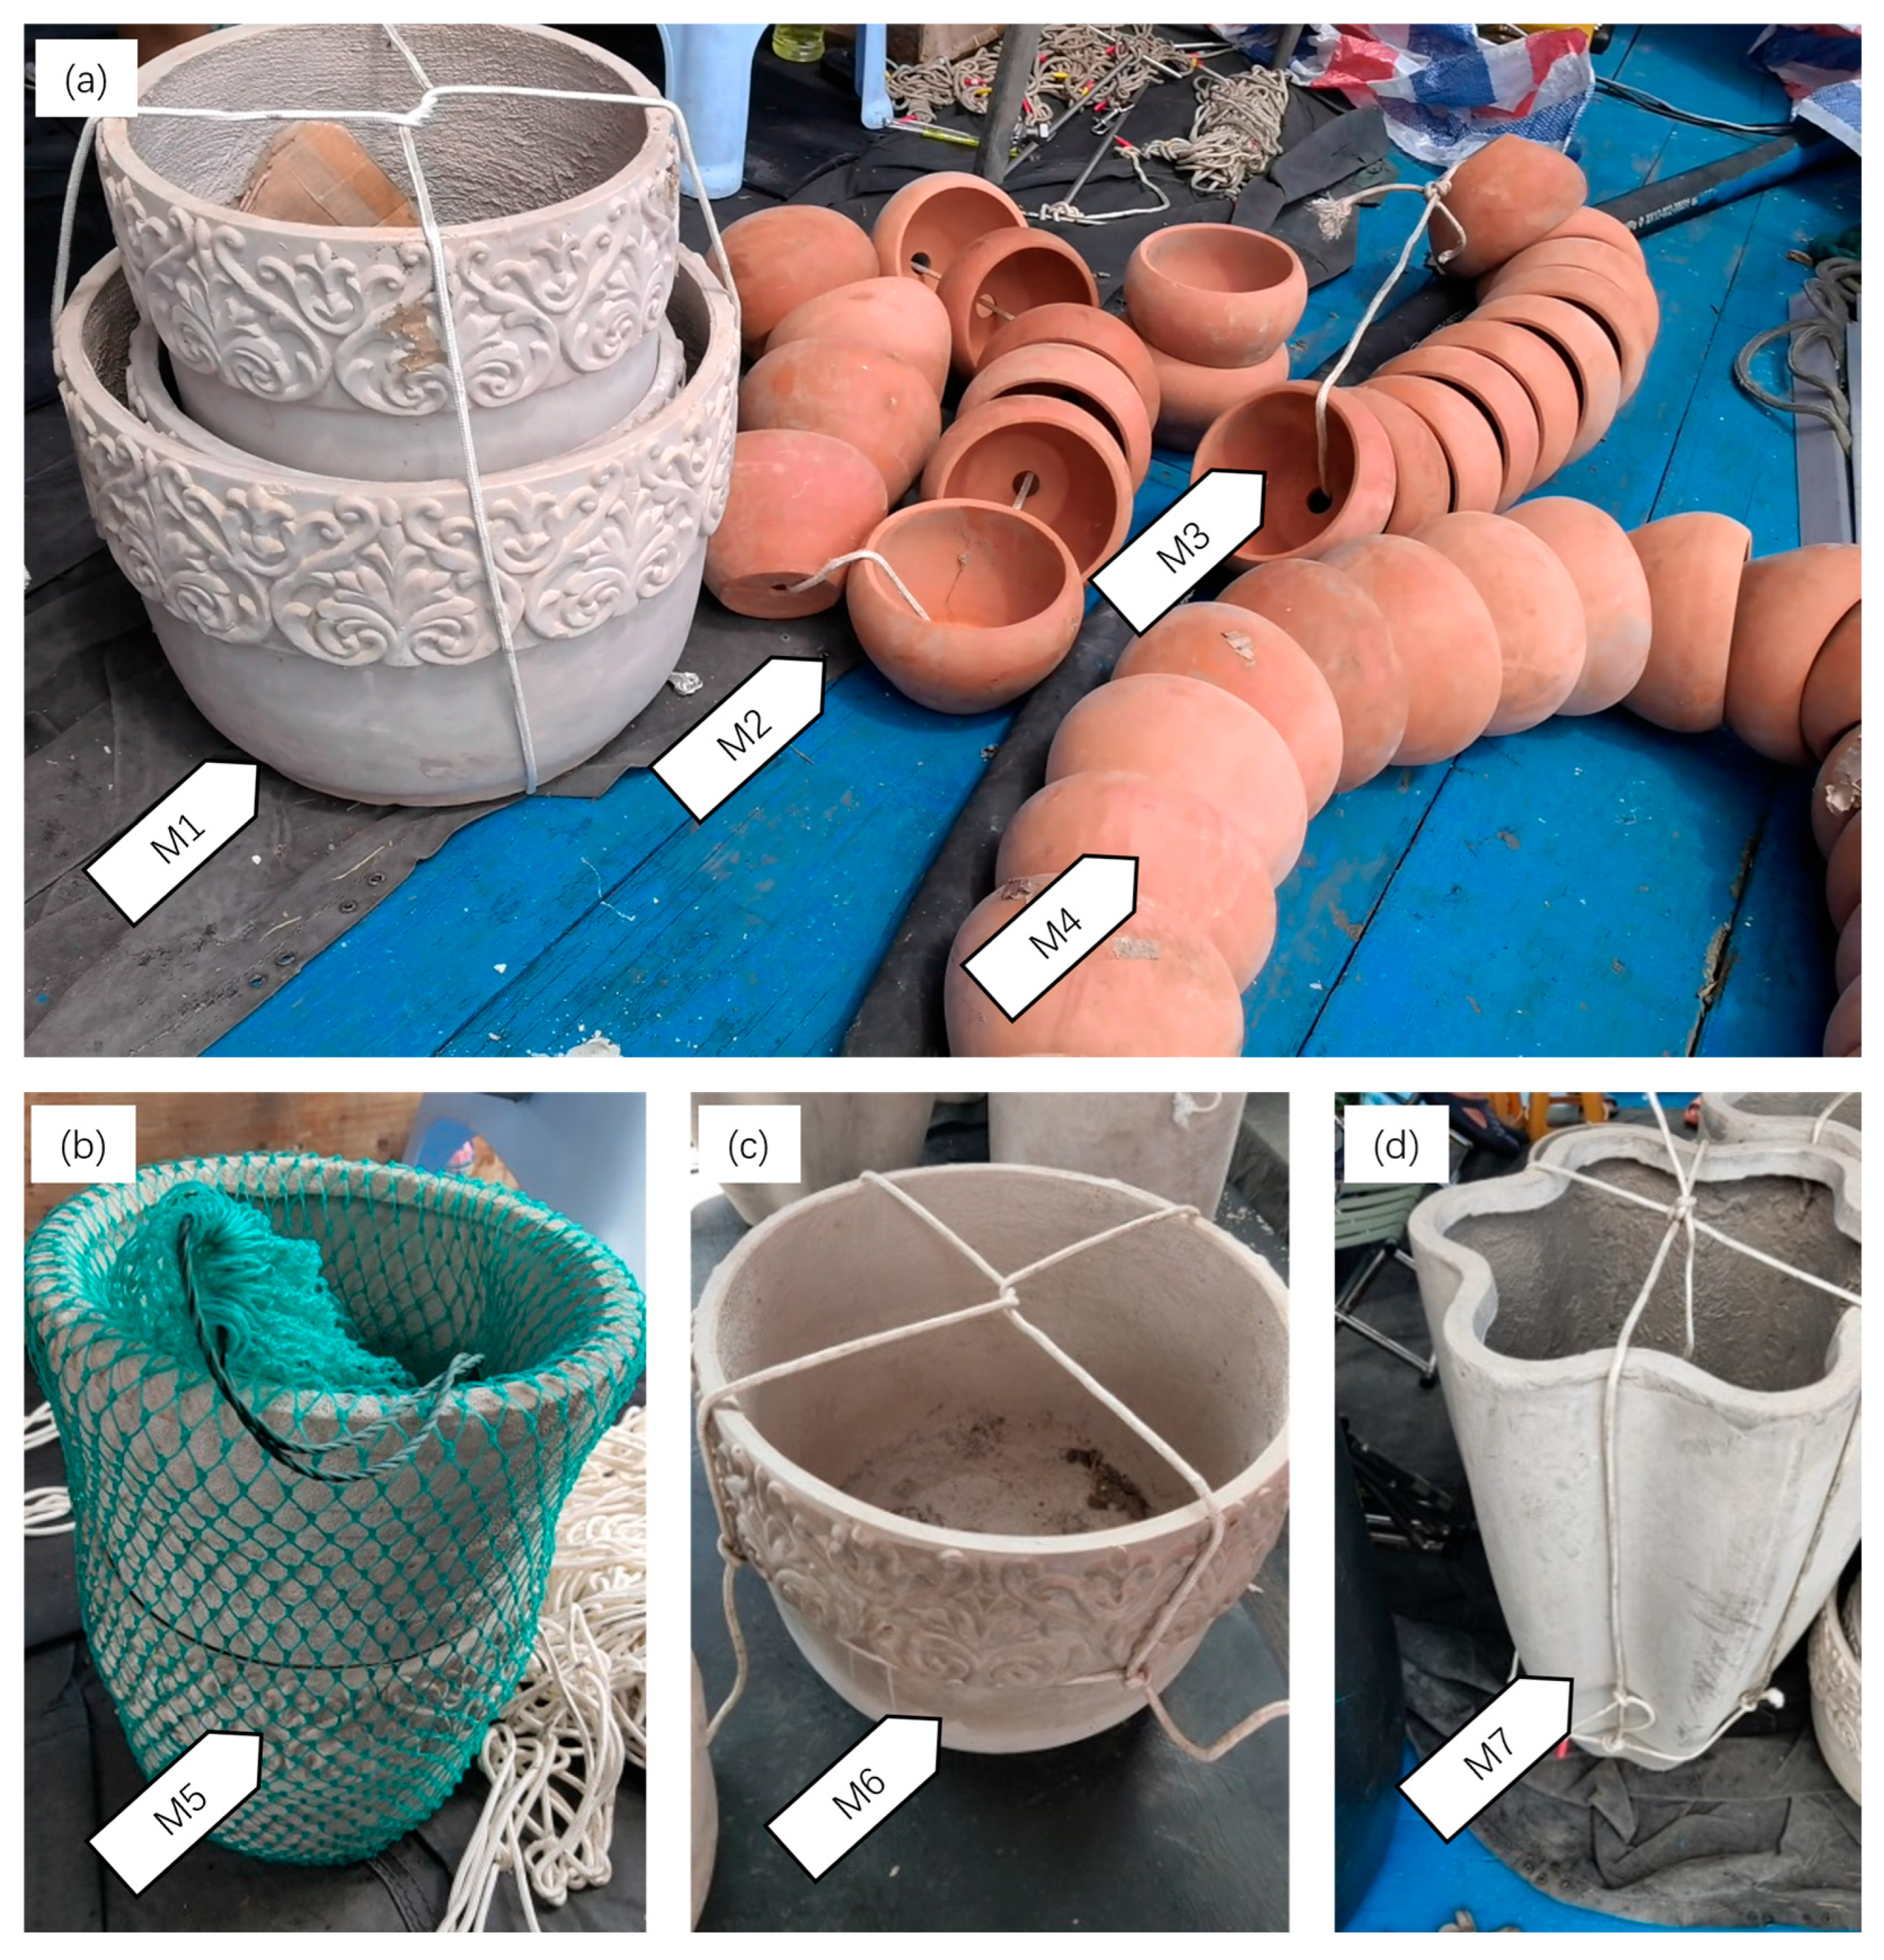
In the field experimental study, authentic ceramic flower pots manufactured locally in southern Fujian were selected to simulate underwater cultural relics, as their material composition closely resembles that of genuine artifacts. The models were categorized into three types based on size and form: small, medium, and large models. The small models consist of ceramic flower pots with a height of 10 cm and a diameter of 17 cm, arranged in clusters or strings, e.g., M2, M3 and M4 in
Figure 2a. The medium models include three different sizes of ceramic flower pots: one with a height of 17 cm and a diameter of 27 cm, another with a height of 24 cm and a diameter of 33 cm, and a third with a height of 28 cm and a diameter of 38 cm, e.g., M1 in
Figure 2a, M5 in
Figure 2b, M6 in
Figure 2c. The large model features a ceramic flower pot with a height of 70 cm and a diameter of 44 cm, as shown in
Figure 2d. Based on the theoretical resolution of the sonar equipment used, we combine some of these models (as shown in
Figure 2) to increase the volume of the models to enhance their recognizability on the acoustic map.
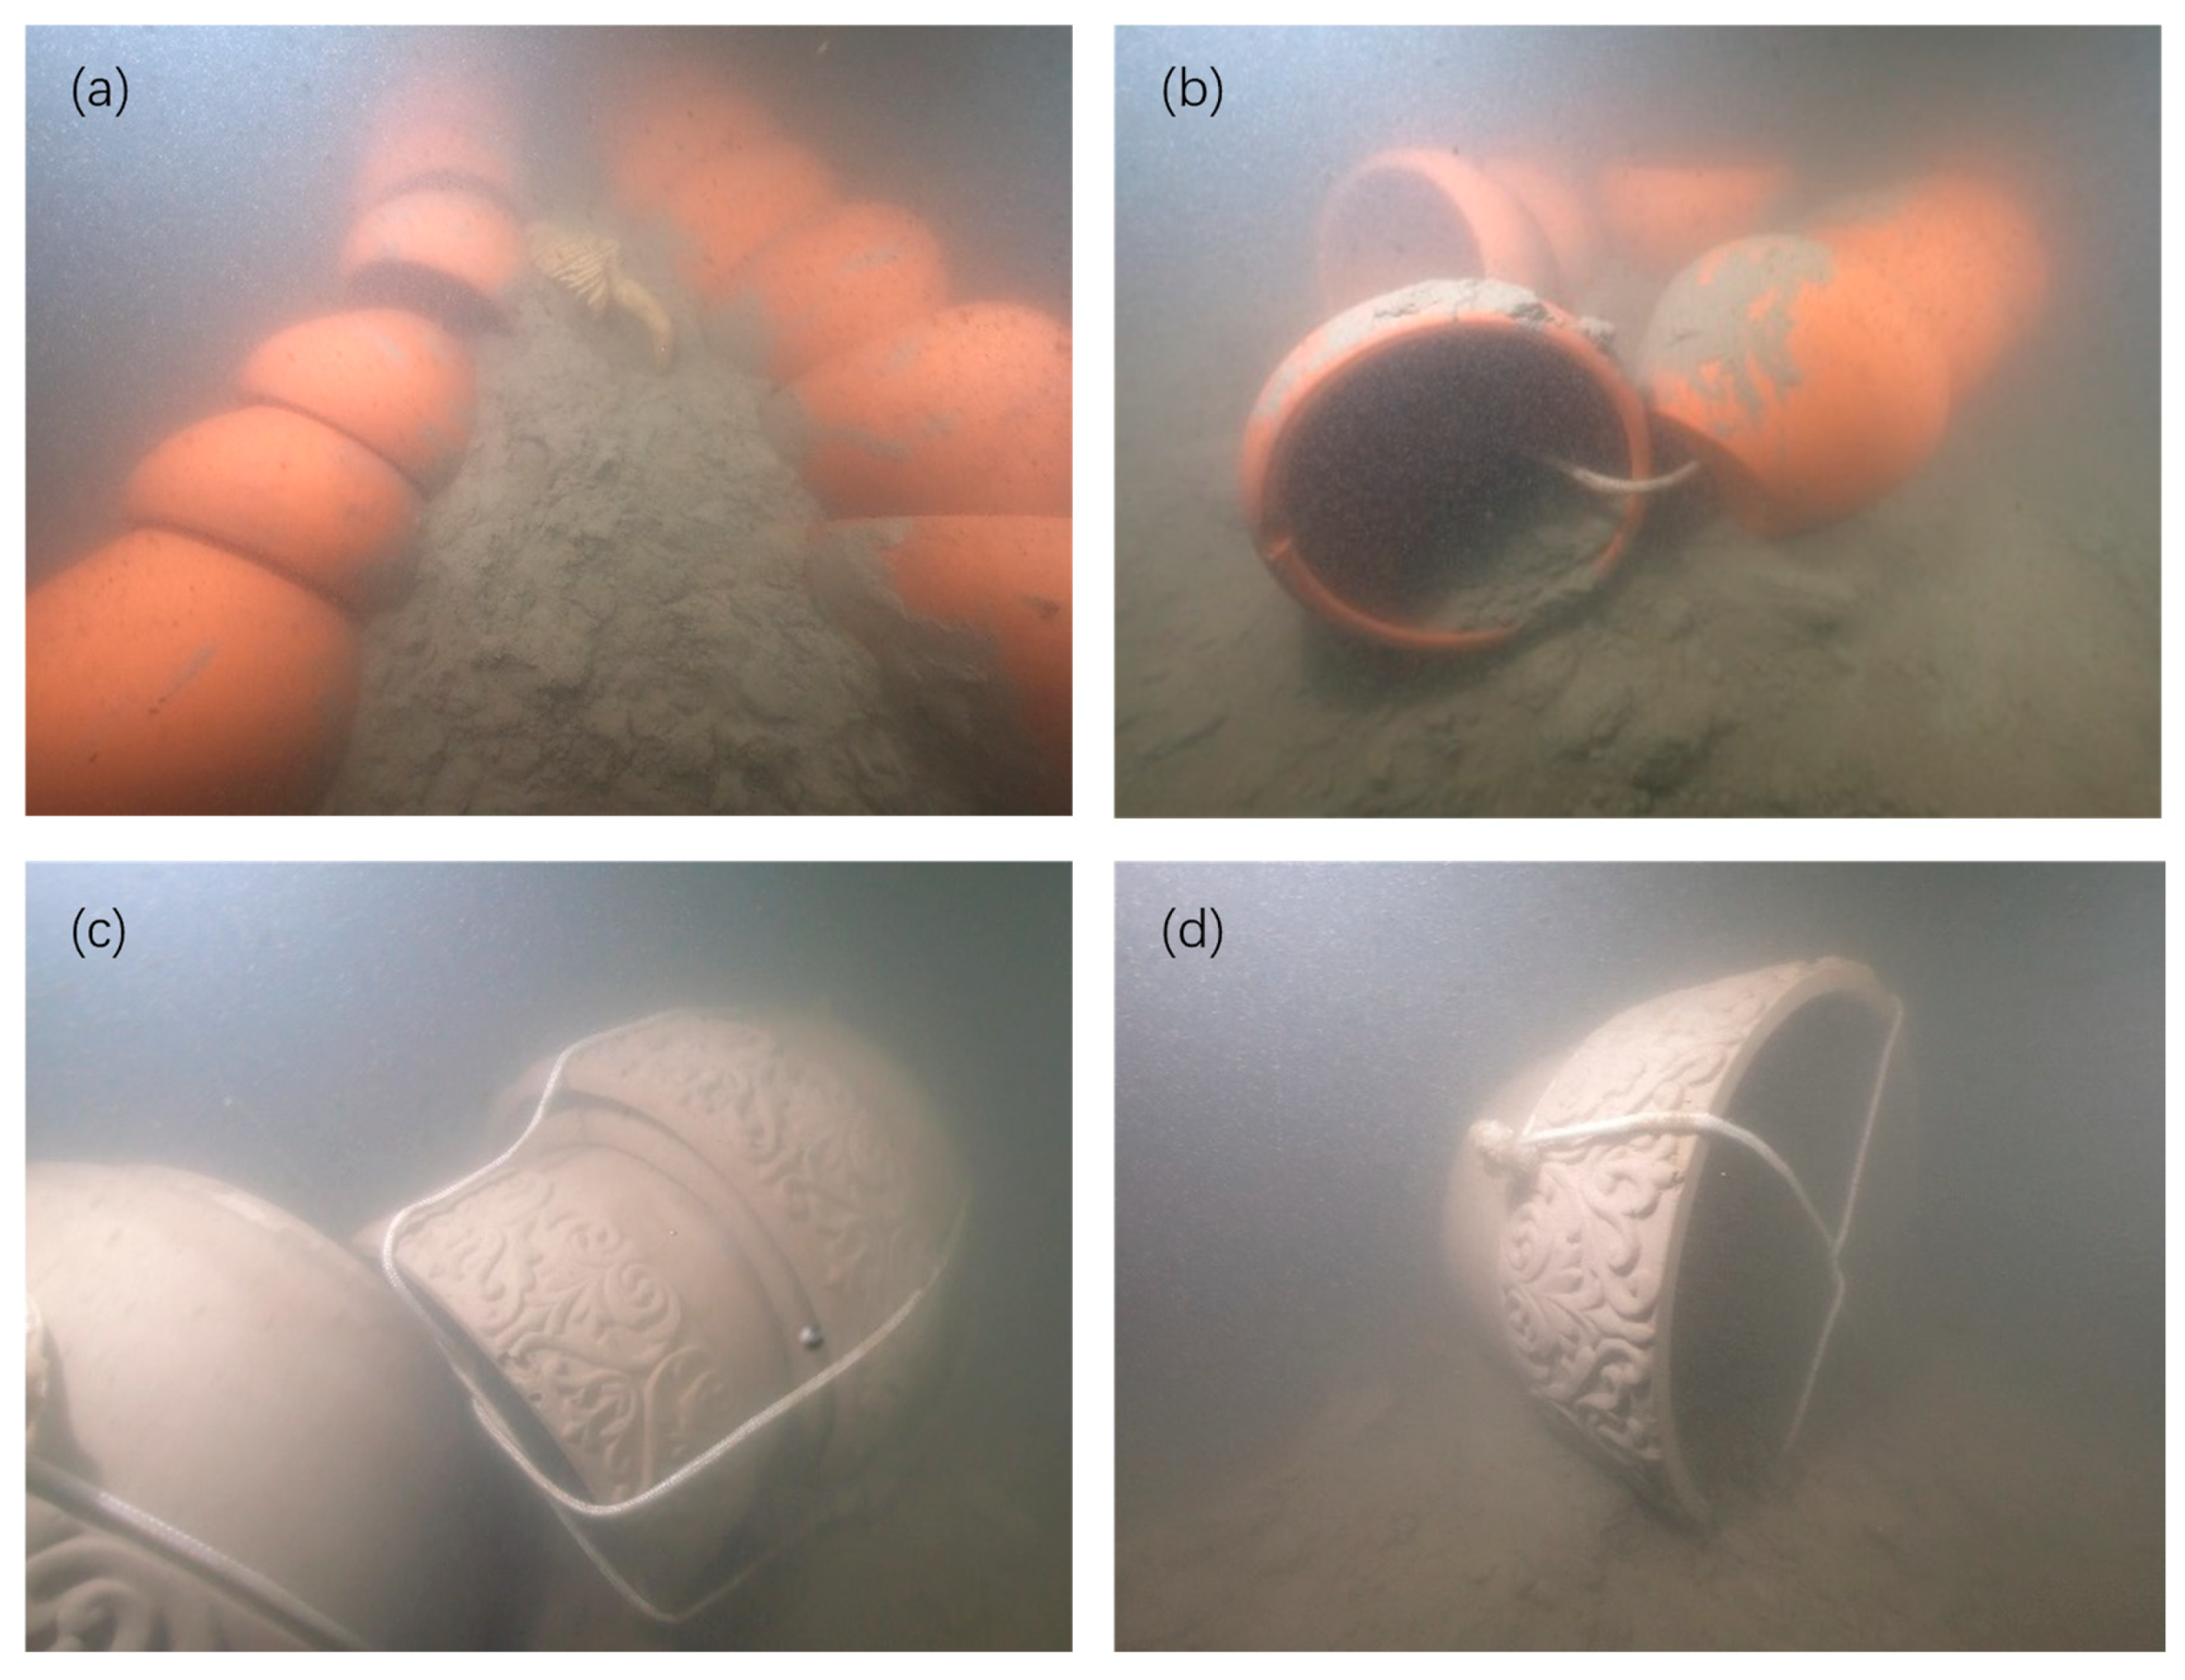
On 20 July 2022, the research team deployed a batch of ceramic flower pots of varying sizes in the Baozhu Island experimental area. The pots were arranged individually, stacked, or connected in series, and secured with thin ropes before being placed on the seafloor. Following the deployment of the models, divers conducted underwater photography to document the condition of the models on the seafloor. The state of some models after deployment on the seafloor are illustrated in
Figure 3.
2.2.3. Data Acquisition
On 20–21 July 2022, marine survey experiments were conducted based on the deployment status of the models and an assessment of the underwater conditions. The experiments included the use of MBES, SSS, and SBP system. The MBES focused on three-dimensional modeling of the seafloor topography, while the SSS was aimed at imaging underwater targets. The SBP was utilized to investigate the sedimentary environment of the experimental area. To avoid acoustic interference among these three types of instruments, separate surveys were conducted during the experiment.
Currently, commonly used MBESs typically offer various operational modes to accommodate different application scenarios, including single-frequency mode, dual-frequency mode, dynamic focusing mode, and side-scan imaging mode. The single-frequency mode employs a single frequency of sound waves for measurements, making it suitable for routine surveying tasks, characterized by high measurement speed and stability. The dual-frequency mode utilizes two different frequencies simultaneously, which is ideal for shallow water measurements, such as in ports and coastal areas, as it provides enhanced resolution and resistance to interference. The dynamic focusing mode enhances local resolution by adjusting the beam focusing area, making it suitable for shipwreck detection and detailed inspections of underwater structures. The side-scan imaging mode combines depth measurement with sonar imaging, allowing for a clear visualization of the seafloor morphology, which is particularly useful for identifying underwater pipelines, rocks, and conducting archeological surveys.
Similar to MBESs, an SSS typically offers multiple operational modes, including single-frequency and dual-frequency modes. The single-frequency mode employs a single frequency to transmit acoustic waves, making it suitable for surveying specific depths. In contrast, the dual-frequency mode utilizes two frequencies simultaneously (e.g., 150 kHz and 450 kHz), balancing broad-area scanning with high-resolution imaging, and is suitable for comprehensive exploration in both shallow- and deep-water regions, such as in the search for sunken vessels.
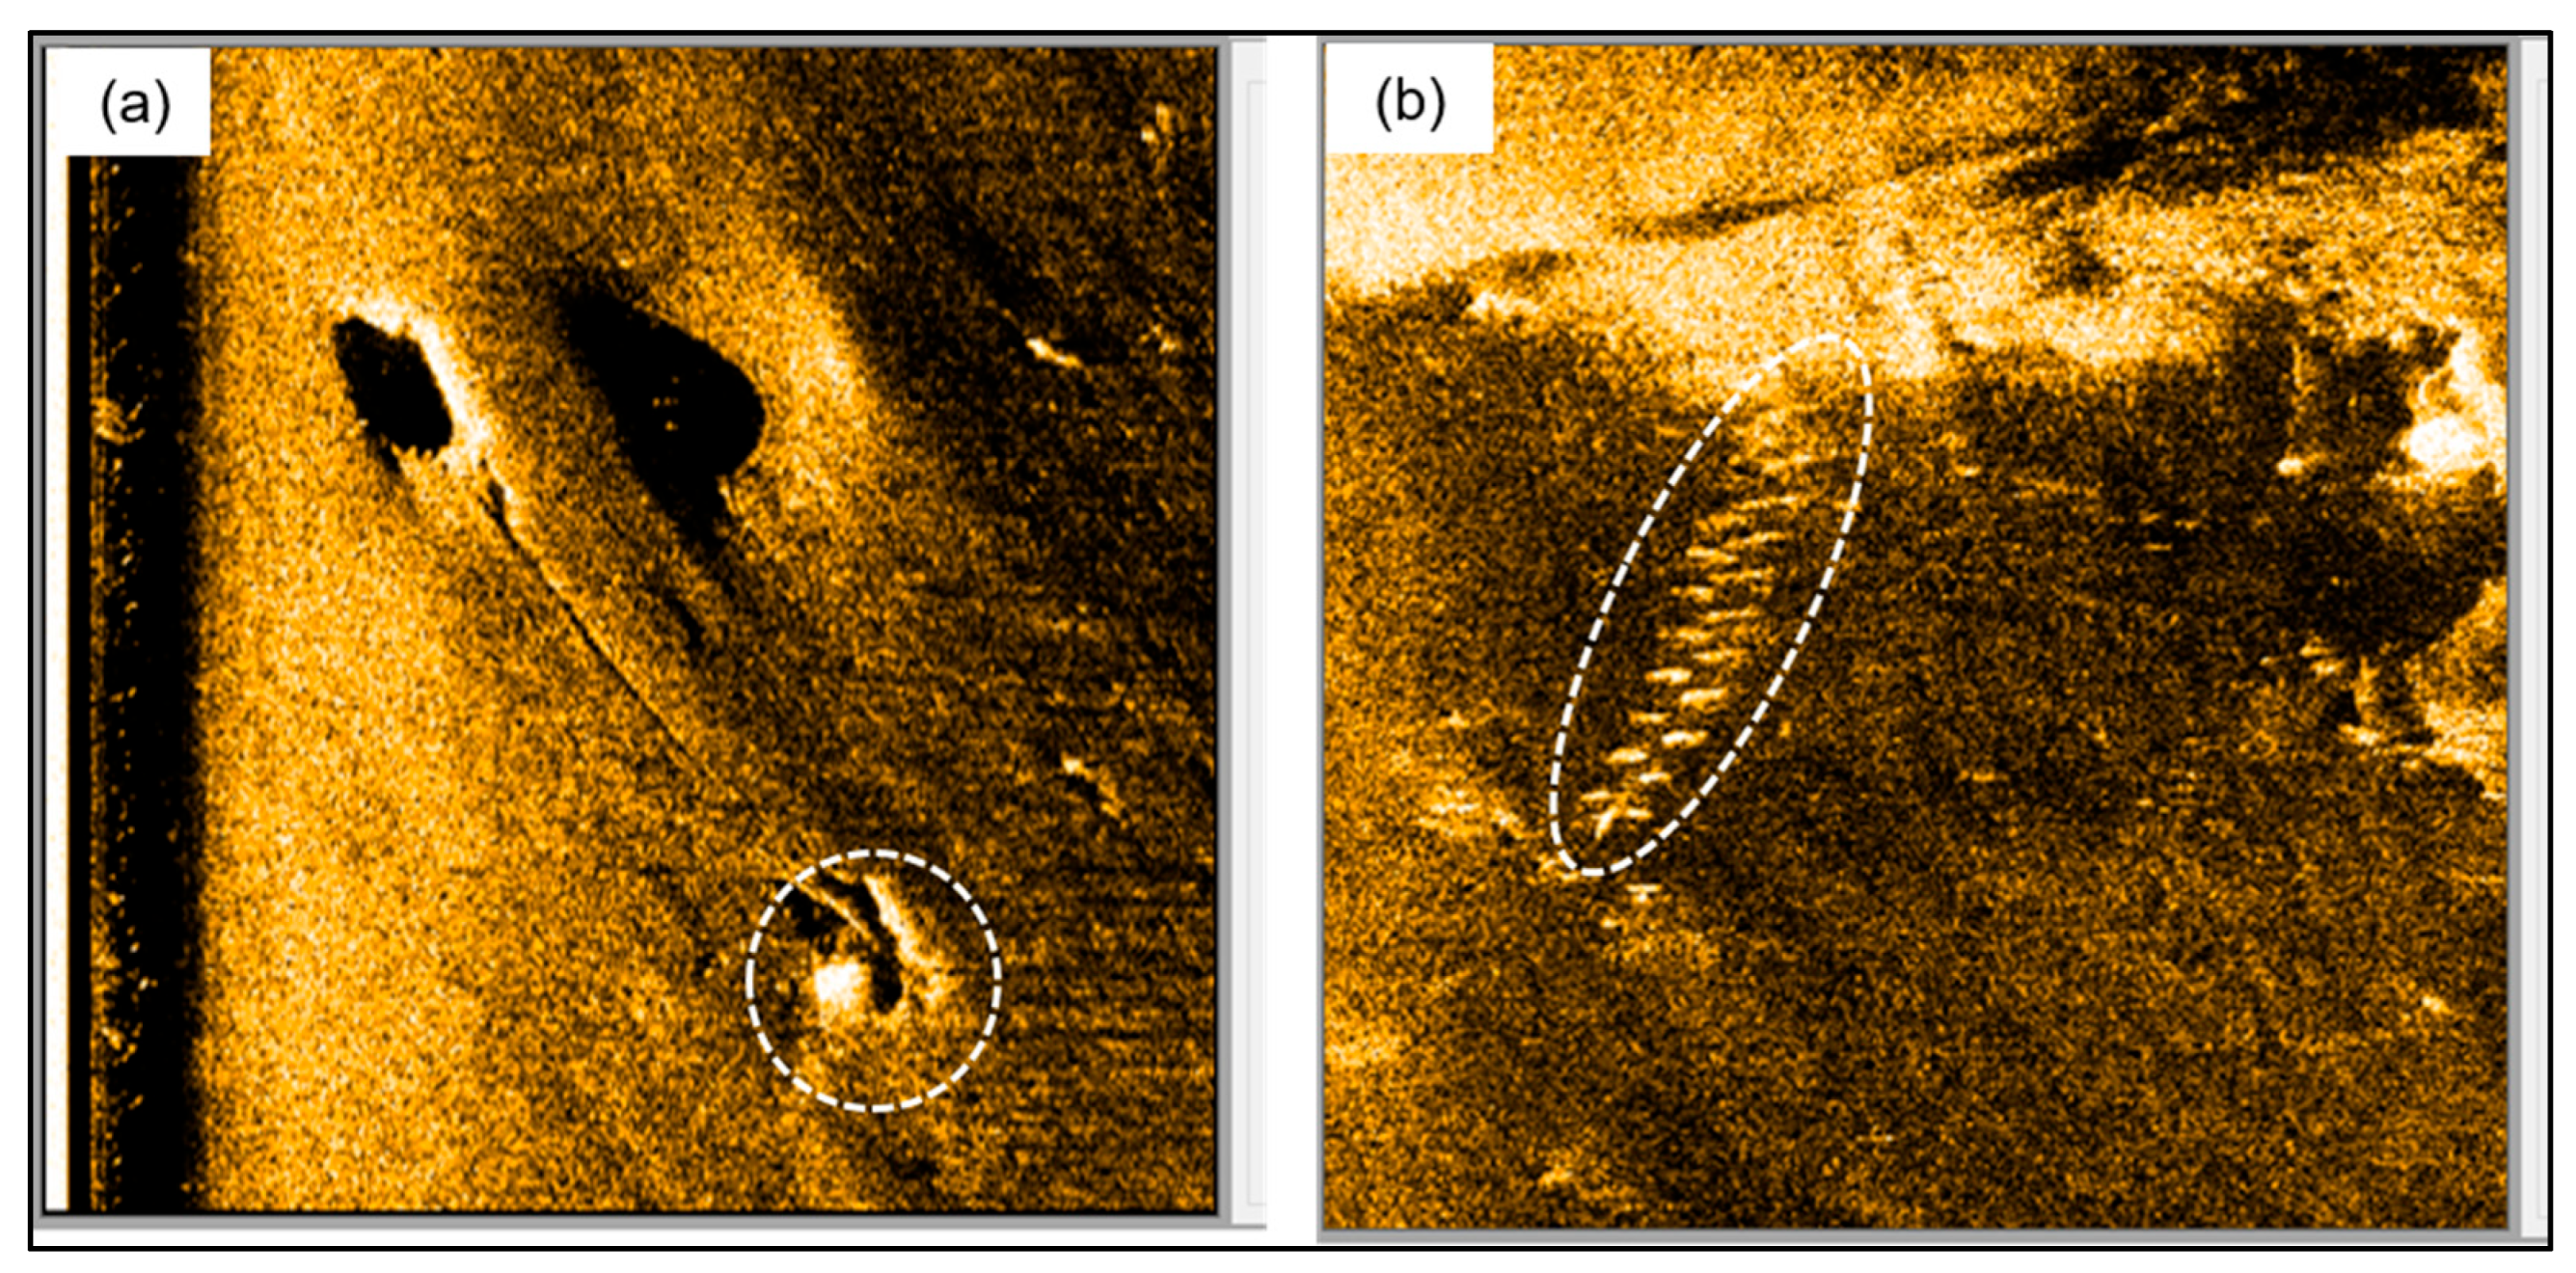
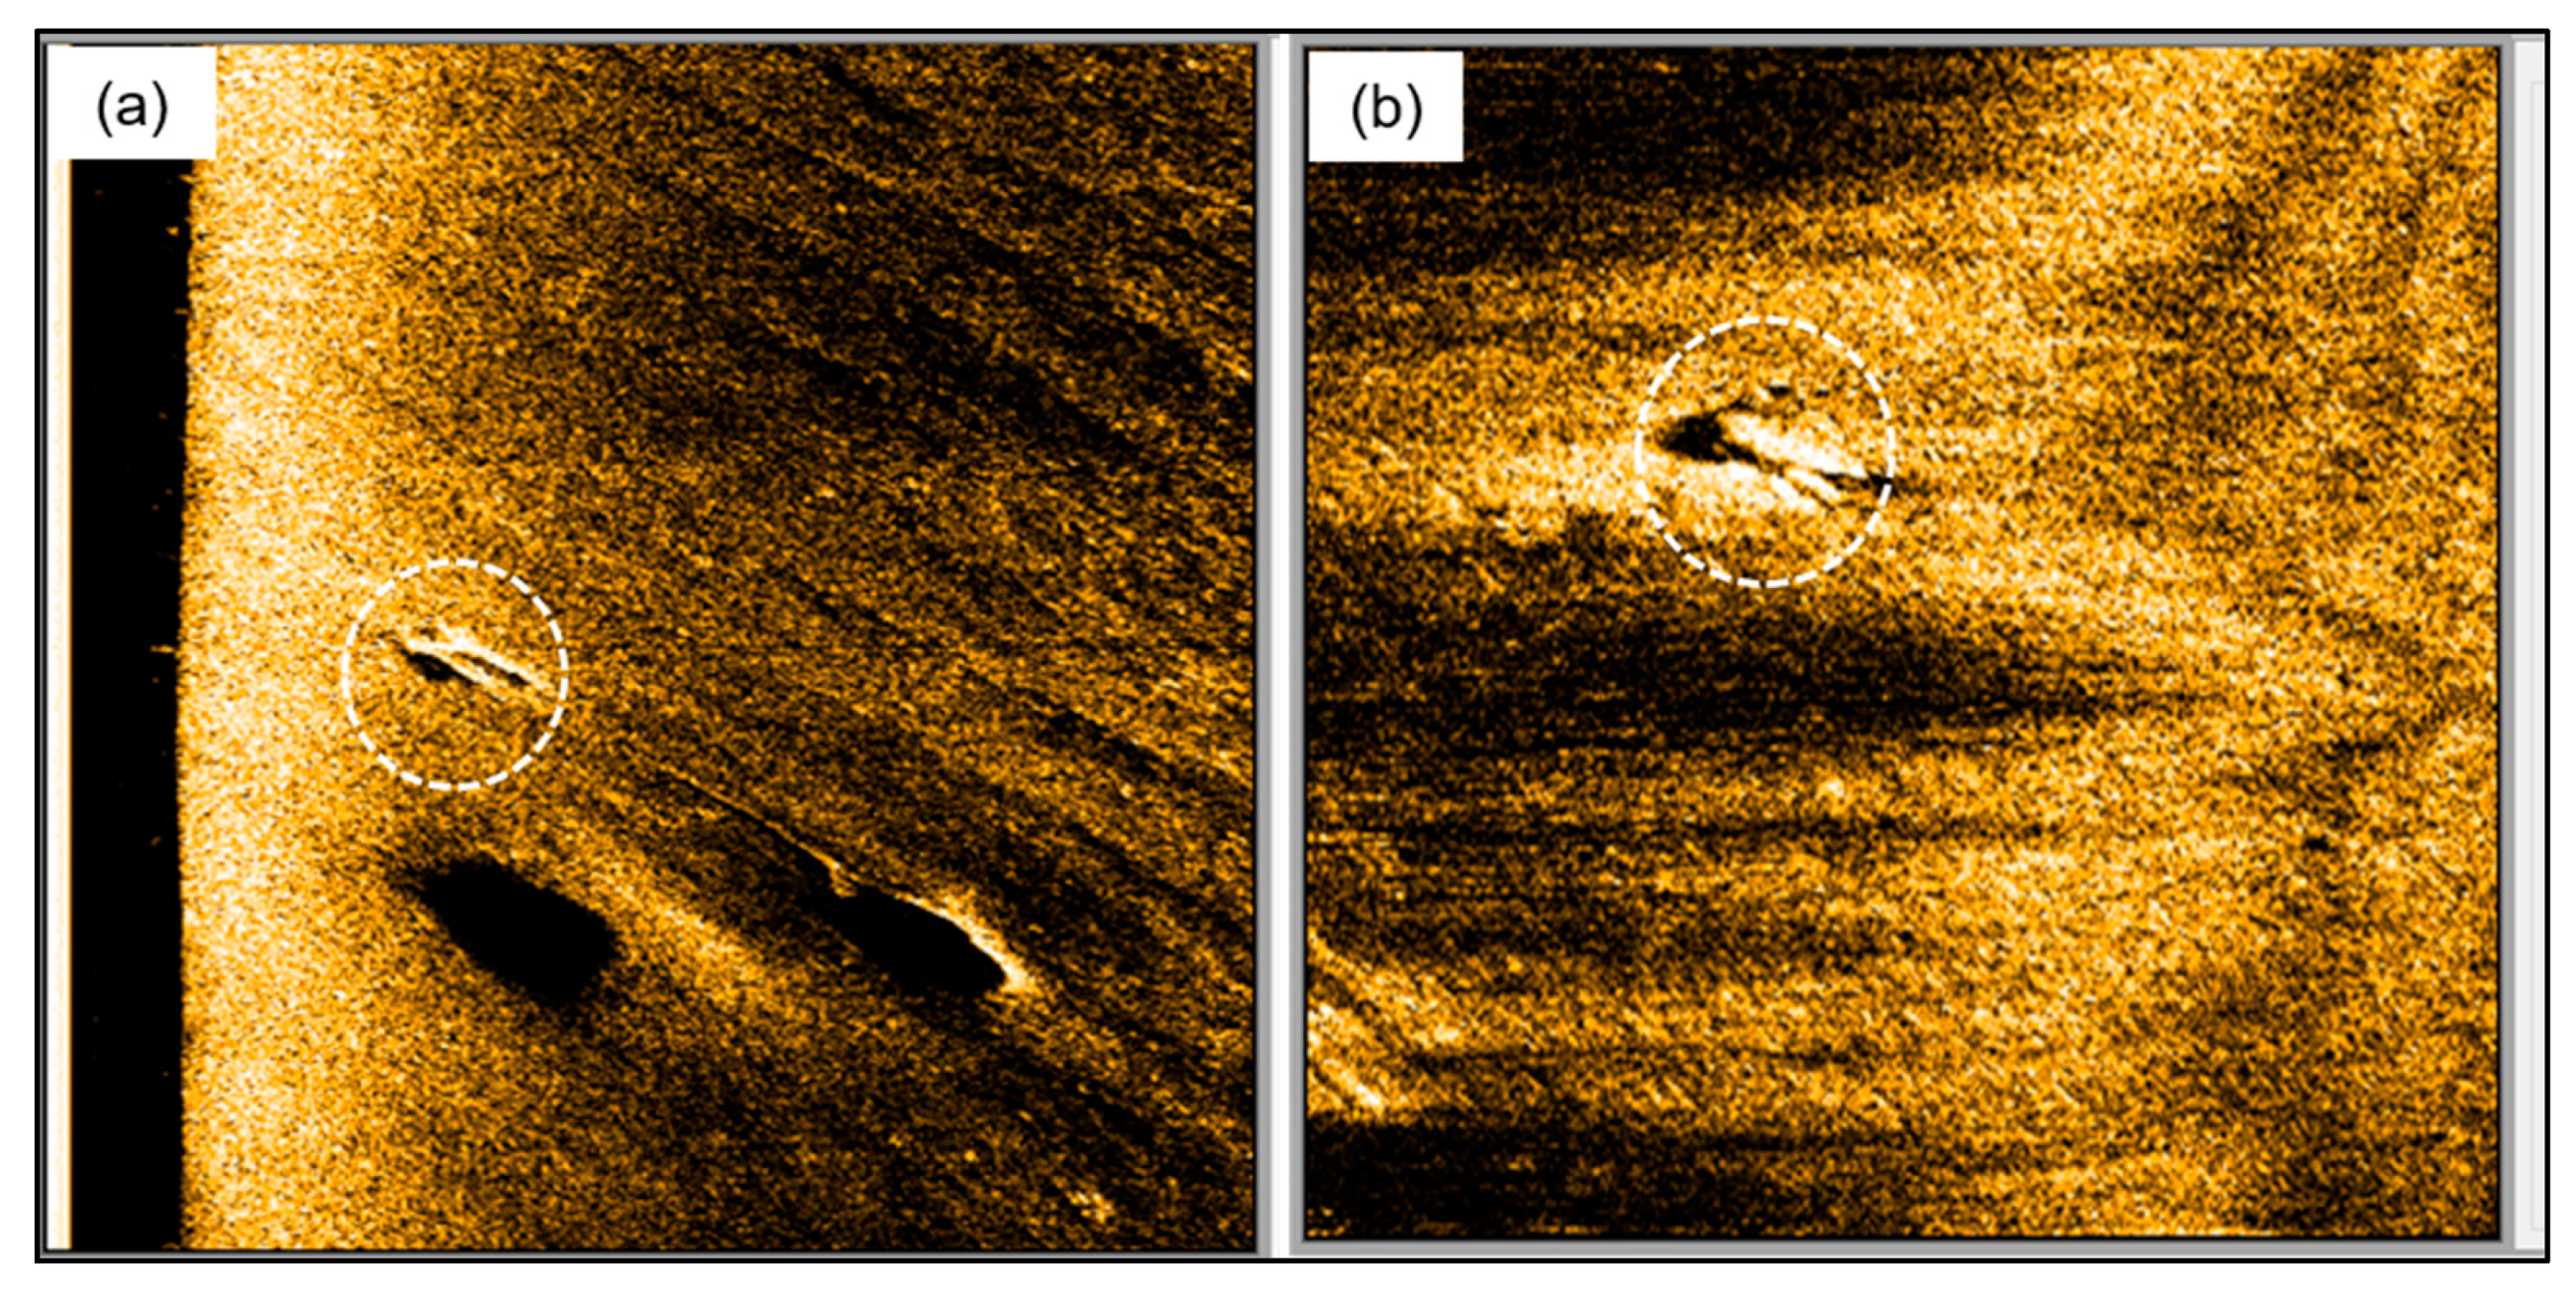
The acoustic impedance of ceramics, such as alumina at approximately 35 MRayl, is significantly higher than that of water (1.5 MRayl), resulting in a strong reflection of sound waves at the interface. This causes exposed ceramic objects to appear as bright targets in sonar images. Since newly deployed objects have not undergone prolonged sedimentation and are in an exposed state, they are well-suited for detection using MBES and SSS techniques.
This study employs the RESON 7125 shallow-water multibeam bathymetry sonar and the Shark-S150D dual-frequency side-scan imaging sonar to conduct field detection experiments. The RESON 7125 can be operated in three distinct modes. Some of the key technical parameters are shown in
Table 1. The Shark-S150D is a versatile sonar suitable for both shallow- and deep-water measurements, equipped with dual-frequency synchronous transmission and reception at 150 kHz and 450 kHz, as well as Chirp frequency modulation processing technology. This enables both wide-area coverage and high-resolution imaging. Some key technical parameters of Shark-S150D are shown in
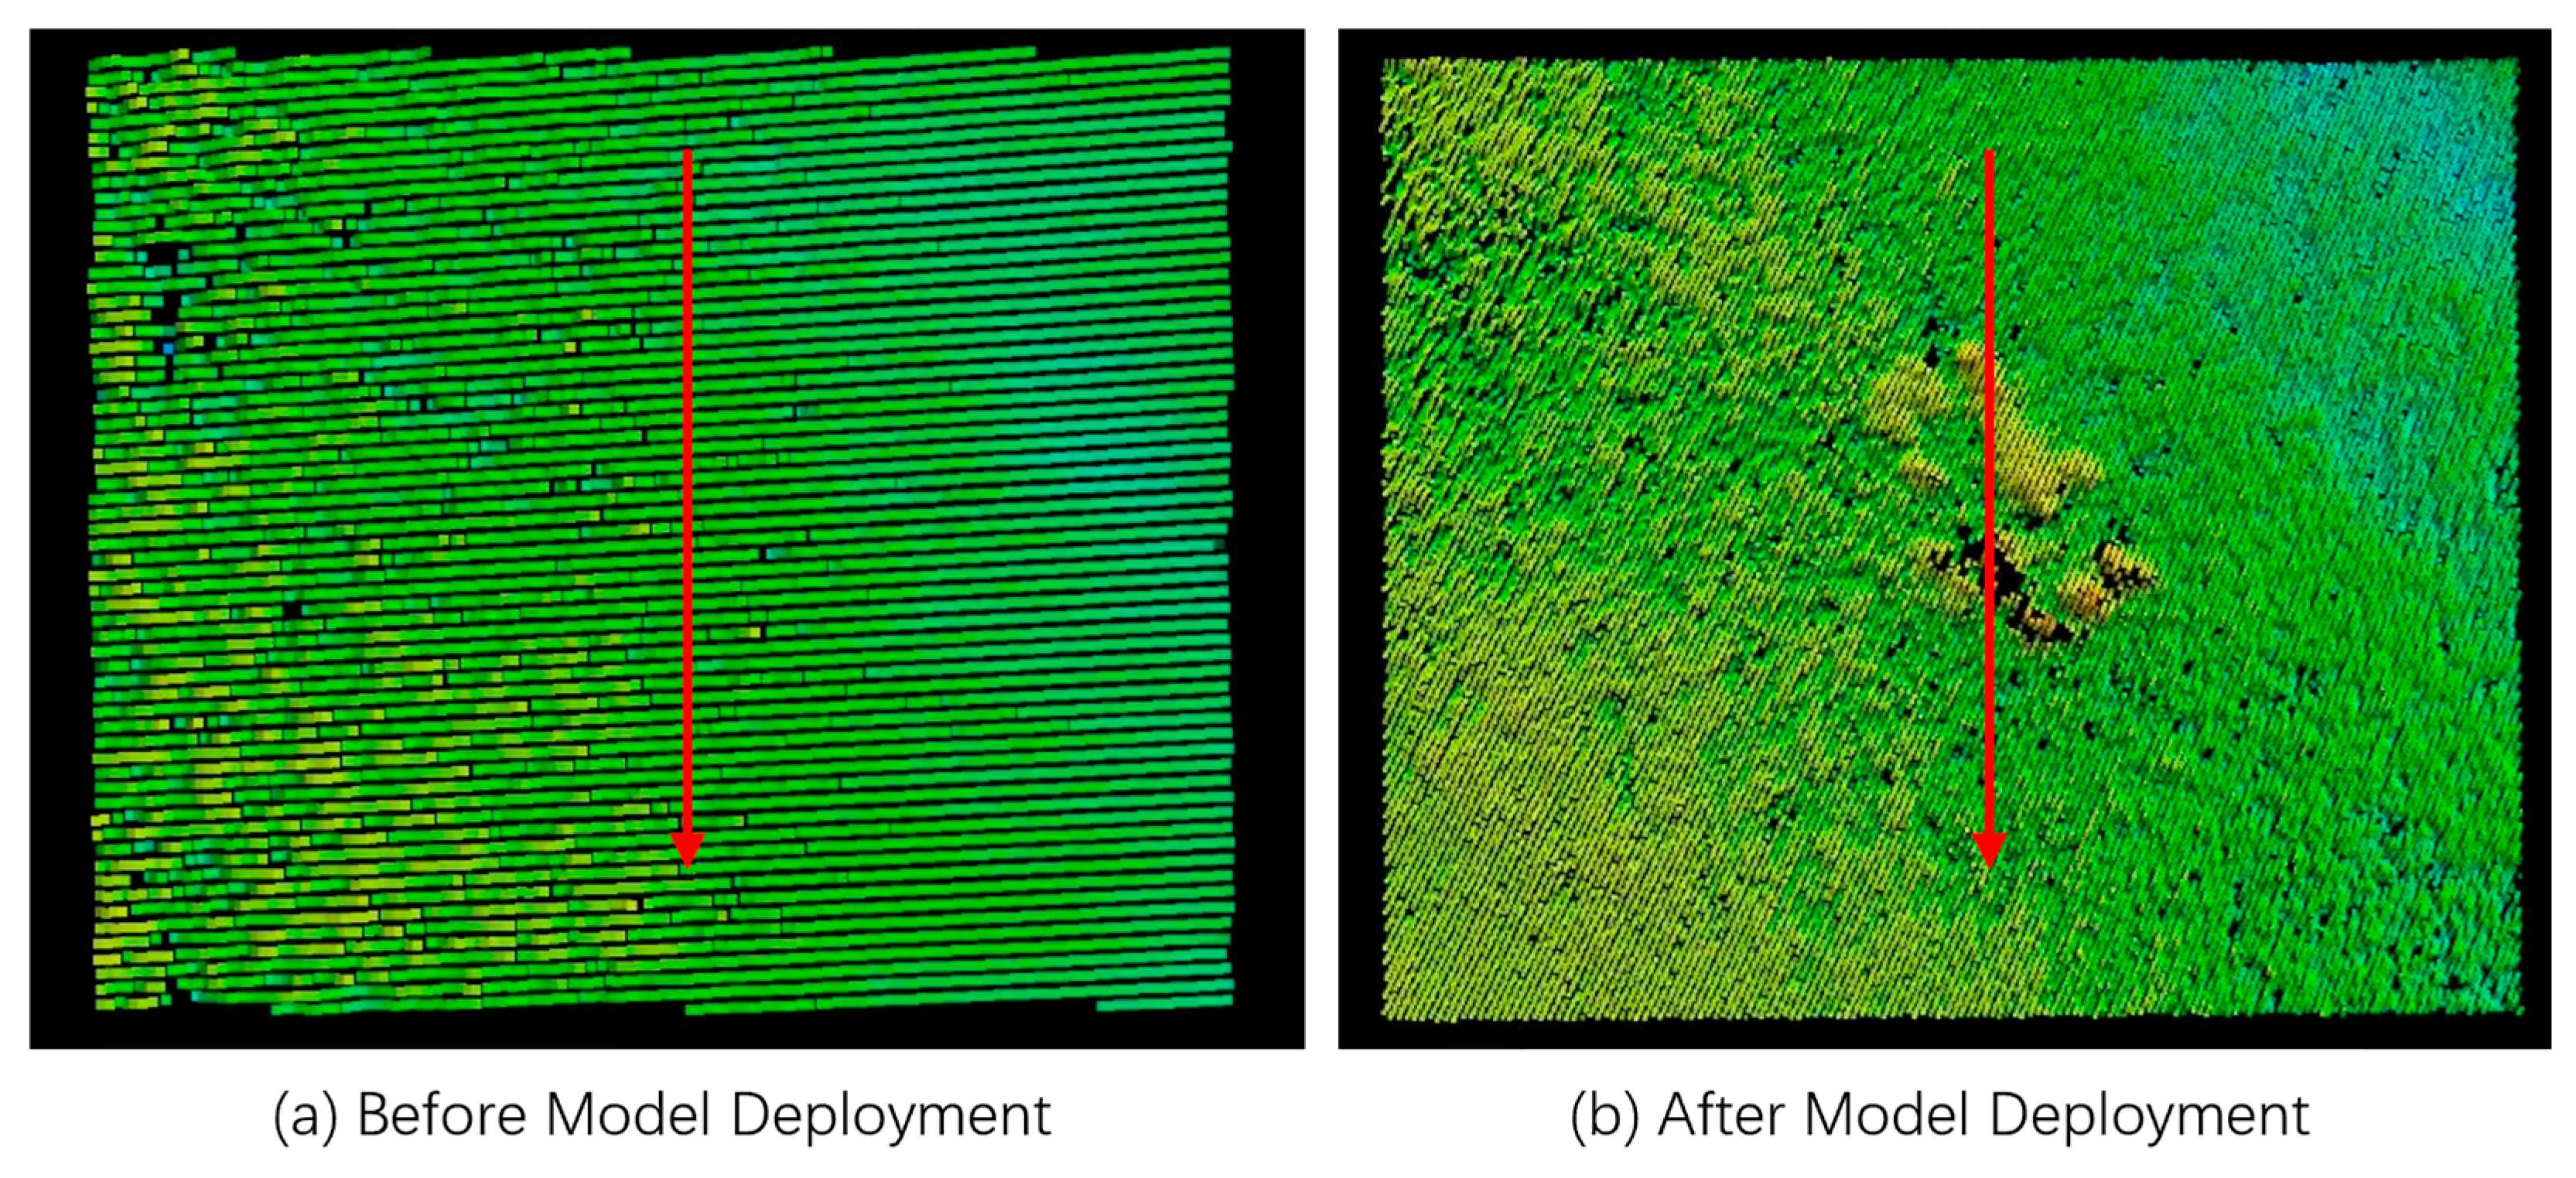
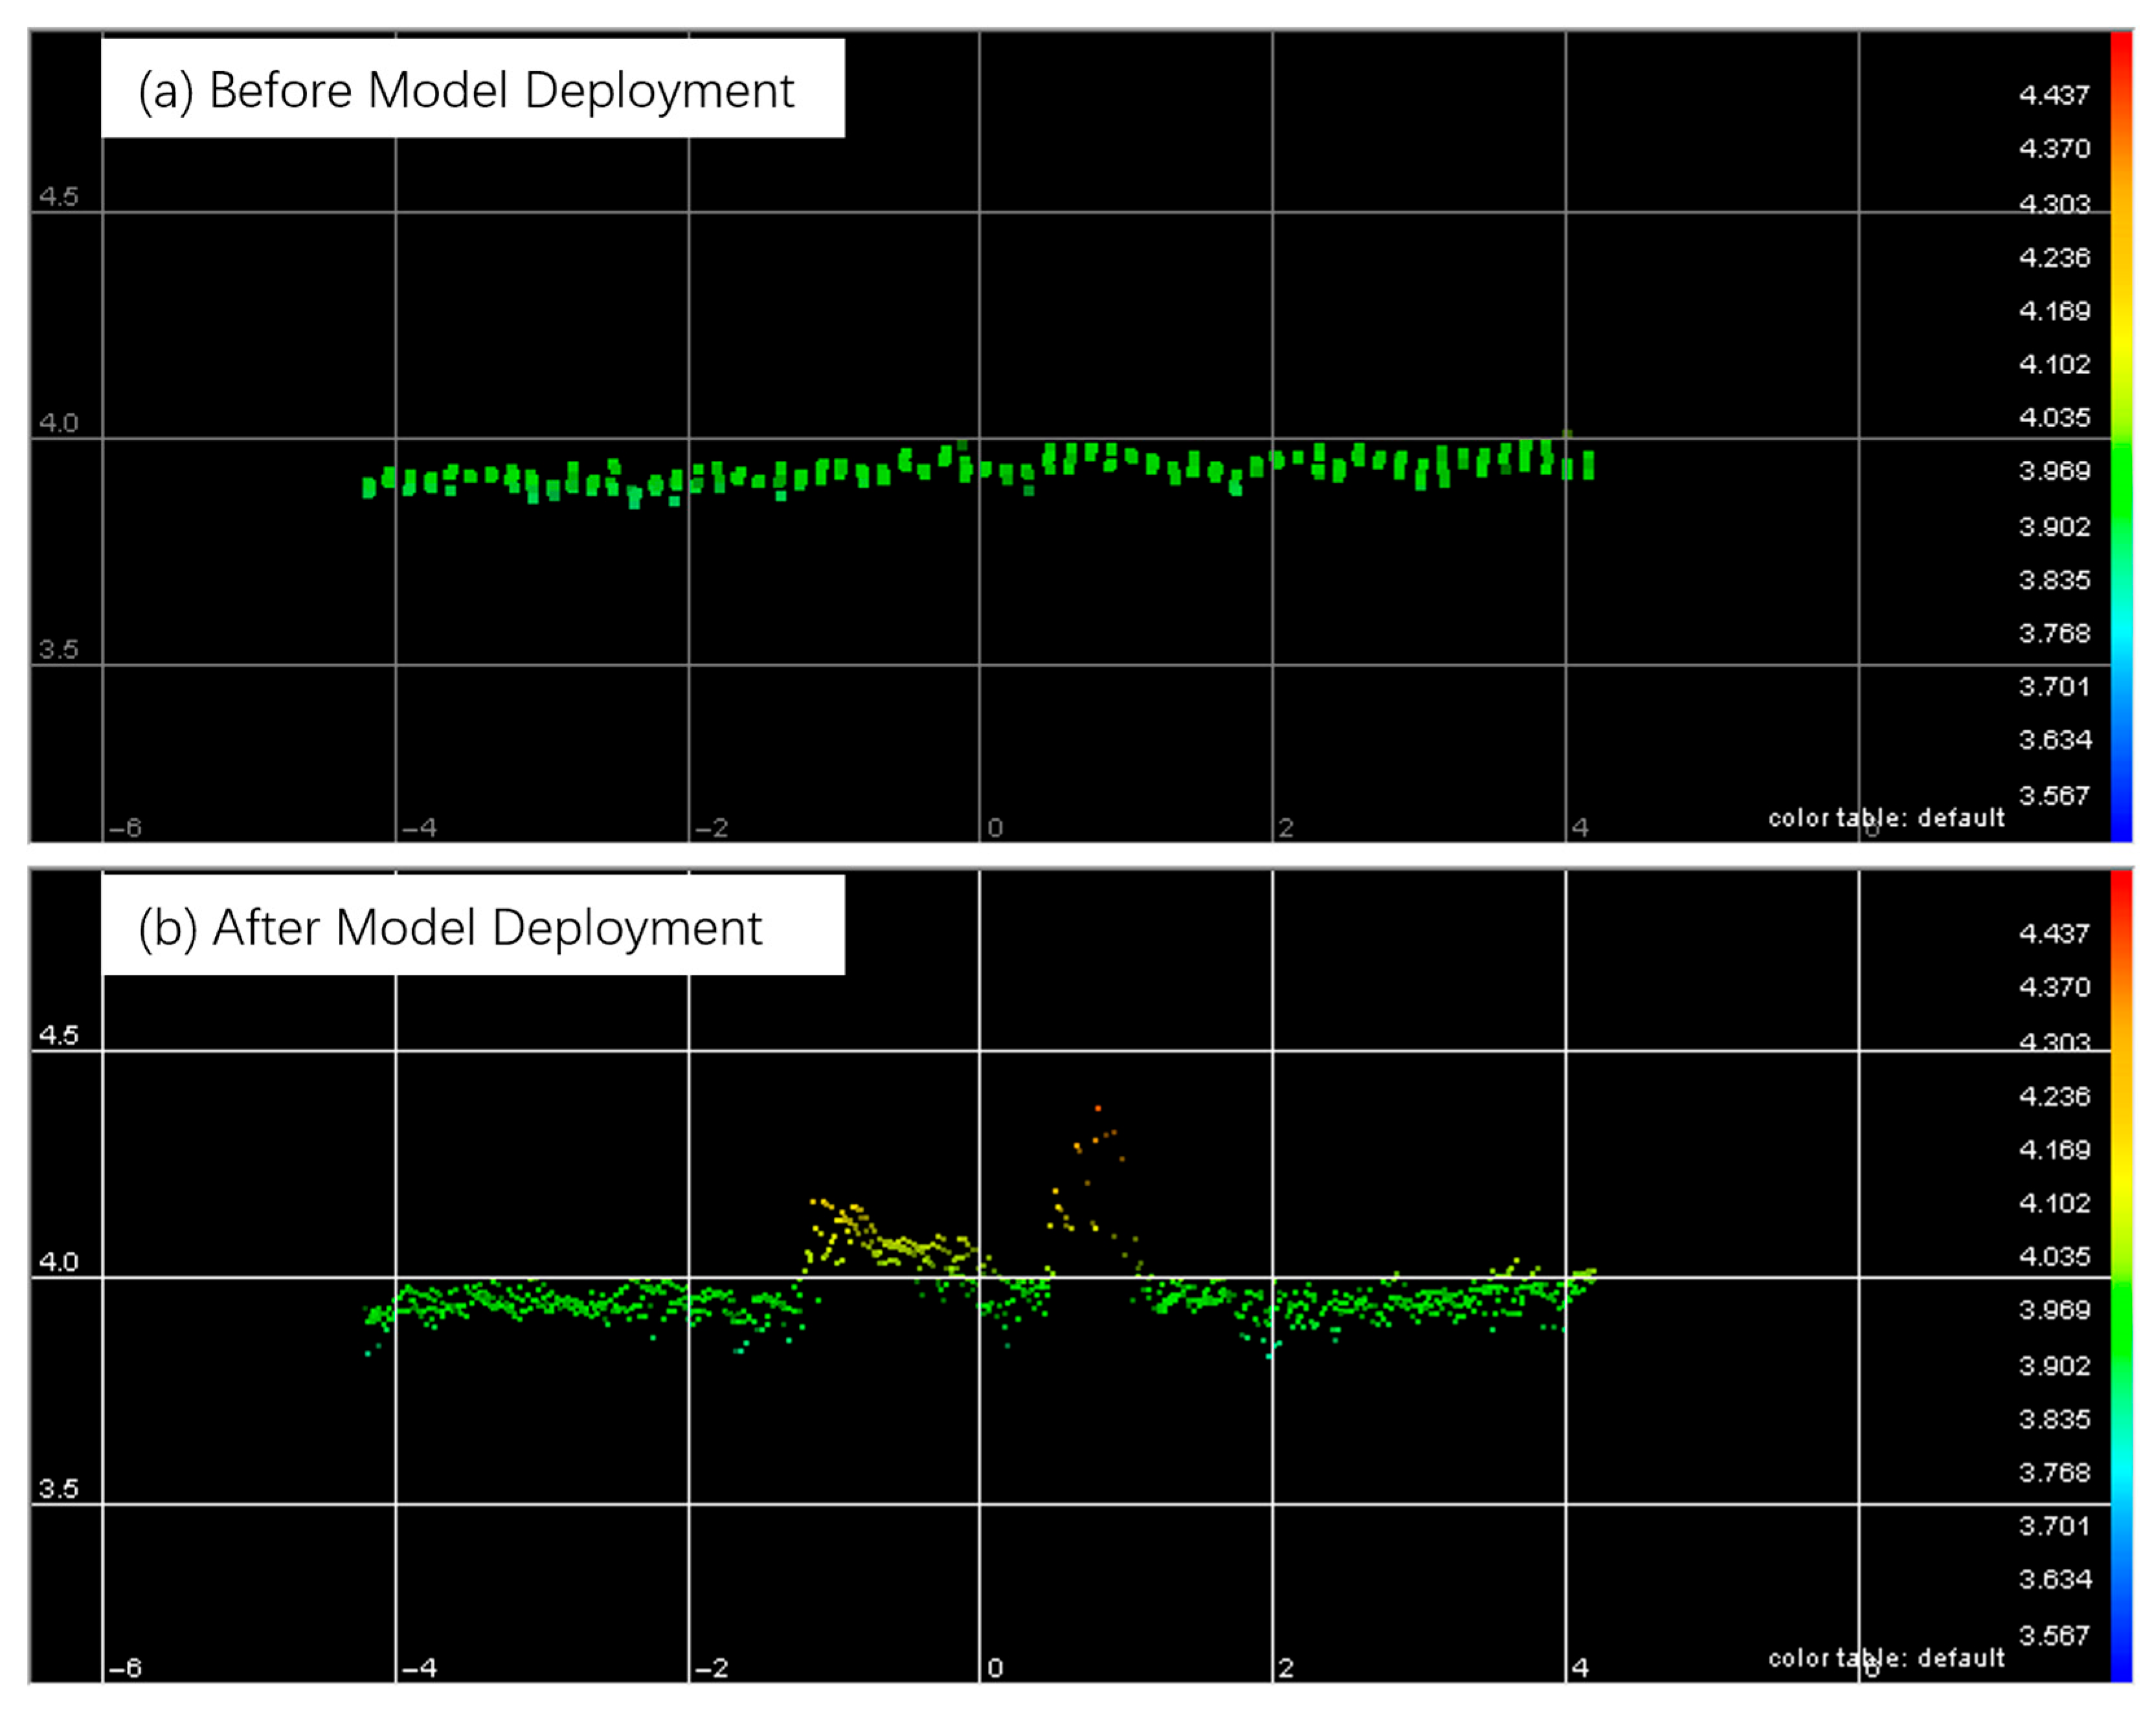
Table 2. During the field detection process, both the MBES and SSS utilized full-coverage scanning, providing essential background data for subsequent research. The MBES employed high-density survey lines, and through post-processing, multiple survey line data were integrated to generate three-dimensional representations of topographical anomalies. Additionally, backscatter data were recorded to facilitate further investigations. Moreover, we also carried out field detection study using the SES2000 parametric sub-bottom profiler, although the models located on the surface of the seabed could not reflect the unique advantages of SBP. Some key technical parameters of SES2000 are shown in
Table 3.
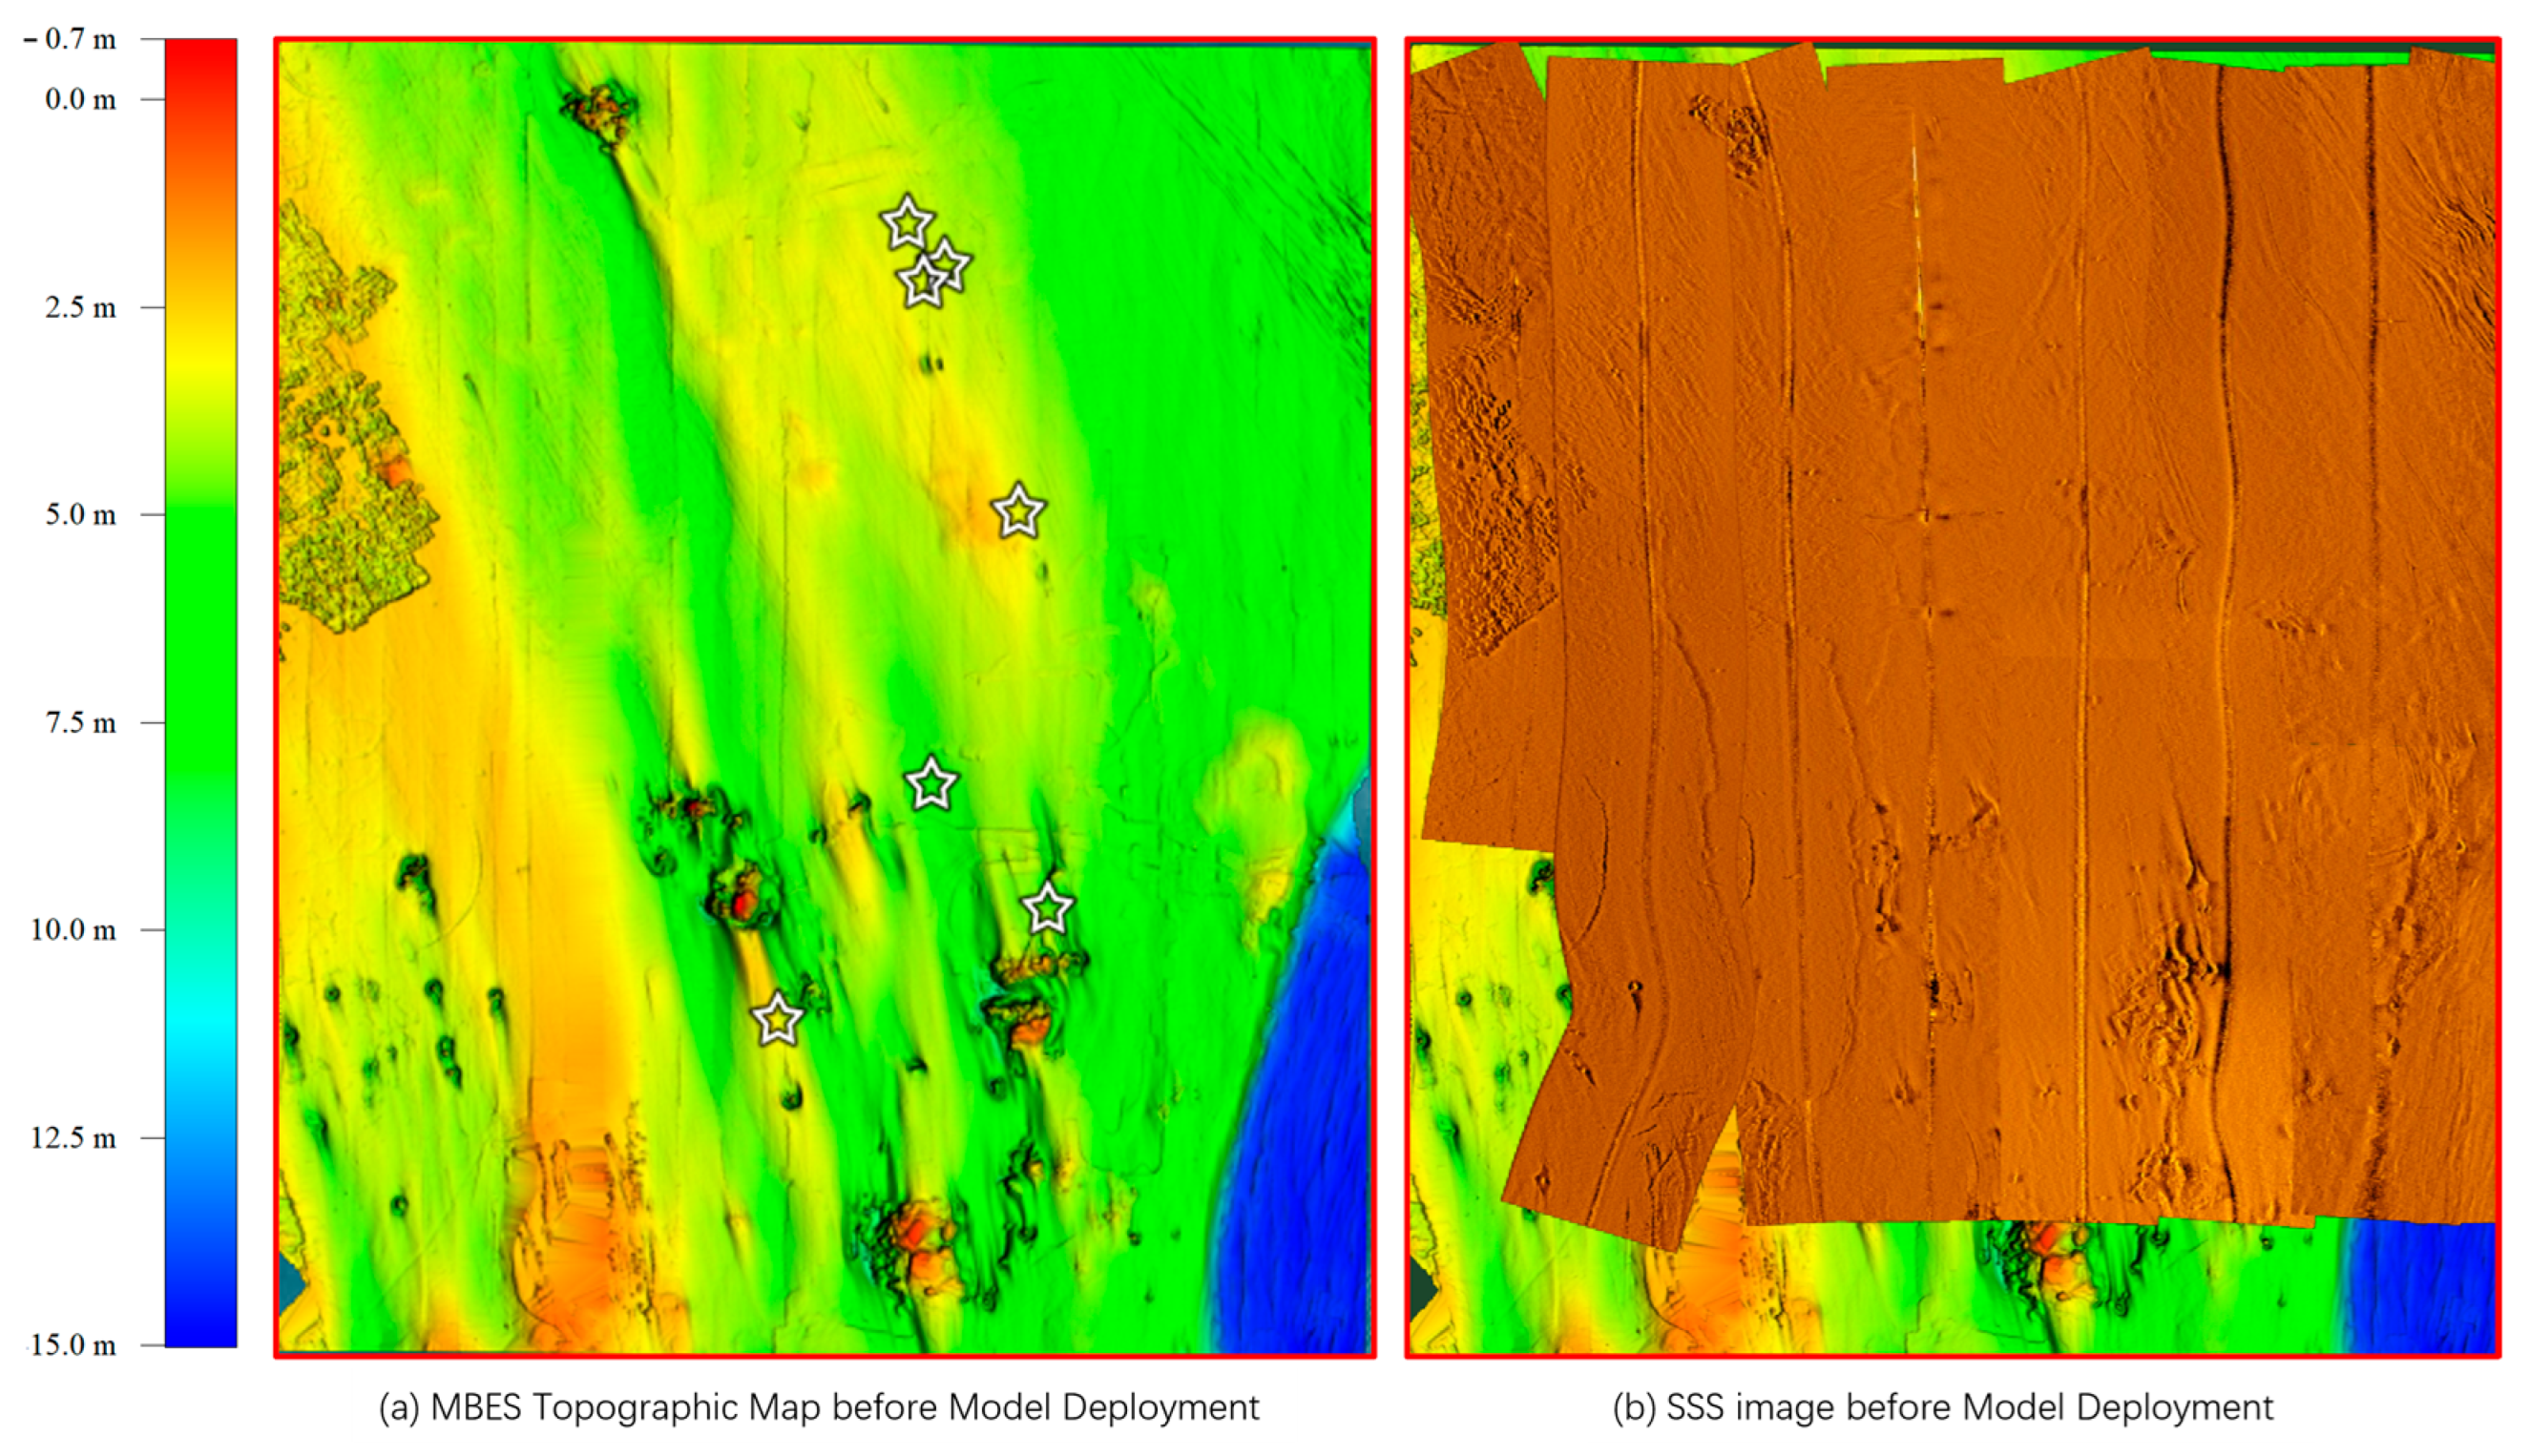
Figure 4 shows the measurements of MBE and SSS before model deployment, showing the topography and geomorphology of the experimental sea area.
4. Discussion
The MBES offers significant advantages in three-dimensional terrain reconstruction; however, it relies on dense survey lines and sophisticated post-processing algorithms. SSS is suitable for rapid surveys but requires a reduction in vessel speed (less than 4 knots) to enhance resolution. To leverage the strengths of both methods, it is recommended to adopt a combined detection approach of “initial screening with MBES followed by detailed surveying with SSS.”
In specialized application scenarios, such as the detection of small targets, it is crucial to understand the operational mechanisms of the instruments you choose to solve problems before designing and implementing a solution. For the above acoustic sounding instruments, we think the concept of beam footprint should be kept in mind throughout the data acquisition and data processing. The beam footprint influences the resolution in the vertical track direction, while the resolution along the track direction is dependent on the survey vessel’s speed and the so-called ping rate. It is important for personnel to consider the relationship between coverage and spatial resolution. For small target detection, coverage is more critical during the detection phase, whereas spatial resolution becomes more significant during the imaging phase.
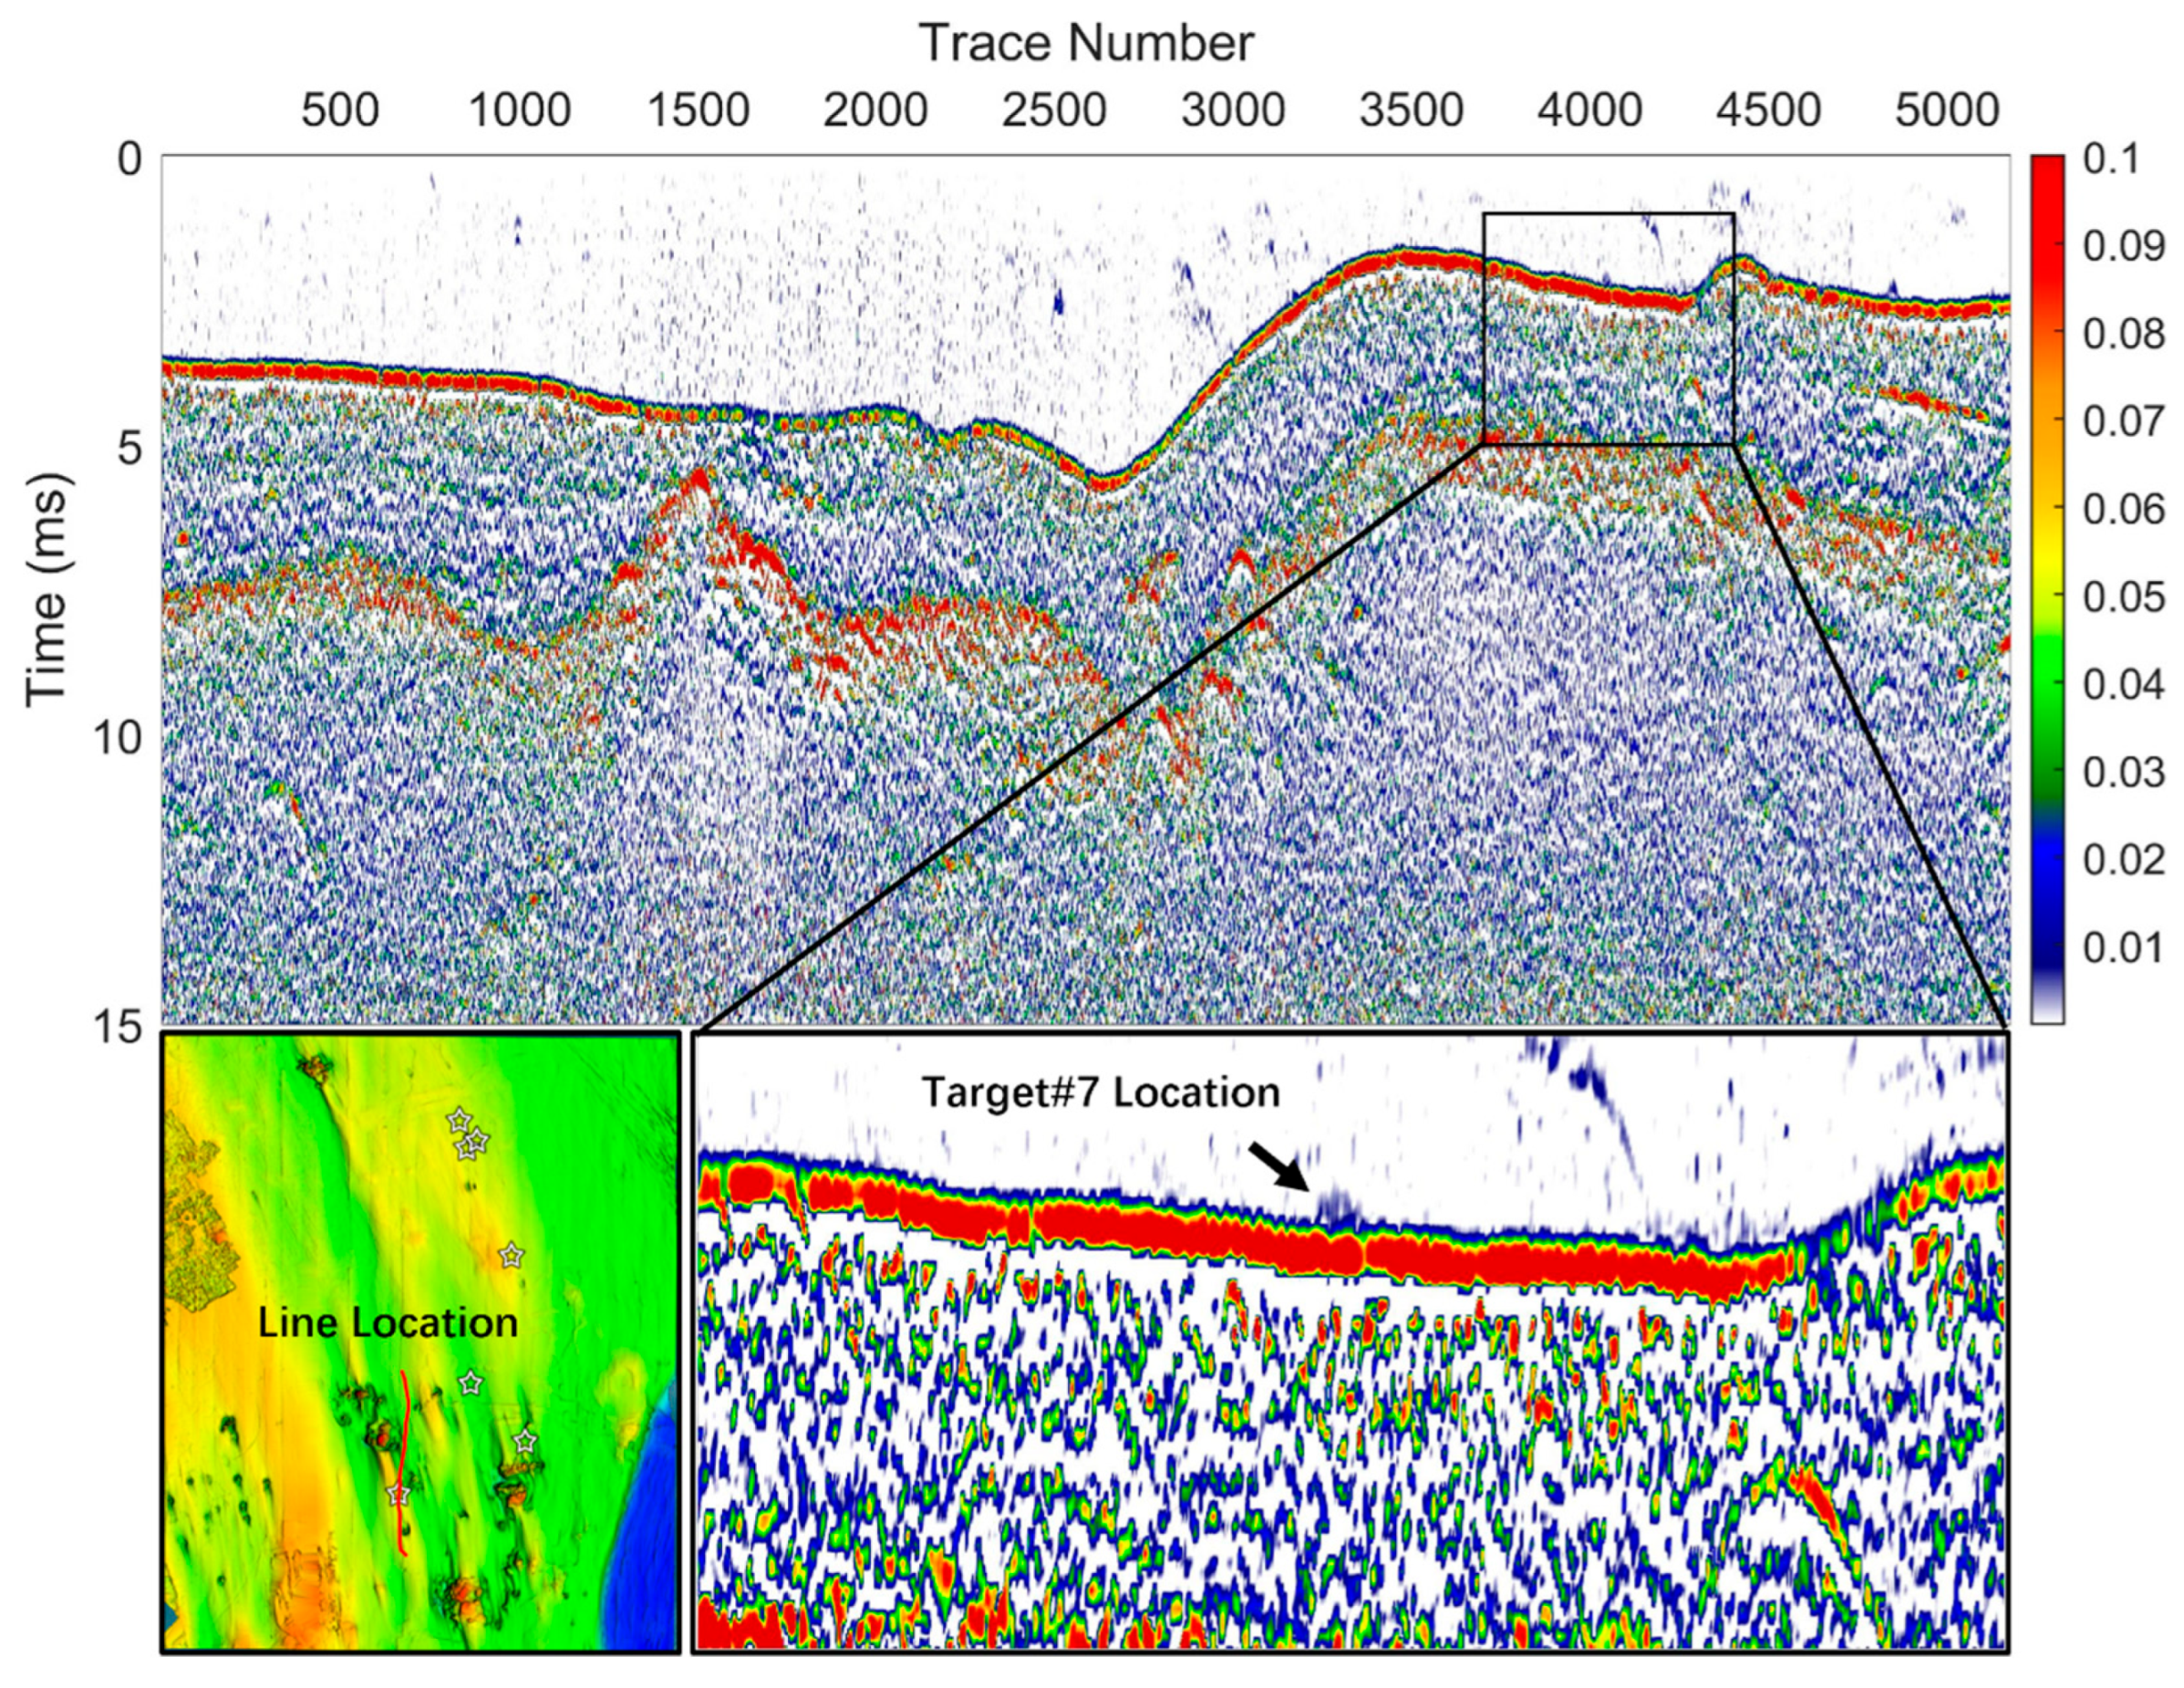
The parametric array SBP exhibits notable beam focusing capabilities, resulting in a defined beam footprint. In the model detection experiment conducted, the SES2000 standard profiler was utilized, which has a nominal beam width @ −3dB of ±2°, yielding a beam footprint size of less than 7% of the water depth. In the experimental area, where the water depth is less than 10 m, this translates to a beam footprint of less than 70 cm. This characteristic is advantageous for detecting pipeline targets; however, for discontinuous targets such as isolated ceramic containers, if the transducer does not pass directly above the target, it cannot capture effective reflection characteristics of the target. This presents a technical challenge that must be addressed when using SBP for detecting small targets, especially buried isolated targets. Future studies should incorporate buried ceramic targets to assess the SBP’s ability to detect relics under varying sediment conditions, as hypothesized in
Section 3.3. In fact, in the absence of prior information, it is difficult to identify whether the anomalous reflection is a target from the results of SBP.
It is important to note that once a vessel or artifact sinks to the seabed, new marine environmental conditions initiate various physical, chemical, and biological processes. These include the filling of pores with moisture, corrosion, the growth of mold and algae, calcium deposition, sediment erosion, and hydrolysis. Such processes not only contribute to the corrosion and degradation of artifacts but also alter their coupling with the surrounding environment, potentially affecting their acoustic properties and other characteristics. Smooth ceramic surfaces, which have a roughness significantly smaller than the wavelength of sound waves, produce specular reflections, resulting in high echo intensity. In contrast, rough surfaces lead to scattering, which reduces echo intensity. Consequently, when the surface of a ceramic object is colonized by shellfish, it will result in a decrease in echo intensity, thereby increasing the difficulty of detection.
At present, underwater archeology in China is mainly concentrated in shallow sea areas. For acoustic surveys, in addition to the applicability of the method itself, it is also necessary to take into account the complex natural environment of the seabed and human-induced influencing factors. Different from the theoretical resolution of acoustic detection methods, conducting field experiments by deploying models in actual marine environments is significant for several reasons: (1) By deploying simulated artifacts made from various materials (such as iron, wood, and ceramics) and of different sizes (ranging from 0.1 to 5 m), we can quantitatively assess the detection limits of equipment such as SSSs and MBESs. (2) Model experiments can simulate scenarios such as shipwrecks and ancient cities, thereby reducing the operational risks for divers in unknown areas. (3) The results of field detection experiments reveal the limitations of multi-beam sonar in identifying targets smaller than 0.5 m, highlighting the need for the development and popularization of high-resolution sonar technology. Comprehensive data analysis indicates that integrating geology (substrate analysis), oceanography (hydrological modeling), and archeology (artifact characteristics) to construct a comprehensive detection system is a crucial direction for future development.
A limitation of this study is that only ceramic models were deployed in the experimental marine area. The equipment used was relatively simple and not the most advanced available globally; however, all devices employed are common commercial equipment. Our primary objective was to investigate whether these conventional methods could be effective in scenarios where suspected small targets are present underwater, but their specific locations are unknown. We have provided the locations of certain identified models in
Table A1 in
Appendix A, which interested teams can reference for related experiments. It is important to note that there are additional model targets in the marine area whose locations have not been disclosed, as they could not be identified due to the limitations of the equipment’s resolution in our experimental results. Future studies should utilize more advanced equipment to conduct further experiments.
