Article

Revisiting the Acoustics of St Paul’s Cathedral, London

Audio Lab, School of Physics, Engineering and Technology, University of York, York YO10 5DD, UK
*
Author to whom correspondence should be addressed.
Acoustics 2025, 7(3), 49; https://doi.org/10.3390/acoustics7030049
Submission received: 23 May 2025 / Revised: 19 July 2025 / Accepted: 7 August 2025 / Published: 13 August 2025
(This article belongs to the Special Issue The Past Has Ears: Archaeoacoustics and Acoustic Heritage)

Abstract

The acoustics of St Paul’s Cathedral, London, have been discussed in previous studies as a space of historical, cultural, societal, and architectural interest in the capital city of the United Kingdom. This paper presents the results from recent acoustic measurements carried out within the space, making use of state-of-the-art measurement techniques and equipment. The results from these measurements provide a new perspective on the acoustic properties of different and distinct spaces within the cathedral, including coupling effects between the main areas, and the whispering gallery effect that can be heard around the walkway at the base of the dome. The discussion includes the analysis of room acoustic parameters included in the international standards and speech intelligibility parameters, and an indirect comparison between the techniques used here and those used in previous studies of this space.

1. Introduction

St Paul’s Cathedral, London, holds a dominant position in terms of its historical, societal, and architectural importance within much of the UK. This elevated position reflects the “power” of this building among the many much more recent and modern skyscrapers in the British capital, as well as its influence in the eyes of the observer through its size and extensive architectural features and details. The cathedral is used for important religious ceremonies as well as State and Royal occasions, including sermons from famous world leaders, such as the visit from Martin Luther King (in 1964) with a congregation of 4000 listening to his speech.
It is located on the top of Ludgate Hill, in the City of London, replacing the old cathedral church of St Paul the Apostle which was demolished after the Great Fire of London in 1666. Sir Christopher Wren and his colleagues worked on the rebuilding St Paul’s Cathedral. The drawings were in place when work on the foundations started in 1675 and Wren continued to revise the design, phase-by-phase, during the construction until completion in 1710 [1]. It follows the Baroque architecture style, incorporating complex forms and ornamentation, such as vaulted ceilings, side chapels, curved mouldings, columns, and capitals, decorated with, for example, garlands, sculpted figures, and twisting elements.
Its volume is 152,000 m3 including the dome [2] and its construction is mostly stone with a marble floor. This results in very long reverberation times, as much as 11 s at low frequencies, despite its diffused ornamentation, wooden choir stalls and organ case. While this offers a unique experience for music performances, a sound reinforcement system is required to improve speech intelligibility for congregations and audiences across the main floor.
St Paul’s Cathedral is well-known for its Whispering Gallery [3] which is located across the interior dome at 30 m height from the floor of the cathedral. Due to the gallery forming a complete, smooth, circular shape, reflections travel around the gallery, which makes any sound or “whisper” close to the walls of the gallery easily audible in all parts of the gallery with little attenuation [4]. According to Sabine [3], “by the term whispering gallery is usually understood a room, either artificial or natural, so shaped that faint sounds can be heard across extraordinary distances”.
The dome in St Paul’s consists of three parts: the interior dome which is made of painted brick, the middle-inner cone of brick, and the wooden outer dome covered with lead on the exterior. The interior dome and the inner cone are connected by a circular neck, as shown in the 3D virtual model in Figure 1 by Zhang [5], based on [6].
This paper discusses the acoustic measurements carried out over the decades within this historical site and also presents the results from new acoustic measurements carried out within St Paul’s Cathedral in 2022 by the authors. The initial purpose of these latest measurements was to record impulse responses at requested locations suitable for auralisation to be later used as part of a music composition by Jones [7], which formed one of 50 showcases or responses to 50 monuments in St Paul’s Cathedral. Given the opportunity to access this historically and acoustically important space, the authors have conducted an analysis of the obtained results which is presented in what follows.
The aim of this paper is to set these new results, conducted and analysed according to contemporary best practice and international standards, within the context of the wider historic acoustic study of St Paul’s, and to compare and contrast what has been observed while also offering new insights into spaces within the cathedral that have not been previously explored in such a way. Although this is not a fully comprehensive spatial acoustic mapping of the whole site, the data obtained does contribute towards its more general preservation and will be made publicly available for any future study or restoration work. It has been previously demonstrated by Tronchin and Farina in their measurement of “La Fenice” opera house in Venice, later damaged by fire, that even a limited set of measurements has value in such contexts [8]. These latest measurements in St Paul’s cathedral, presented in this paper, took place in the nave, the Cathedral floor underneath the dome, the choir, the Whispering Gallery, and, for the first time in any acoustic study, the Library, and the Geometric Staircase.

2. Acoustic Measurement Approaches in Heritage Worship Spaces

Due to the varied cultural, religious, and historical importance of those places involved, several studies have been published discussing the acoustic measurements of heritage worship spaces, such as cathedrals [9,10], churches [11,12], mosques [13,14], basilicas [15,16] and abbeys [17,18].
As the quality of equipment and robustness of measurement approaches have progressed over the years, historical acoustic measurements and their results could differ noticeably from contemporary ones obtained from the same space. In these, changes in atmospheric factors (i.e., humidity and temperature) should also be considered as they could have had an impact on historical measurements, or physical alterations in these spaces, such as architectural renovations, damage of materials, or variations in decoration. A recent example is the Cathédrale Notre-Dame de Paris in [9], where analysis of obtained reverberation times show differences between measurements carried out in 1987 and 2015.
There are several studies aiming to provide guidelines for acoustic measurements in churches, based, for instance, on their era, architectural style or volume, and acoustic results exist for a great number of churches worldwide [19,20,21,22]. Due to the complexity of all the factors that can have an impact on the acoustic behaviour of these spaces, however, their analysis cannot be generalised to any great extent, as has also been shown by a recent study on a comparative analysis of 83 European Churches and the impact of architecture styles on acoustics [23]. This is also the case with St Paul’s Cathedral. While general results can be expected, such as a long reverberation time due to the large volume, and highly reflective surfaces, together with coupling effects due to the side vaults of the space [24], more detailed consideration is needed to better understand the acoustic behaviour in any building of this type. In fact, it would be foolish to attempt to characterise the acoustics of a space such as St Paul’s through any one measurement or metric, given that the whole structure is a complex and connected series of spaces and places with a multiplicity of purpose (from hospitality through to administration and worship), and developed and adapted over a long period of time.

3. Historical “Catacoustics” in St Paul’s Cathedral

There are only very limited references and documented work on problems and behaviours relating to the acoustics of spaces with a more direct heritage interest (as opposed to those with a specific focus on speech or music) until the field of Architectural Acoustics became a more established discipline. In fact, before Sabine’s work, the study of reflected sounds and echoes in space was referred to as Catacoustics and it can be now reflect upon the fact that, often, the explanations on the subject were not in line with modern scientific understanding [25].
By way of interest, although beyond the scope of this current article, a contemporary approach has been taken in the study of the acoustics of the old St Paul’s Cathedral, pre-dating the current structure, as it would have been before the Great Fire of London in 1666. The Virtual St Paul’s Cathedral Project [26], developed historically informed 3D virtual models of the pre-fire cathedral and its surrounding vicinity, as well as creating auralisations obtained from acoustic simulations of the cathedral interior. However, what follows focuses on the Wren-designed, post-fire St Paul’s, and despite there being considerable wider interest in its acoustic characteristics, there are limited publications that specifically discuss the acoustic measurement process and analytical observations of these results.
The first, and what might be considered more scientific, reference to the acoustic effect of the particular Whispering Gallery in St Paul’s was in a discussion by architects relating to the rebuilding of the House of Commons in 1833 [27], that was also destroyed by fire. Their explanations, however, were not in line with modern acoustic knowledge. The mathematician and astronomer Sir John Herschel in the first half of the 19th century also referred to the whispering gallery effect, stating that, “the faintest sound is faithfully conveyed from one side to the other of the dome, but is not heard at any intermediate point” [3]. Later in 1871 Sir George Airy, also a mathematician and astronomer, explained that this effect was due to focusing reflections from the dome [28].
It was the physicist Lord Rayleigh, who in 1878, more accurately described the phenomenon following acoustic experiments he had carried out with laboratory models. He stated that, “the abnormal loudness with which a whisper is heard is not confined to the position diametrically opposite to that occupied by the whisperer, and therefore, it would appear, does not depend materially upon the symmetry of the dome. The whisper seems to creep around the gallery horizontally, not necessarily along the shorter arc, but rather along that arc toward which the whisperer faces” [3].
In 1921, Raman and Sutherland [29] tested Rayleigh’s theory in the Whispering Gallery of St Paul’s, observing intensity variations during their experiments. The interference of the waves was at some points seen to be constructive and at others deconstructive, yielding near-silence. Their interpretation was that the “stationary interferences of waves meet after passing in opposite directions round the gallery”.
In 1922, Sabine [3] dedicated a paper to whispering galleries, including the one in St Paul’s. Sabine explains this in his own words: “The intensification of the sound is due to its accumulation when turned on itself by the restraining wall. It is obvious that the main intensification arises from the curved wall returning on itself”.

3.1. Measurements in 1952

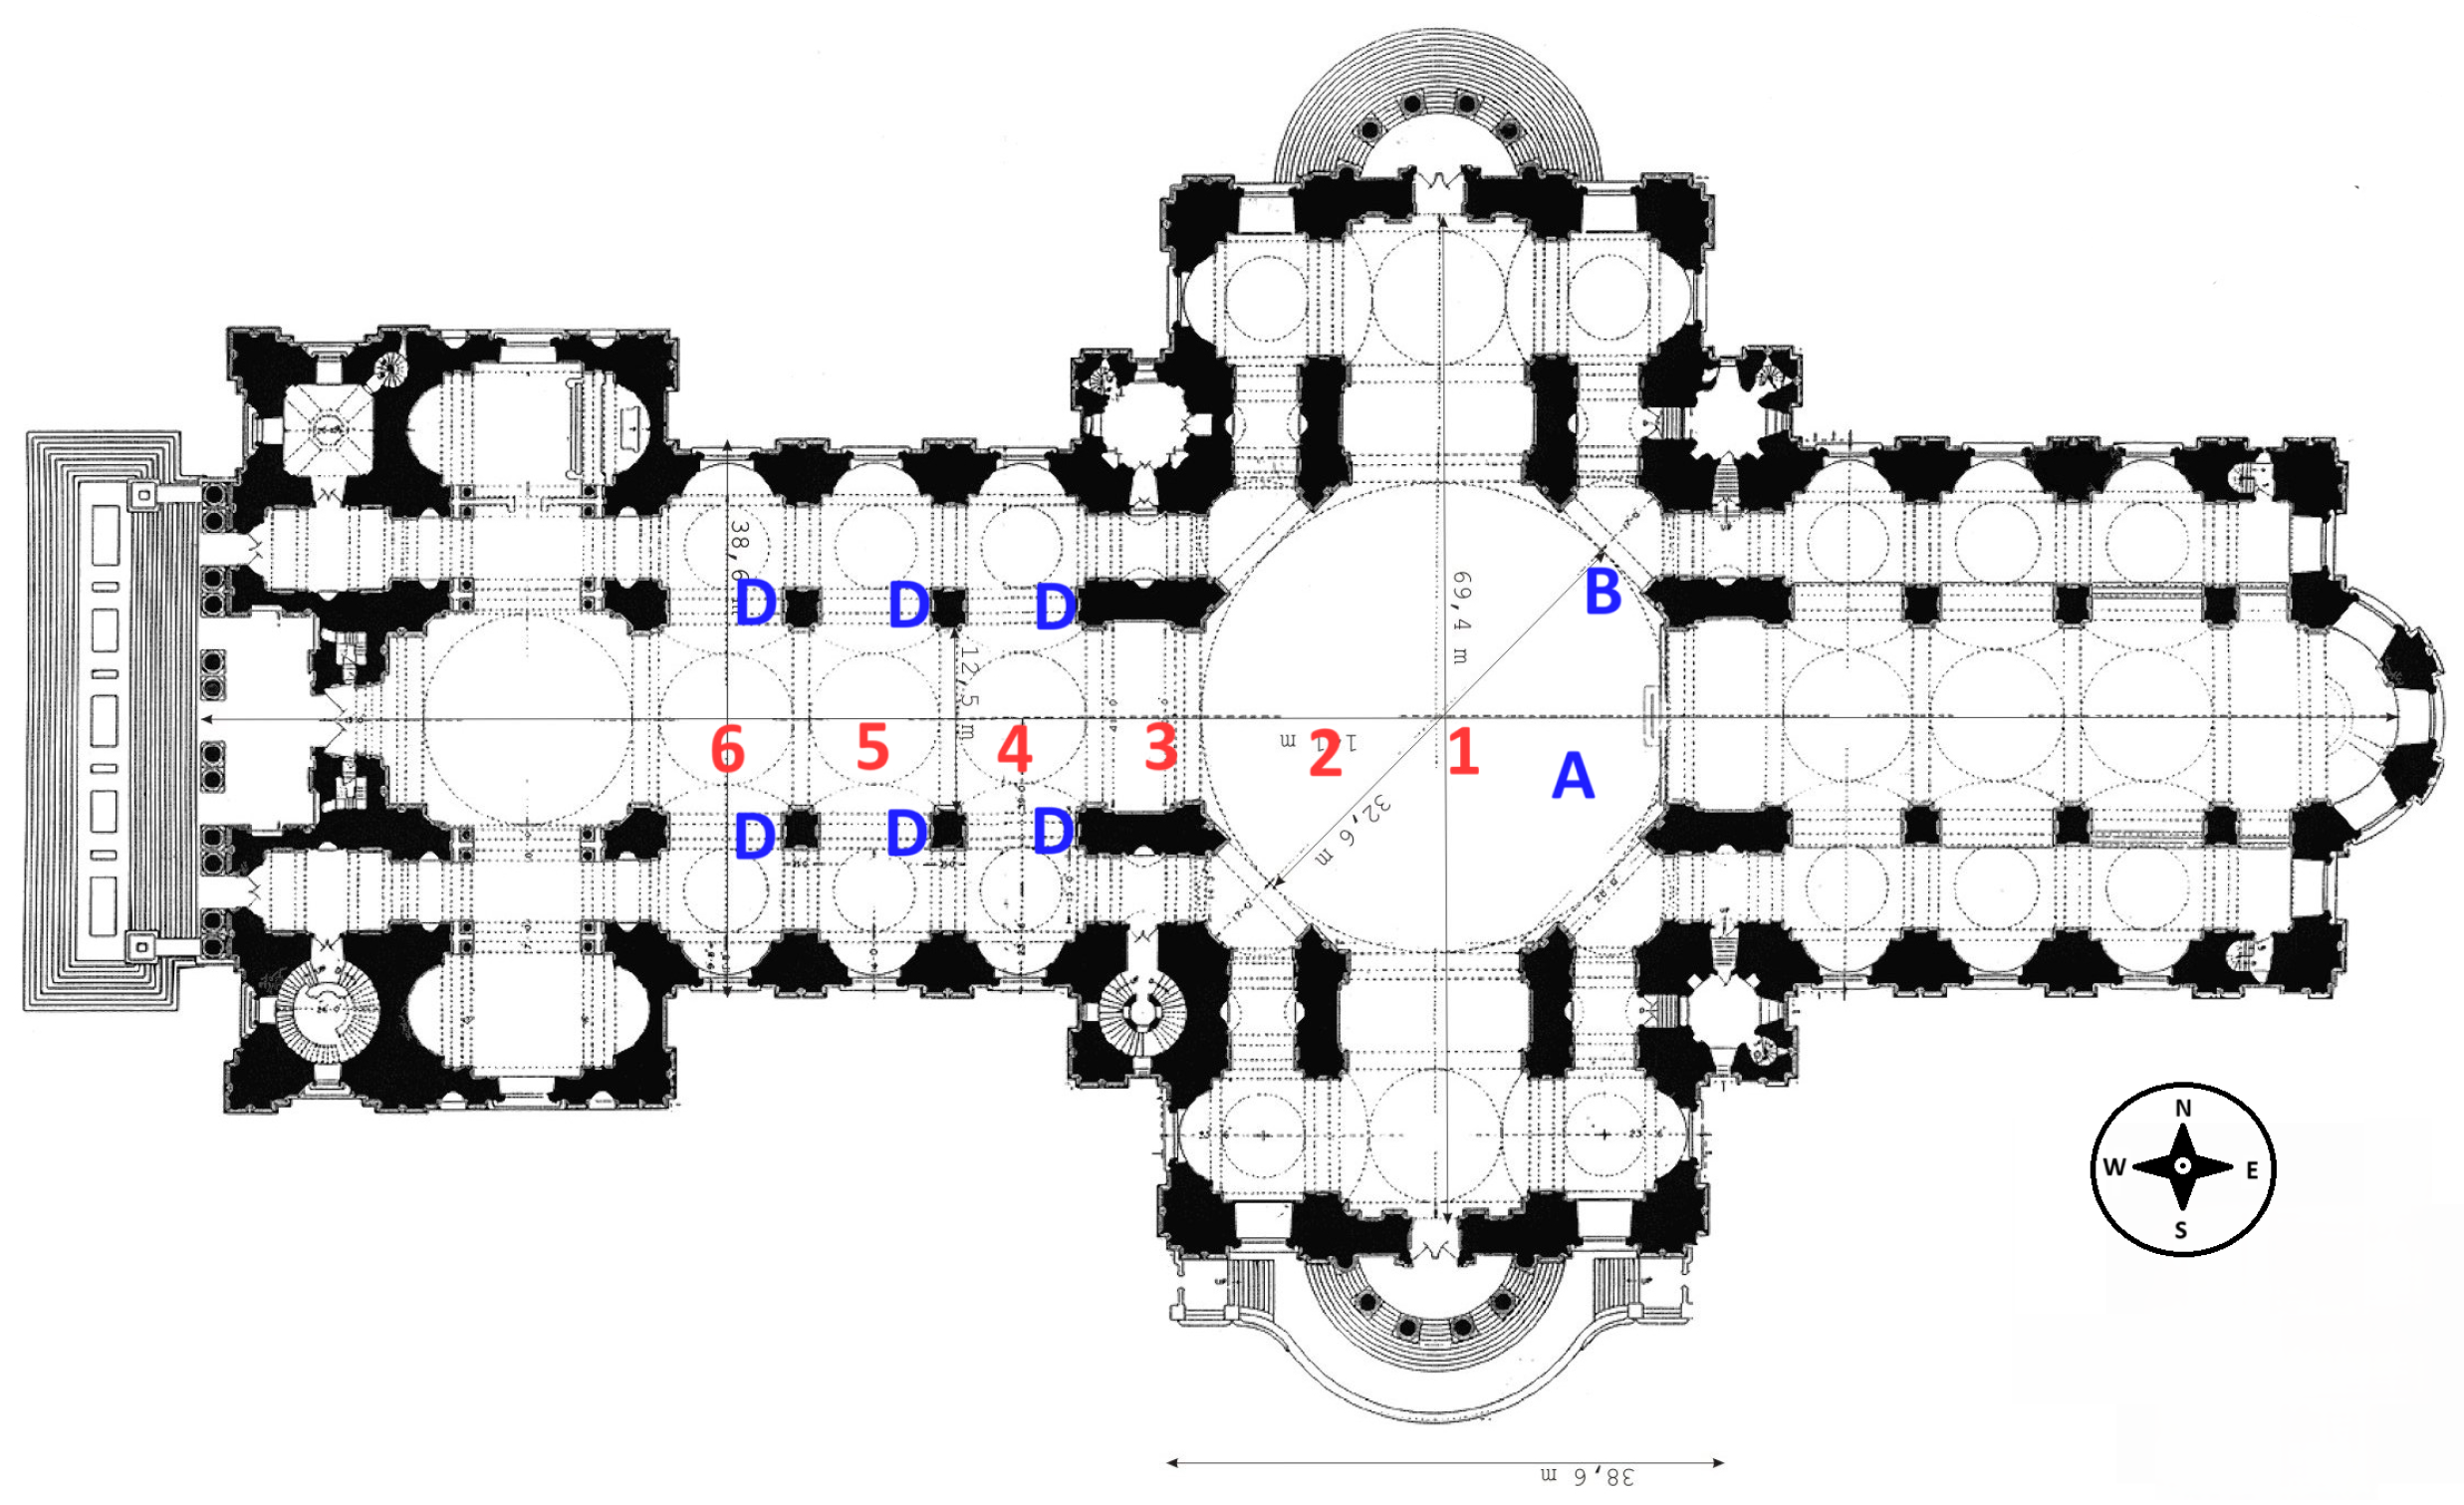
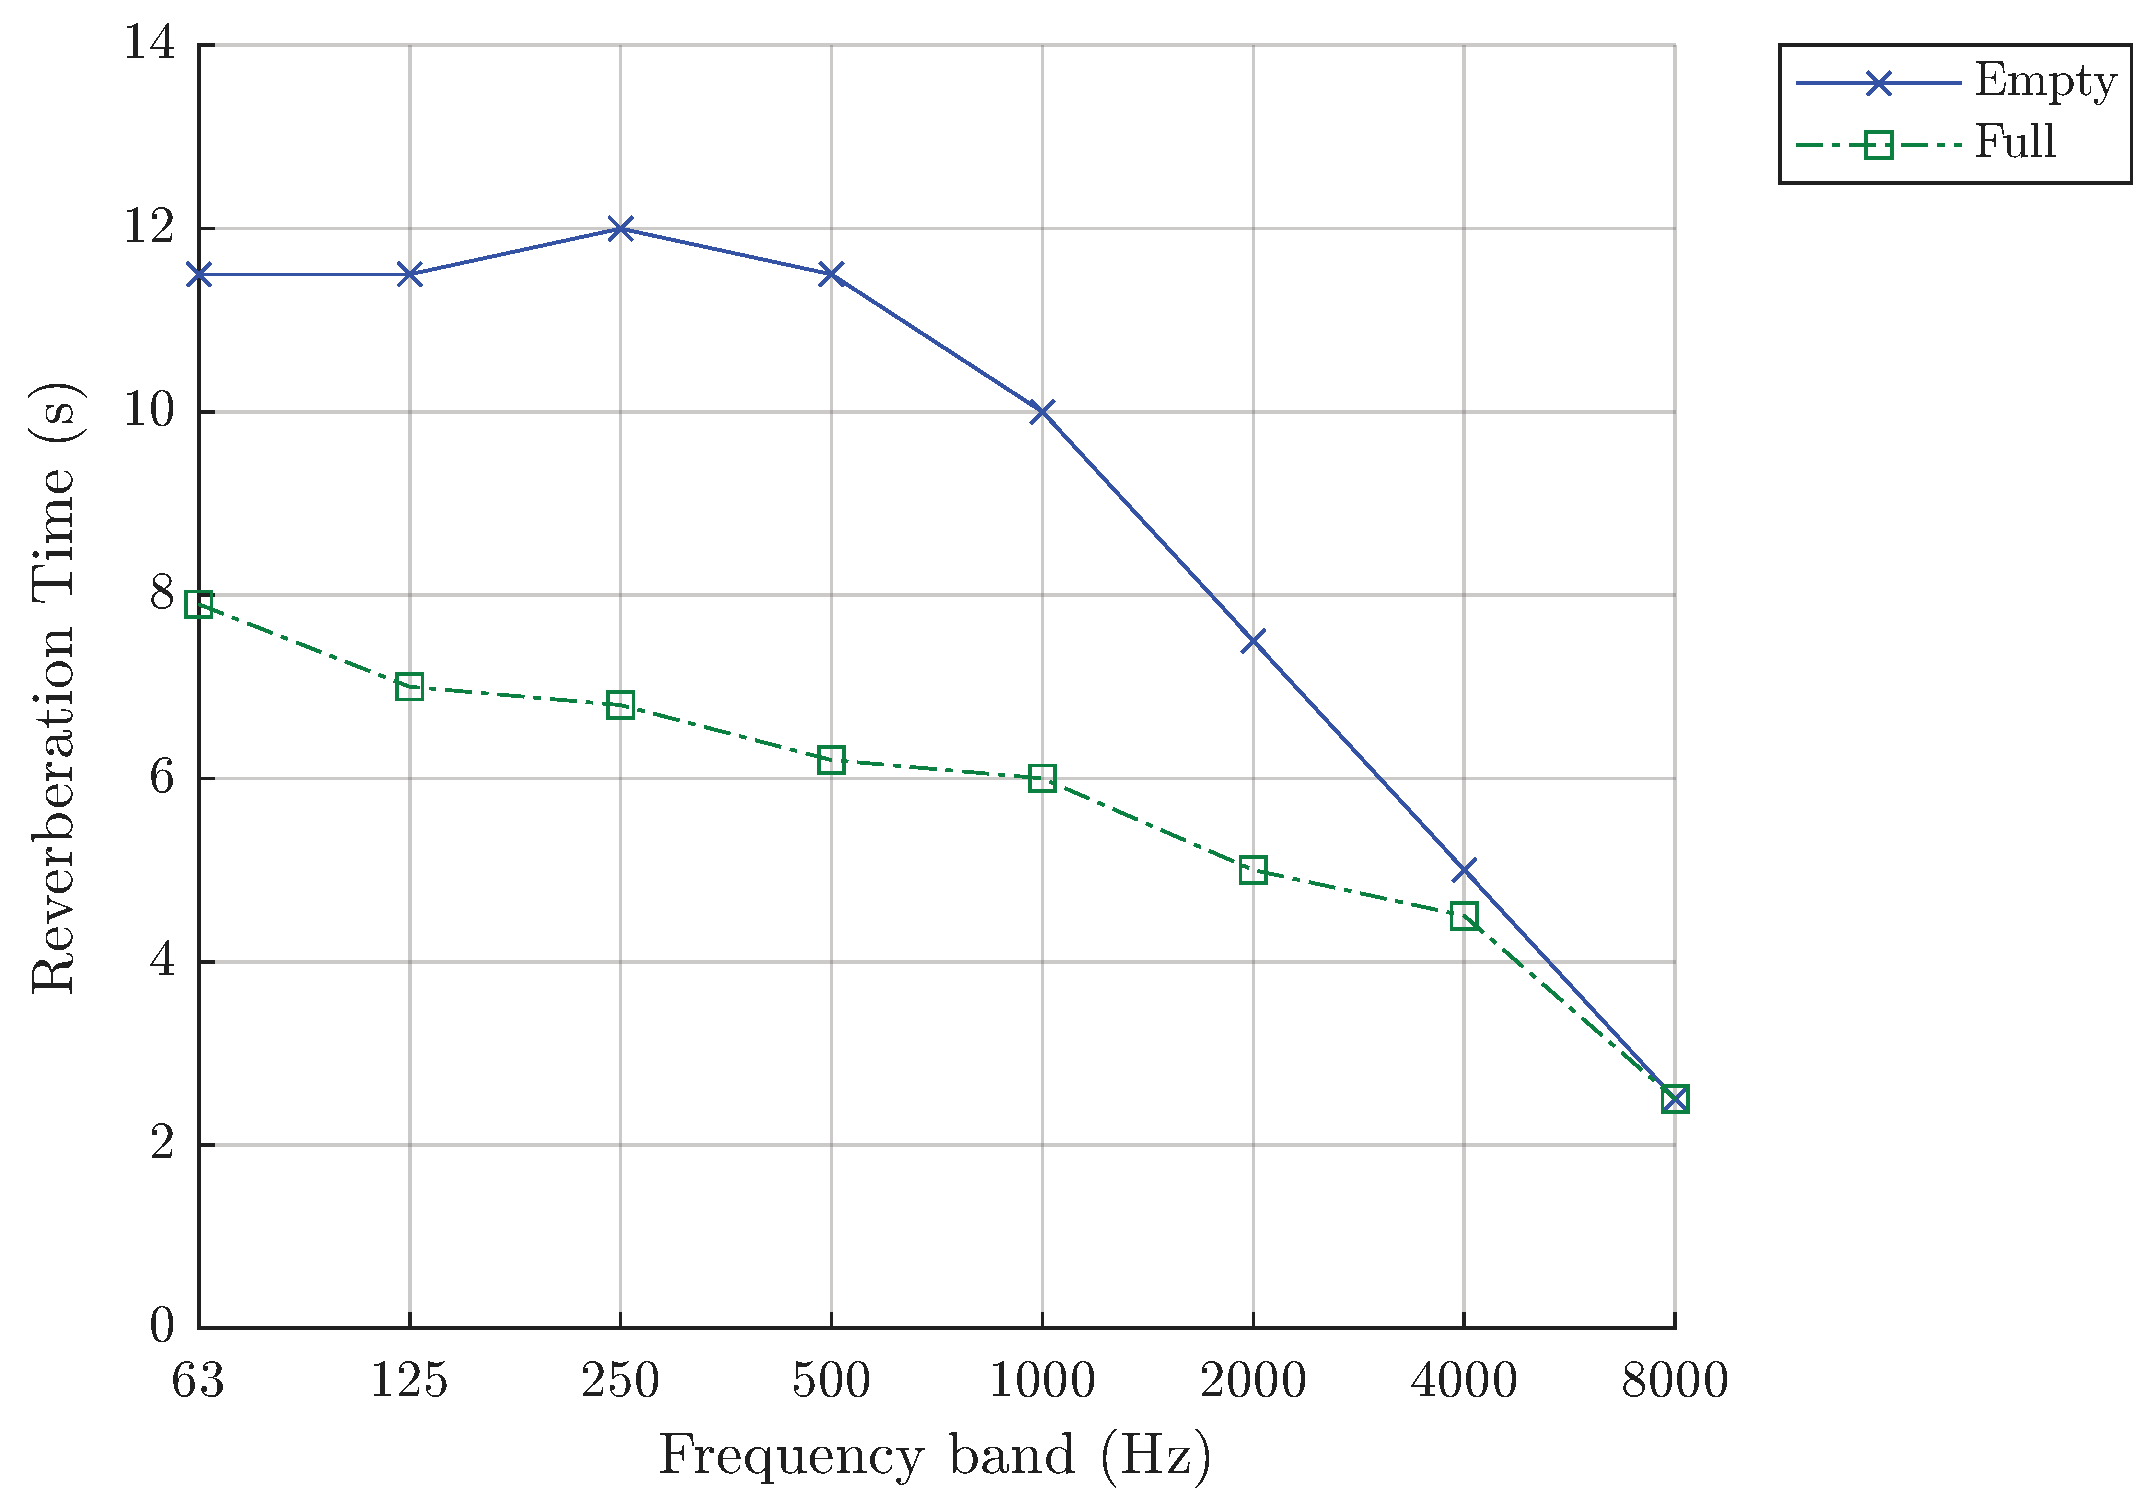
Parkin and Taylor [30,31] focused on the description of an experimental reinforcement system in St Paul’s Cathedral that was recommended to improve speech intelligibility and quality (referred to as naturalness), system which was replaced in 1981 [2]. For the measurements towards the design of this system, the used sound source was a vertical line-source loudspeaker (a directional loudspeaker array where directivity or focus increases with frequency as used typically for speech) at two positions; the pulpit and the lectern (indicated as A and B, respectively, in Figure 2), both facing the congregation when they are seated. For the measurements, the used excitation signal was with a more restricted frequency range that what might be used currently, ranging from 250 Hz to 4 kHz. Reverberation time measurements for the full and empty cathedral, as obtained from these measurements, are reproduced in Figure 3; however, no additional details on the measurement positions, number of people present, equipment specifications, or methodology are discussed.
Parkin and Taylor [30,31] also carried out tests on speech intelligibility. Six listening positions were used, with the first placed approximately centrally under the dome, with subsequent positions spaced (approximately again) by 9.9 m (30 ft) down the nave. These are represented by the numerical positions 1–6 in Figure 2. For the source, the pulpit loudspeaker array (position source A in Figure 2) and the six nave loudspeaker arrays (indicated as D in Figure 2) were used. The results of these tests are presented in Table 1, and there were used to inform the design of the speech reinforcement system by comparing results without or with the delay in operation.

3.2. Measurements in 1984

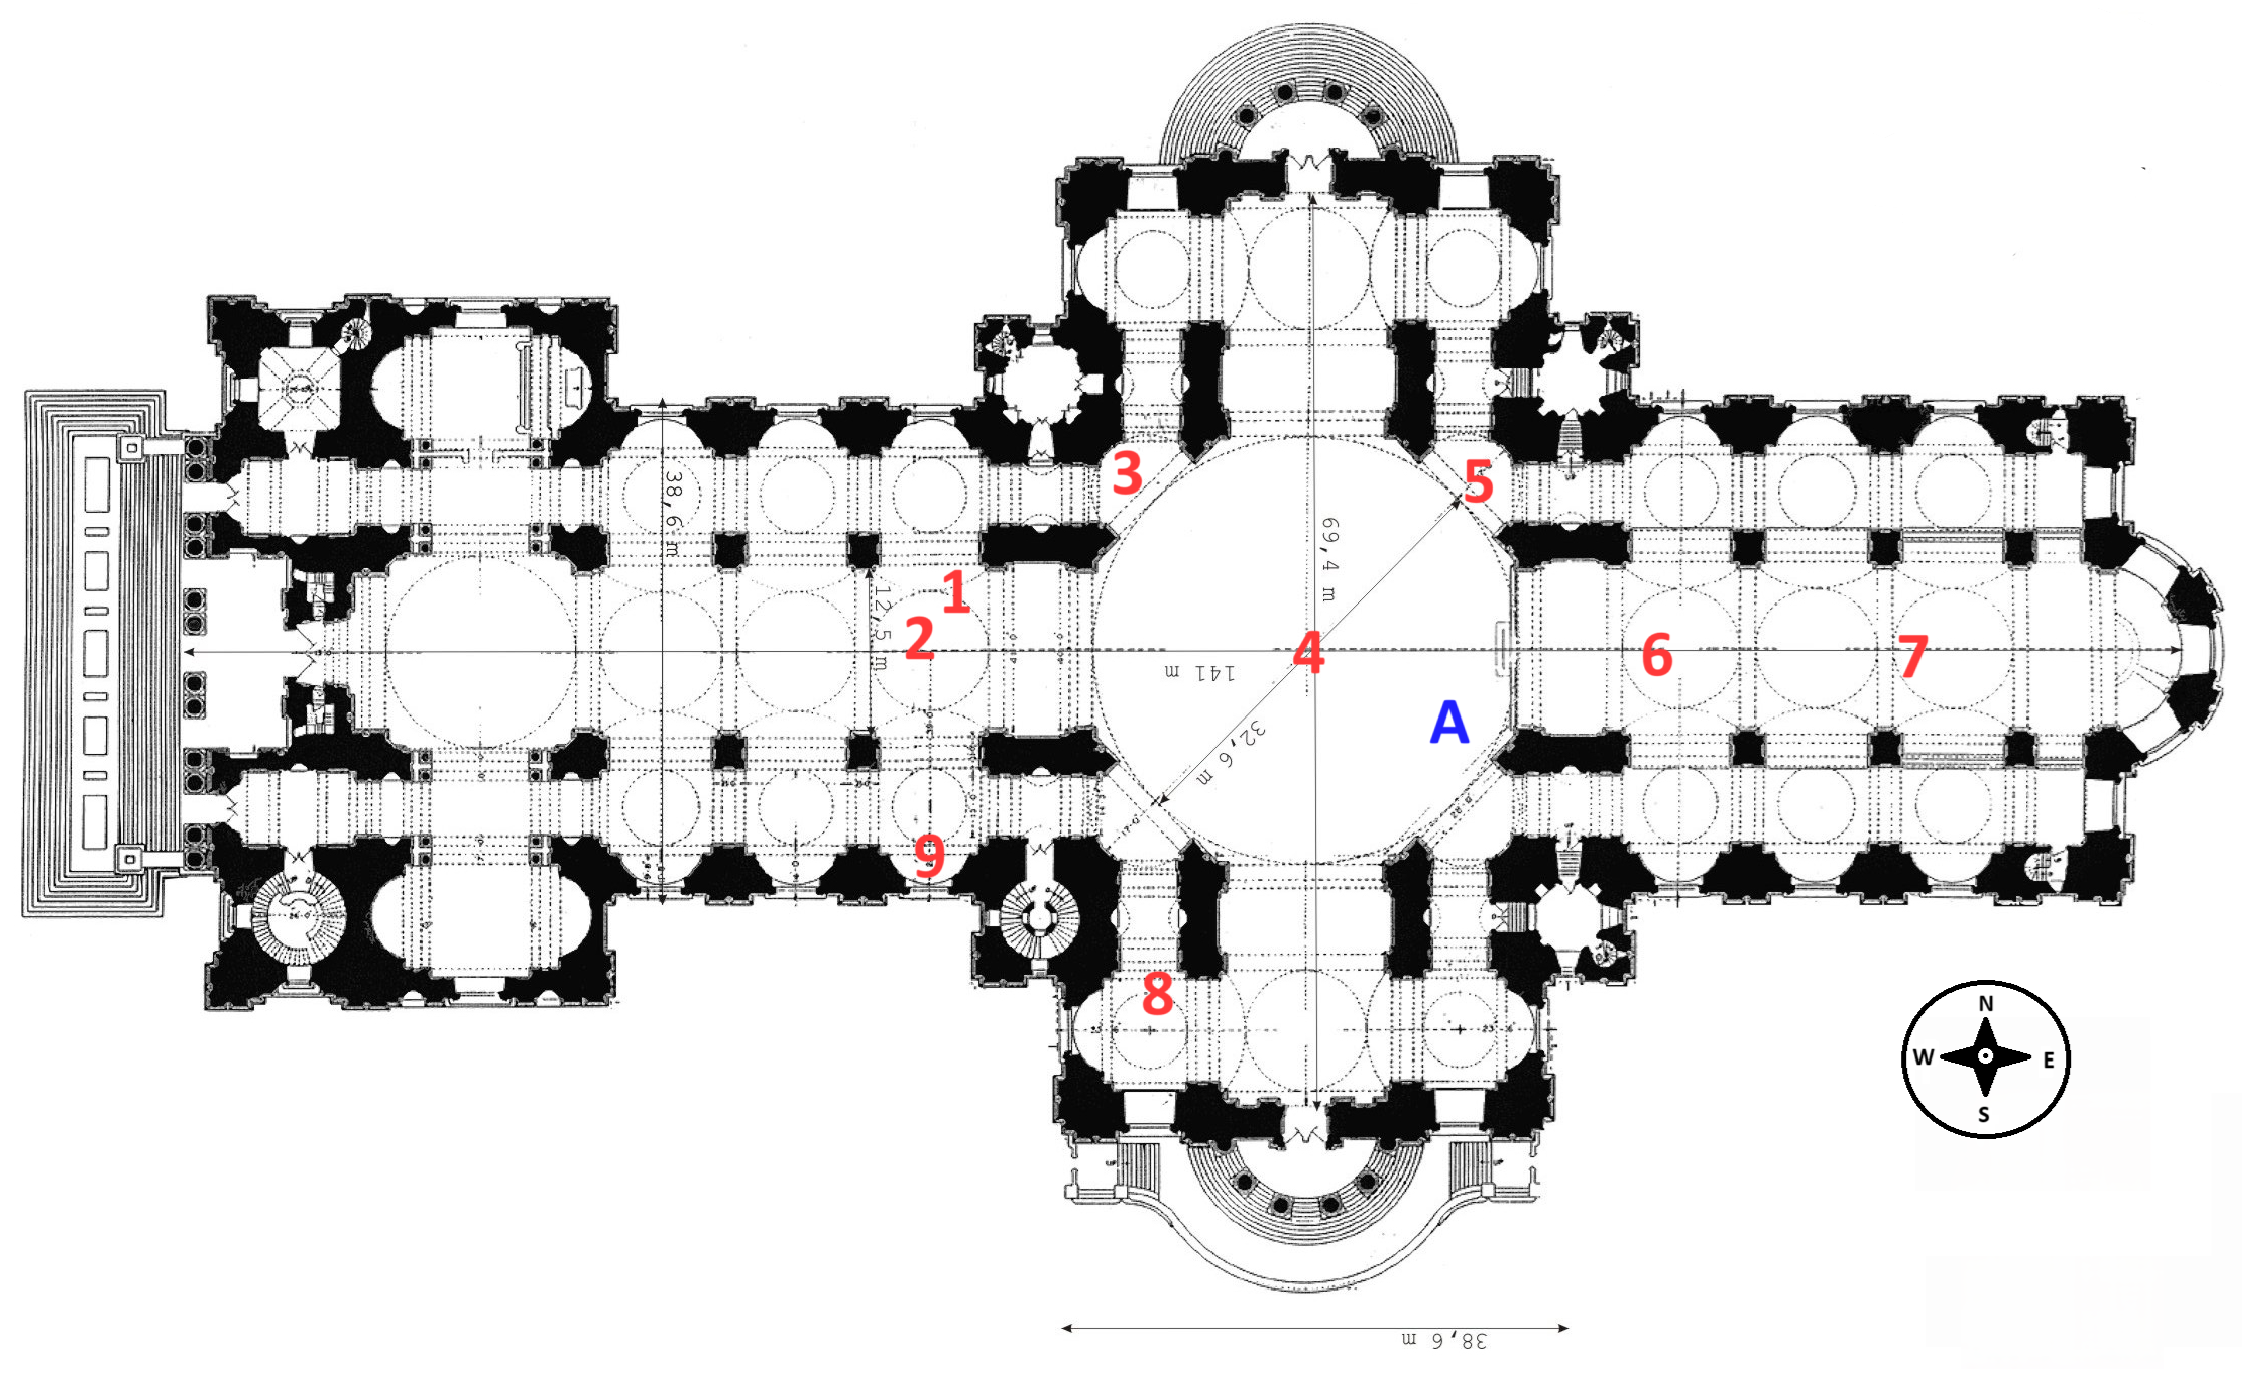
Following the reverberation time measurements by Parkin and Taylor [30], in 1984 Lewers and Anderson [2] carried out measurements at several positions in the cathedral using three methods. The measurements were carried out during the winter period, and as estimated by Lewers and Anderson [2] from exterior values and measurements, the relative humidity would have been around 60% (±5%) and the temperature 17 °C. For the first method, two twelve inch loudspeakers mounted in a chipboard enclosure were used as the sound source and placed underneath the canopy of the pulpit (marked as A in Figure 4). A third-octave band-limited noise generator was used as the excitation signal and delivered to the loudspeakers via a power amplifier with the sound source switched off after each noise generation. The microphone was placed at a height of 1.2 m above the floor across 9 positions on the cathedral floor as shown in Figure 4.
There are a few points worth noting about the results obtained from this method. Firstly, differences observed in the reverberation time values between the results obtained with this method and Parkin and Taylor’s results [30] are reasonable considering the different measurement locations and equipment used. Additionally, different chairs were in place within the nave and a large wooden panel was installed across the north transept in the earlier measurements to hide damage obtained during the Second World War. Another observation by Lewers and Anderson was the non-linear decay at the measurement position at the choir (Position 6 in Figure 4). They also tested results for two locations with source and microphone interchanged, noting that there were no significant differences in the measured reverberation time values.
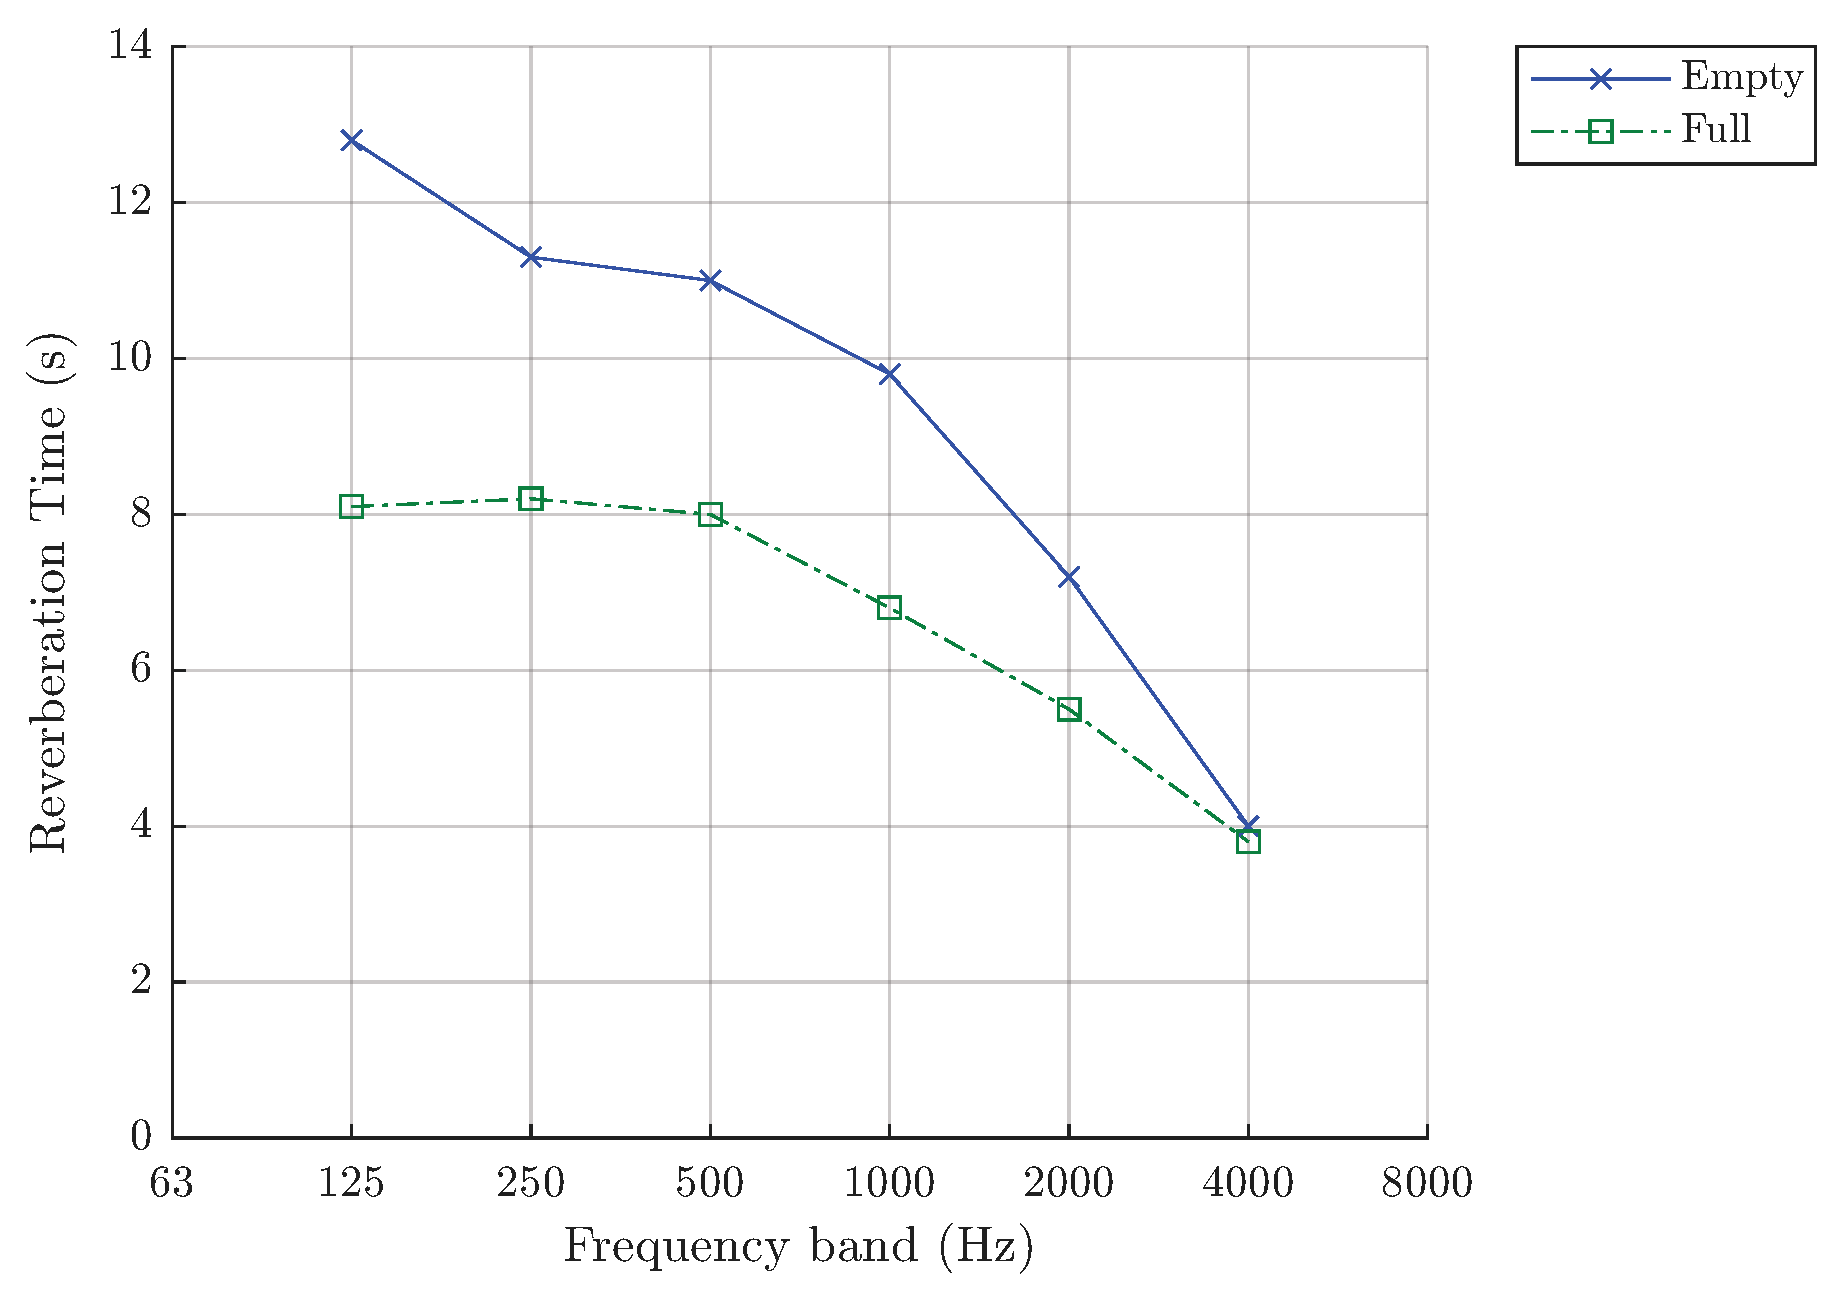
The second method used was based on the same principles, but with the space empty and then occupied by 1800 people, using a more omnidirectional sound source, and only one measurement obtained at Position 4 for both cases, with results obtained in octave bands via a computer. Reverberation time results for the full and empty cathedral based on this method are reproduced in Figure 5.
The first two methods followed the recommendation of ISO-3382 (1975) [33], with a third method using the then newly adopted integrated impulse response approach as introduced by Schroeder [34]. The method was considered more accurate and less time-consuming than previous methods as one single measurement was sufficient rather than having to average results over several measurement decays. This method also offered more detailed information for the early decay time, which was obtained from measurement position Source A and Microphone position 4 (as shown in Figure 4). It was noted that at 2 kHz there was a significant difference between the early decay time, with a value of 4.8 s compared to the later decay (that is, the usual measurement of reverberation time) of 6.1 s.
In order to check speech intelligibility, an articulation test was performed by using a series of phonetically balanced (PB) monosyllables words (as recommended by Beranek [35]) projected by two loudspeakers one in the pulpit and one at the lectern (positions A and B, respectively, in Figure 2). The 30 participants for this test were located at the same positions as in Parkin and Taylor’s tests [30] (positions 1–6 in Figure 2). The tests were carried out twice for each location without and with the speech delay reinforcement system in operation. The subjective results of the PB-word score were expressed as a percentage loss of words at positions 1–6. For the purpose of this study, in Table 2, these values have been converted to objective results based on the relationship between the objective STI and PB-word score presented by Anderson and Jacobsen [36] as part of their extended work in St Paul’s Cathedral in 1985 (as discussed in the following section) and according to the IEC 60268-16 [37] intelligibility rating.
Additional tests by Lewers and Anderson included the sound pressure level distribution across the nave and under the dome, observing a slight amplification due to the concave surfaces of the dome. The team also measured a small sample of limestone, which is the main building material used in the structure, with a standing wave impedance tube. An absorption coefficient of 0.03 at frequencies below 2 kHz was observed, with no further details on the higher frequencies or the measurement method given.

3.3. Measurements in 1985

Anderson and Jacobsen [36] followed up on the speech intelligibility tests carried out in [2] (noting that one of these authors had been a member of the previous team). A newly introduced method of obtaining results via objective measurements was used, rather than carrying out subjective listening tests in situ. The method was much quicker, using an acoustic test signal with a frequency range suitable for speech. Source and receivers (both now electronic equipment) were placed at the same measurement positions as in Parkins [30,31] and Lewers [2] studies (shown in Figure 2). The results were obtained by using the parameter RASTI, based on a signal that has been transfer-function modulated across frequency bands and that considers speech levels, background noise levels, echoes and reverberation time.
Comparing the results obtained from [2,36], shows that the RASTI method gave slightly lower values than the subjective test for the source located at position A, and considerably lower for the source located at position B. The authors, however, discuss the reasons for these differences: (a) in the subjective method, the speakers projected their voices more clearly and slowly, taking into consideration the long reverberation, (b) the subjective method was based on meaningful words, in comparison to the RASTI method which is based on nonsense words, (c) the RASTI method does not take into account octave bands above 4 kHz, where reverberation time is much lower due to air absorption and has a positive impact on speech intelligibility in St Paul’s.

4. Measurements in 2022

In the summer of 2022, the authors were asked to help with the acoustic measurements of the Cathedral as part of the Pantheons: Sculpture at St Paul’s Cathedral, c.1796–1916 project supported by the Department of History of Art, University of York, UK, and St Paul’s Cathedral itself [38]. Specifically, the impulse responses obtained in situ were to be used as part of the Marble Anthem [7] music composition by Jones. Hence, the initial goal of the measurements was to meet the composer’s requirements in working with the acoustics of various spaces around the site, rather than to obtain a representative acoustic fingerprint of the space. This meant that there was no requirement for multiple combinations of source and receiver locations, but rather there was a focus on specifically requested locations in the nave, the choir, around the altar, and in the side chapels, that would be used as part of the compositional process. There was, however, the opportunity to carry out measurements in additional spaces across the Cathedral, including the Whispering Gallery at the base of the dome, the Library, which is located at the Triforium Level behind the south-west roof of the nave, and the iconic Geometric Staircase at the south-west, climbing up to the Triforium Level, from the crypt to the Library. Current practice in acoustic measurement techniques and the equipment available for such measurement have changed considerably since previous published articles [2,30,31], and the results obtained from this study offer valuable additional information on the acoustic behaviour of aspects of St Paul’s Cathedral and add to this overall body of work.

5. Measurement Process and Results

For the measurements, the exponential sine sweep method as proposed by Farina [39] was used. The sweep frequency range was from 60 Hz to 20,000 Hz over 1 min. During the ground floor measurements the temperature was recorded at between 23.4 and 23.6 °C with humidity between 58 and 59%. In the Whispering Gallery the temperature was recorded as 25.8 °C and humidity at 55%. An RME UC/UCX (RME, Haimhausen, Germany) audio interface was used connected to a Windows laptop running Reaper Digital Audio Workstation software version 7 (Cockos Incorporated, Rosendale, NY, USA).
Although acoustic standards recommend an omnidirectional source for excitation of a space across all directions, this method is not considered ideal for auralisation purposes [40], which was the initial intention of these measurements. Thus, a directional Genelec 8130A (Genelec Oy, Iisalmi, Finland) digital active loudspeaker was used as the sound source at a fixed height of 1.62 m for all measurements. A Soundfield ST340 Mk II microphone (SoundField, Silverwater, Australia) was used as the receiver at a fixed height of 1.40 m. The Ambisonic B-format recordings from the Soundfield microphone consist of four signals corresponding to an omnidirectional W-channel and three figure-of-eight directional channels, X, Y and Z. It is possible then with these signals to analyse monaural as well as spatial acoustic parameters.
Post-processing of the captured sine sweeps was carried out in MATLAB R2021a, and for the analysis of the ISO-3382-1:2009 [41] acoustic parameters, the Aurora tools v.12.2.23-alpha [42] in Audacity 20.0 were used. Note that the authors have not presented results for the 63 Hz octave band due to the frequency response limitations of the loudspeaker that was used potentially making them less reliable. The interested reader may, however, wish to explore these results for themselves via the impulse response data that accompanies this paper (note that the limits of the transducers used are not reported in the other previous studies).
Two consecutive measurements were taken for each location. Both measurements were analysed to check for any potential irregularities and to give the potential for later averaging if there was a need to increase the signal-to-noise ratio. It was verified, however, that the single sweep measurements were sufficient to capture representative results of the acoustic behaviour for each location and were subsequently used in the presentation and analysis of relevant acoustic parameters e.g., T 30 , J L F , STI, etc., in what follows.

5.1. Cathedral Floor

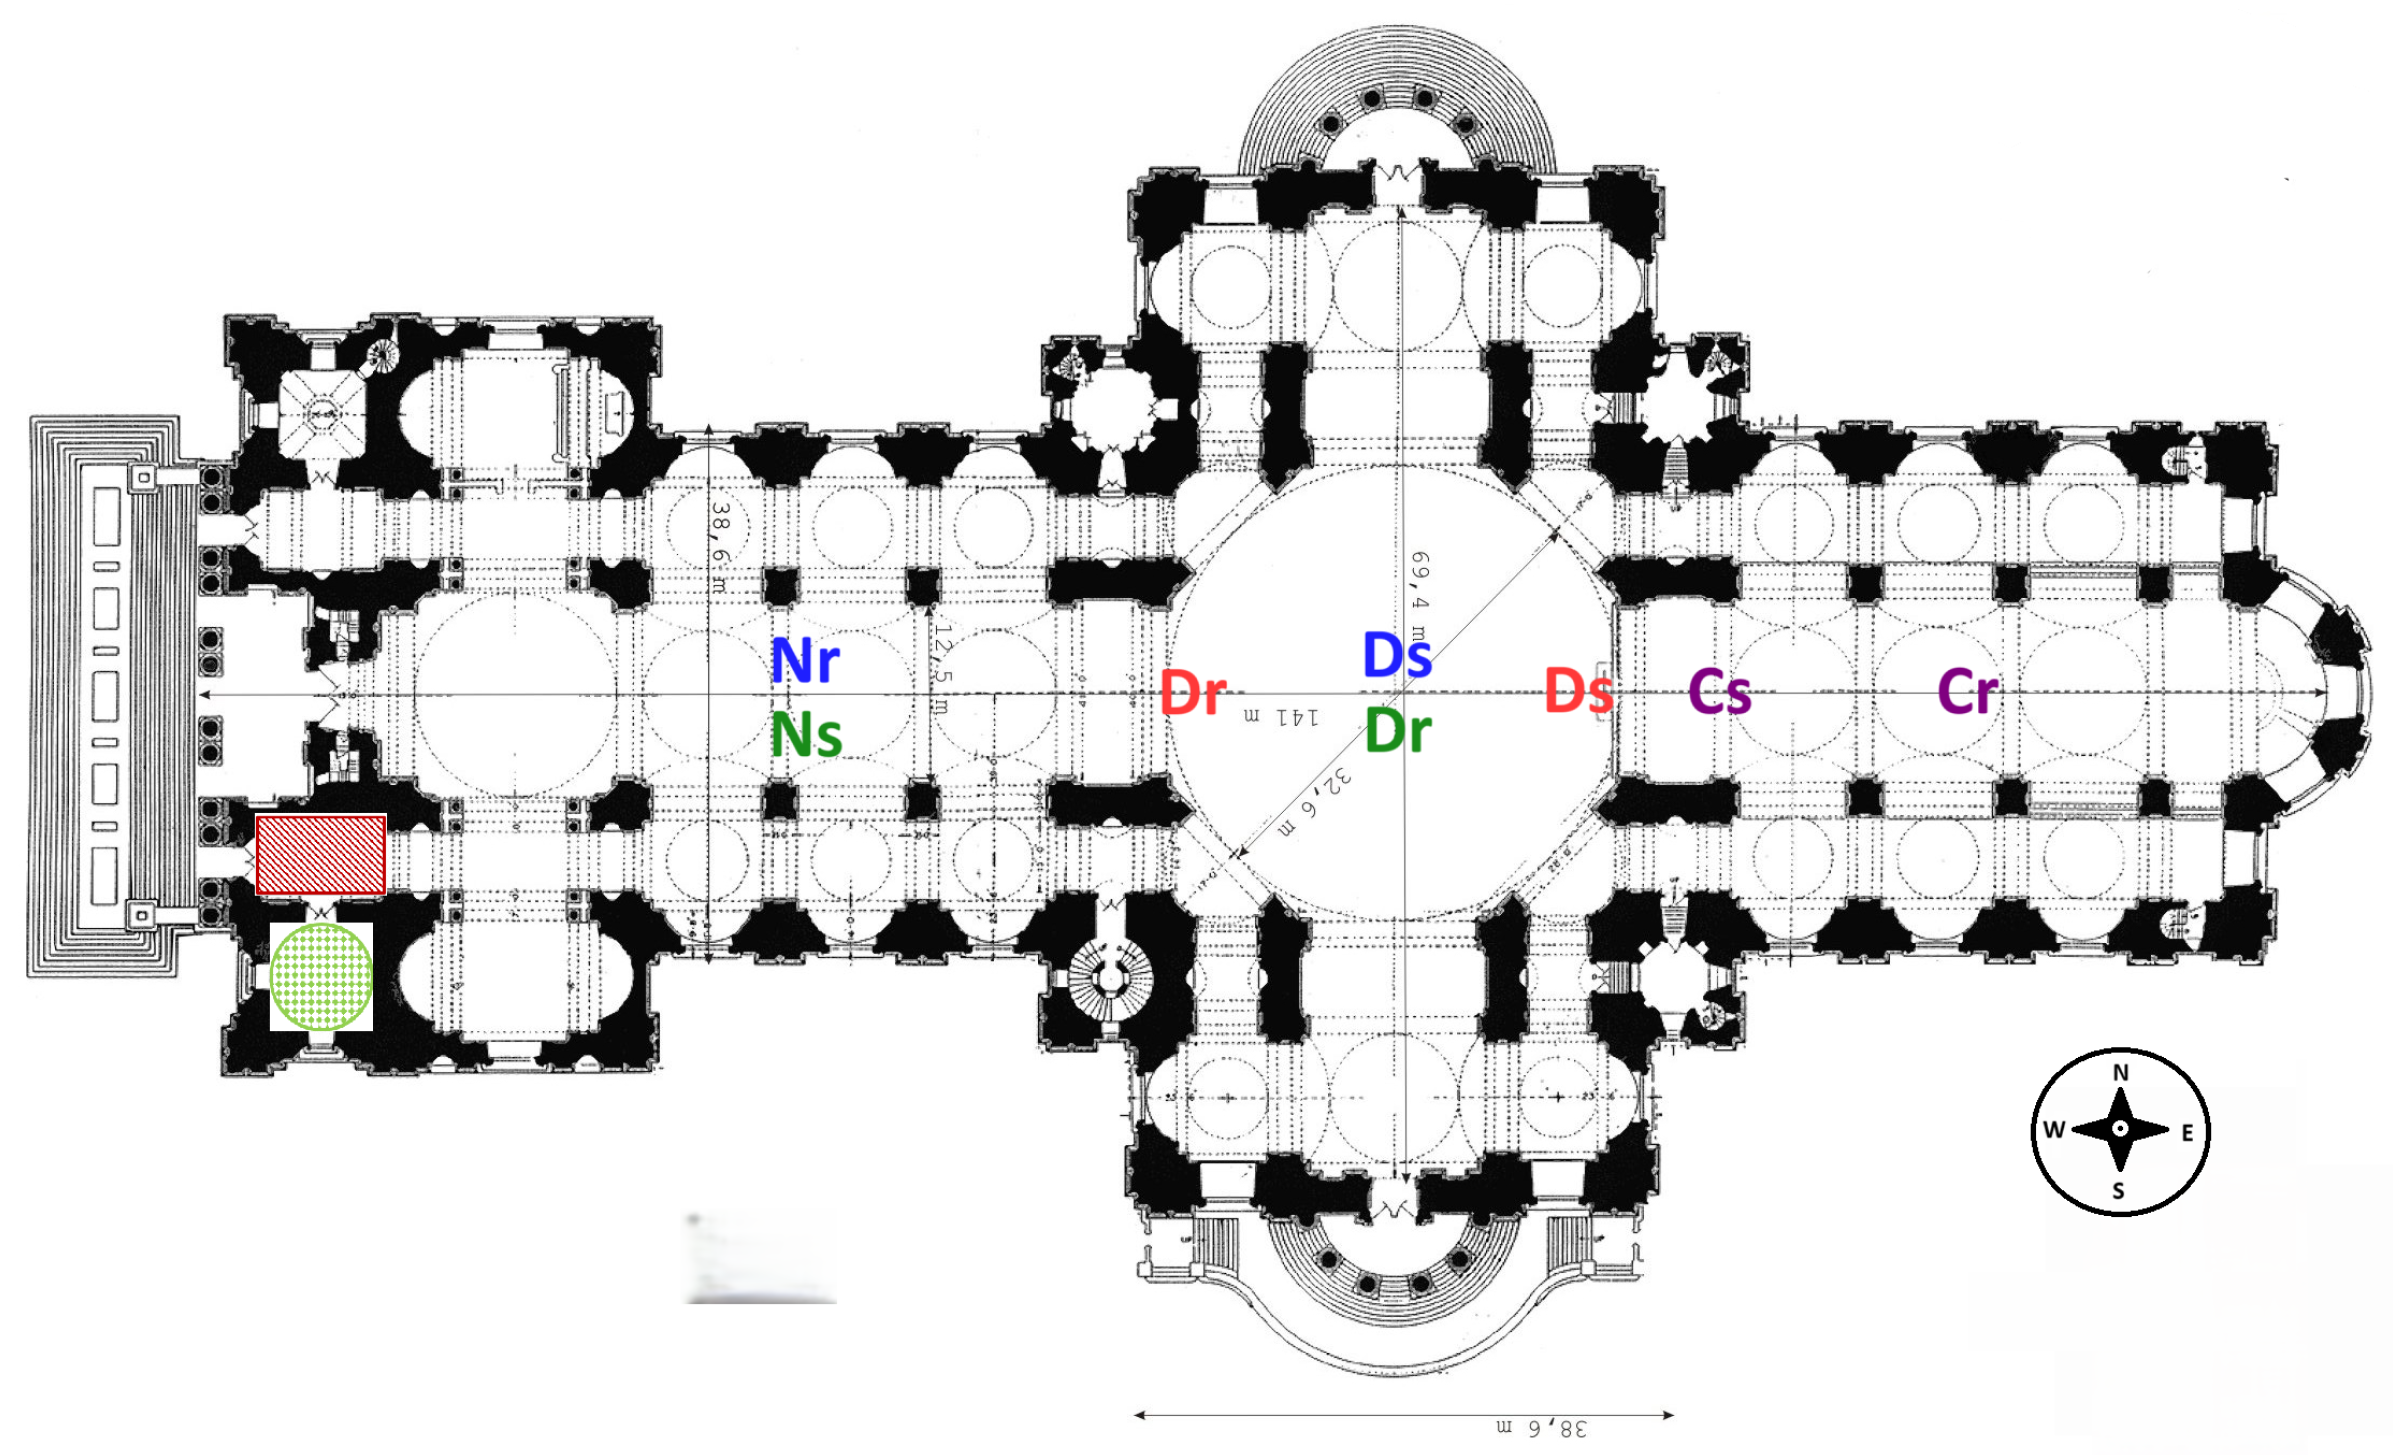
Four configurations of source and receiver positions were measured on the main Cathedral floor, relative to the locations of the dome, nave and the choir. The sound source positions were chosen based on typical performer locations during services or concerts, and in all measurement cases the sound source was oriented to directly face the receiver position. For the first set, the source was located as close as possible directly under the apex of the dome with the receiver placed along the centre aisle of the nave at a distance of 31.64 m from the source. This is represented as configuration DsNr (=(D)ome (s)ource (N)ave (r)eceiver) in the following results. For the second set, the source and the receiver locations were swapped, and this is represented as configuration NsDr. For the third configuration, both the source and the receiver were located under the dome (DsDr), on the east and west sides, respectively, with a distance of 9.48 m between them. Measurements were also taken within the choir area, with the source located at the entrance by the pulpit and facing the altar, with the receiver located at what would be the Music Director’s position. This is shown as configuration CsCr with a distance between them measured at 13.77 m. These measurement locations are approximately shown in the floor plan presented in Figure 6.
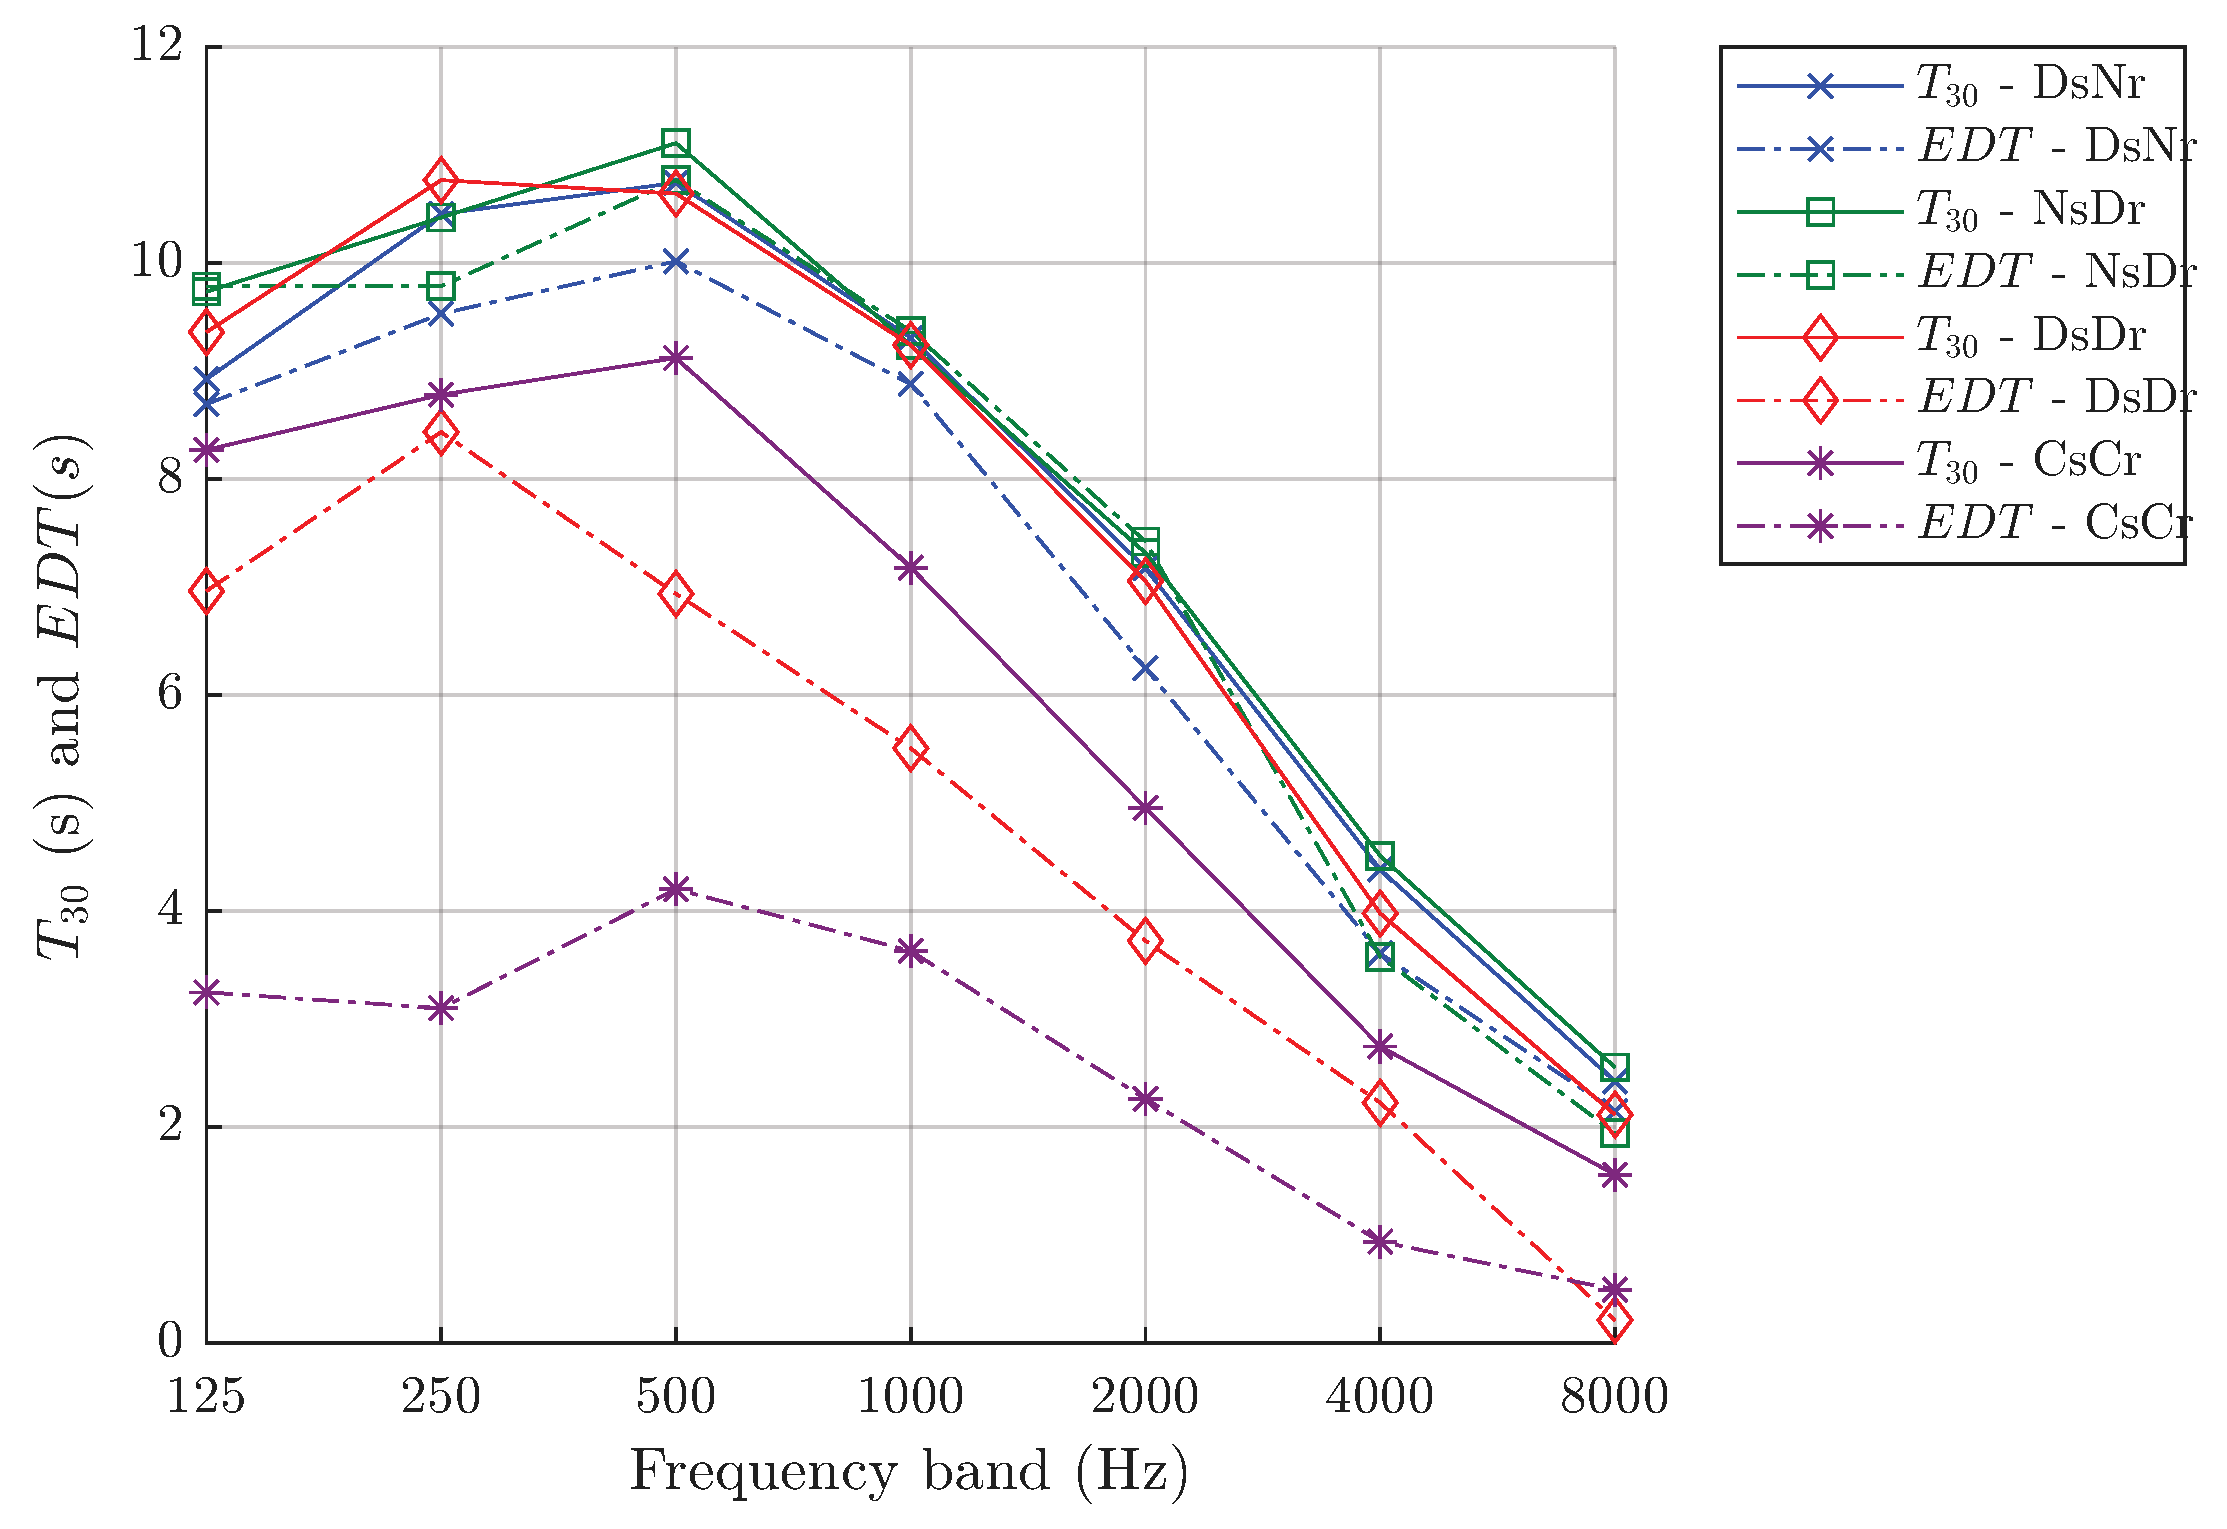
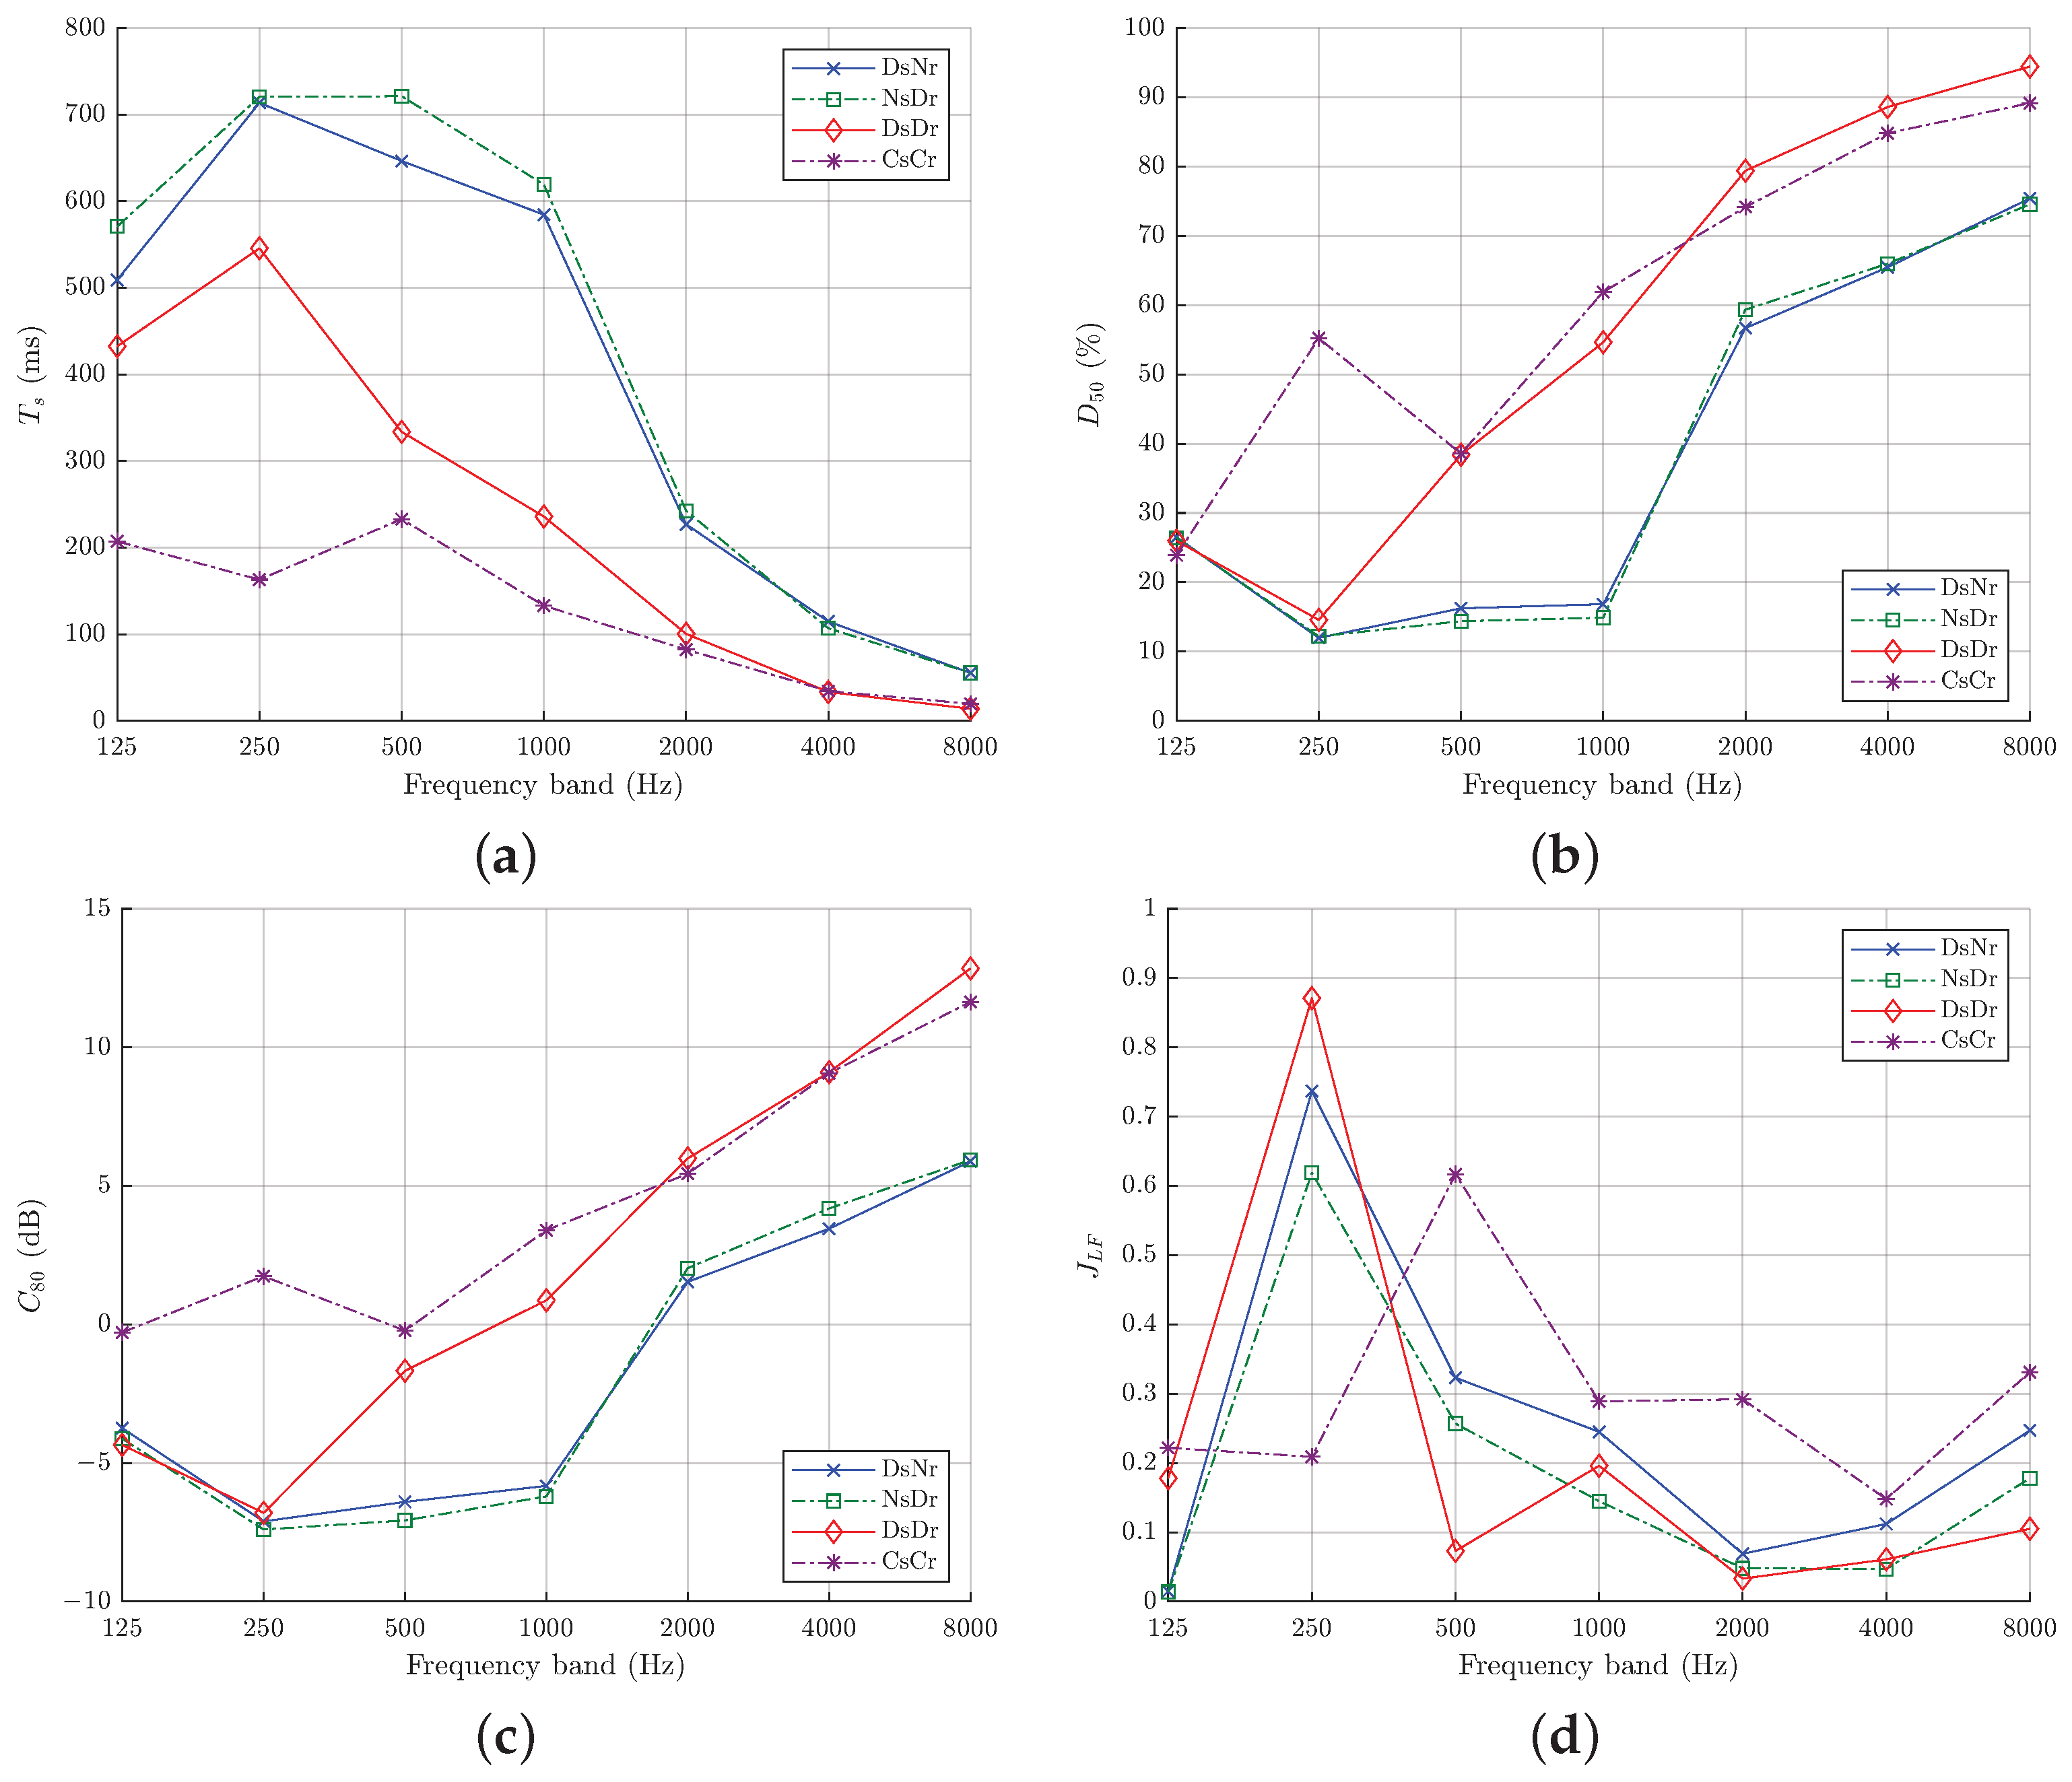
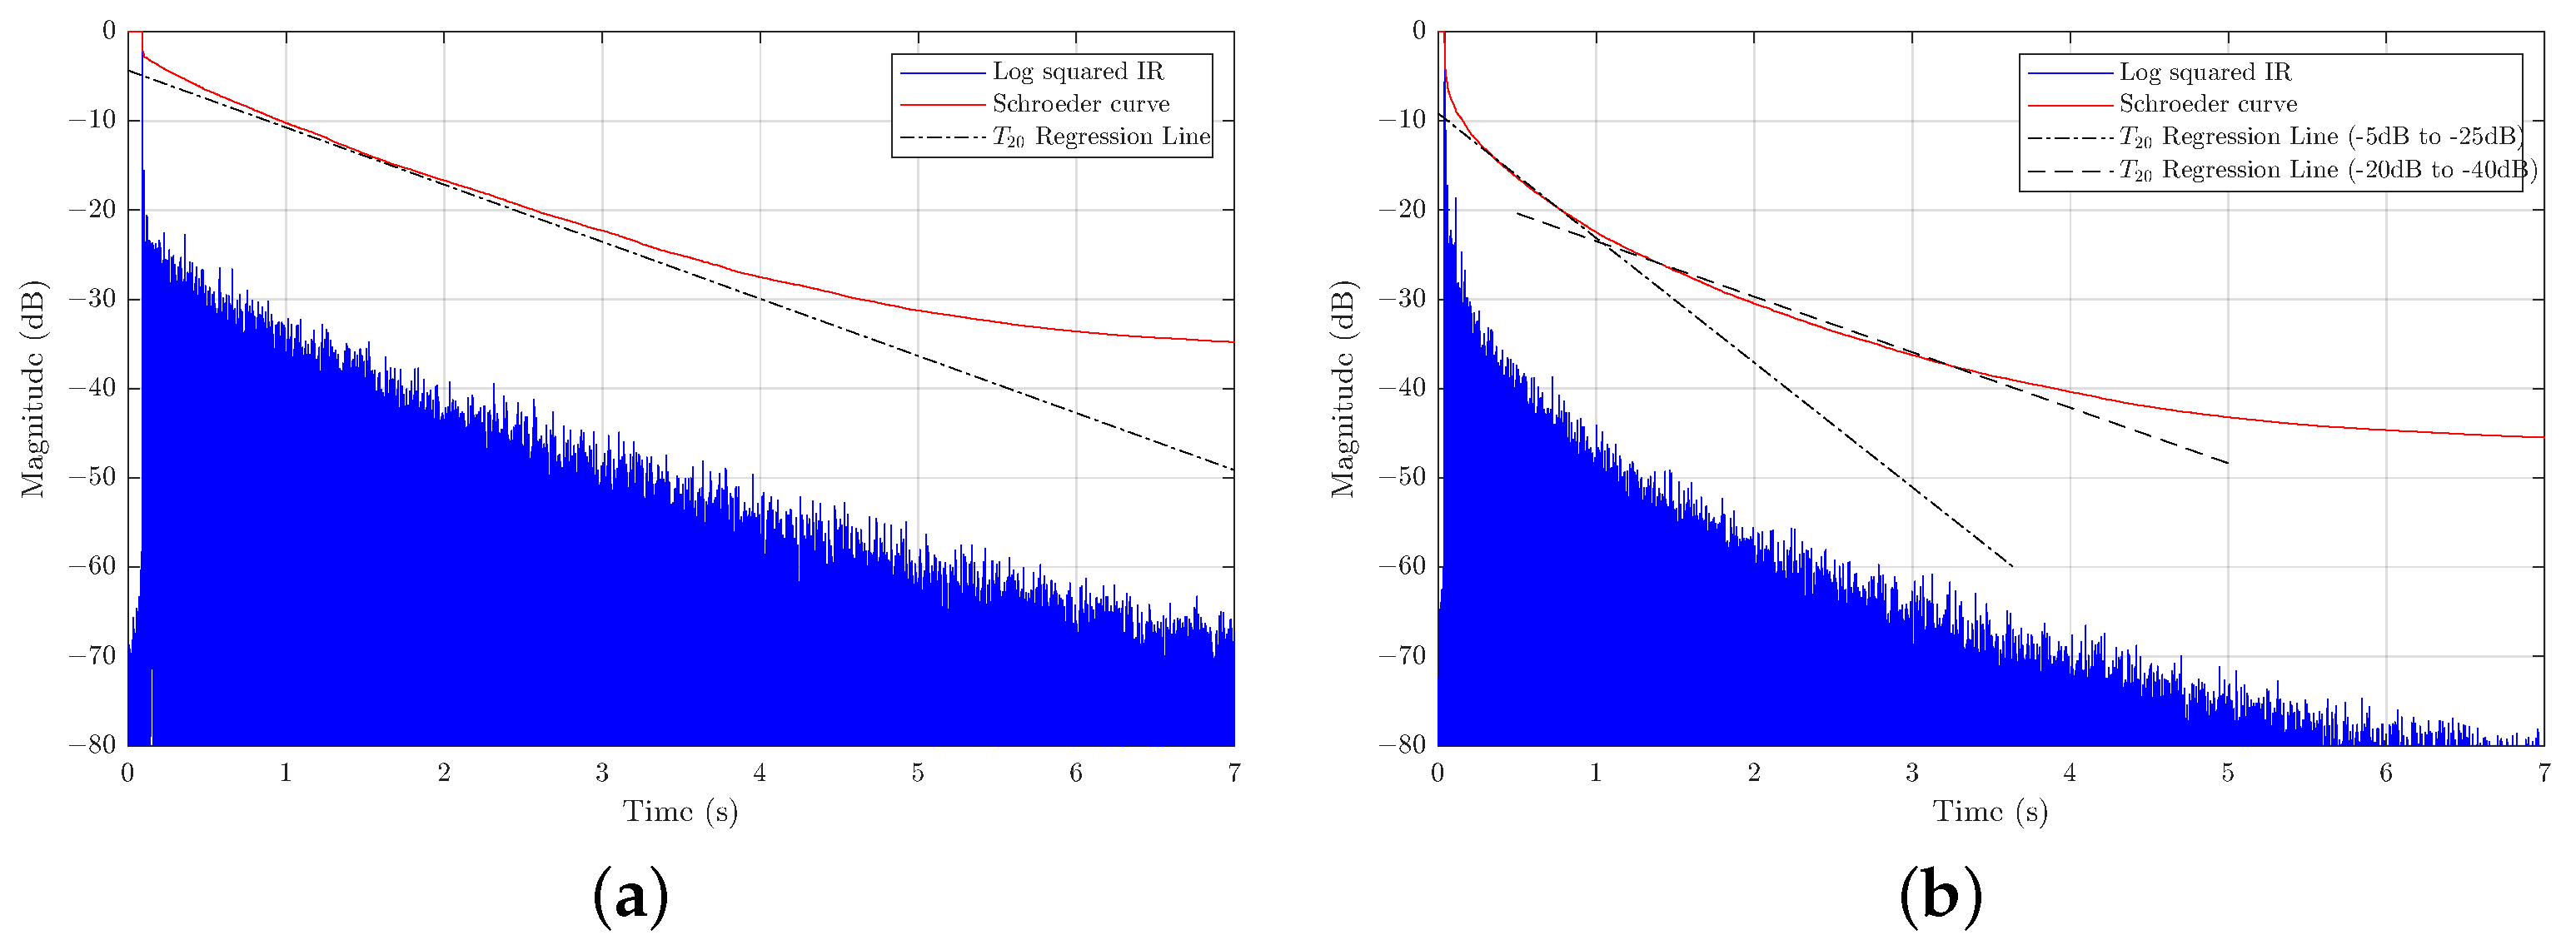
It is clear from the results across all the parameters, as presented in Figure 7 and in Figure 8, that the positions that have been chosen for the four configurations from the Cathedral floor exhibit very different acoustic behaviour. It has been previously discussed that there are 70 acoustic subspaces in St Paul’s Cathedral resulting in varied acoustic coupling effect between them and different shapes to associated early decay curves [24]. This is very prominent if two subspaces have different absorption characteristics resulting in an energy decay curve with a two-stage structure corresponding to the early and the late parts. Confirming the observations in [24], the measurements carried out for this current study in the dome and choir area (configurations DsDr and CsCr) have the most pronounced two-stage structure of sound decay. This is shown in Figure 9 where the energy decay curves for measurement configurations DsNr and CsCr are presented for comparison. Figure 9a shows the log squared impulse response obtained from measurement configuration DsNr together with the associated Schroeder decay curve and the linear regression line used to calculate, in this case, T 20 . The acoustics of the dome/nave are dominated by the significant reverberation present within this large volume giving a single clear regression line from which the T 20 reverberation time can be determined. Figure 9b presents the same for the CsCr case where the Schroeder decay curve is much less linear and two candidate regression lines are presented, one based on traditional T 20 parameters (−5 dB to −25 dB), and a second calculated using (−20 dB to −40 dB) resulting in double slope decay. This is most likely due to the coupling effect between the enclosed choir space and the much larger volume of the main nave of the Cathedral (as also described in St Peter’s Basilica in Rome by [16]).
The results for the DsNr and NsDr configurations confirm Lewers’ and Anderson’s observation [2], that the principle of reciprocity is applicable to reverberation times, where source and microphone positions are interchanged for these two measurements. In this space, it could be said that the principle of reciprocity is also applicable to the rest of the presented parameters: T s , D 50 and C 80 . While the T 30 and E D T values in the nave are quite similar, the results for DsDr and CsCr show clear differences. T 30 for configuration DsDr is similar to the nave measurements (DsNr and NsDr), but the E D T values are around 2 s lower in each frequency band when compared to corresponding DsDr T 30 values. This is likely to be due to the large dome, as there will be no strong early reflections from the ceiling, and air absorption might well have a more significant influence on the results than usual—this is also suggested by Lewers [2]. Similarly, there is a clear difference between T 30 and E D T values for configuration CsCr. More specifically, the mean values of T 30 and E D T at 500 Hz are 10.87 s and 10.33 s, respectively, for configurations DsNr and NsDr, whereas for CsCr T 30 = 9.12 s and E D T = 4.2 s. This corresponds to 3.24 x the Just Noticeable Difference (JND) value for T 30 and 11.8 x the JND value for E D T , indicating a well-noticeable difference in the reverberant field between these subspaces. Although the JND values for EDT are still under investigation [43], EDT has been considered to give a more detailed indication of the perception of reverberation in a space. In particular, in St Paul’s Cathedral, the listener should be able to perceive the differences in the surrounding objects and materials between these subspaces. Shorter EDT values when compared to T 30 have also been noticed in examples of Papal Basilicas in Rome with similar dimensions to that of St Paul’s Cathedral, and with similar complex geometries with connected subspaces [44].
T s values also demonstrate this difference between the configurations. Comparing T s and J L F results for configurations DsNr, NsDr and DsDr, it may be assumed that the early energy for the frequency band of 250 Hz observed in the T s results arrives from the sides (lateral energy) as indicated by the high values of J L F . However, the peak early energy in the 500 Hz and 1000 Hz frequency bands for configurations DsNr and NsDr do not appear in the corresponding J L F values.

5.2. The Whispering Gallery

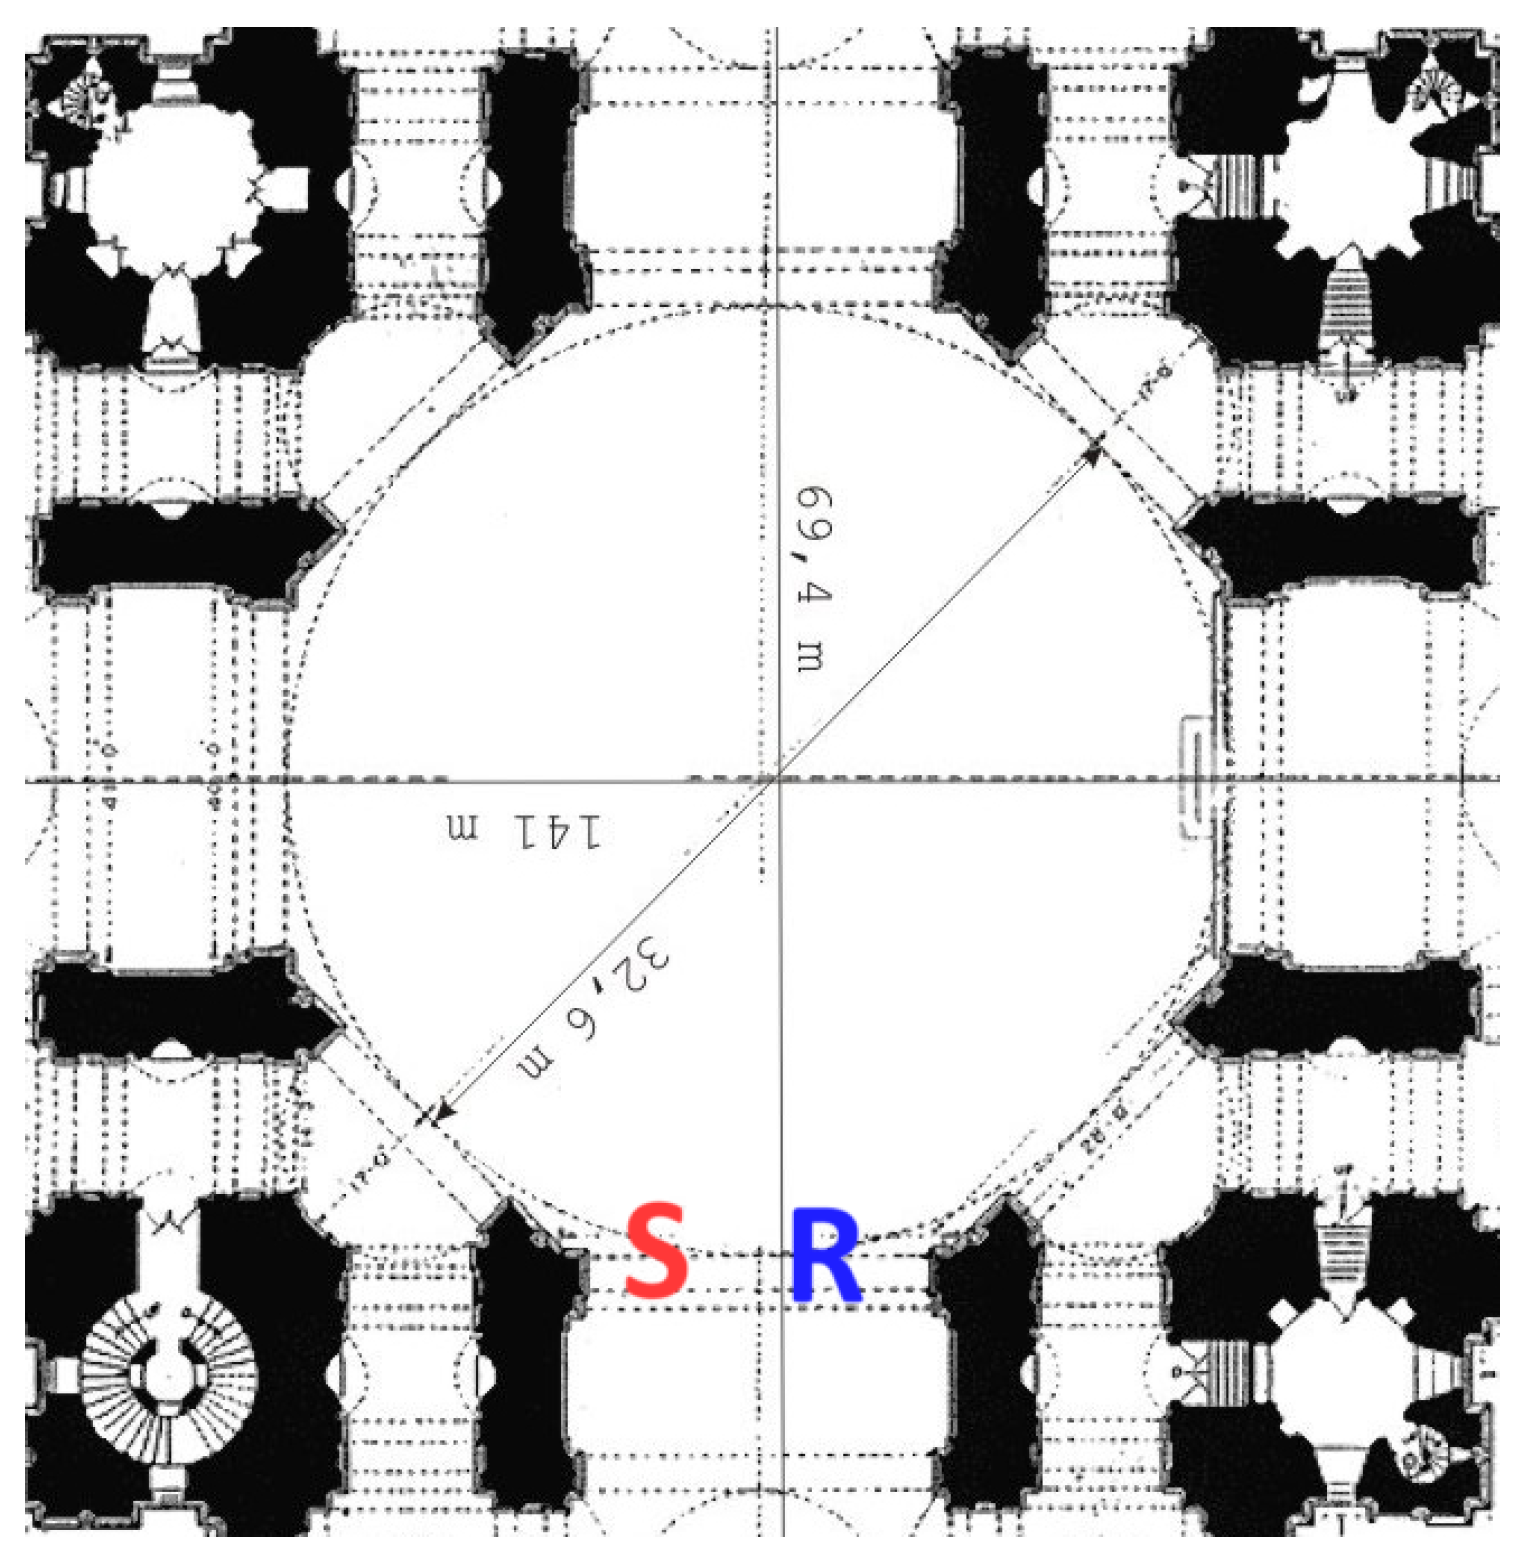
The Gallery is a circular walkway located at the interior dome, with smooth surfaces except for eight shallow niches. It is about 30 m above the nave’s floor and the diameter of the interior dome is 33.64 m, with a perimeter of 105.7 m.
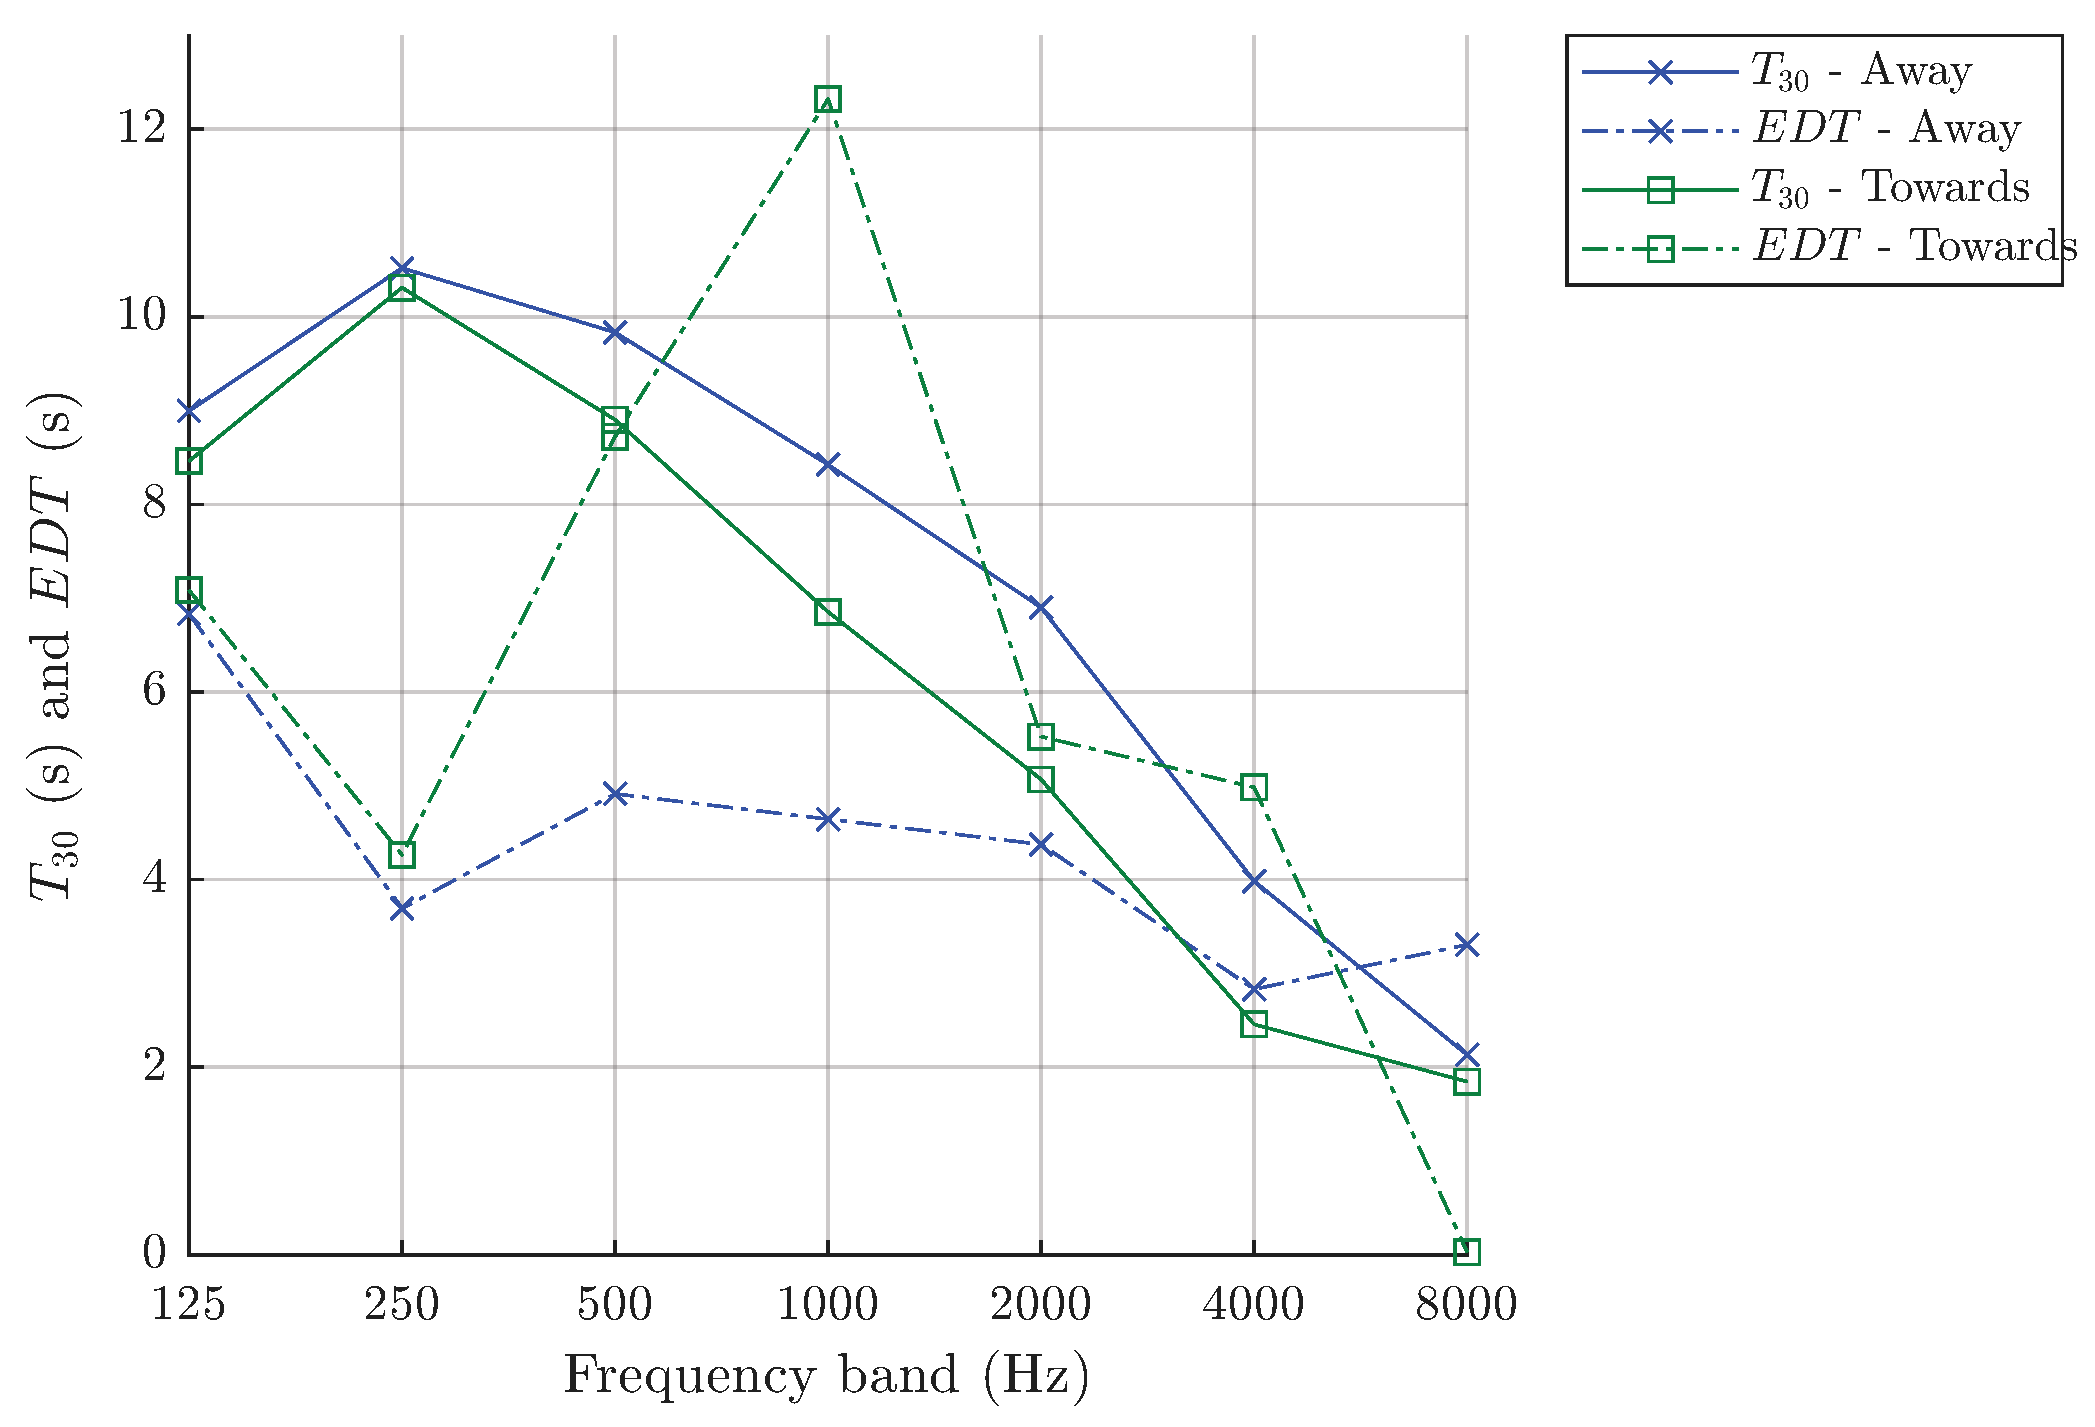
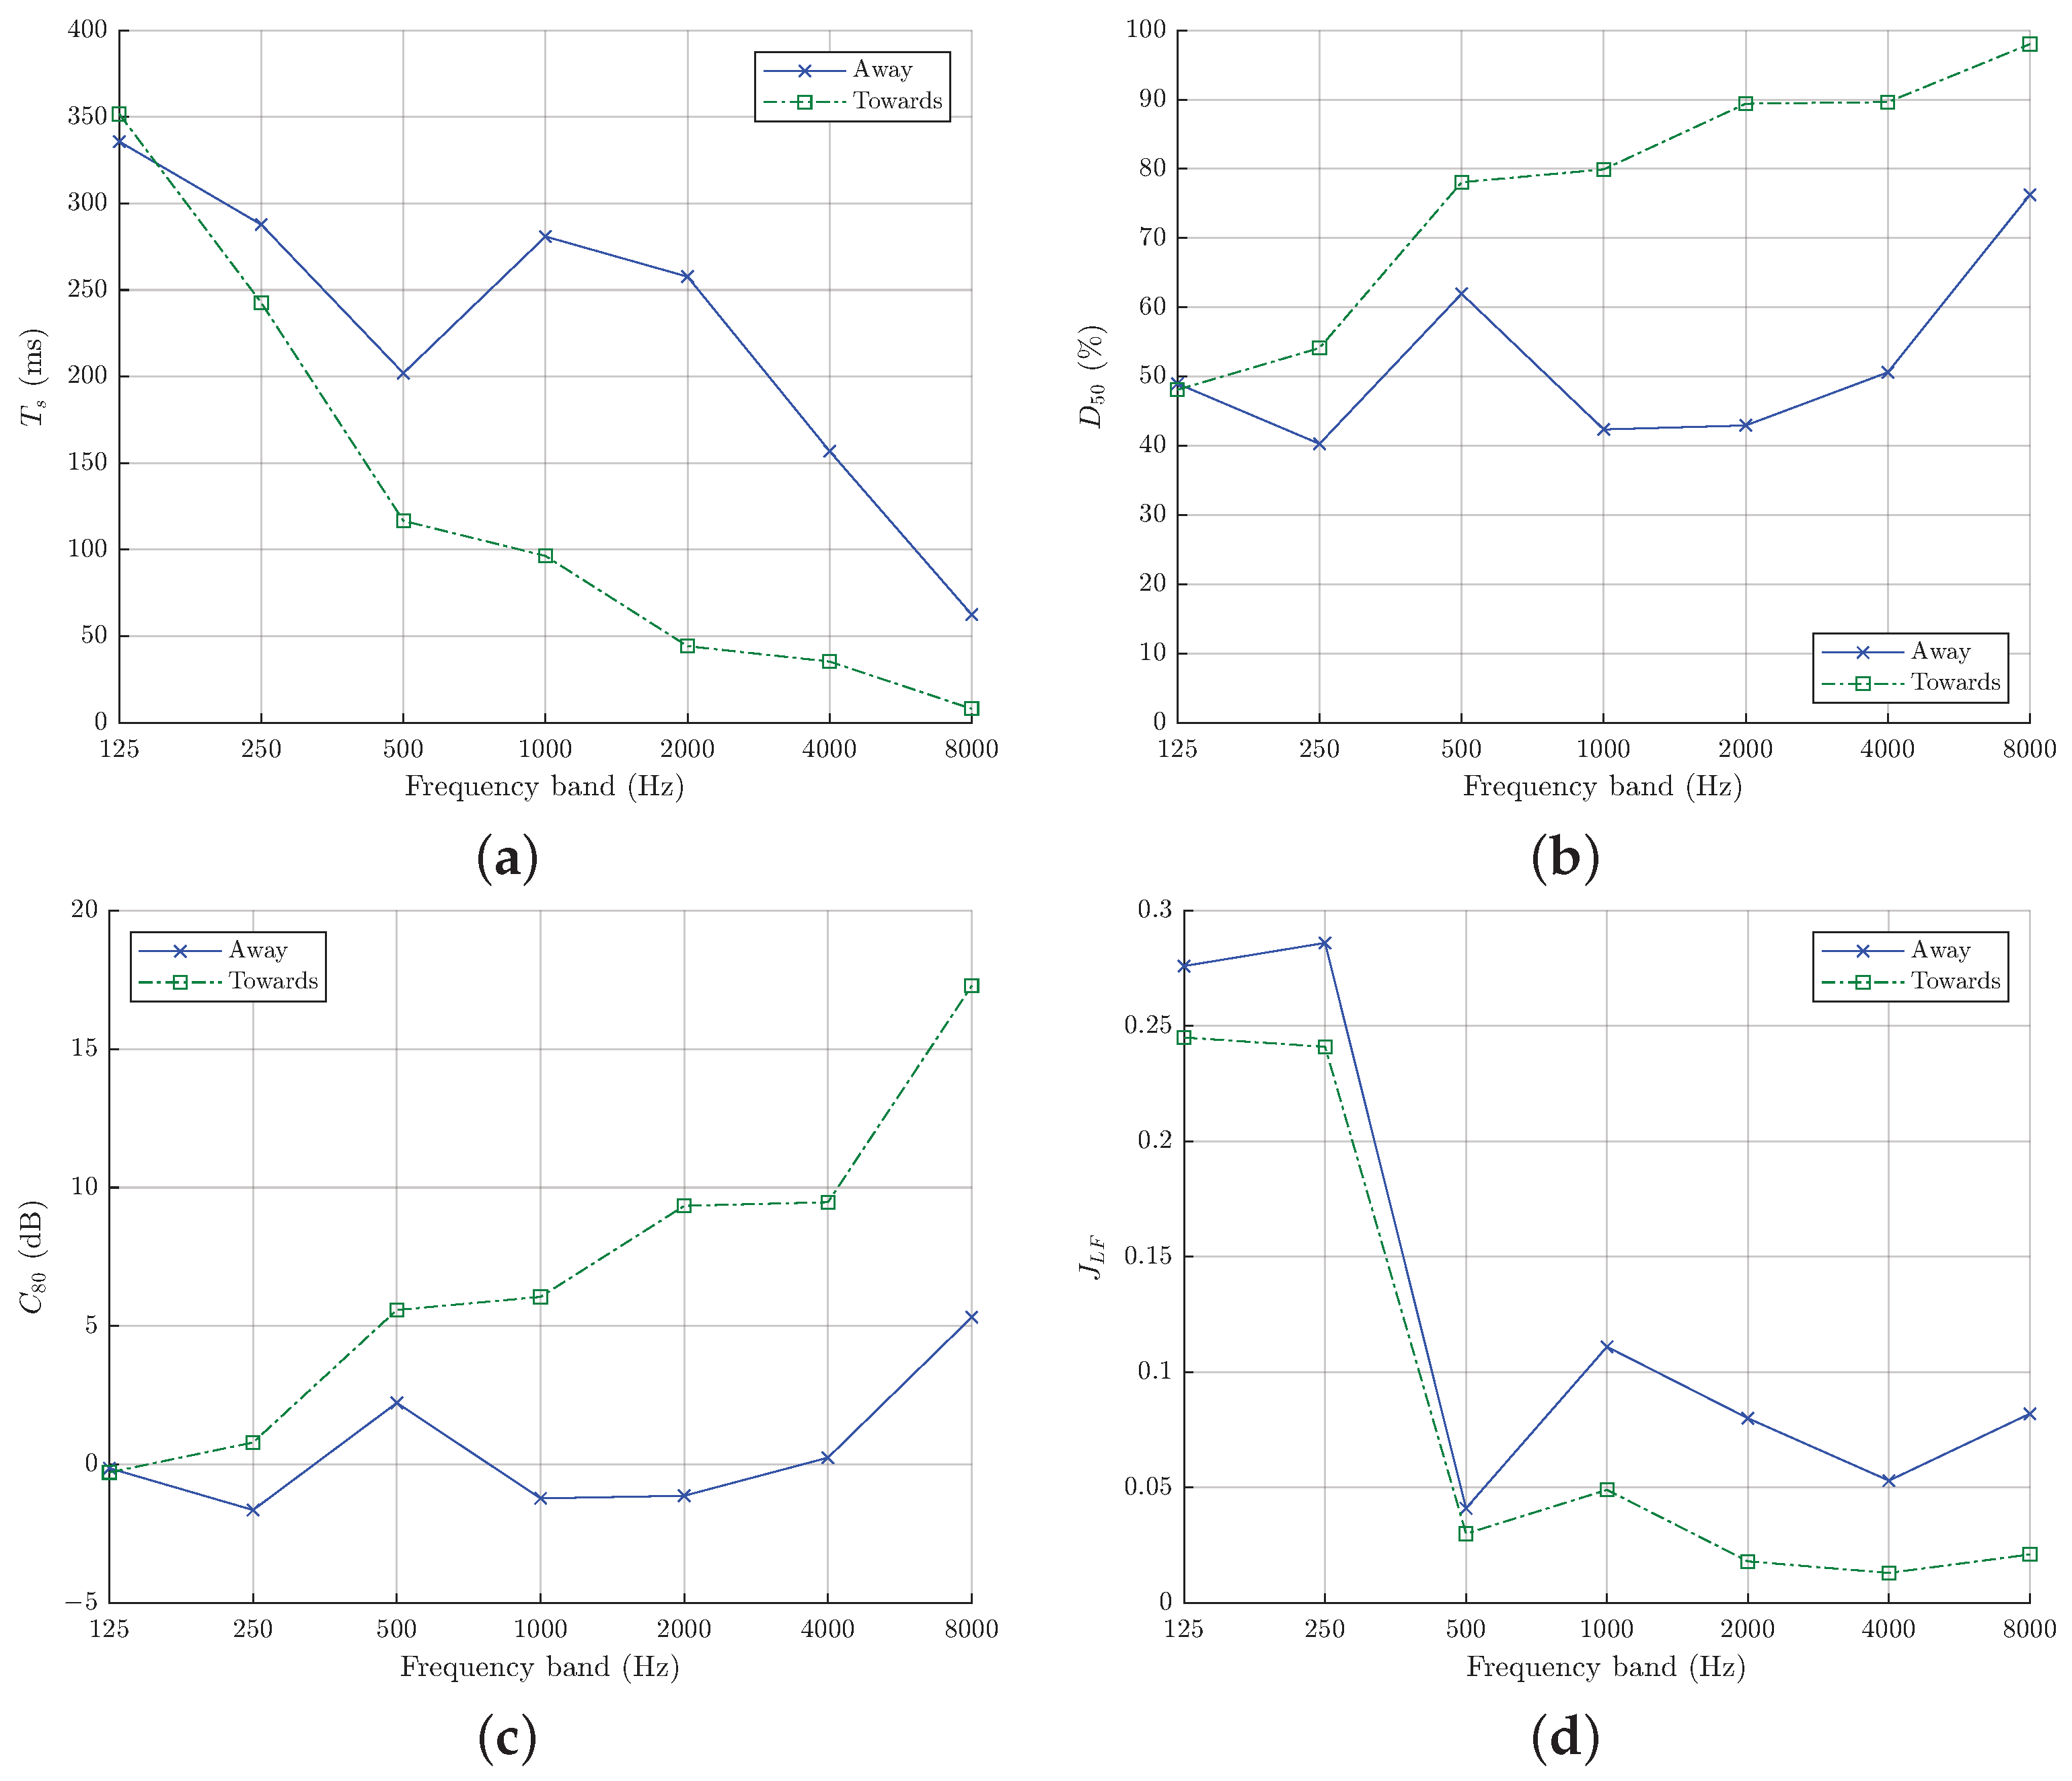
As a directional sound source has been used for these measurements, the impact of source directionality has been explored in this area, as may be considered representative of a directional human voice speaking within the space. Two sets of measurements were taken in the Whispering Gallery. The position of the source and receiver was the same in both cases, with the distance between them being 4.34 m as shown in Figure 10. For the first set, the speaker was oriented pointing parallel to the circular wall (‘Away’ from the receiver). For the second set, the speaker was oriented to be pointing directly toward the receiver position (‘Towards’ the receiver) across the open space of the dome above to give a strong direct sound contribution at the measurement position. The resulting acoustic parameters are presented in Figure 11 and Figure 12.
The observed irregularities indicate the unusual acoustic behaviour of this particular space. The first observation that can be made is by comparing T 30 and E D T values and noting the difference between the two results determined by the orientation of the source. For example, at 250 Hz, T 30 (Away) is approximately 10.5 s compared to an E D T (Away) of approximately 4.0 s. A large difference is also noted for the values obtained for T 30 (Towards) and E D T (Towards). There is also an unexpected peak at 1 kHz for E D T (Towards) values, which will be discussed further below.
From the energy-based results, as presented in Figure 12, it can be seen first of all that D 50 and C 80 have a significant difference between them in the middle- and high-frequency bands (from 1 kHz). T s also reflects this shift between the two measurements. Also of note is the relative dip/peak across these results at 500 Hz for the ‘Away’ case compared with the ‘Towards’ case.
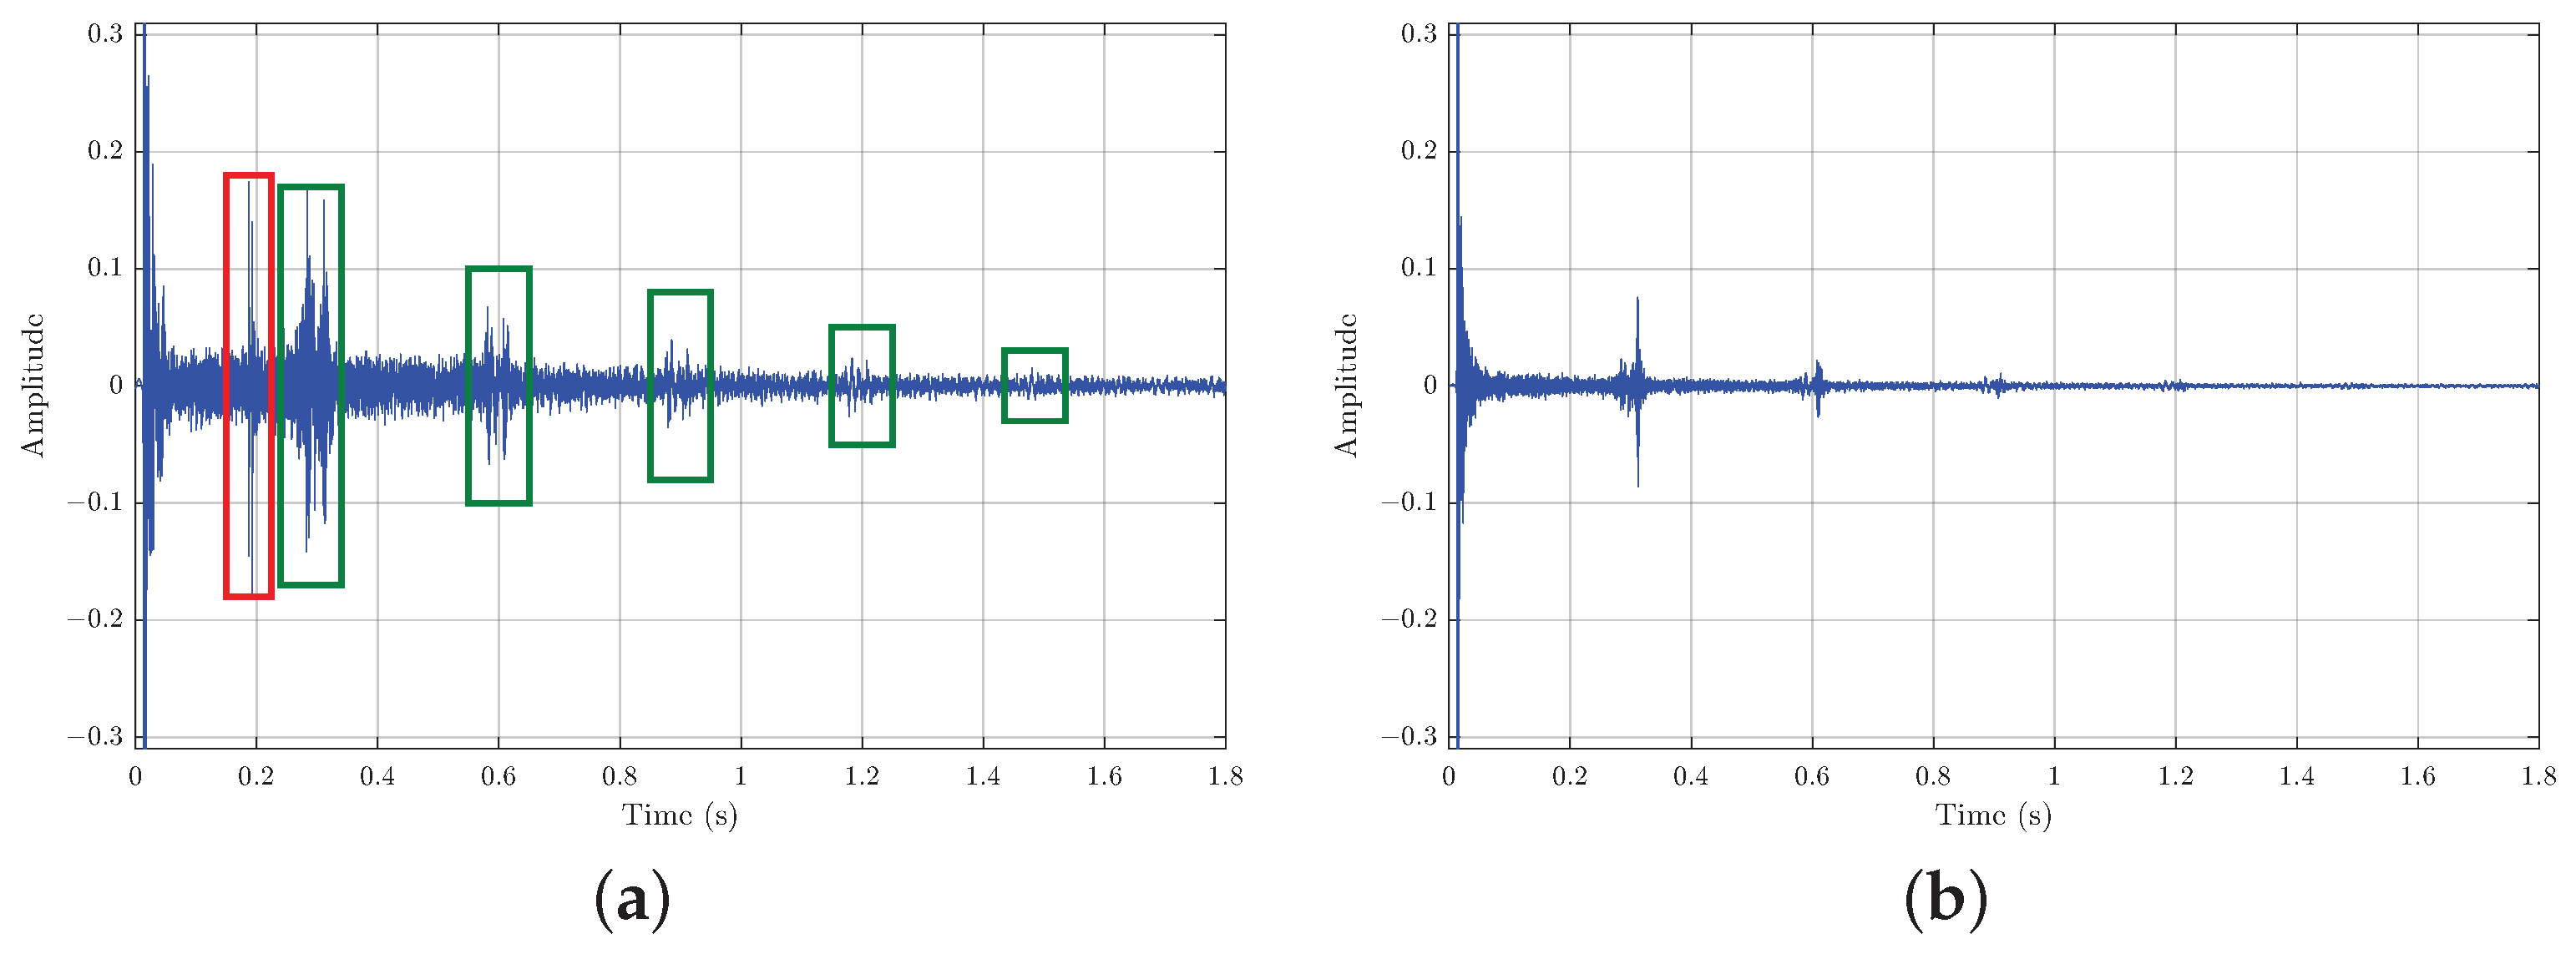
A closer look at the time domain impulse responses for these two recordings is also very insightful. For the ‘Away’ example (Figure 13a), the direct sound and early reflections arrive between 0 s and 0.05 s. Strong peaks follow at around 0.2 s, 0.3 s, 0.6 s, 0.9 s, 1.2 s, and 1.5 s, each decaying with time, as highlighted in Figure 13a. Considering the speed of sound at 25.8 °C and humidity at 55%, as was recorded for this part of the Cathedral, and standard atmospheric pressure of 101.325 kPA, the peak at around 0.2 s, highlighted in red, is most likely the reflection arriving from the opposite side of the circular Gallery, given its measured diameter of 33.64 m.
The subsequent peaks, highlighted in green in Figure 13a, occur at regular intervals, being a strong indication of the “whispering gallery” effect. This “creeping” of sound, as described by Lord Rayleigh, repeats three times per minute in this space. The peaks appear in pairs each time and this is because the wave arrives at the receiver position twice via both the circular clockwise and anti-clockwise paths around the Gallery.
For the ‘Towards’ example (Figure 13b), a similar reflection pattern is observed but with much less energy for each respective time window compared to Figure 13a. It is also noticeable that there is no reflection at 0.2 s from the opposite side of the Gallery as in the previous measurement, which emphasises the importance of source directivity for any space, but especially so for a concave space like the Whispering Gallery.
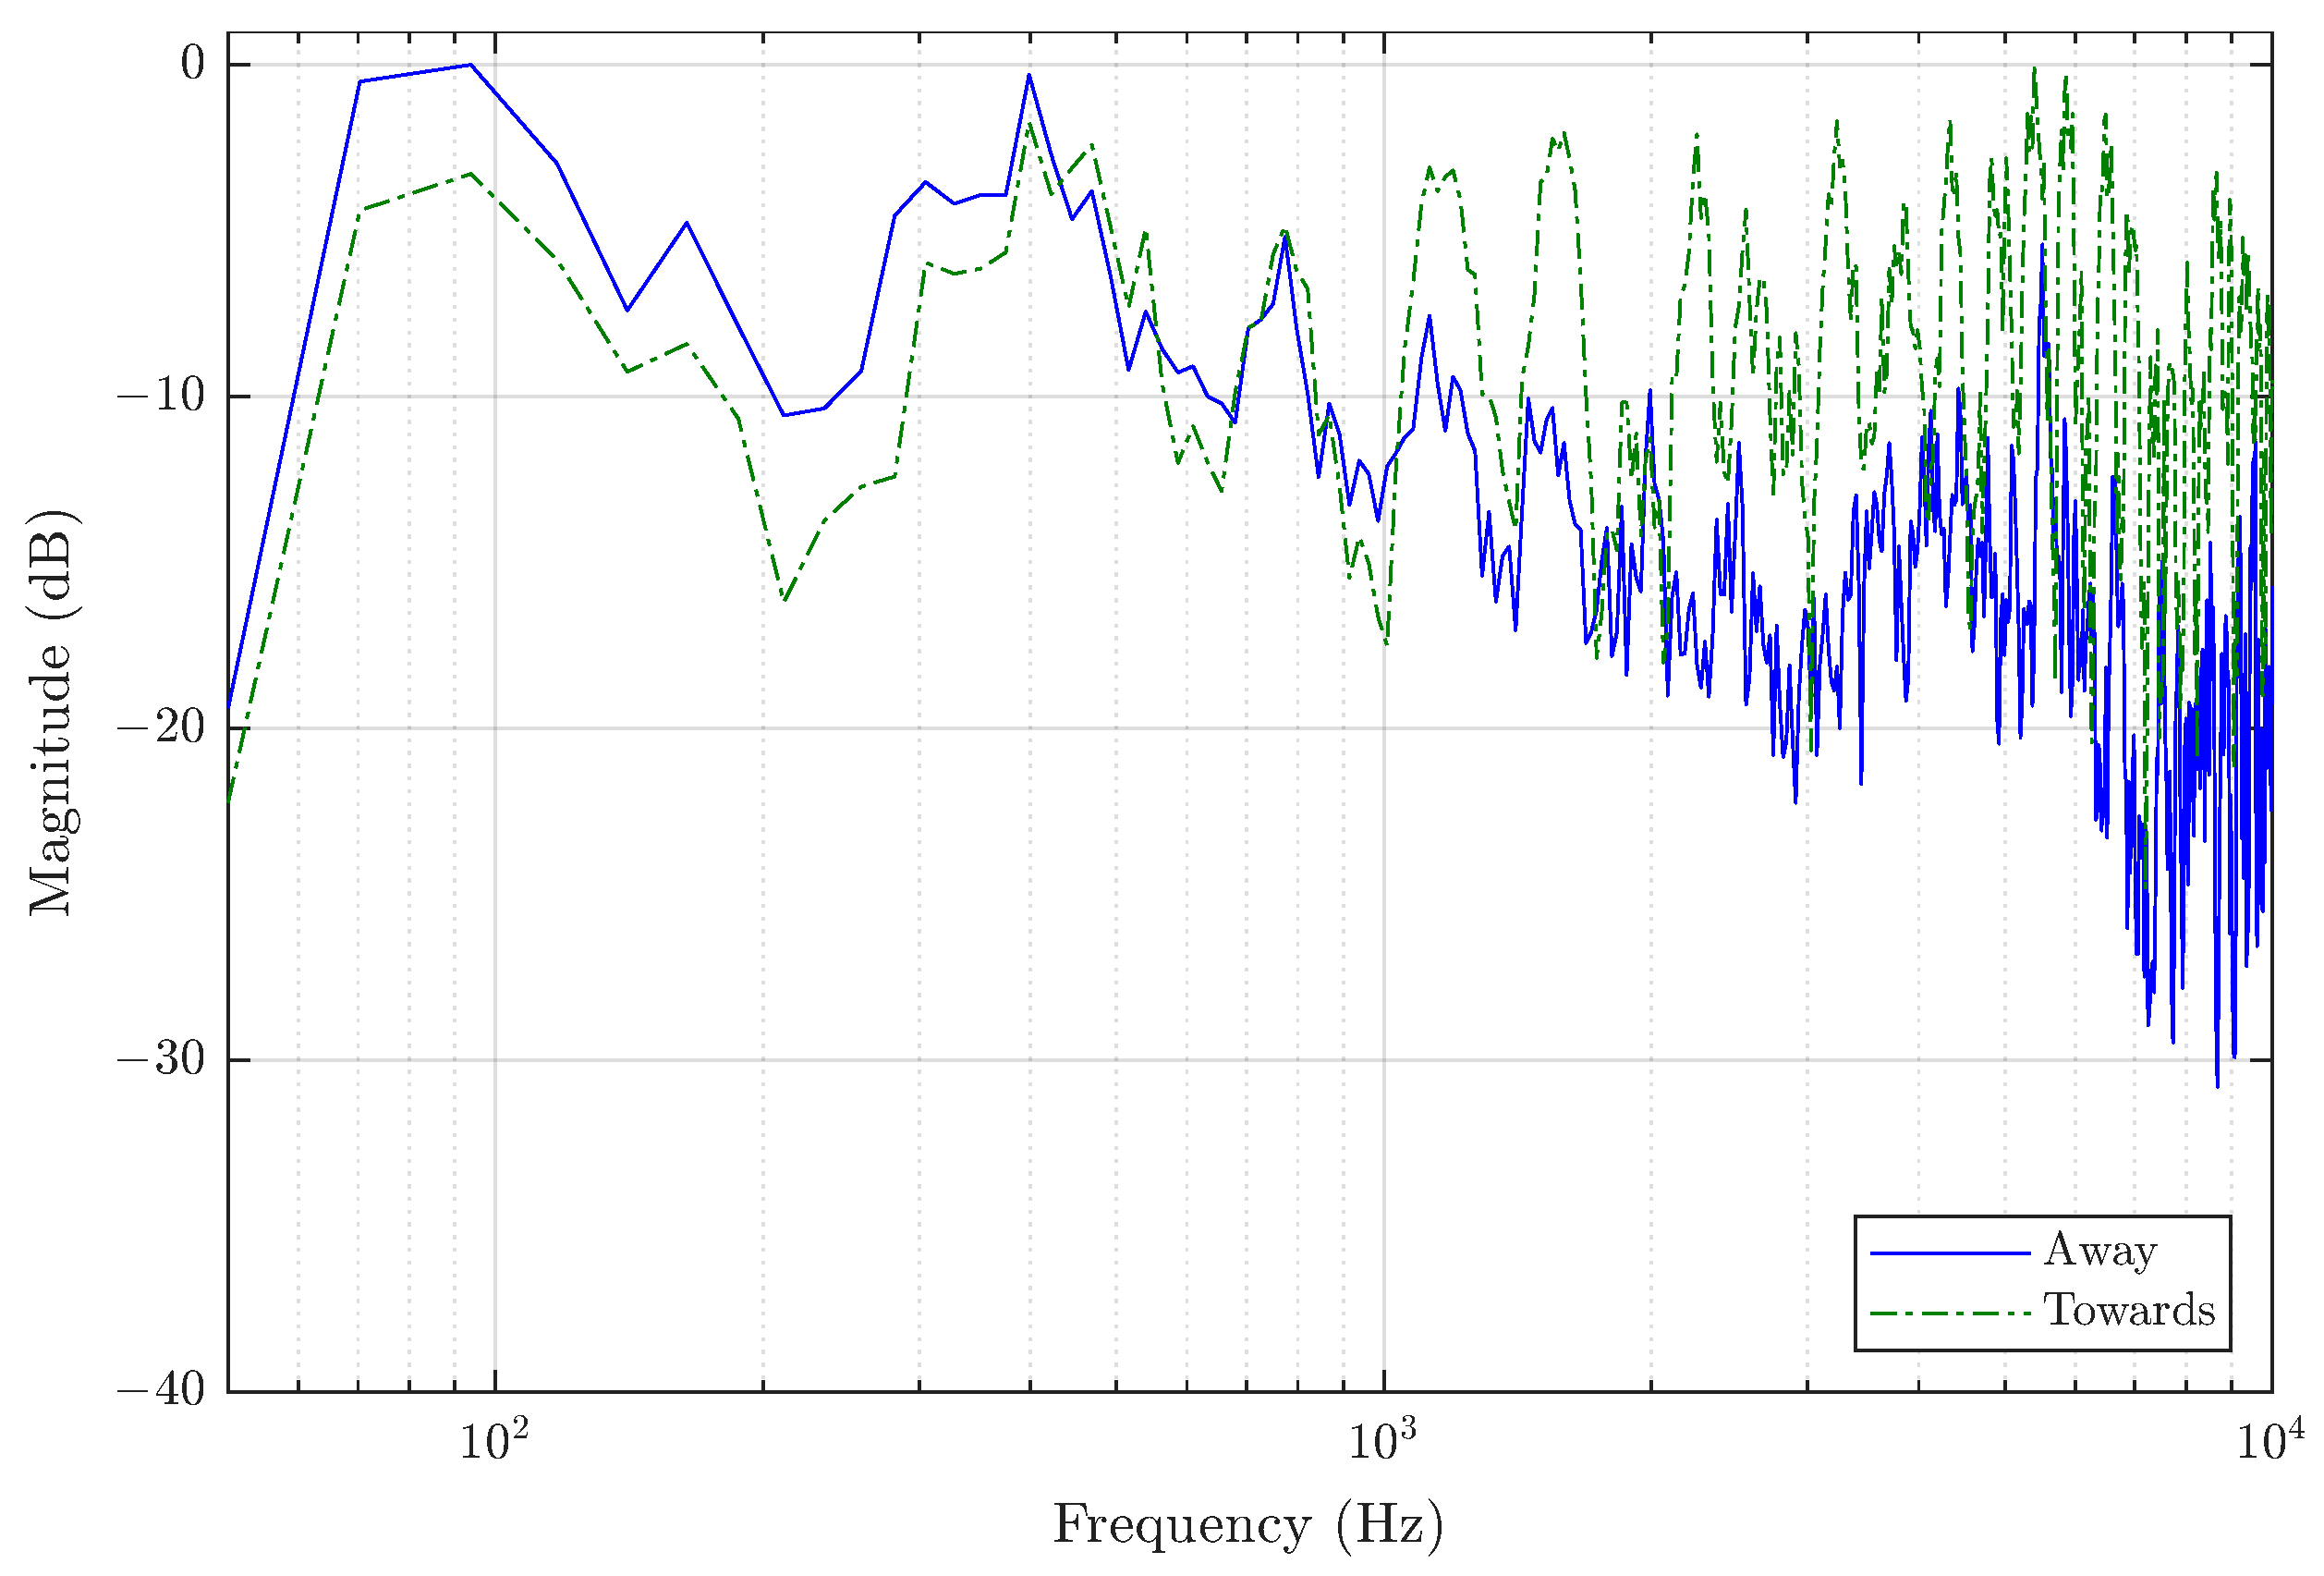
Interesting observations can also be made about the frequency spectrum of the impulse response measurements shown in Figure 13, as presented in Figure 14, where strong activity around 80–90 Hz and 400 Hz can be observed in both measurements, together with much stronger, regular, resonant peaks in the ‘Towards’ case. These strong resonant peaks clustered between 1 and 5 kHz might well contribute to E D T being greater between 500 Hz and 4 kHz (see in Figure 11) as this is not observed in the ‘Away’ case.
Due to the particular characteristics of the recorded impulse response as caused by the whispering gallery effect, the room acoustics parameter results obtained (see Figure 11 and Figure 12) should be treated with some caution. The perception of the reverberation in the space, for instance, cannot be discerned from the measured E D T values as might normally be the case, and especially in the ‘Towards’ example as seen in Figure 11. Additionally, large differences are observed across T s (ms), D 50 (%), C 80 (dB) and J L F for the ‘Towards’ and ‘Away’ cases and especially for octave bands above 1 kHz, with, for instance, C 80 in the ‘Towards’ example peaking 5–10 dB more than the ‘Away’ case. This potentially indicates strong early reflection contributions across this frequency range, and may well contribute to the irregular behaviour observed in the 1 kHz octave band for E D T in the ‘Towards’ case in Figure 11. However, more data are required to give confidence in these results. Similarly, it is not possible to draw confident conclusions regarding any possible Helmholtz resonator effect due to the neck of the dome (which can be seen in Figure 1) as was mentioned in passing by Lewers and Anderson in their work [2].

5.3. The Library

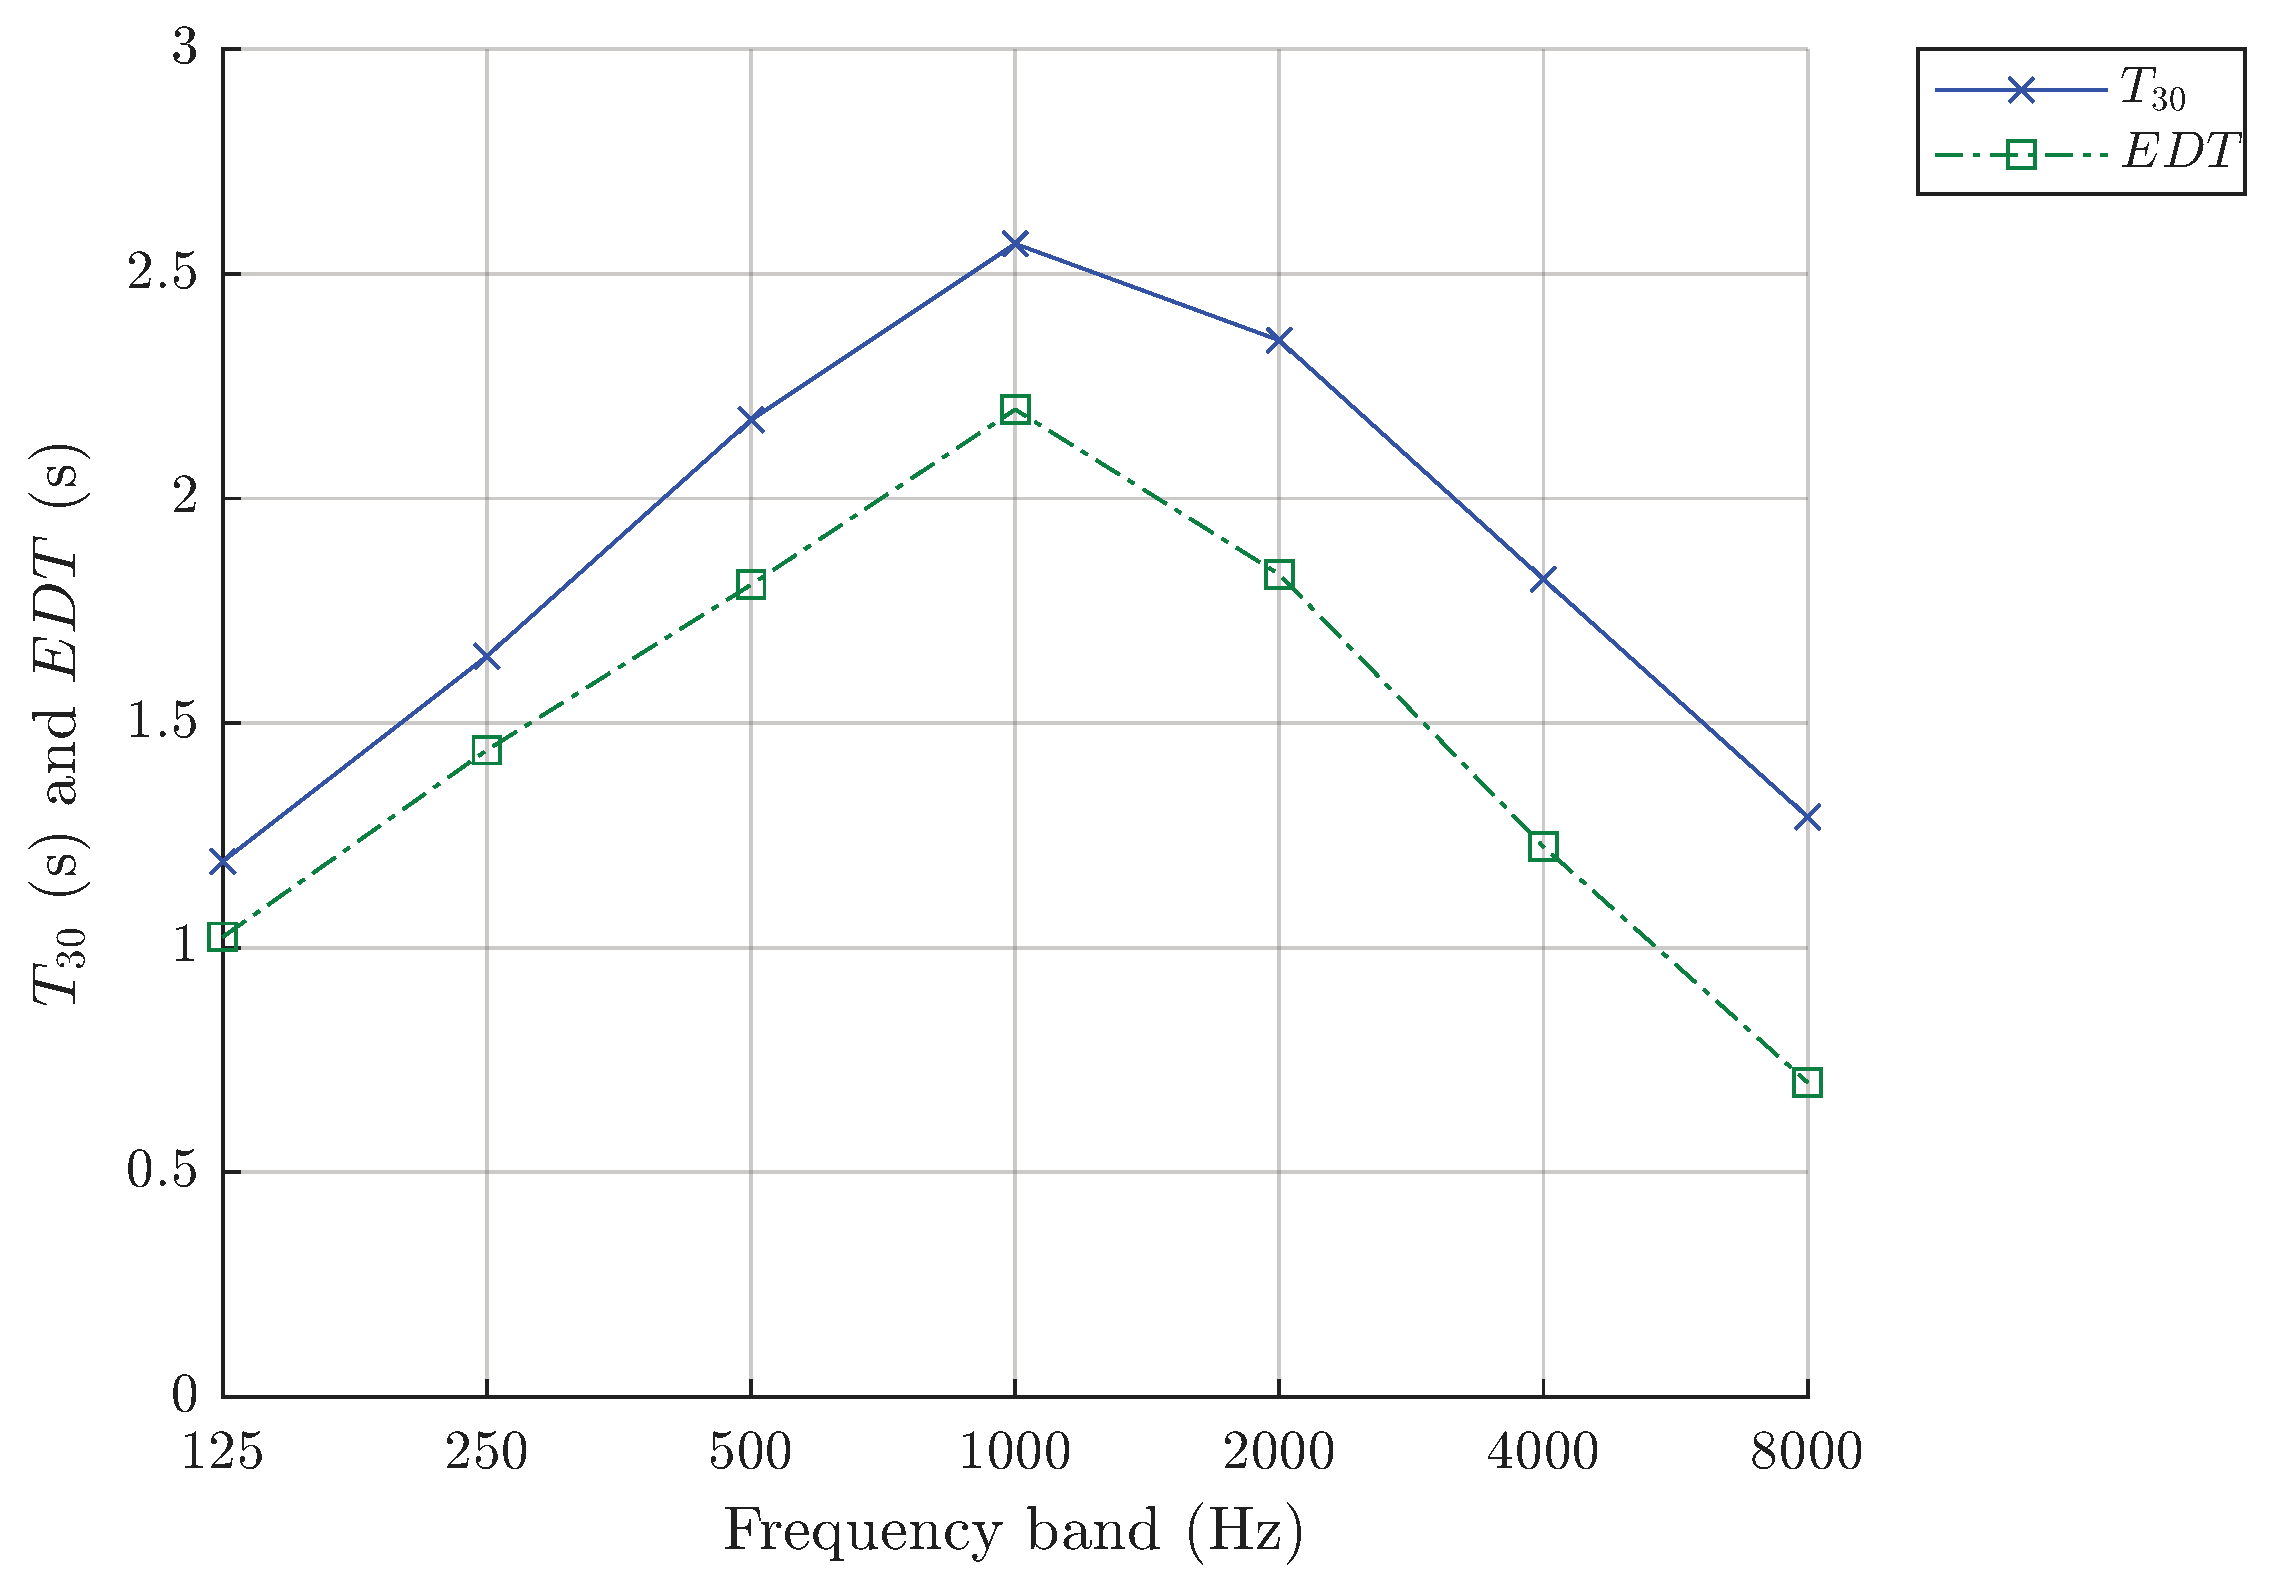
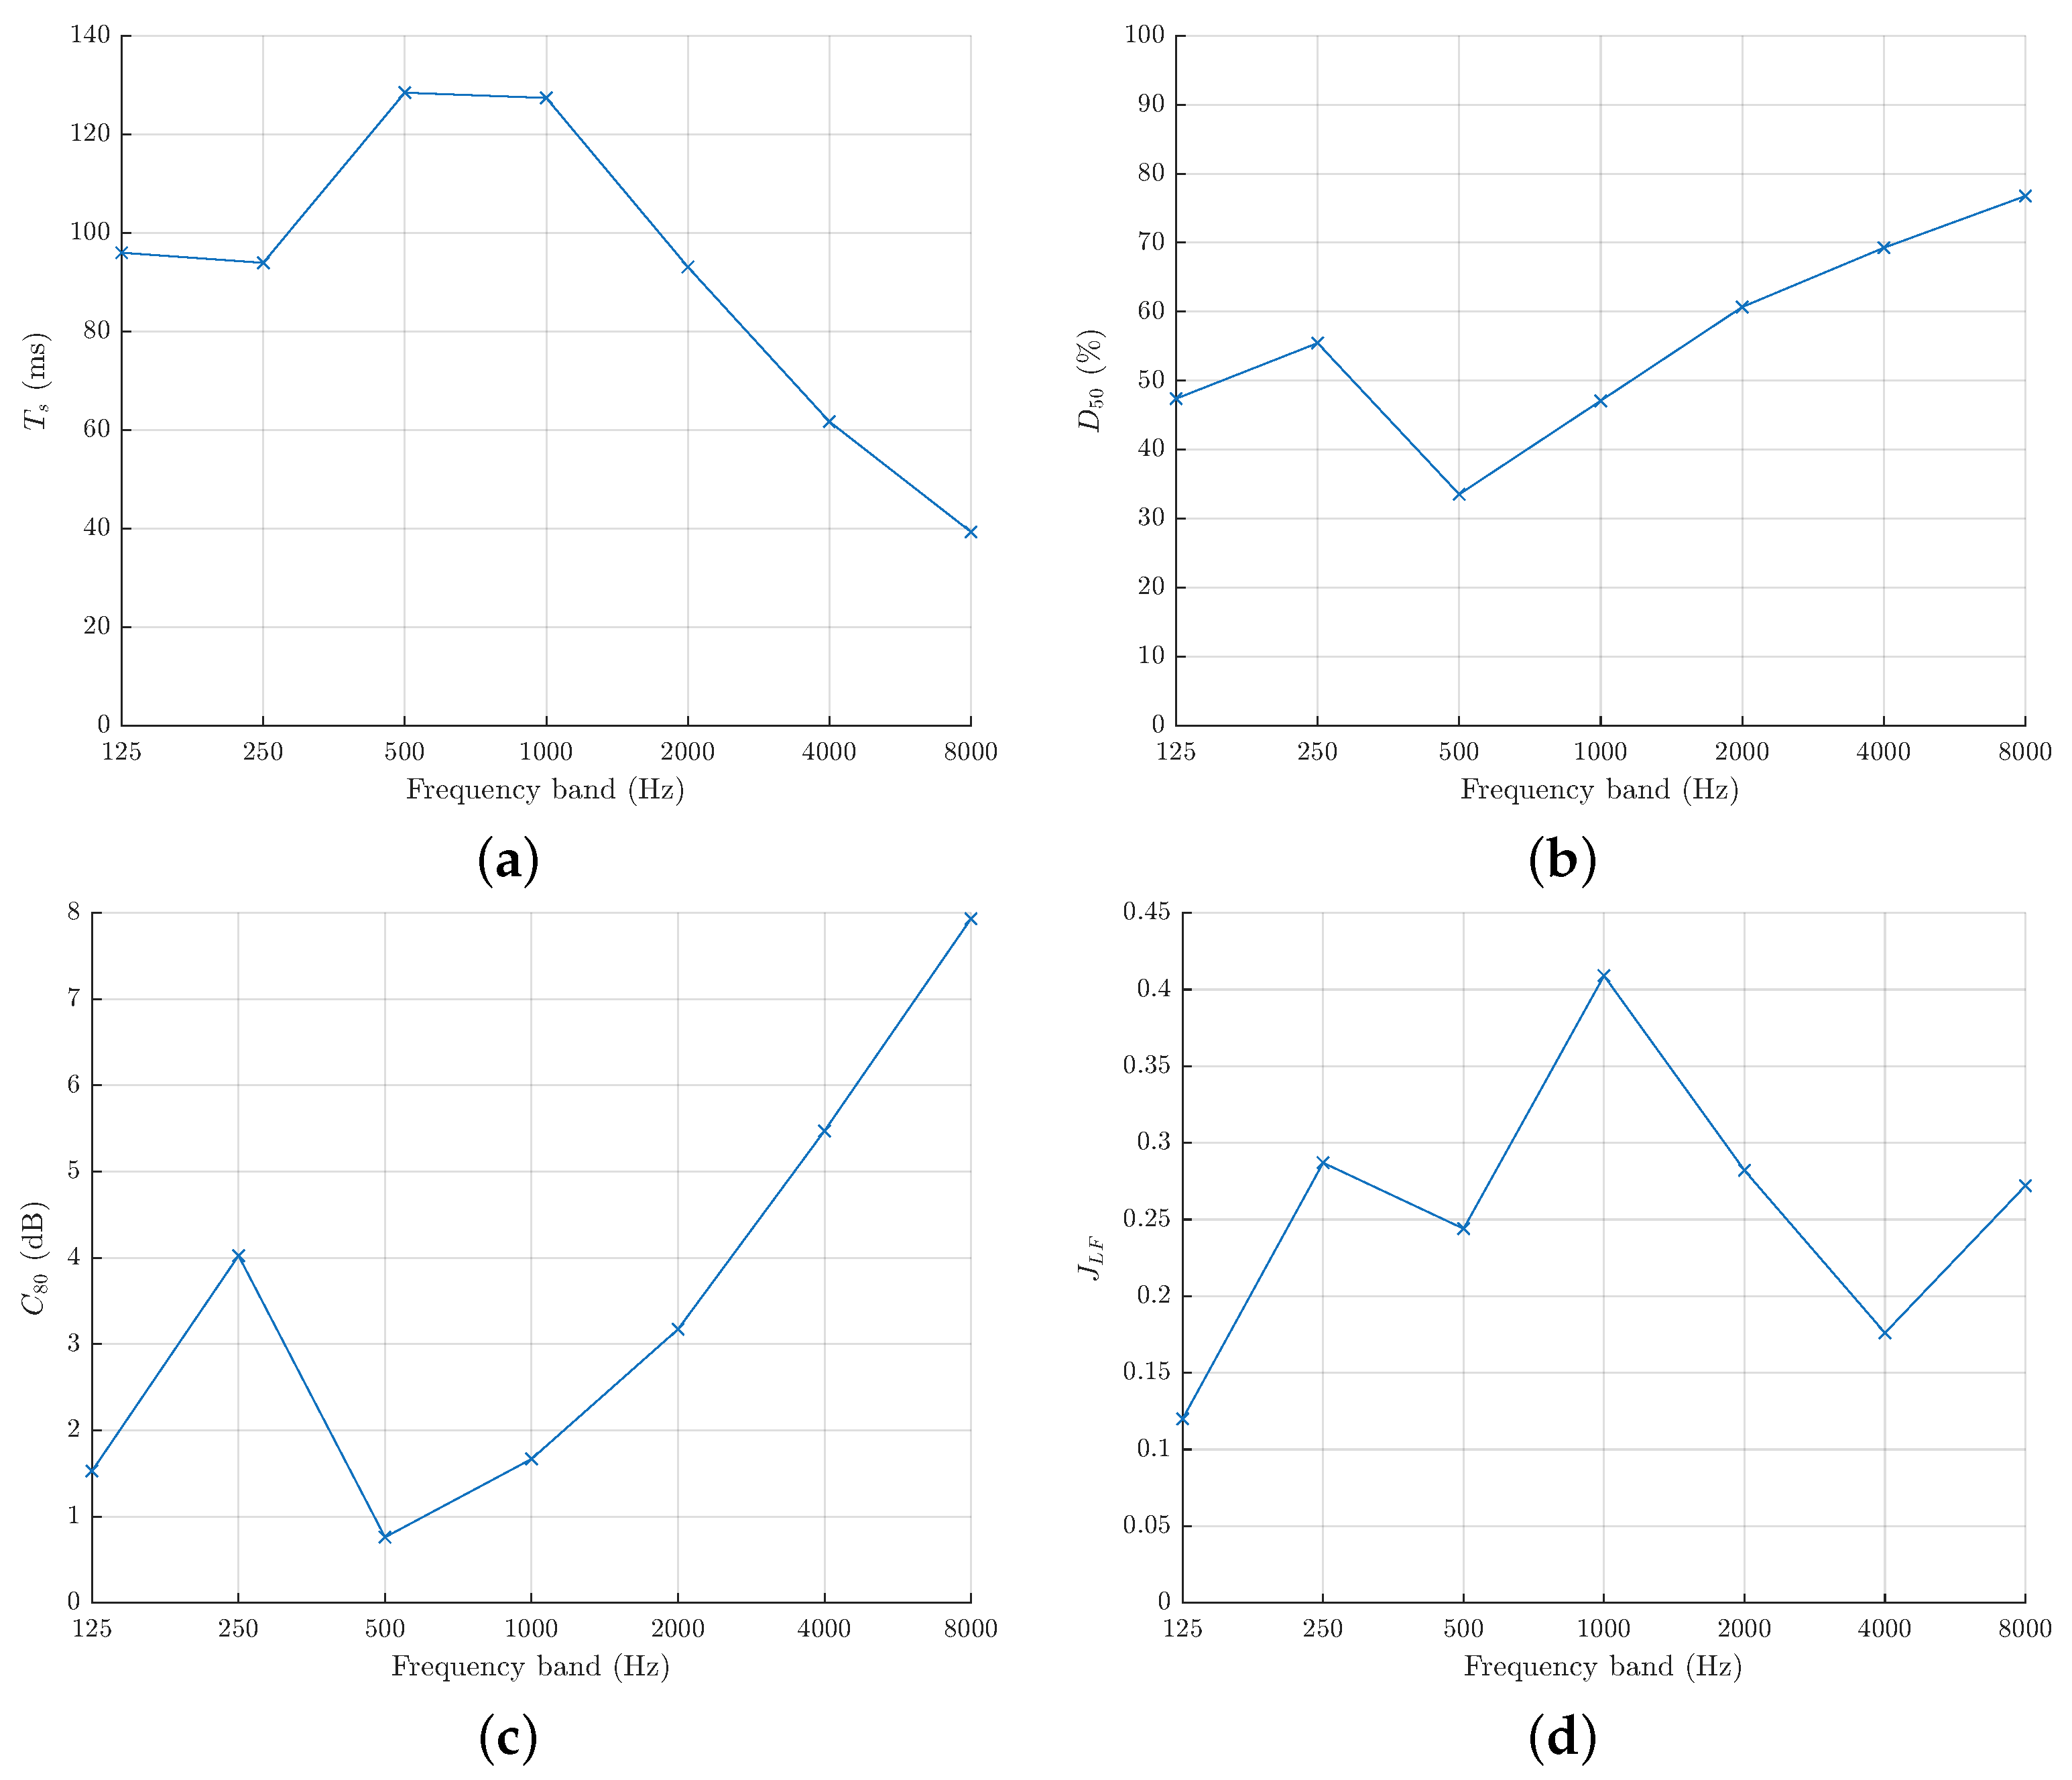
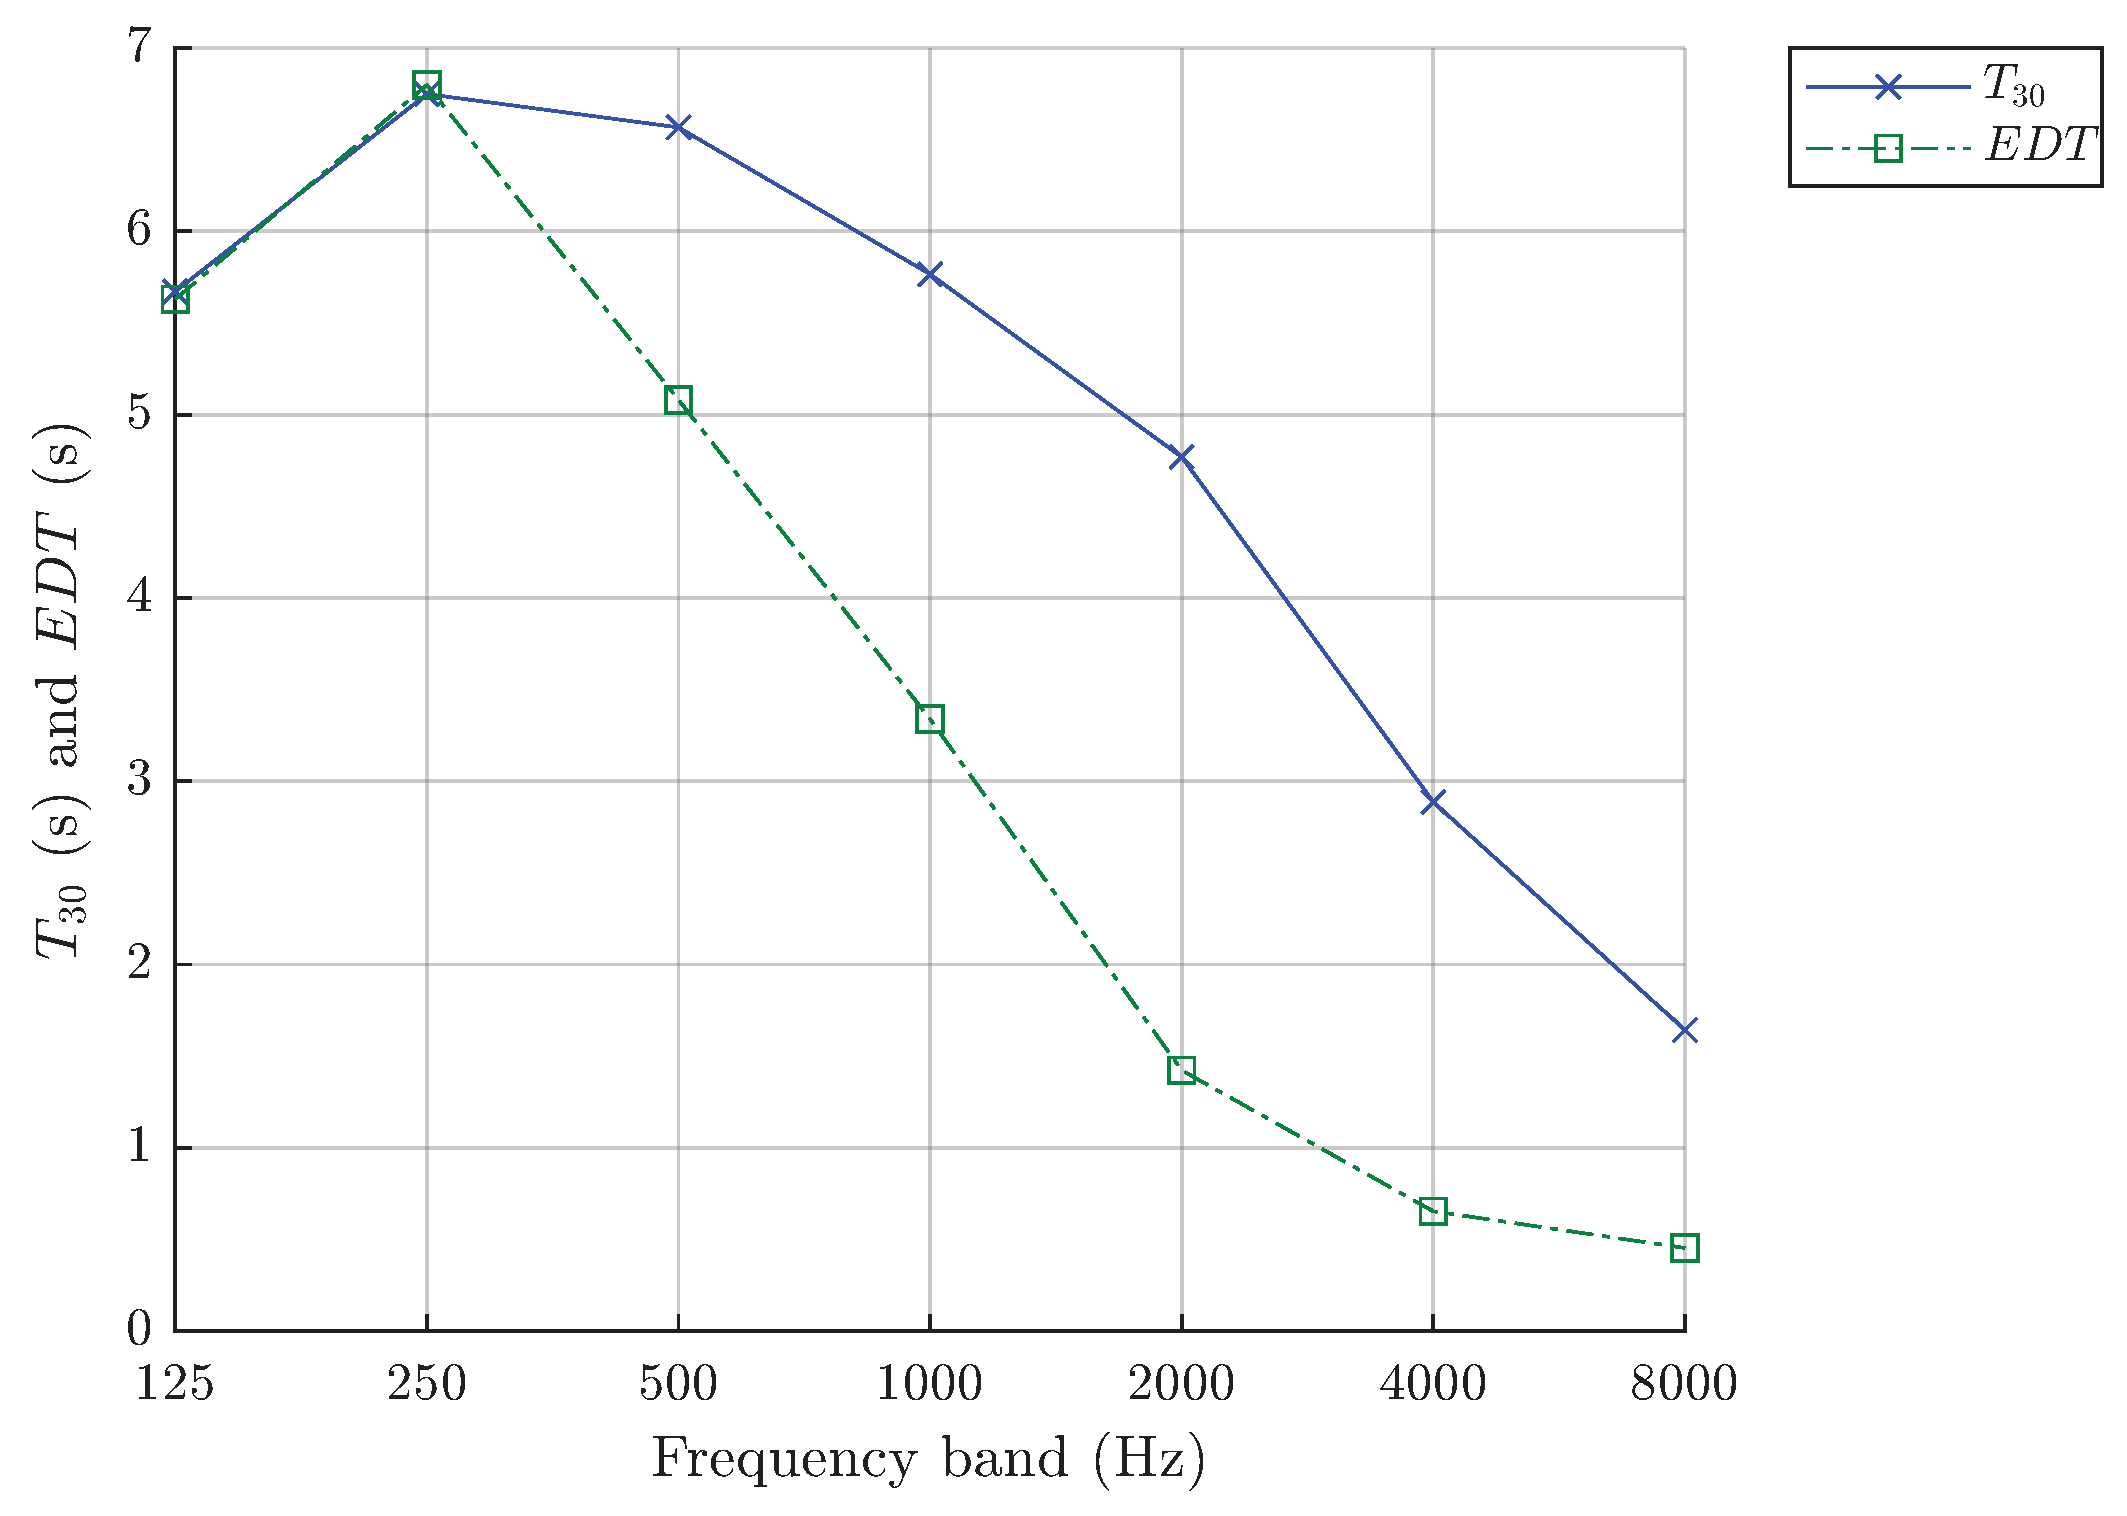
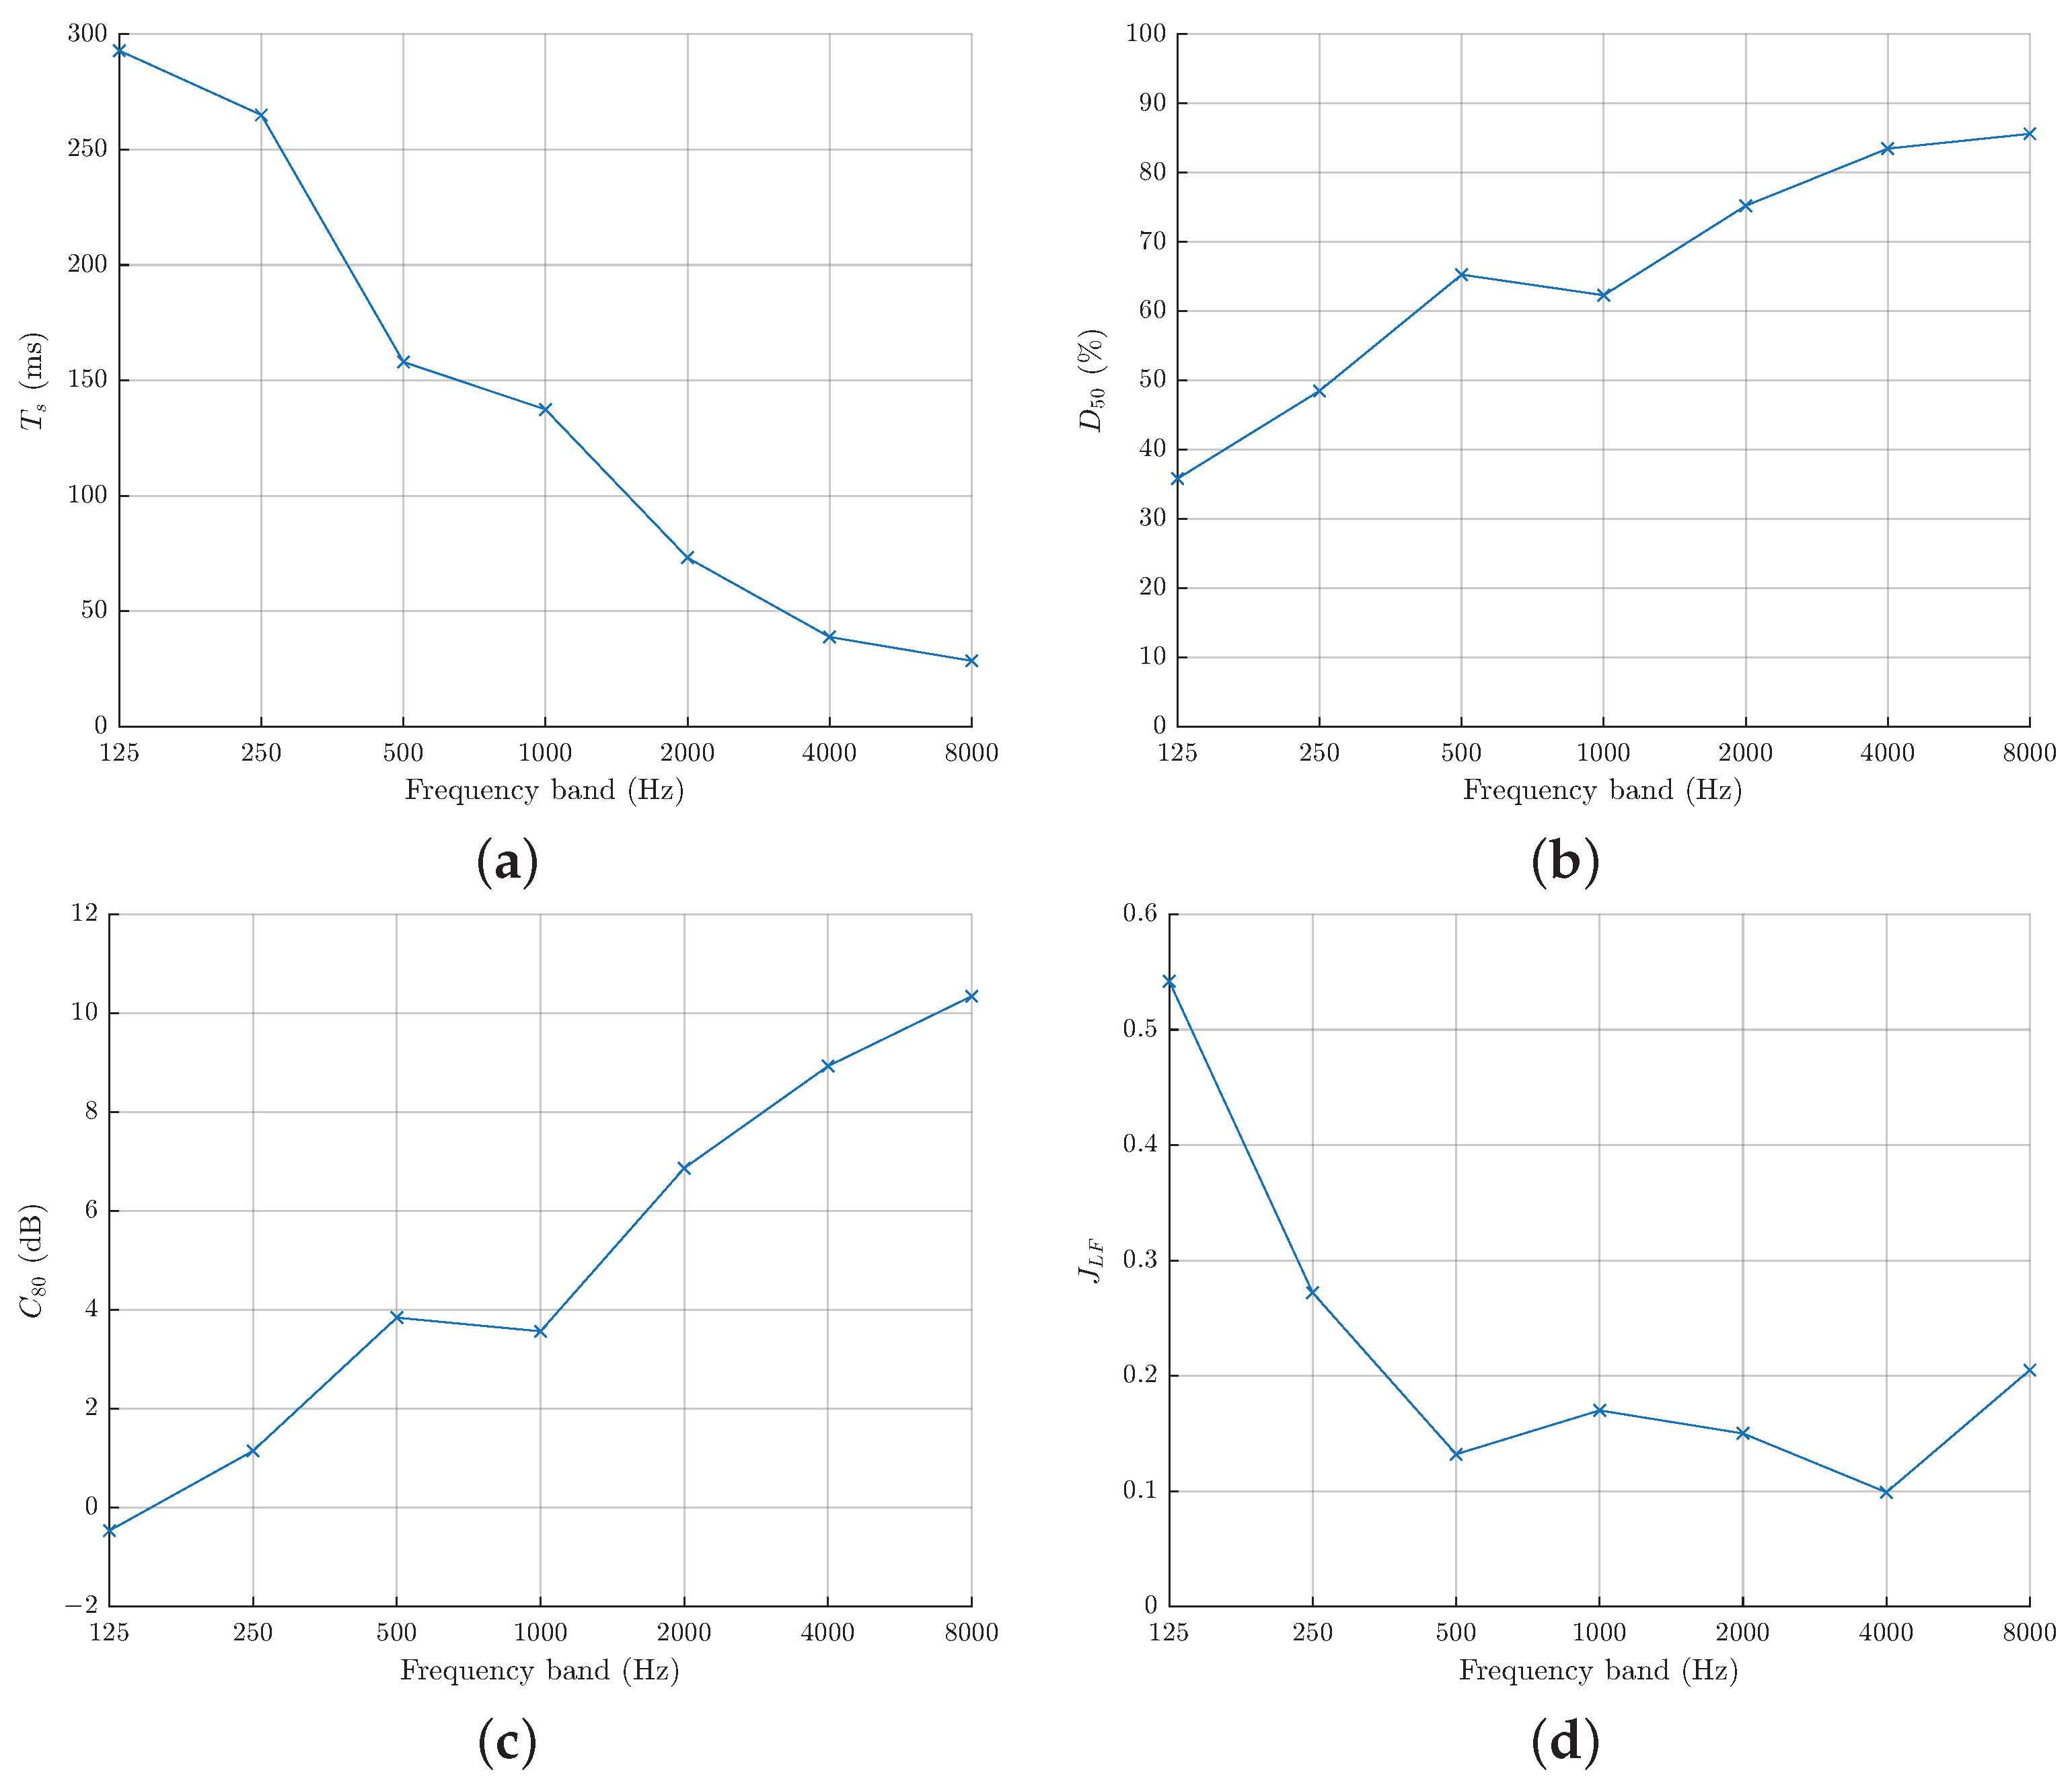
The Library is located at the Triforium Level behind the south-west tower and above the nave, as the area highlighted in red in Figure 6. It has not had any alterations since its original design and completion by Sir Christopher Wren in 1709 [45]. However, at the time that these current measurements were made, the Library was undergoing a major restoration project, and all the collections, books and manuscripts had been removed from the space. Thus, measurements were taken with empty wooden bookshelves, being the original 18th century examples. The Library space is vaulted with stone work at the upper level above the wooden shelving and a plastered ceiling. The total height is 11.8 m, with the bookshelves covering all four walls up to 7 m height and a wooden gallery at the halfway point allowing access to the upper shelving. The recorded temperature and humidity was 25.1 °C and 53%, respectively. The source and receiver were located at the west and east sides of the room, respectively, at a distance of 8.19 m from each other, and a single source–receiver measurement combination was taken in this space. The results for the obtained acoustic parameters T 30 (s), E D T (s), T s (ms), D 50 (%) and C 80 (dB) are presented in Figure 15 and Figure 16, and show an increase in reverberation ( T 30 ) for the middle octave frequency bands centred at 500 Hz, 1 kHz, and 2 kHz.
It is also interesting to note that for the 125 Hz and 500 Hz octave bands the C 80 and D 50 curves are not inverted representations of the T 30 , E D T and T s curves as might usually be expected. From C 80 as shown in Figure 16c, the results indicate the arrival of late energy in the 125 Hz and 500 Hz octave bands, which is also evident for D 50 in Figure 16b and T s in Figure 16a. In comparison, the corresponding values for 250 Hz, indicate more energy from early reflections in this octave band than the adjacent octave bands.
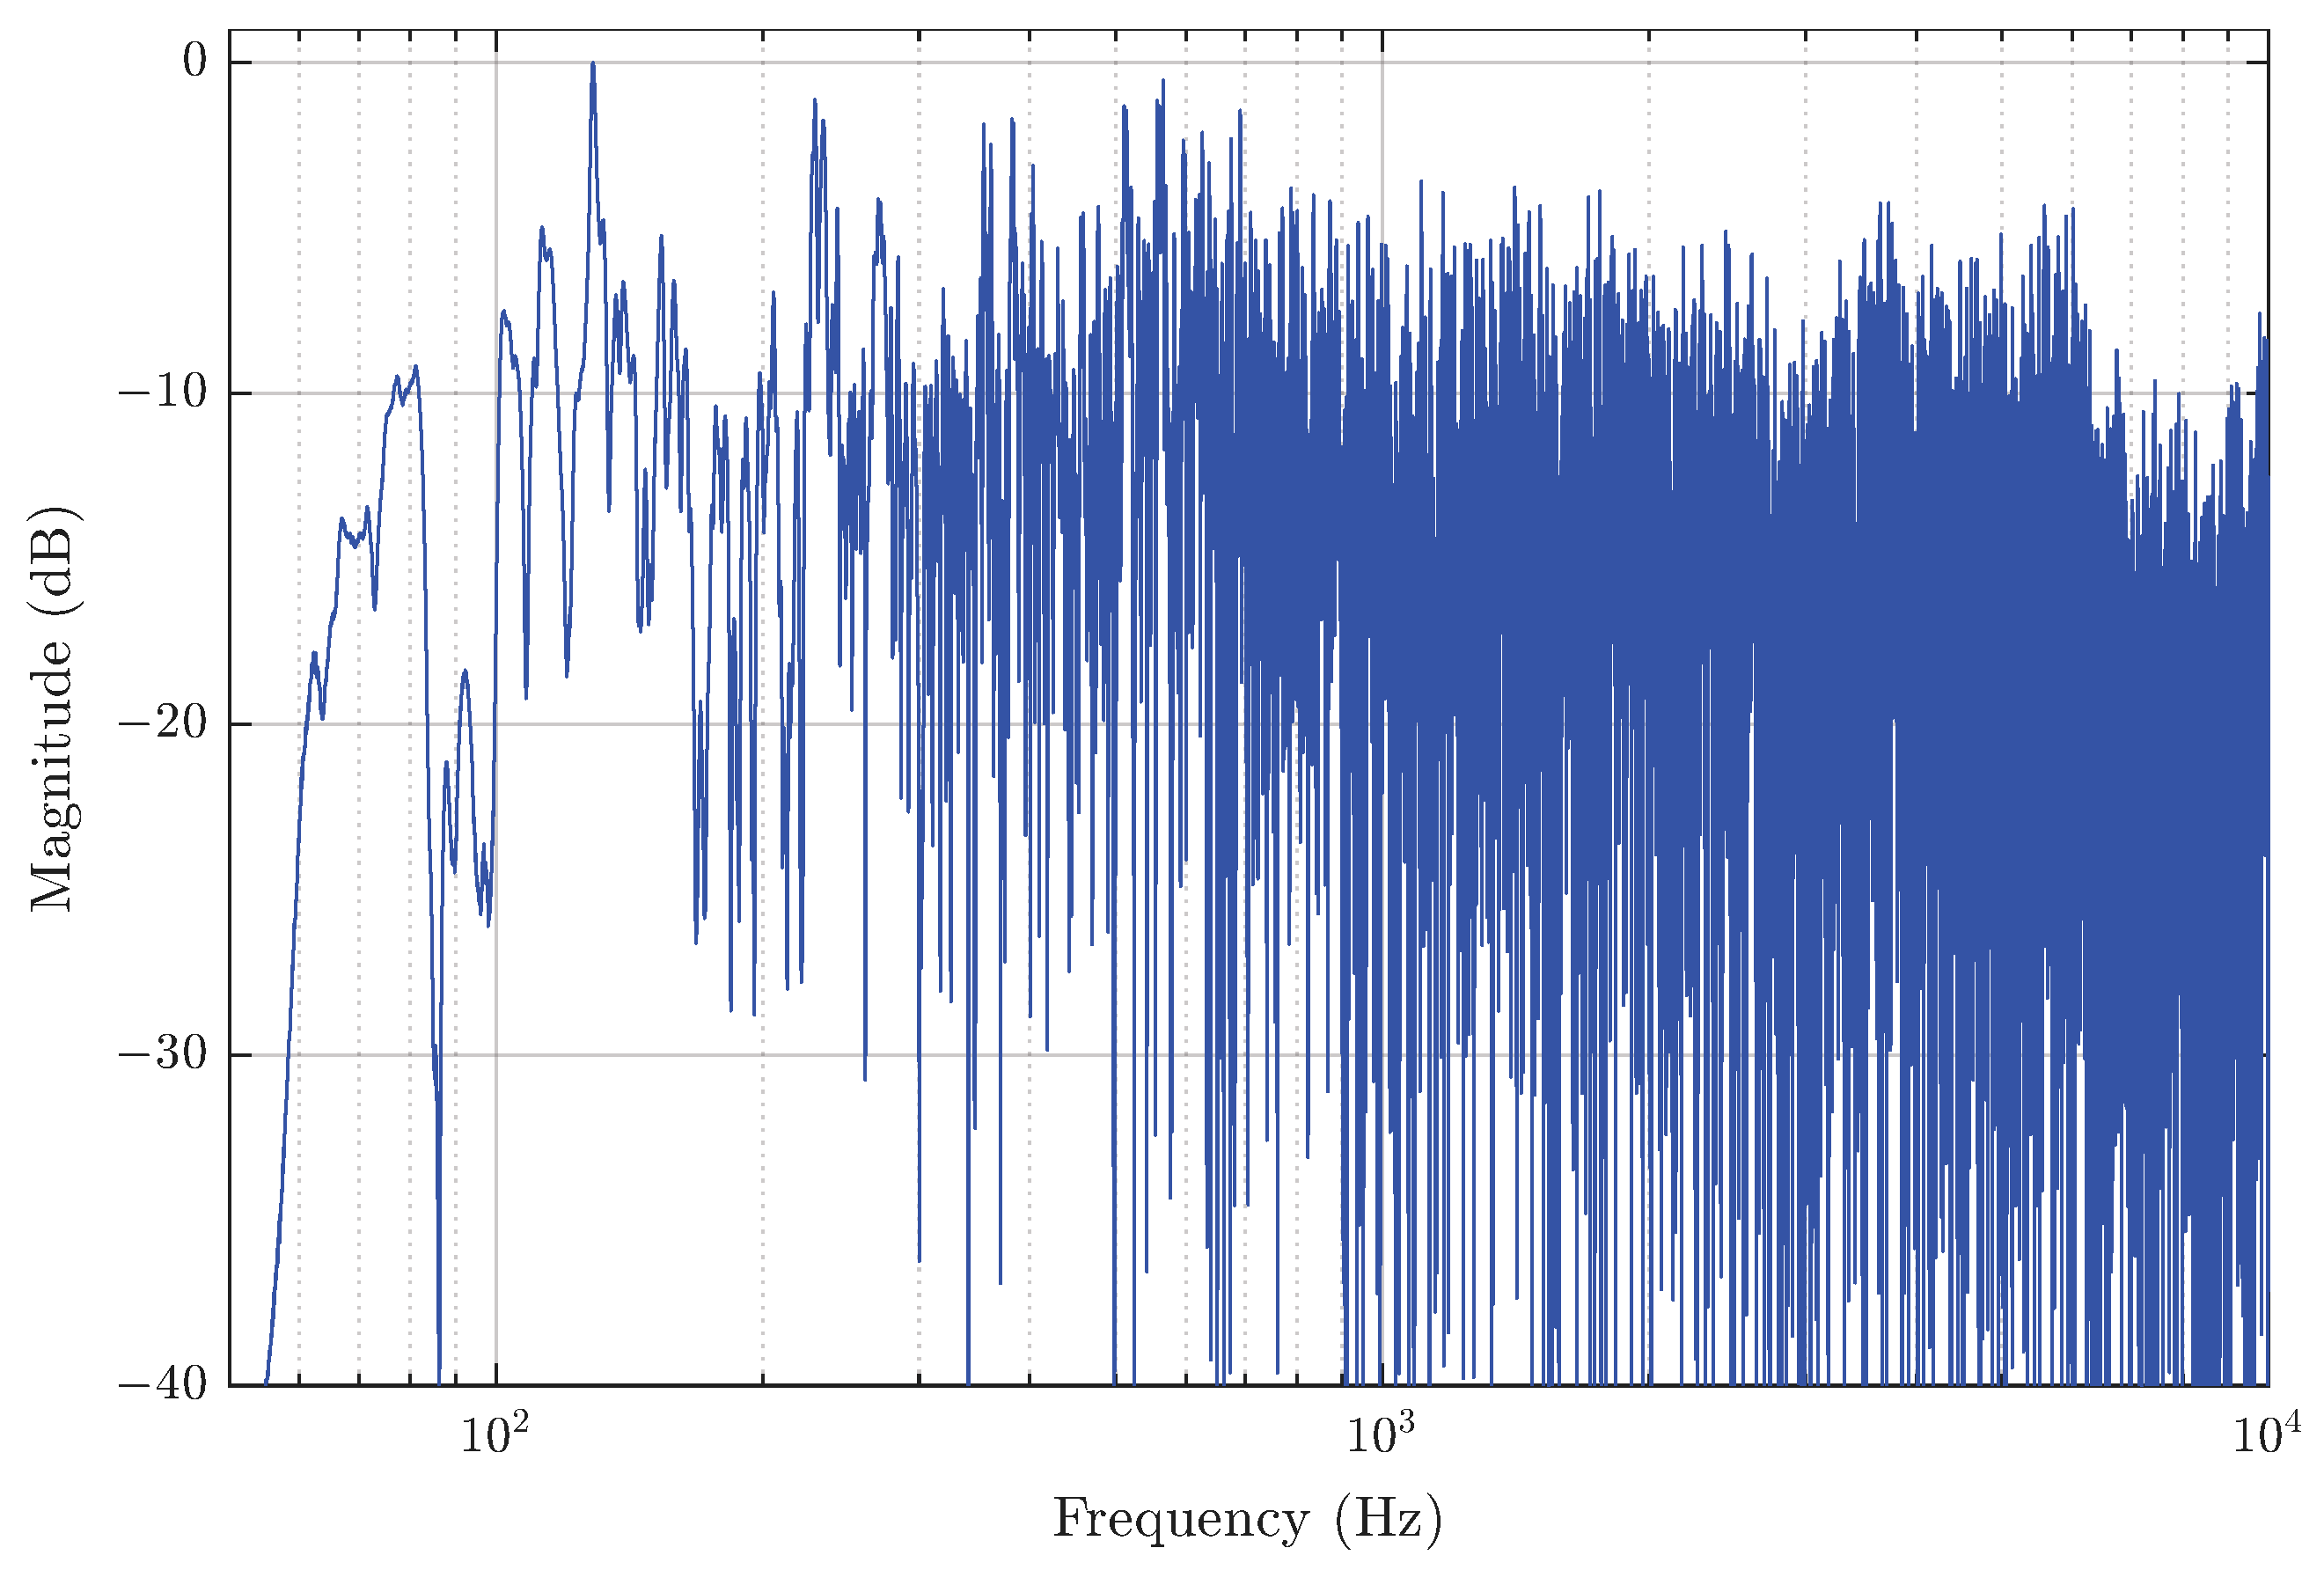
Considering the frequency spectrum obtained from the impulse response measured in the Library, as shown in Figure 17, strong resonant peaks are observed at 129 Hz, 230 Hz, 269 Hz, 356 Hz, 381 Hz, 513 Hz, 562 Hz which confirms the results noted above for the energy-based acoustic parameters across these respective octave bands. As this noted increase in late energy at 125 Hz and 500 Hz is not observed in the J L F results in Figure 16d, it might be reasonable to assume that this energy is incident from the high vaulted upper stone walls and plastered ceiling, with associated reflections arriving at the receiver later from these areas and hence not encapsulated in these J L F values.

5.4. The Geometric (or Dean’s) Staircase

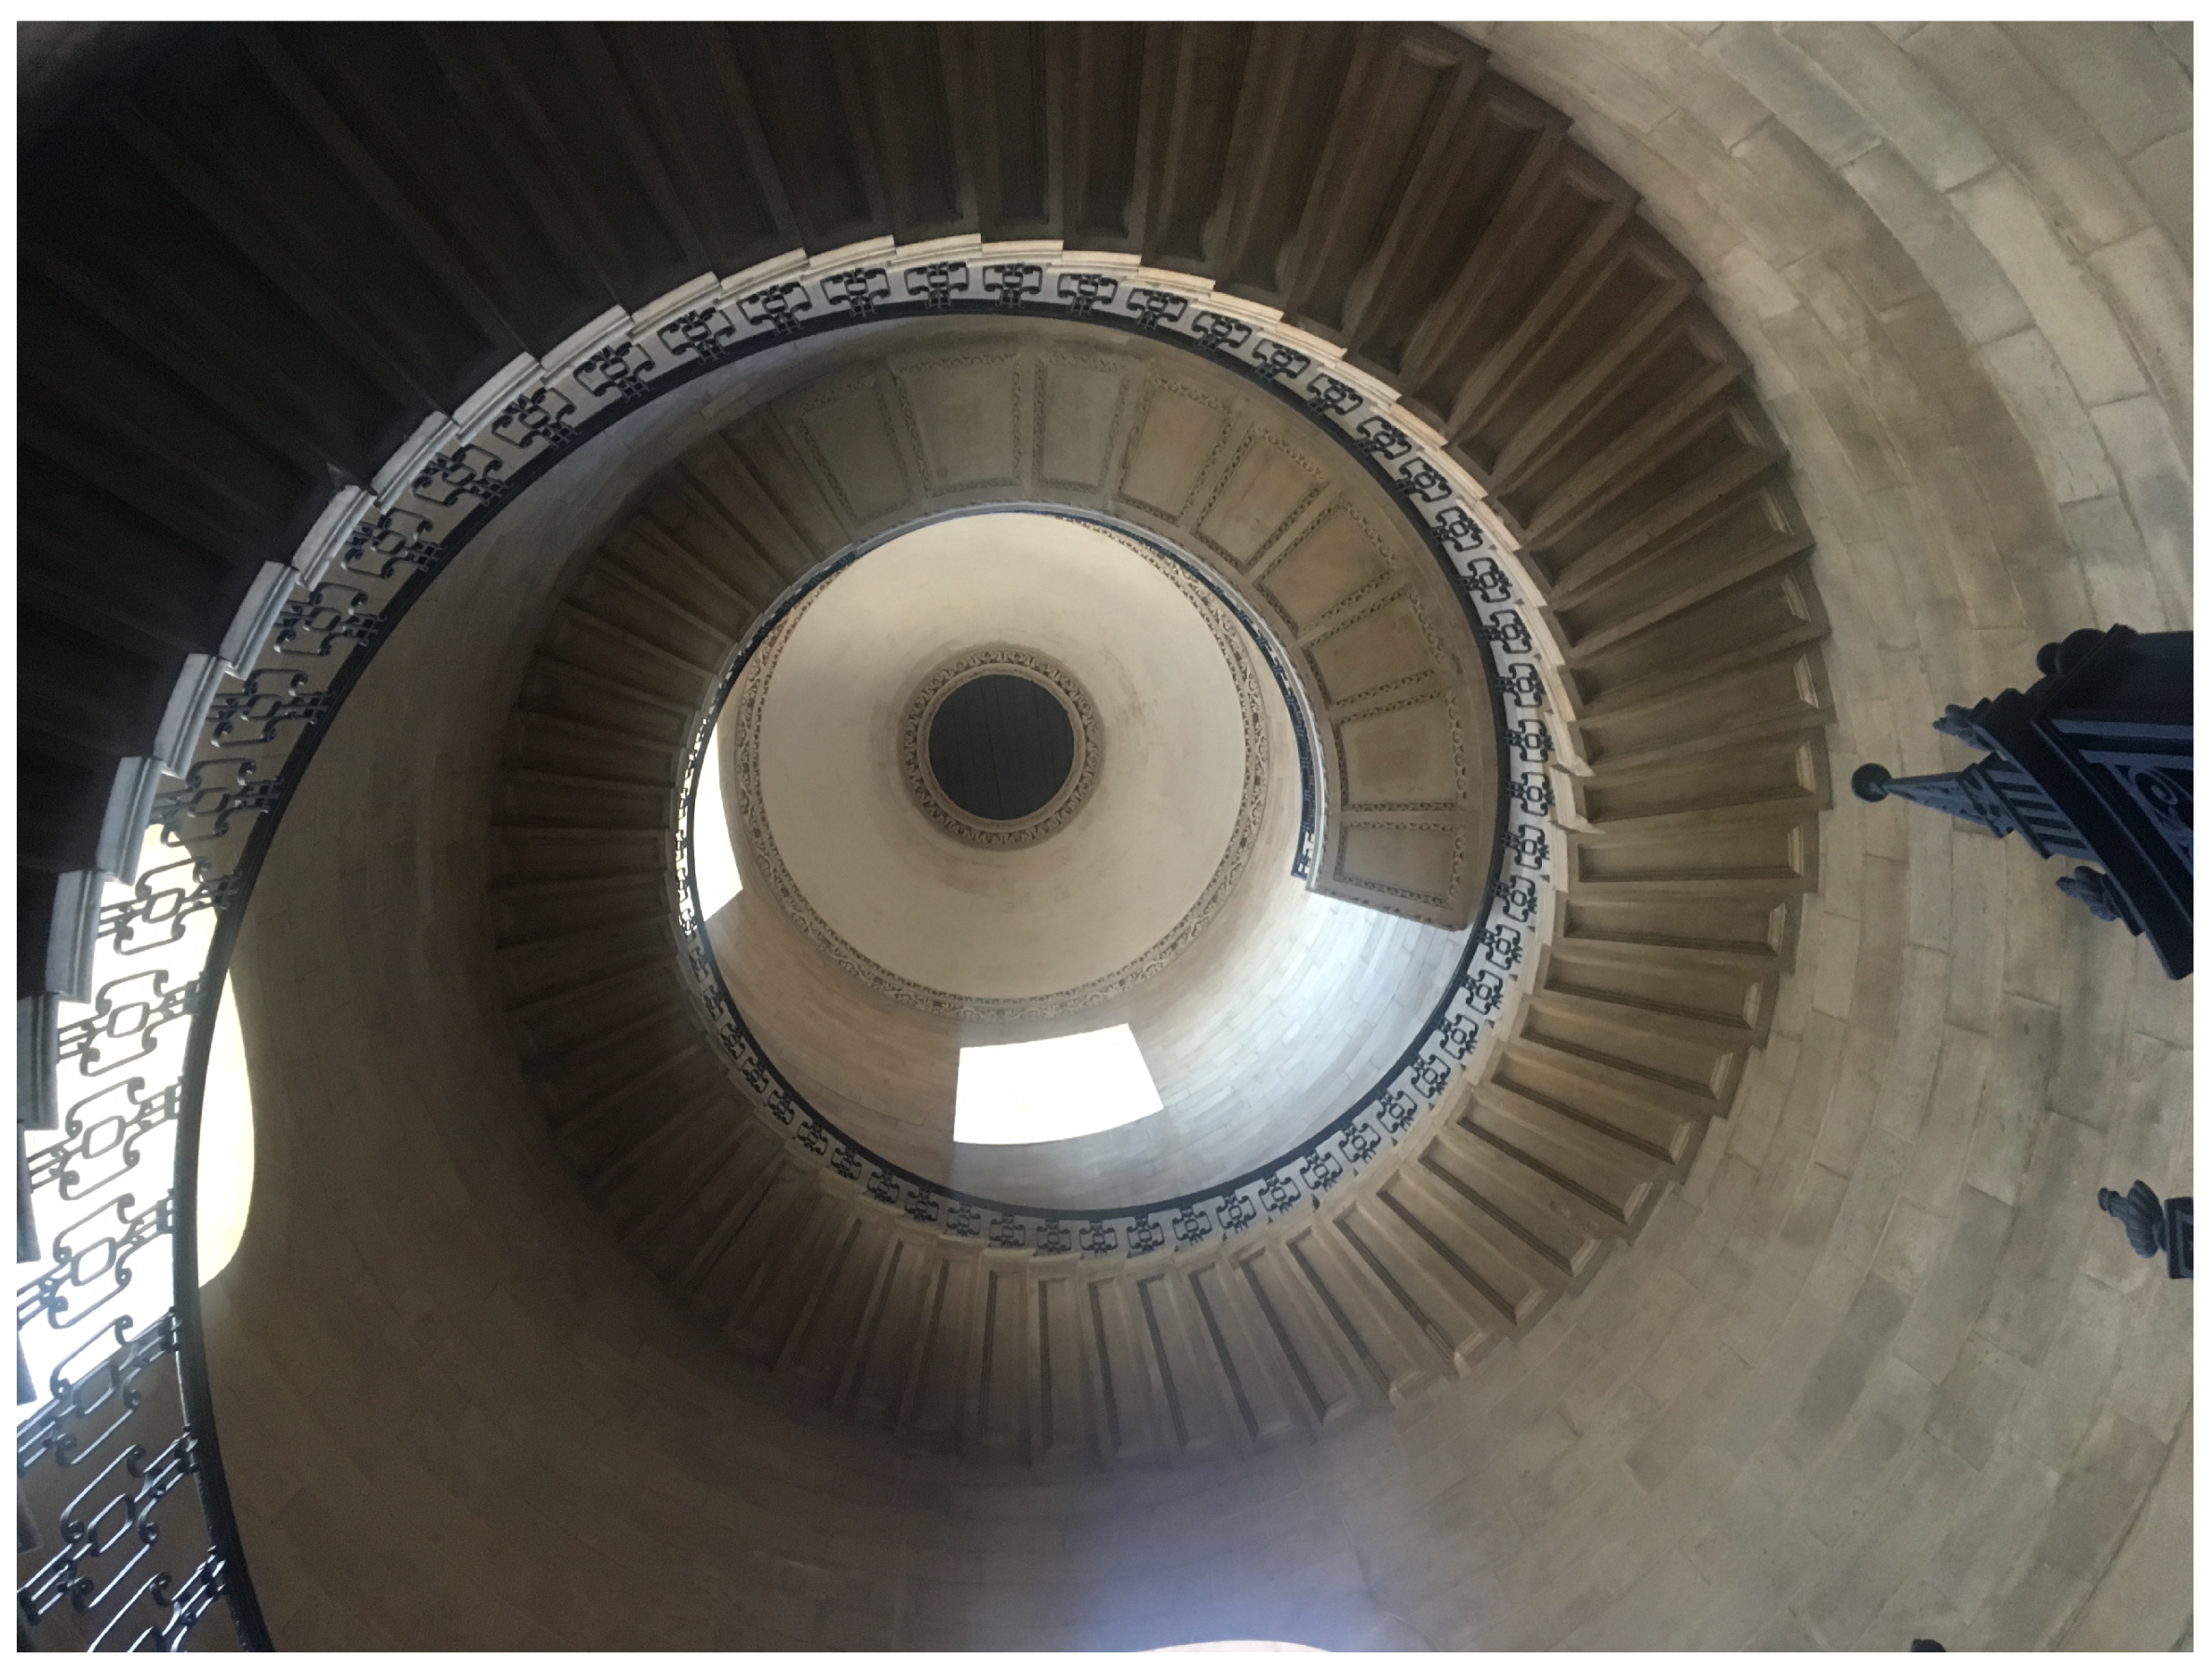
The Geometric Staircase is in the south-west tower of the cathedral (as the area highlighted in green in Figure 6) and rises 31.4 m in height from the ground level to the Triforium Level (as shown in Figure 18) where the Library is located. For this measurement, the source and receiver were located at ground level separated by a distance of 1.9 m. Due to the narrow space, it was not possible to locate the source/receiver transducers 1 m away from the boundaries as recommended by ISO-3382-1 hence the minimum distance of the measurement equipment to the walls of the staircase was 0.6 m. Results obtained from this position are presented in Figure 19 and Figure 20.
As with the measurements obtained from DsDr and the Whispering Gallery, the significant difference between the T 30 and E D T values is most likely due to the lack of strong early reflections from the ceiling. This can also be verified by the clear differences in the results obtained across octave bands for all of the energy-based parameters as shown in Figure 20.

5.5. Speech Intelligibility—Articulation

For the estimation of relevant speech intelligibility parameters, more specifically the Speech Transmission Index (STI), each impulse response was imported into ODEON Auditorium [47] and STI calculations was carried out via ODEON tools. The background noise levels obtained for each impulse response from the Aurora tool v.12.2.23-alpha [42] were used for the background noise settings for the corresponding measurements before these software calculations.
The results for the objective evaluation of STI at positions DsNr, NsDr (evaluated as ‘Poor’) and DsDr (evaluated as ‘Fair’) can be compared to the measurement positions used for the subjective tests in previous studies [2,30,36], corresponding to locations between positions 2 and 3, and 5 and 6, as shown in Figure 2 and presented in Table 1 and Table 2, and summarised in Table 3 referred to as positions 2–3 and 5–6, respectively. Position 2–3 was evaluated as ‘Good’ in Parkin’s tests [30] and ‘Bad’ in Lewers’ and Anderson’s tests [2,36]. Position 5–6 was evaluated as ‘Bad’ in all of these earlier studies. These are, however, only observations, and an objective comparison between the results obtained across these studies cannot be carried out directly. All tests have varied in the equipment and methodology used, some even using human subjects, and reflect the technology, standards and best practice of the time (as does this study), as was also emphasised by Anderson et al. [36] in 1986 who pointed out the differences between subjective and objective tests carried out within the Cathedral by the different research teams over the years.

6. Summarising Observations

This paper has revisited the acoustic measurement techniques and results obtained from studies within the confines of St Paul’s Cathedral since 1952. It also reports on the latest addition to this body of work through measurements carried out by the authors in 2022 with state-of-the art equipment and current best practice impulse response acoustic measurement techniques. An overall comparison of the older methods with the latest approach has been presented, which offers valuable information on the development and implementation of architectural acoustic studies for spaces such as St Paul’s Cathedral. In addition, the complexity of the acoustic properties at the floor level of the cathedral as well as in the Whispering Gallery has been re-emphasised.
Due to the size of the cathedral, the highly reflective materials used in its construction and also its many connected subspaces that result in acoustic coupling effects to the main floor of the cathedral nave, reverberation time is strongly dependent on the measurement positions selected and air absorption at high frequencies. This can be evidenced in all previous studies, while a similar effect was also discussed for the results obtained from the measurements of Cathédrale Notre-Dame de Paris in 2015 [9]. The recent measurements in St Paul’s Cathedral provide a more detailed observation of early-to-late reflections via E D T and other energy-based parameters. The clear differences observed between T 30 and E D T values verify the acoustic complexity of the space and the impact of connected subspaces on the results obtained.
The comparison of reverberation times obtained from all previous measurements (1952–2022) is not straightforward: the measurement positions are not exactly the same; there have been changes to different features of the cathedral structure that may have an impact on the results; and, most importantly, the measurement techniques and equipment have—arguably—improved over the years to a point that these most recent results should offer a considerable improvement in terms of signal-to-noise ratio, frequency response, repeatability, etc. For information, however, Table 4 presents the reverberation time values obtained for a source located below the dome and a receiver in the nave of the empty cathedral from each of the presented studies. The differences are more noticeable for the lower-frequency bands (125 Hz and 250 Hz) with values lowest in the latest measurements (2022). While it is not possible to directly compare the results, it is noted that the rise in recorded temperature (from 17 °C in 1984 to almost 24 °C in 2022) would have an impact, especially for the frequency octave bands above 1 kHz [48,49].
Regarding the speech intelligibility and articulation tests, it is even more difficult to make absolute comparisons between values and draw conclusions, as each study has represented a specific condition of the cathedral that cannot be compared directly. General observations, however, can be made across all of the presented studies, including both the subjective tests within the space and objective results obtained from acoustic measurements. Speech intelligibility between someone talking and located below the dome, and a listener within the nave is Bad to Poor and the introduced sound reinforcement systems have improved intelligibility for this area. Measurements that have both source and receiver/listener beneath the dome have shown Fair intelligibility.
While ISO-3382-1:2009 standards have been followed in detail for the analyses of the obtained results, not all the recommendations from these standards were used during the measurements. Firstly, a directional source has been used instead of the recommended omnidirectional source (for the reasons discussed in Section 5) and, secondly, it was not possible to keep the microphone position at least 1 m away from all reflecting surfaces in all cases. The directional source offers the opportunity to reveal that the unique and distinctive characteristics of the Whispering Gallery are in part dependent upon the directionality and orientation of the sound source, which had not been demonstrated in any previous studies. The impact of the ’neck’ that connects the interior dome with the middle-inner cone, however, as shown in Figure 1, and also questioned by Lewers [2], has, as yet, not been understood. This aspect needs further exploration, and future measurements from or towards the middle dome could provide a better understanding of the acoustic impact of the Whispering Gallery.
The 2022 measurements were initially aimed at capturing impulse responses for auralisation purposes. As a result, the directional sound source used and the limited sample of possible positions due to the time available to complete the work within this busy and much used cathedral did not allow for a wider spatial acoustic mapping of the interior space. There is, however, a wider value to these results, and in their contextualisation with previous measurement approaches, for both preservation and any future potential restoration of this historical site. Hence, further investigations are yet still needed to fully characterise and better understand the acoustic behaviour and differences observed across this large, complex and most architecturally—and acoustically—beautiful historic space.

Author Contributions

Conceptualisation, A.F., D.M. and F.S.; methodology, A.F. and D.M.; software, A.F. and F.S.; validation, A.F. and D.M.; formal analysis, A.F. and F.S.; investigation, A.F. and D.M.; resources, A.F., D.M. and F.S.; data curation, A.F. and F.S.; writing—original draft preparation, A.F.; writing—review and editing, A.F. and D.M.; visualisation, A.F. and F.S.; supervision, D.M.; project administration, A.F., D.M. and F.S.; funding acquisition, D.M. All authors have read and agreed to the published version of the manuscript.

Funding

This project is part of the EU JPI-CH PHE (20-JPIC-0002-FS) (the Past Has Ears) project and has been supported in part by the UK Arts and Humanities Research Council (AHRC) grant number AH/V001094/1, and in part by the UK Arts and Humanities Research Council (AHRC) XR Stories Creative Industries Cluster project, grant no. AH/S002839/1.

Institutional Review Board Statement

Not applicable.

Informed Consent Statement

Not applicable.

Data Availability Statement

Impulse responses and auralisation results from all measured positions and spaces will be included post-review and prior to final publication on the OpenAir database [50].

Acknowledgments

The authors would like to thank Patrick John Jones for giving us the opportunity to contribute to his work Marble Anthem [7] via the acoustic measurements of St Paul’s Cathedral, which data has formed the core of this paper. Thanks to the St Paul’s team for providing access to the site and specifically to Simon Carter for his guidance in formative discussions, for an in situ tour and during the measurement work.

Conflicts of Interest

The authors declare no conflicts of interest.

References

  1. Higgott, G. The Wren Office Drawings. Available online: https://www.stpauls.co.uk/wren-office-drawings (accessed on 10 February 2025).
  2. Lewers, T.H.; Anderson, J.S. Some Acoustical Properties of St Paul’s Cathedral, London. J. Sound Vib. 1984, 92, 285–297. [Google Scholar] [CrossRef]
  3. Sabine, W.C. Collected Papers on Acoustics; Harvard University Press: Cambridge, UK, 1922; pp. 270–276. [Google Scholar]
  4. Everest, F.A. Master Handbook of Acoustics; McGraw-Hill: New York, NY, USA, 2001; pp. 240–243. [Google Scholar]
  5. Zhang, M. St. Paul’s Cathedral Dome: A Synthesis of Engineering and Art. Myles Zhang: Digital Portfolio. 2022. Available online: https://www.myleszhang.org/2020/04/16/st-pauls-cathedral/ (accessed on 28 April 2025).
  6. Wren, C. Engaving After Sir Christopher Wren: St. Paul’s Cathedral Church—Geometrical Section of the Dome Transepts &x from North to South, 1810; Object Number 16/1283; Royal Academy of Arts: London, UK, 1810. [Google Scholar]
  7. Jones, P.J. Marble Anthem: Composer Patrick John Jones’ Response to the Monument to Sir John Stainer (1840–1901) by Henry Pegram, 1903. Available online: https://pantheons-st-pauls.york.ac.uk/voice/patrick-john-jones/ (accessed on 15 April 2025).
  8. Tronchin, L.; Farina, A. Acoustics of the former teatro “la fenice” in Venice. AES J. Audio Eng. Soc. 1997, 45, 1051–1062. [Google Scholar]
  9. Katz, B.F.G.; Weber, A. An Acoustic Survey of the Cathédrale Notre-Dame de Paris before and after the Fire of 2019. Acoustics 2020, 2, 791–802. [Google Scholar] [CrossRef]
  10. Alvarez-Morales, L.; Zamarreño, T.; Girón, S.; Galindo, M. A methodology for the study of the acoustic environment of Catholic cathedrals: Application to the Cathedral of Malaga. Build. Environ. 2014, 72, 102–115. [Google Scholar] [CrossRef]
  11. Galindo, M.; Zamarreño, T.; Girón, S. Acoustic Simulations of Mudejar-Gothic Churches. J. Acoust. Soc. Am. 2009, 126, 1207–1218. [Google Scholar] [CrossRef]
  12. Weitze, C.; Rindel, J.; Christensen, C.; Gade, A. History of Hagia Sophia revived through computer simulation. In Proceedings of the Forum Acusticum, Sevilla, Spain, 16–20 September 2002; Available online: https://citeseerx.ist.psu.edu/document?repid=rep1&type=pdf&doi=1dd300652cc2d042b1abda5f77f0044ec835aa30 (accessed on 15 April 2025).
  13. Sert, F.Y.; Karaman, Ö.Y. An Investigation on the Effects of Architectural Features on Acoustical Environment of Historical Mosques. Acoustics 2021, 3, 559–580. [Google Scholar] [CrossRef]
  14. Andou, A. Measurement of acoustical characterictics of mosques in Saudi Arabia. J. Acoust. Soc. Am. 2003, 113, 1505–1517. [Google Scholar] [CrossRef]
  15. Segura, J.; Giménez, A.; Romero, J.; Cerdá, S. A comparison of different techniques for simulating and measuring acoustic parameters in a place of worship: Sant Jaume Basilica in Valencia, Spain. Acta Acust. United Acust. 2011, 97, 155–170. [Google Scholar] [CrossRef]
  16. Martellotta, F. Identifying acoustical coupling by measurements and prediction-models for St. Peter’s Basilica in Rome. J. Acoust. Soc. Am. 2009, 126, 1175–1186. [Google Scholar] [CrossRef]
  17. Autio, H.; Barbagallo, M.; Ask, C.; Bard Hagberg, D.; Lindqvist Sandgren, E.; Strinnholm Lagergren, K. Historically Based Room Acoustic Analysis and Auralization of a Church in the 1470s. Appl. Sci. 2021, 11, 1586. [Google Scholar] [CrossRef]
  18. Duran, S.; Chambers, M.; Kanellopoulos, I. An Archaeoacoustics Analysis of Cistercian Architecture: The Case of the Beaulieu Abbey. Acoustics 2021, 3, 252–269. [Google Scholar] [CrossRef]
  19. Martellotta, F.; Cirillo, E.; Carbonari, A.; Ricciardi, P. Guidelines for acoustical measurements in churches. Appl. Acoust. 2009, 70, 378–388. [Google Scholar] [CrossRef]
  20. Cirillo, E.; Martellotta, F. Sound propagation and energy relations in churches. J. Acoust. Soc. Am. 2005, 118, 232–248. [Google Scholar] [CrossRef]
  21. Cirillo, E.; Martellotta, F. Worship, Acoustics and Architecture. Build. Acoust. 2007, 14, 241. [Google Scholar] [CrossRef]
  22. Girón, S.; Alvarez-Morales, L.; Zamarreño, T. Church acoustics: A state-of-the-art review after several decades of research. J. Sound Vib. 2017, 411, 378–408. [Google Scholar] [CrossRef]
  23. Di Loreto, S.; Pierantozzi, M.; Lori, V.; Serpilli, F. Impact of Architectural Styles on Acoustic Characteristics in Selected European Churches. Architecture 2025, 5, 5. [Google Scholar] [CrossRef]
  24. Anderson, J.S.; Bratos-Anderson, M. Acoustic coupling effects in St Paul’s Cathedral, London. J. Sound Vib. 2000, 236, 209–225. [Google Scholar] [CrossRef]
  25. Foteinou, A.; Cooper, J.P.D.; Murphy, D. Acoustics, Audibility and Political Culture in the House of Commons, 1800–34. Parl. Hist. 2024, 43, 316–337. [Google Scholar] [CrossRef]
  26. Virtual St Paul’s Cathedral Project. Available online: https://vpcathedral.chass.ncsu.edu/ (accessed on 30 January 2025).
  27. Report from the Select Committee on House of Commons Buildings; Together with the Minutes of Evidence Taken Before Them, (HC 1833, 104), House of Commons Parliamentary Papers Online.
  28. Walker, J. The Amateur Scientist. Sci. Am. 1978, 239, 179–187. Available online: https://www.jstor.org/stable/24955831 (accessed on 3 February 2025). [CrossRef]
  29. Raman, C.V.; Sutherland, G.A. Whispering-Gallery Phenomena at St. Paul’s Cathedral. Nature 1921, 108, 42. [Google Scholar] [CrossRef]
  30. Parkin, P.H.; Taylor, J.H. Speech reinforcement in St. Paul’s Cathedral–experimental system using line-source loudspeakers and time delays. Wirel. World 1952, 58, 54–57. [Google Scholar]
  31. Parkin, P.H.; Taylor, J.H. Speech reinforcement in St. Paul’s Cathedral—Details of the equipment and results of tests. Wirel. World 1952, 58, 109–111. [Google Scholar]
  32. Wikimedia Commons Contributors. File: Greek and Latin Cross—Temple of Saint Sava and St Paul’s Cathedral (St Paul’s).jpg. Wikipedia Commons, the Free Media Repository. 2021. Available online: https://commons.wikimedia.org/wiki/File:Greek_and_Latin_cross_-_Temple_of_Saint_Sava_and_St_Paul%27s_Cathedral_(St_Paul%27s).jpg (accessed on 30 January 2025).
  33. ISO-3382:1975; Acoustics—Measurement of Reverberation Time in Auditoria. ISO: Geneva, Switzerland, 1975.
  34. Schroeder, M.R. New Method of Measuring Reverberation Time. J. Acoust. Soc. Am. 1965, 37, 409–412. [Google Scholar] [CrossRef]
  35. Beranek, L.L. Acoustic Measurements; John Wiley: New York, NY, USA, 1949; p. 770. [Google Scholar]
  36. Anderson, J.; Jacobsen, T. RASTI Measurements in St. Paul’s Cathedral, London. In Proceedings of the 12th International Congress on Acoustics, Toronto, ON, Canada, 24–31 July 1986. Paper E10–2. [Google Scholar]
  37. IEC 60268-16:2020; Sound System Equipment—Part 16: Objective Rating of Speech Intelligibility by Speech Transmission Index. International Electrotechnical Commission: Switzerland, Geneva, 2020.
  38. Pantheons: Sculpture at St Paul’s Cathedral (c.1796–1916). Available online: https://pantheons-st-pauls.york.ac.uk/ (accessed on 15 April 2025).
  39. Farina, A.; Ayalon, R. Recording Concert Hall Acoustics for Posterity. In Proceedings of the 24th AES International Conference, Banff, AB, Canada, 26–28 June 2003. [Google Scholar]
  40. Murphy, D.; Shelley, S.; Foteinou, A.; Brereton, J.; Daffern, H. Acoustic Heritage and Audio Creativity: The Creative Application of Sound in the Representation, Understanding and Experience of Past Environments. Internet Archaeol. 2017, 44. [Google Scholar] [CrossRef]
  41. ISO-3382-1:2009; Acoustics—Measurement of Reverberation Time of Rooms with Reference to Other Acoustical Parameters. ISO: Geneva, Switzerland, 2009.
  42. AURORA Plug-Ins. Available online: https://www.aurora-plugins.com/ (accessed on 24 March 2022).
  43. del Solar Dorrego, F.M.; Vigeant, M.C. The just noticeable difference of early decay time (EDT). J. Acoust. Soc. Am. 2020, 148, 2772. [Google Scholar] [CrossRef]
  44. Martellotta, F. Understanding the acoustics of Papal Basilicas in Rome by means of a coupled-volumes approach. J. Sound Vib. 2016, 382, 413–427. [Google Scholar] [CrossRef]
  45. St Paul’s: Transforming Library. Available online: https://www.stpauls.co.uk/transforming-library (accessed on 10 February 2025).
  46. Wikimedia Commons Contributors. File: 20180629 43 St. Paul’s Cathedral.jpg. Wikipedia Commons, the Free Media Repository. 2018. Available online: https://commons.wikimedia.org/wiki/File:20180629_43_St._Paul%27s_Cathedral.jpg (accessed on 30 January 2025).
  47. ODEON. User Manual, Version 13.0; ODEON A/S: Lyngby, Denmark, 2016. [Google Scholar]
  48. Nowoświat, A. Impact of Temperature and Relative Humidity on Reverberation Time in a Reverberation Room. Buildings 2022, 12, 1282. [Google Scholar] [CrossRef]
  49. Benedetto, G.; Spagnolo, R. A method for correcting the reverberation times of enclosures as a function of humidity and temperature. Appl. Acoust. 1983, 16, 463–470. [Google Scholar] [CrossRef]
  50. Open AIR. Available online: https://www.openair.hosted.york.ac.uk/?page_id=1167 (accessed on 20 May 2025).
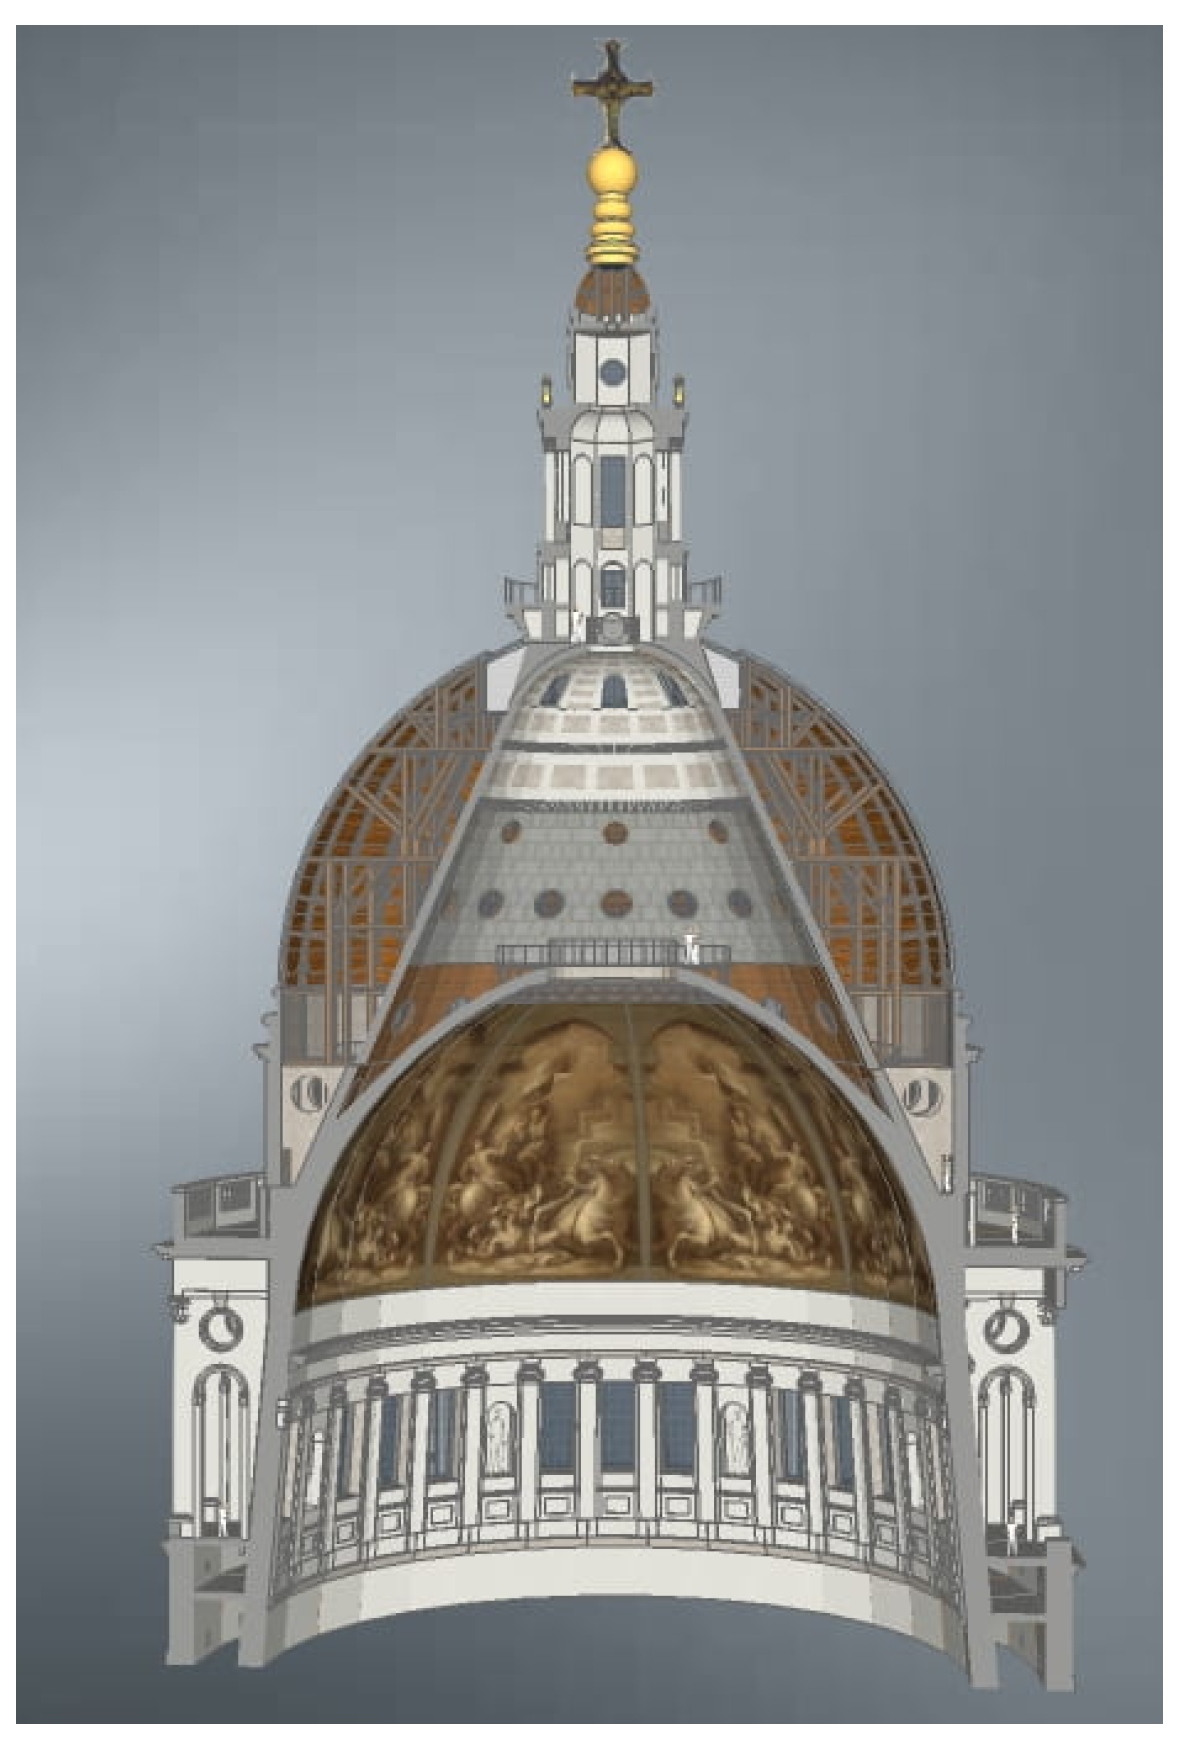
Figure 1. Cross section of the three parts of the dome: interior dome of brick; middle-inner cone of brick; wooden outer dome covered in lead on the exterior. This was created in a 3D virtual model from [5], reproduced with permission.
Acoustics 07 00049 g001
Figure 2. Speech intelligibility measurement positions in St Paul’s Cathedral from Parkin and Taylor’s 1952 study, showing the positions of the loudspeakers (in blue) and listening positions (in red) used. A and B are the positions of the loudspeaker array at the pulpit and the lectern respectively. This figure is a representation of the corresponding figure in [30], adapted file from Wikimedia Commons under the CC BY-SA 4.0 licence [32].
Acoustics 07 00049 g002
Figure 3. Reverberation time measurements for the nave (Empty and Full) of St Paul’s, as obtained from Parkin and Taylor’s work in 1952. The values presented here are based on the numerical data presented in relevant charts in [30].
Acoustics 07 00049 g003
Figure 4. Reverberation time measurement positions for the empty nave of St Paul’s, as carried out and presented by Lewers and Anderson in [2] in 1984. The numerical values represent the various microphone receiver positions used (in red), with the sound source being placed at position A (in blue).
Acoustics 07 00049 g004
Figure 5. Reverberation time measurements for the nave (empty and full) of St Paul’s, as obtained by Lewers and Anderson in 1984. The values presented here are based on the numerical data presented in relevant charts in [2].
Acoustics 07 00049 g005
Figure 6. Floor plan of the ground floor of St Paul’s Cathedral showing the measurement configurations. Adapted file from Wikimedia Commons under the CC BY-SA 4.0 licence [32]. In blue characters, the DsNr configuration is represented; in green the NsDr configuration; in orange the DsDr configuration under the dome; and finally in purple the CsCr configuration in the choir area. The green highlighted area at the south-west shows the location of the Geometric Staircase and the red highlighted area shows the location of the Library at Triforium Level and above the nave.
Acoustics 07 00049 g006
Figure 7. T 30 (s) and E D T (s) results for the four source–receiver configurations obtained from the Cathedral floor. T 30 is represented with solid line plots and E D T with dashed lines. In blue, the DsNr configuration is represented; in green the NsDr configuration; in orange the DsDr configuration under the dome; and finally in purple the CsCr configuration in the choir area.
Acoustics 07 00049 g007
Figure 8. Results for the four source–receiver configurations obtained from the Cathedral floor for (a) T s , (b) D 50 , (c) C 80 and (d) J L F .
Acoustics 07 00049 g008
Figure 9. The energy curve from DsNr configuration is shown as a linear regression line (a). The energy curve from CsCr configuration (shown in (b)) is not linear and two-stage structure of the sound decay are presented in dotted lines.
Acoustics 07 00049 g009
Figure 10. Floor plan of the Whispering Gallery of St Paul’s Cathedral showing the source (S) and receiver (R) positions used for the measurements. Adapted file from Wikimedia Commons under the CC BY-SA 4.0 licence [32].
Acoustics 07 00049 g010
Figure 11. T 30 (s) and E D T (s) results for two source–receiver configurations at the Whispering Gallery: ‘Away’ for when the source is oriented away from the receiver to be parallel to the wall; ‘Towards’ for when the source is oriented to directly face towards the receiver.
Acoustics 07 00049 g011
Figure 12. Results for (a) T s , (b) D 50 , (c) C 80 and (d) J L F for two source–receiver configurations at the Whispering Gallery; ‘Away’ for when the source is oriented away from the receiver to be parallel to the wall; ‘Towards’ for when the source is oriented to directly face towards the receiver.
Acoustics 07 00049 g012
Figure 13. Time domain impulse responses for two source–receiver configurations at the Whispering Gallery: (a) ‘Away’ for when the source is oriented away from the receiver to be parallel to the wall, with highlighted strong peaks to indicate reflection arriving from the opposite site (in red) and "whispering gallery" effect (in green); (b) ‘Towards’ for when the source is oriented to directly face towards the receiver.
Acoustics 07 00049 g013
Figure 14. Frequency spectrum of the impulse responses obtained from the two source–receiver configurations at the Whispering Gallery (FFT size = 4096 samples): ‘Away’ in blue for when the source is oriented away from the receiver to be parallel to the wall; ‘Towards’ in green for when the source is oriented to directly face towards the receiver.
Acoustics 07 00049 g014
Figure 15. T 30 (s) and E D T (s) obtained from the impulse response measured within the Triforium Level Library.
Acoustics 07 00049 g015
Figure 16. Results for (a) T s , (b) D 50 , (c) C 80 and (d) J L F obtained from the impulse response measured within the Triforium Level Library.
Acoustics 07 00049 g016
Figure 17. Frequency spectrum of the impulse response obtained within the Triforium Level Library (FFT size = 4096 samples).
Acoustics 07 00049 g017
Figure 18. The Geometric (or Dean’s) Staircase in St Paul’s Cathedral, photo by davidwilson1949. Licence: CC BY 2.0 via Wikimedia Commonsfile from Wikimedia Commons under the CC BY 2.0 licence [46].
Acoustics 07 00049 g018
Figure 19. T 30 (s) and E D T (s) obtained from the impulse response measured in the Geometric Staircase.
Acoustics 07 00049 g019
Figure 20. Results for (a) T s , (b) D 50 , (c) C 80 and (d) J L F obtained from the impulse response measured in the Geometric Staircase.
Acoustics 07 00049 g020
Table 1. Results obtained from [31] converted to objective STI values averaging the results from the two speaker locations across the 6 measurement positions, without and with the reinforecement system in operation.
Measurement PositionWithout DelayWith Delay
Average PB–ScoreSTI ValuesAverage PB–ScoreSTI Values
1920.45–0.60 (Fair)990.75–1 (Excellent)
2930.60–0.75 (Good)950.75–1 (Excellent)
3890.60–0.75 (Good)920.60–0.75 (Good)
4850.45–0.60 (Fair)930.60–0.75 (Good)
561<0.30 (Bad)850.45–0.60 (Fair)
652<0.30 (Bad)850.45–0.60 (Fair)
Table 2. Results obtained at [2] converted to objective STI values averaging the results from the two speaker locations across the 6 measurement positions, without and with the reinforcement system in operation.
Measurement PositionWithout DelayWith Delay
Average PB–ScoreSTI ValuesAverage PB–ScoreSTI Values
1860.45–0.60 (Fair)680.30–0.45 (Poor)
258<0.30 (Bad)54<0.30 (Bad)
350<0.30 (Bad)43<0.30 (Bad)
444<0.30 (Bad)880.45–0.60 (Fair)
526<0.30 (Bad)680.30–0.45 (Poor)
630<0.30 (Bad)730.30–0.45 (Poor)
Table 3. STI results obtained at the different measurement positions in 2022 and compared with corresponding previous measurements.
Latest Measured PositionsSTI Values in 2022Comparable Historical PositionsSTI Values in 1952STI Values in 1984 and 1985
Cathedral Floor (DsNr)0.36 (Poor)2–3GoodBad
Cathedral Floor (NsDr)0.35 (Poor)2–3GoodBad
Cathedral Floor (DsDr)0.55 (Fair)5–6BadBad
Cathedral Floor (CsCr)0.57 (Fair)
Whispering Gallery (Away)0.52 (Fair)
Whispering Gallery (Towards)0.72 (Good)
Library0.57 (Fair)
Geometric Staircase0.61 (Good)
Table 4. Reverberation times obtained from tests carried out in 1952 [30], 1984 [2] (Method 1, Source A—Receiver 2), 1985 (based on the numerical data presented in [36], Source A—Position about 10 m north from Receiver 3) and 2022 (Configuration DsNr) for measurement positions with a source located below the dome and receiver in the nave of the empty cathedral.
RT63 Hz125 Hz250 Hz500 Hz1 kHz2 kHz4 kHz8 kHz
195211.511.51211.5107.552.5
198411.410.711.411.29.87.13.81.4
198513.510.511.510.810.06.53.01.2
2022-8.910.510.79.37.24.42.4
Disclaimer/Publisher’s Note: The statements, opinions and data contained in all publications are solely those of the individual author(s) and contributor(s) and not of MDPI and/or the editor(s). MDPI and/or the editor(s) disclaim responsibility for any injury to people or property resulting from any ideas, methods, instructions or products referred to in the content.